Vision Transformer Neural Architecture Search for Out-of-Distribution Generalization:
Benchmark and Insights
Abstract
While Vision Transformer (ViT) have achieved success across various machine learning tasks, deploying them in real-world scenarios faces a critical challenge: generalizing under Out-of-Distribution (OoD) shifts. A crucial research gap remains in understanding how to design ViT architectures – both manually and automatically – to excel in OoD generalization. To address this gap, we introduce OoD-ViT-NAS, the first systematic benchmark for ViT Neural Architecture Search (NAS) focused on OoD generalization. This comprehensive benchmark includes ViT architectures of varying model computational budgets evaluated on common large-scale OoD datasets. With this comprehensive benchmark at hand, we analyze the factors that contribute to the OoD generalization of ViT architecture. Our analysis uncovers several key insights. Firstly, we show that ViT architecture designs have a considerable impact on OoD generalization. Secondly, we observe that In-Distribution (ID) accuracy might not be a very good indicator of OoD accuracy. This underscores the risk that ViT architectures optimized for ID accuracy might not perform well under OoD shifts. Thirdly, we conduct the first study to explore NAS for ViT’s OoD robustness. Specifically, we study Training-free NAS for their OoD generalization performance on our benchmark. We observe that existing Training-free NAS are largely ineffective in predicting OoD accuracy despite their effectiveness at predicting ID accuracy. Moreover, simple proxies like #Param or #Flop surprisingly outperform more complex Training-free NAS in predicting ViTs OoD accuracy. Finally, we study how ViT architectural attributes impact OoD generalization. We discover that increasing embedding dimensions of a ViT architecture generally can improve the OoD generalization. We show that ViT architectures in our benchmark exhibit a wide range of OoD accuracy, with up to for some OoD shift, prompting the importance to study ViT architecture design for OoD. We firmly believe that our OoD-ViT-NAS benchmark and our analysis can catalyze and streamline important research on understanding how ViT architecture designs influence OoD generalization. Our OoD-NAS-ViT benchmark and code are available at https://hosytuyen.github.io/projects/OoD-ViT-NAS
1 Introduction
Vision Transformers (ViT) [1] have recently achieved impressive results and become a major area of research in computer vision, with significant efforts towards understanding how ViT works. These efforts have led to the proposal of both manually designed architectures [1, 2, 3, 4, 5] or automated-searched architectures [6, 7, 8, 9, 10, 11, 12] to advance ViT architectures.
Research Gap. Existing research on ViT architectures focuses on maximizing In-Distribution (ID) accuracy, while studies on the impact of ViT architectures on Out-of-Distribution (OoD) generalization are limited. Initial works [13], [14], and [15] evaluate sets of , and human-designed ViT architectures under OoD settings, respectively, and provide coarse insights into which models exhibit better OoD generalization. However, with very limited ViT architectures studied in previous works, the influence of ViT structural attributes (e.g., embedding dimension, number of heads, MLP ratio, number of layers) on OoD generalization remains unclear. Besides, in the context of ViT Neural Architecture Search (NAS), while there are various ViT NAS for ID accuracy [6, 7, 16, 8, 10, 11, 17, 18, 19, 20, 9], there is no study on ViT NAS for OoD generalization.
In this paper, we address existing research gaps by introducing OoD-ViT-NAS, the first comprehensive benchmark specifically designed for ViT’s OoD generalization. Building NAS benchmarks is notoriously time-consuming and expensive due to the need to train and evaluate every candidate architecture. This challenge is particularly acute for ViT, known for its high computational demands and memory usage [21, 22, 23]. To overcome this bottleneck, we propose leveraging One-Shot NAS, specifically AutoFormer [6], a widely used ViT search space.We sample a diverse set of sub-architectures (models) to populate our benchmark. Importantly, these subnets inherit the weights from the pre-trained supernets, and their performance has been shown to be comparable to, or even superior to, that of architectures trained alone [20, 6] This approach enables us to efficiently acquire a large pool of ViT architectures for OoD generalization analysis. Using OoD-ViT-NAS, we conduct extensive OoD generalization analysis and gain several key insights. Additionally, with our benchmark, our work is the first to explore (training-free) NAS for ViT’s OoD generalization. Our contributions are summarized below:
-
•
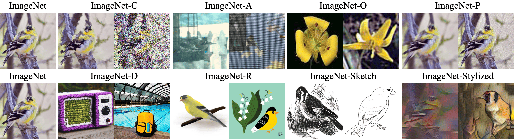
We introduce OoD-ViT-NAS, the first comprehensive benchmark designed for NAS research on ViT’s OOD generalization. This benchmark includes diverse ViT architectures sampled from the widely used ViT search space [6]. These architectures span a wide range of computational budgets. To thoroughly benchmark OoD generalization, these architectures are evaluated on the most common and state-of-the-art (SOTA) OoD datasets: ImageNet-C [24], ImageNet-A [25], ImageNet-O [25], ImageNet-P [24], ImageNet-D [26], ImageNet-R [27], ImageNet-Sketch [28], and Stylized ImageNet [29] (Sec. 3)
-
•
Our analysis demonstrates the significant influence of ViT architectural designs on OoD accuracy. This observation encourages future research to focus more on ViT architecture research for OoD generalization (Sec. 4.1)
-
•
We show that high In-Distribution (ID) accuracy is not a very good indicator of OoD accuracy. This suggests that current architectural insights based on ID accuracy might not translate well to OoD generalization (Sec. 4.2)
-
•
We conduct the first study to explore NAS for ViT’s OoD generalization. We study Training-free NAS for their OOD generalization performance on our benchmark. We observe that despite their prediction accuracy for ID, their effectiveness significantly weakens when predicting OoD accuracy. Furthermore, simple proxies such as the number of parameters (#Param) or the number of floating point operations (#Flop) surprisingly outperform more complex Training-free NAS in predicting ViTs OoD accuracy (Sec. 4.3)
-
•
We study the impact of ViT architecture design on OoD generalization and demonstrate that careful design of ViT architectures can significantly improve OoD generalization. Specifically, increasing the embedding dimensions of a ViT architecture generally can improve its OoD generalization. (Sec. 4.4) We show that architectures with comparable ID accuracy (within an averaging range of ) exhibit a wider range of OoD accuracy, averaging and reaching highs of , being comparable or even outperforming state-of-the-art (SOTA) training OoD generalization method, such as those based on domain invariant representation learning [30, 31]. For example, under the same OoD setting, the SOTA method [30] shows an improvement of OoD accuracy.
2 Related Work
Out-of-Distribution (OoD) Generalization. Addressing Out-of-distribution (OoD) generalization is a challenge, particularly in computer vision. Various approaches have been proposed to tackle this issue. A common strategy focuses on learning features that remain consistent across different domains, thereby promoting generalizability [31, 32, 33, 34, 35, 36, 37]. Other directions explore distributional robustness [38, 39], model ensembles [40, 41], test-time adaptation [42, 43], data augmentation techniques [44, 45, 46, 47, 48, 49, 50], and meta learning [51, 52] for OoD generalization. From an architectural perspective, a few attempts investigate the impact of network architecture on OoD generalization. Early work [53] shows that over-parameterized networks can hinder OoD performance due to overfitting. This raises an intriguing question: can sub-networks within such architectures achieve better OoD performance? Inspired by the Lottery Ticket Hypothesis (LTH) [54], the Functional LTH has been explored and shown that over-parameterized networks harbor sub-networks with better OoD performance. Techniques like Modular Risk Minimization [55] and Debiased Contrastive Weight Pruning [56] aim to identify these winning tickets. Another direction [57, 14] leverages Neural Architecture Search (NAS) to analyze the OoD robust architectures. However, these studies primarily focus on CNNs. While ViTs have achieved success in various visual recognition, investigations into their OoD generalization are limited. Initial works [13], [14], and [15] evaluate sets of , , and human-designed ViT architectures respectively, under OoD settings. Their results provide coarse insights into which models exhibit better OoD performance. However, the influence of ViT architectural attributes on OoD robustness remains unclear.
Neural Architecture Search (NAS). NAS is a promising approach that has achieved remarkable success in automatically searching efficient and effective architectures for ID performance [58, 20, 59, 60]. Recently, NAS has been explored in the context of adversarial robustness for CNNs as well [61, 62, 63]. With the rise of Vision Transformers (ViTs), several NAS approaches have been applied to improve ViT architectures, including Autoformer [6], S3 [16], ViTAS [8], ElasticViT [9], DSS [10], Auto-Prox [17] and GLiT [64]. Additionally, hybrid CNN-ViT architectures like HR-NAS [18], UniNet [19], and NASViT [12] have also been explored. These efforts have shown promising results in terms of ID accuracy. However, there has not been any work on NAS for ViT architectures specifically for OoD generalization.
3 OoD-ViT-NAS: NAS Benchmark for ViT’s OoD Generalization
In this section, we describe the construction of our OoD-ViT-NAS benchmark with details on the search spaces, datasets, evaluation metrics, and protocol. Our comprehensive benchmark includes ViT architectures of varying sizes evaluated on widely used large-scale, high-resolution, and SOTA OoD datasets. Our OoD-ViT-NAS benchmark is summarized in the Tab. 1
Search Space. We construct our benchmark based on Autoformer [6] search space. This search space is currently a widely used search space in the ViT NAS community for ID data [7, 65, 60, 10, 11, 17, 66, 67]. Autoformer search space is a large vision transformer search space including five architectural attributes that define the building block. Embedding Dimension: This determines the input feature representation size and is typically consistent across layers in ViT architectures. Q-K-V Dimension: This specifies the size of the query, key, and value vectors used in the attention mechanism. Number of Heads: This defines the number of parallel attention computations performed within a single attention block. MLP Ratio: This controls the dimensionality of the feed-forward network within each transformer block. Unlike embedding dimension, in Autoformer search space, Q-K-V Dimension, Number of Heads, and MLP Ratio can be varied across layers. Network Depth: This refers to the total number of transformer layers stacked in the architecture. It is important to note that Autoformer maintains a fixed ratio between the Q-K-V dimension and the number of heads in each block. This ensures that the scaling factor in the attention calculation remains constant. This helps stabilize the gradients of different heads during the training [6]. We strictly follow Autoformer search space. The details can be found in the Appx. 10.1.
Search Space Dataset #Classes #Images #OoD Shifts OoD Shift Type Metrics Autoformer-Tiny [6]/ Autoformer-Small [6]/ Autoformer-Base [6] ImageNet-1K (IN-1K) [68] 1K 50K - - - ImageNet-C (IN-C) [24] 1K 3.75M 15 Algorithmic ID Acc/ OoD Acc ImageNet-P (IN-P) [24] 1K 1M 9 ImageNet-D (IN-D) [26] 113 4.8K 3 Stylized ImageNet (Stylized IN) [29] 1K 50K 1 ImageNet-R (IN-R) [27] 200 30K 1 Natural ImageNet-Sketch (IN-Sketch) [28] 1K 50K 1 ImageNet-A (IN-A) [25] 200 7.5K 1 ImageNet-O (IN-O) [25] 200 2K 1 ID Acc/ AUPR
Dataset. Our benchmark consists of the evaluation on large-scale, high-resolution, and most SOTA OoD datasets, including ImageNet-1k [68], ImageNet-C [24], ImageNet-P [24], ImageNet-A [25], ImageNet-O [25], ImageNet-R [27], ImageNet-Sketch [28], Stylized ImageNet [29], and ImageNet-D [26]. These datasets capture a comprehensive range of OoD shifts such as common corruptions (blur, noise, digital, weather), Stable-Diffusion-based OoD shifts, and natural OoD shifts. A detailed description of these datasets can be found in the Appx. 10.2.
Metrics. Following the previous OoD generalization methods [57, 30, 31, 15], we employ three metrics to construct our benchmark:
-
•
ID Classification Accuracy (ID Acc): This metric measures the model performance on In-Distribution (ID) data, typically the data it was trained on (e.g., ImageNet). A higher ID Acc indicates the model’s ability to learn training data’s distribution.
-
•
OoD Classification Accuracy (OoD Acc): This metric measures the model performance on Out-of-Distribution (OoD) data, which could differ significantly from the training data. A higher OoD Acc indicates a better generalization of the model to handle the OoD shifts.
-
•
For the specific case of ImageNet-O, [24], we use the Area Under the Precision-Recall Curve (AUPR) metric. A higher AUPR indicates a better generalization of the model to handle the OoD detection.
Protocol. Neural Architecture Search (NAS) is notorious for its computationally expensive nature, requiring the training and evaluation of numerous candidate architectures. To address this challenge and efficiently obtain the large number of architectures needed for our benchmark (i.e., ), we make use of the One-Shot NAS approach [58, 20, 59, 12, 6, 7].
In One-shot NAS, a single supernet is first constructed. This supernet contains all possible architectures within the defined search space and is trained only once. Then, during evaluation, various architectures (i.e., subnets) can be efficiently extracted from the supernet. Importantly, these subnets inherit the weights from the pre-trained supernet, and their performance has been shown to be comparable or even superior to that of architectures trained alone [20, 6].
To support a wide range of model sizes, we leverage three supernets: Autoformer-Tiny/Small/Base, which were previously proposed for ID accuracy [6]. We randomly sample architectures from each supernet, resulting in a total of architectures in our OoD-ViT-NAS benchmark. Once obtained, these architectures are evaluated on 8 aforementioned OoD datasets.
4 Investigation on Out-of-Distribution Generalization of ViT
In this section, we provide the first comprehensive investigation of how ViT architectures affect OoD generalization using our OoD-ViT-NAS benchmark. In Sec. 4.1, we first demonstrate that ViT architectures considerably impact OoD accuracy. In Sec. 4.2, while existing works [2, 3, 6, 7, 8, 9, 12, 18] have made significant strides in improving ViT’s ID accuracy, their findings could not be applicable for ViT’s OoD generalization due to the not very high correlation between ViT’s ID and OoD accuracy. In Sec. 4.3, we conduct the first study to explore NAS for ViT’s OoD generalization. Specifically, we study Training-free NAS based on their OoD generalization performance on our benchmark. Finally, in Sec. 4.4, we analyze the influence of individual ViT architectural attributes (i.e., embedding dimension, number of heads, MLP ratio, number of layers) on OoD generalization. Additional results of these analysis can be found in Appx. 12, 13, 14, 15, 17
4.1 ViT architecture designs have a considerable impact on OoD generalization
In this section, we highlight that ViT architectures considerably impact OoD accuracy. This observation encourages future research to put more focus on ViT architecture research for OoD generalization.
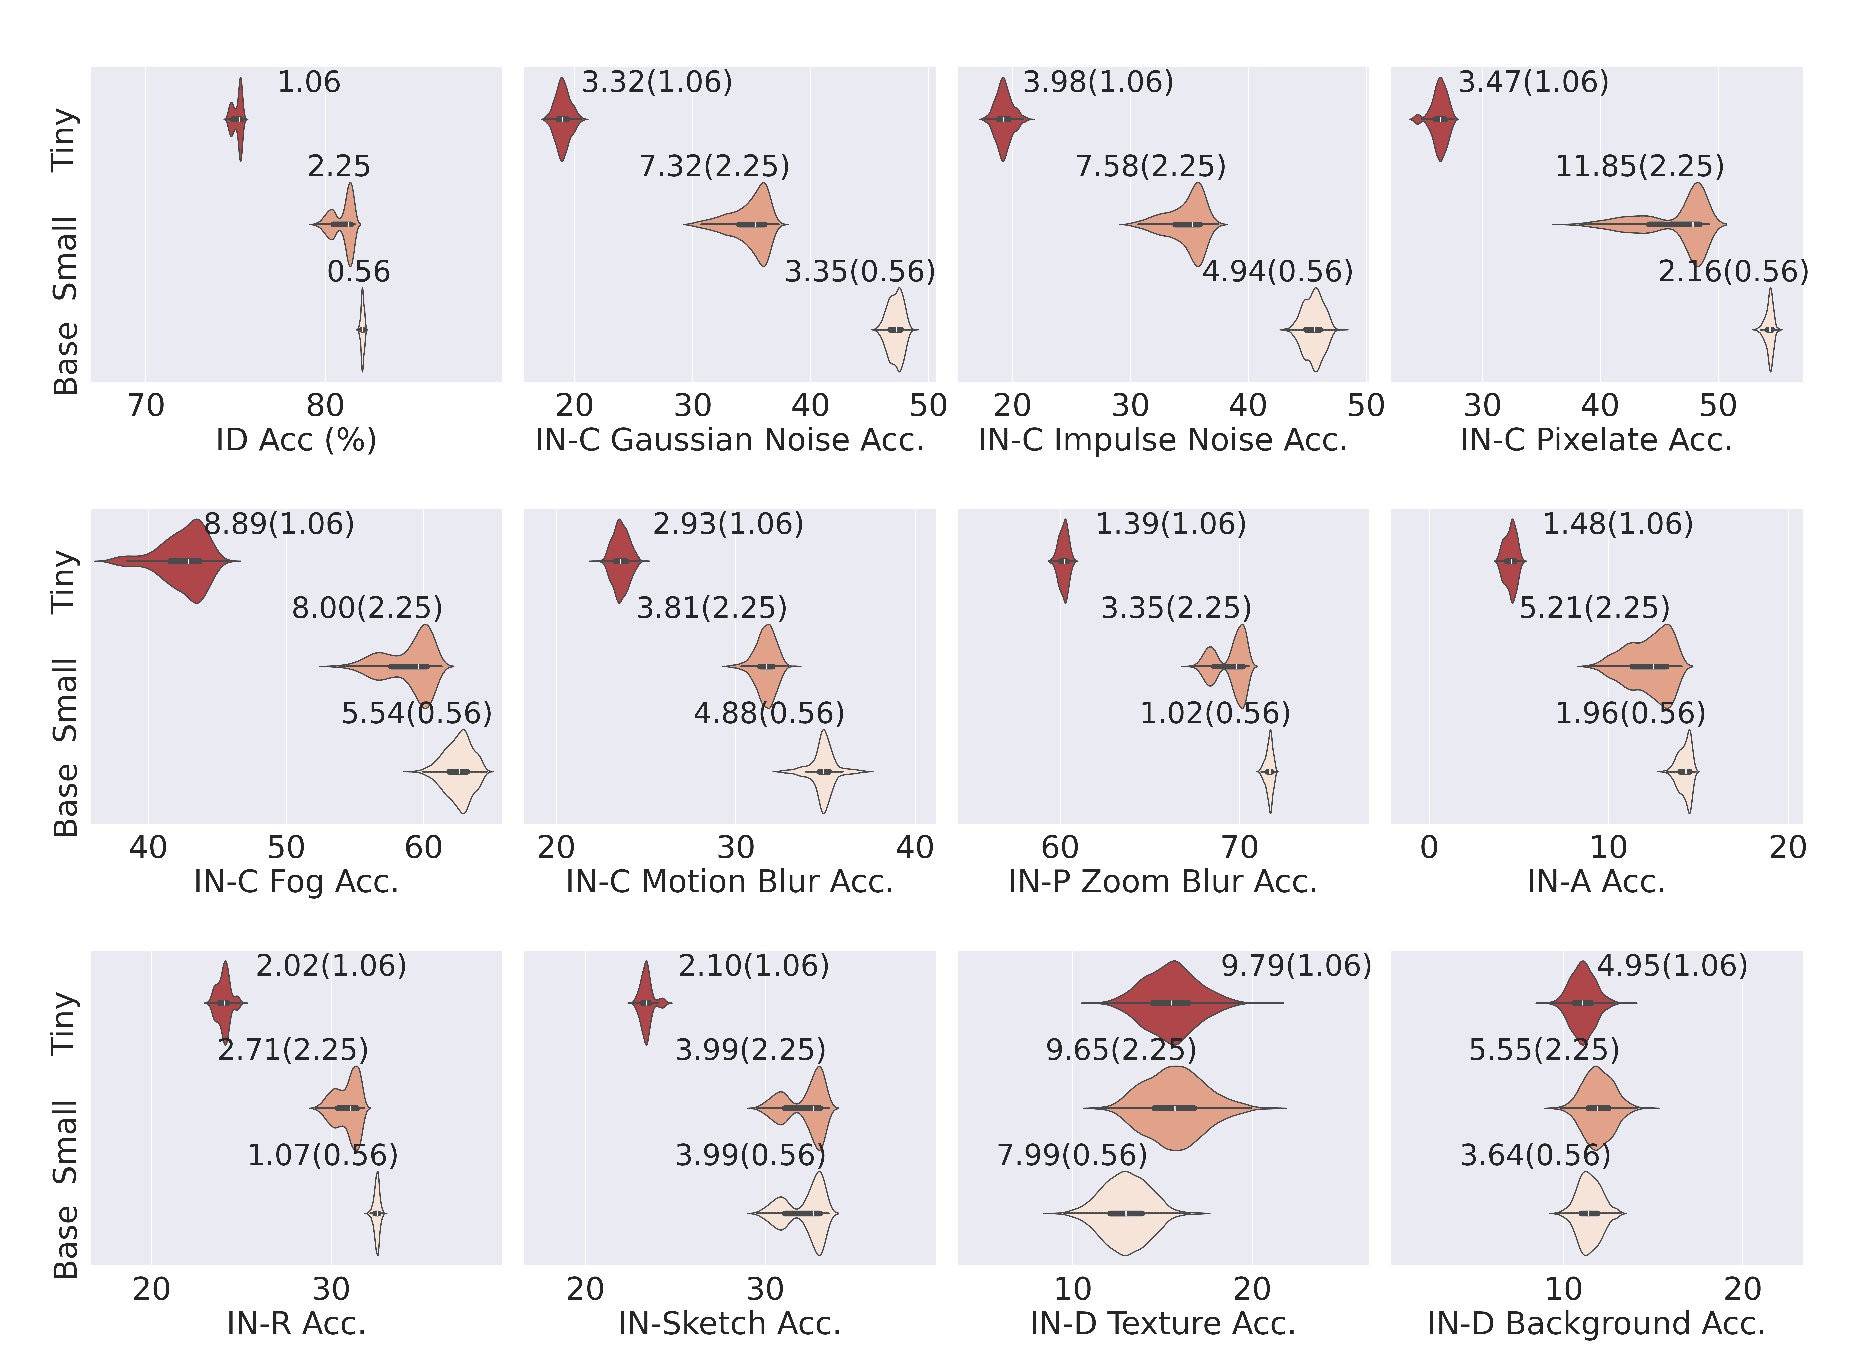
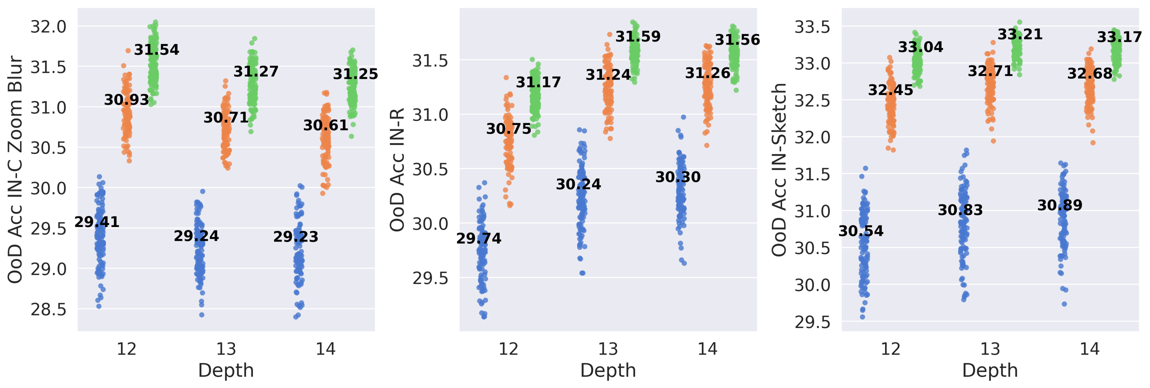
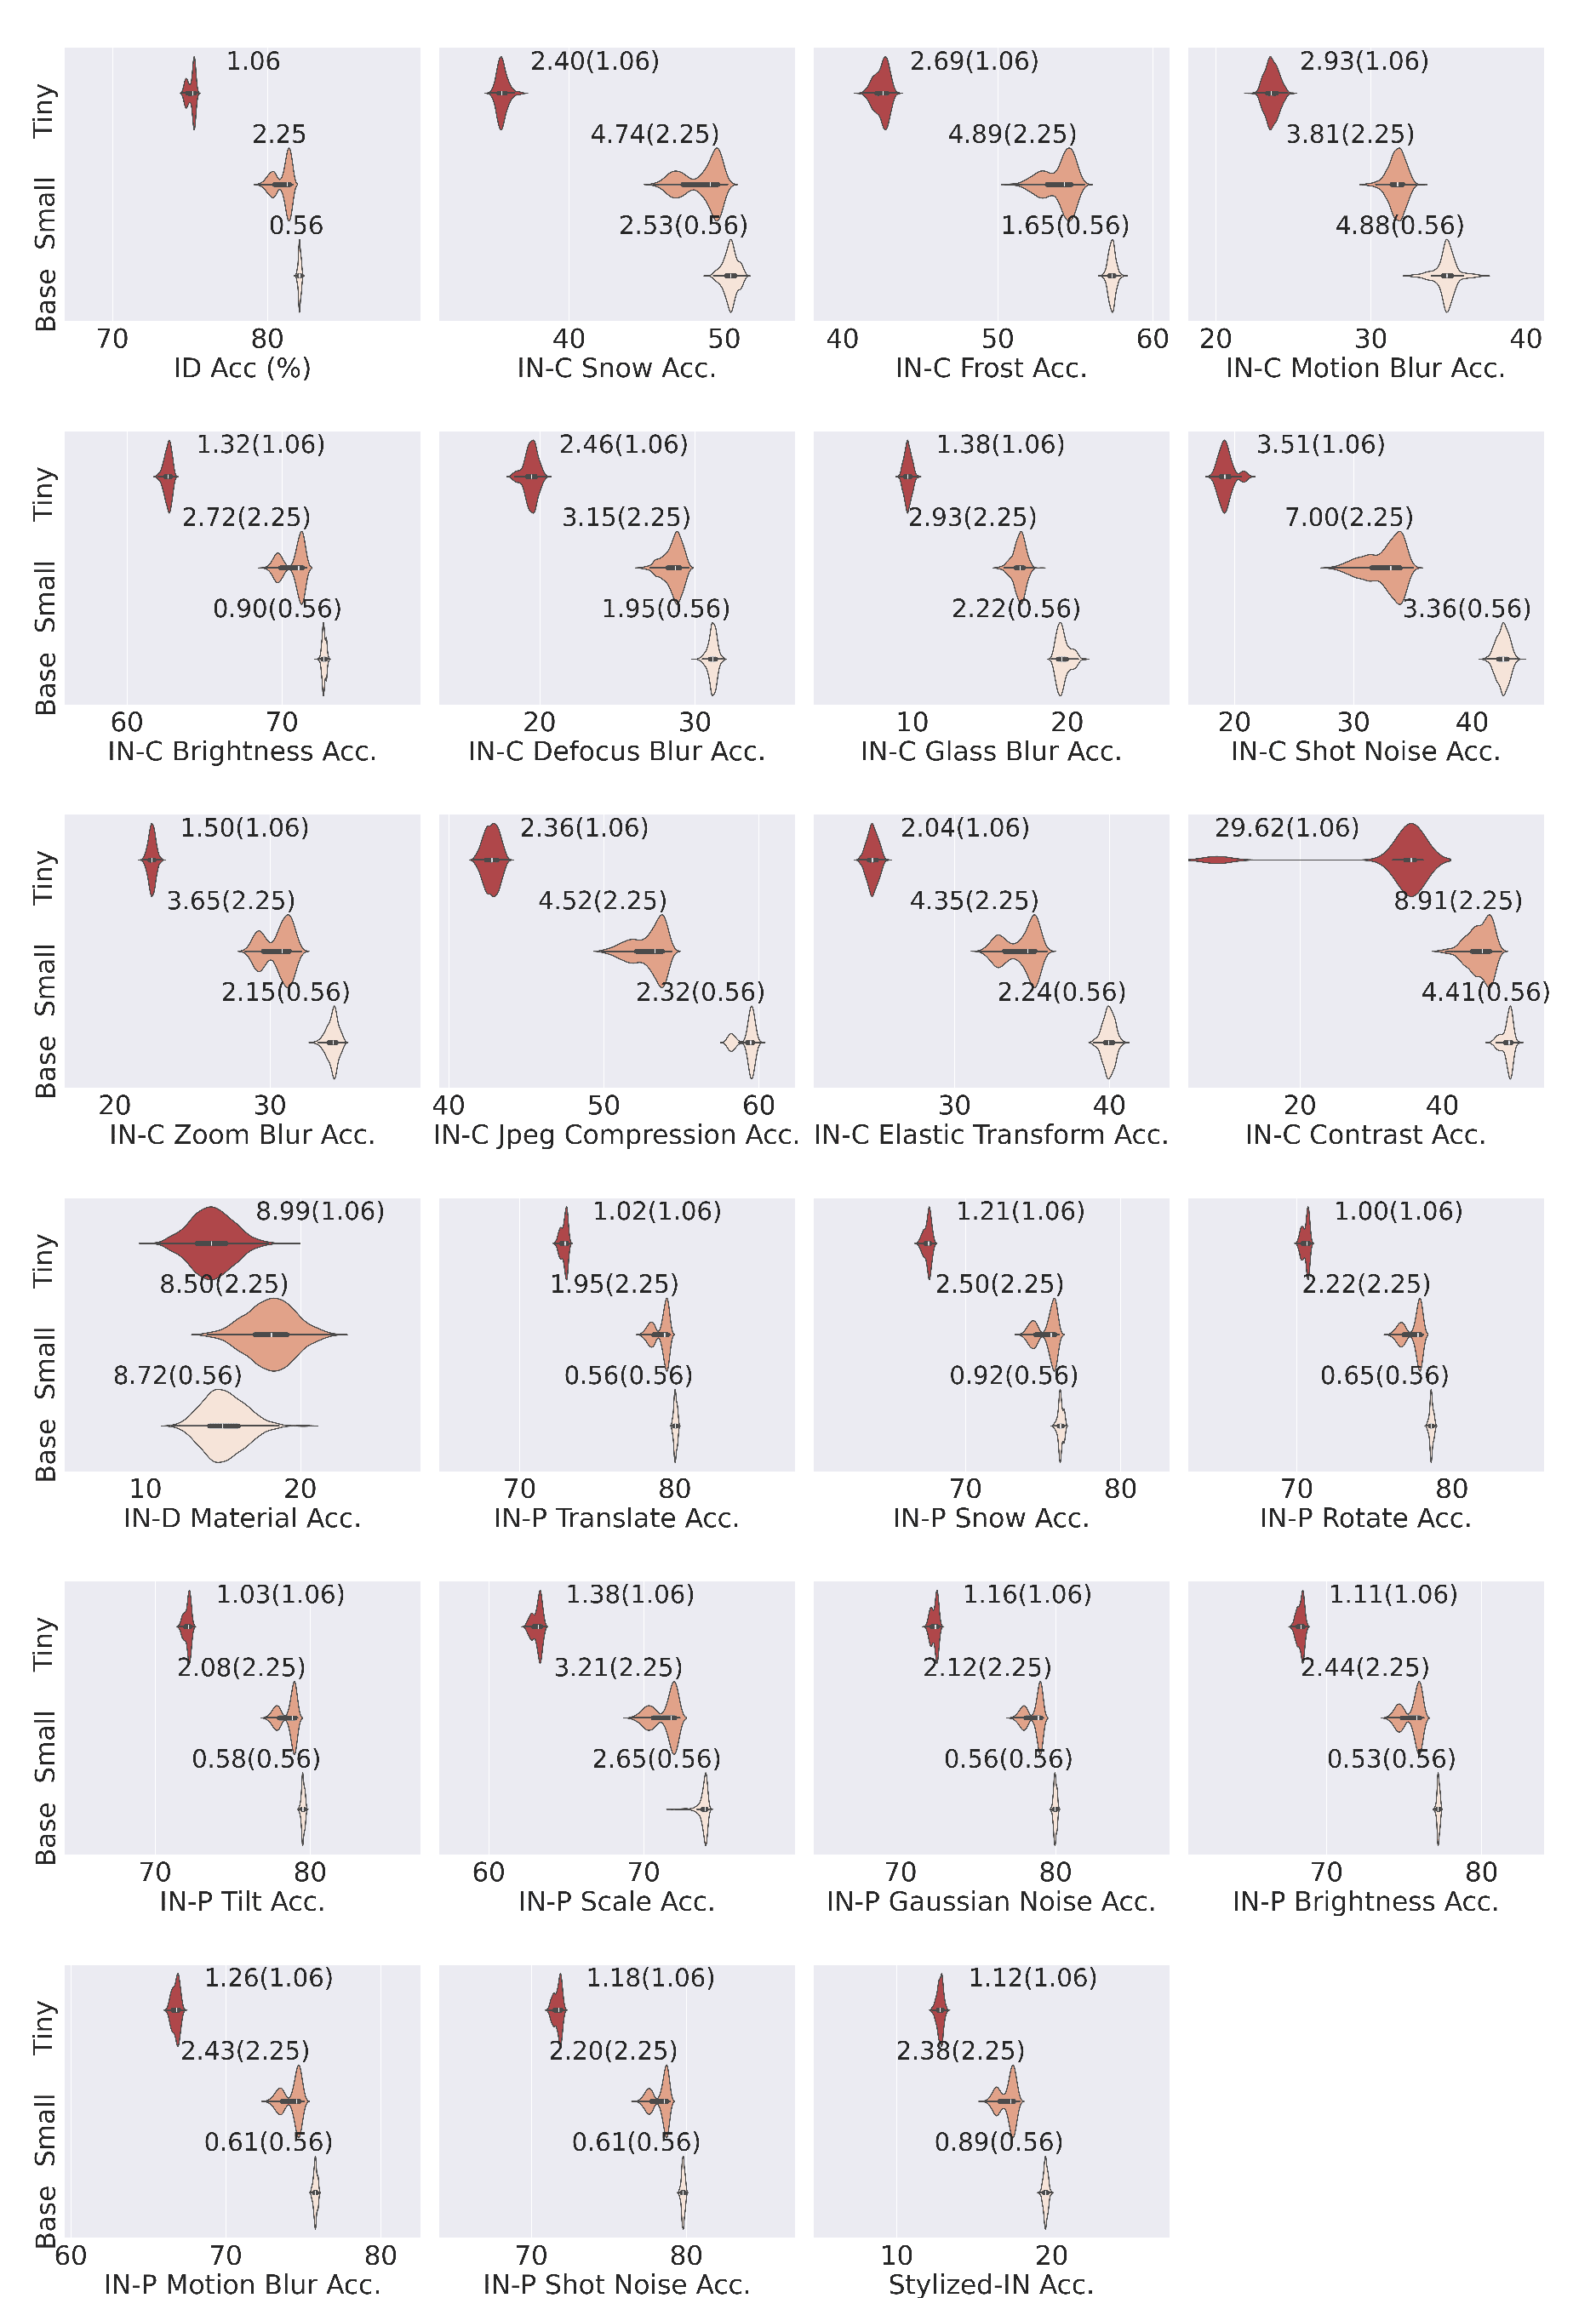
Experimental Setups. To show how ViT architecture designs impact OoD generalization, we compute the range of OoD accuracy for each search space on an OoD dataset. This range reflects the variation in OoD performance for different architectures within a search space. For example, in Fig. 2, each sub-plot represents the range of OoD accuracy for three different search spaces in our OoD-ViT-NAS benchmark on one OoD dataset. We compute the average OoD accuracy range across all datasets as general statistics. For reference, the range of ID accuracy is also included.
Results. The results are shown in Fig. 2. Additional results can be found in the Appx.12. The average range of OoD accuracy across the three search spaces in our benchmark is //, which is comparable to or even outperforming state-of-the-art (SOTA) training OoD generalization method, such as those based on domain invariant representation learning [30, 31]. For example, under a similar OoD setting, the current SOTA [30] shows an improvement of OoD accuracy. This observation highlights the significant influence of ViT architectural designs on OoD accuracy. By carefully designing ViT architecture, the OoD accuracy could improve significantly.
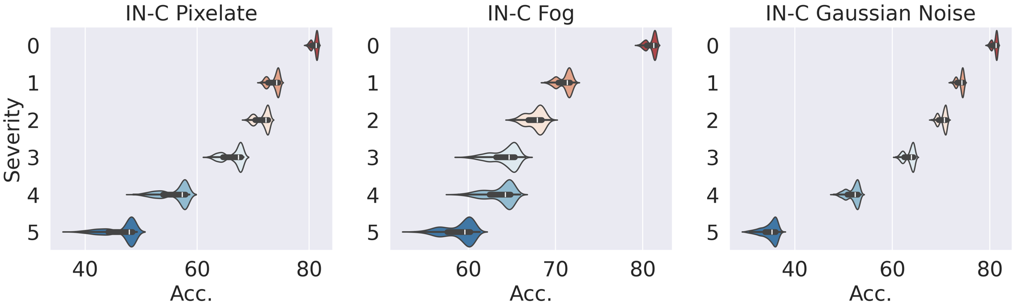
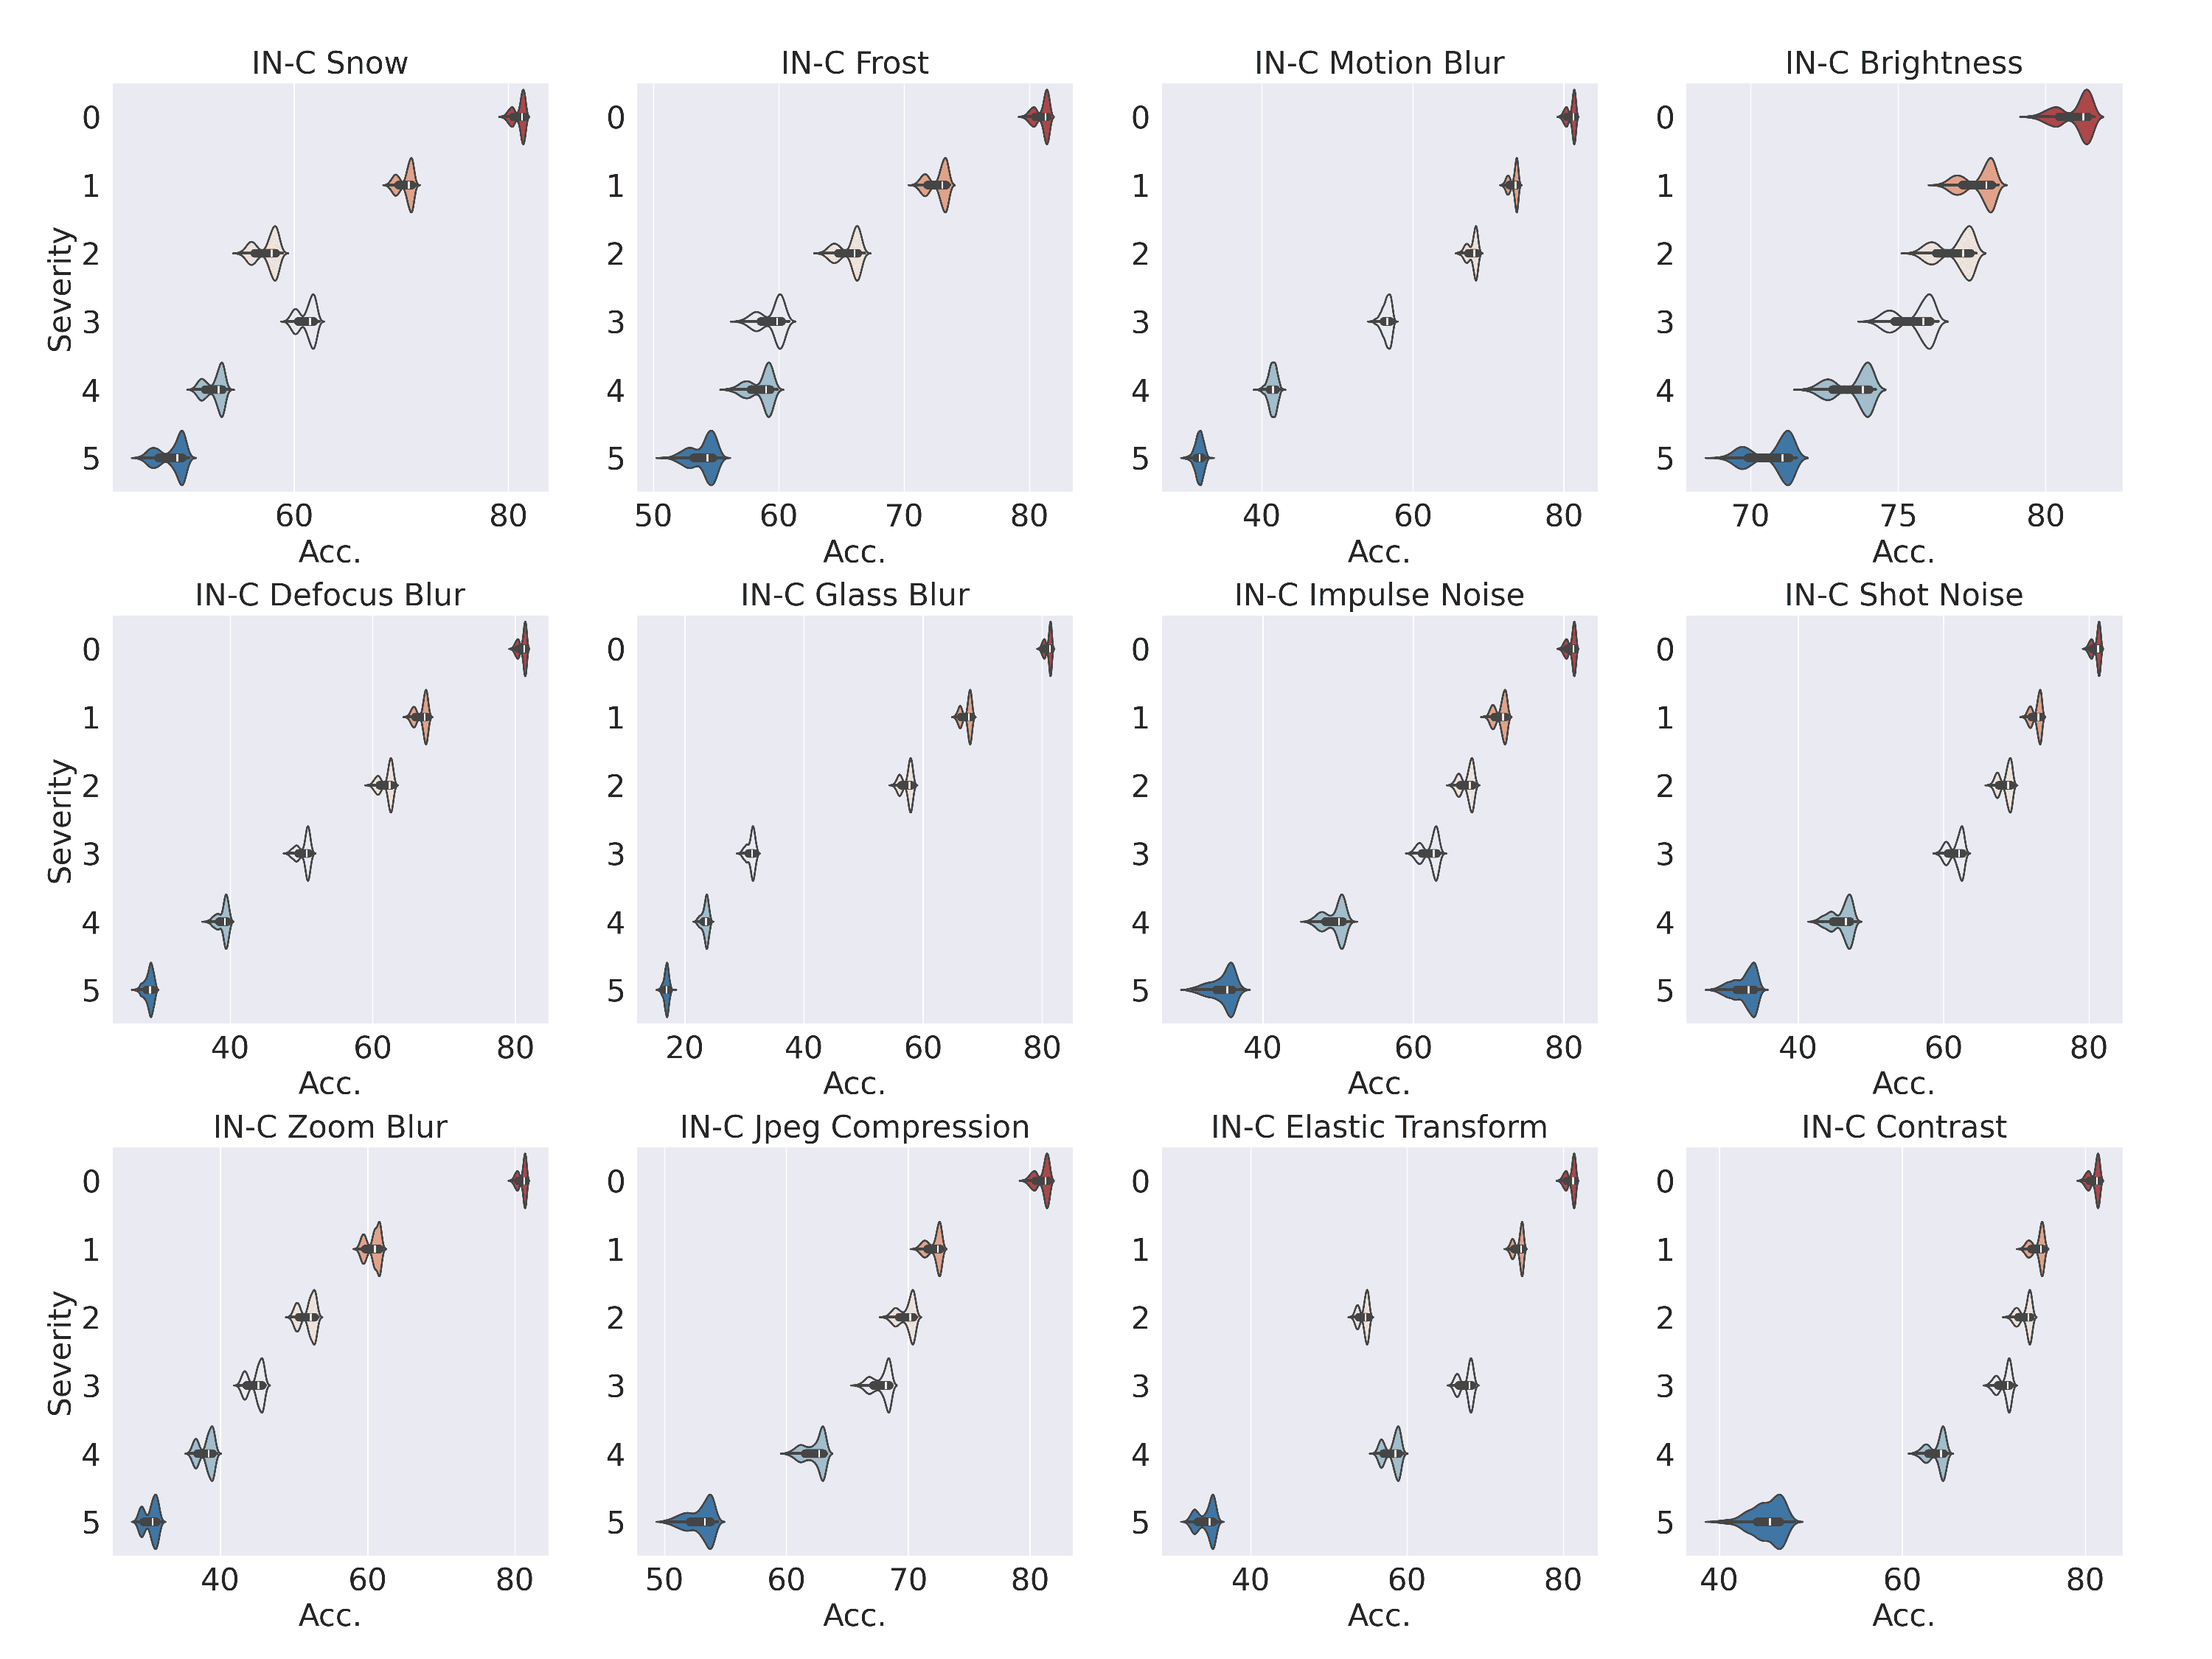
We further explore how the severity of the OoD shift affects the range of ViT’s OoD accuracy. We conduct similar experimental setups as before, analyzing architectures from the Autoformer-Small search space within our OoD-ViT-NAS benchmark for architectures in Autoformer-Small search space within our benchmark on IN-C. The results are visualized in Fig. 3. We observe that the range of OoD accuracy widens as the severity of the OoD shift increases. This suggests that under stronger OoD shifts, the architecture design becomes even more critical for OoD generalization.
When visualizing OoD accuracy, we observe a bimodal distribution. We figure out that the embedding dimension, as the primary ViT structural attribute, influences this bimodality. For example, among architectures from the Autoformer-Small search space of our benchmark, most architectures with a lower embedding dimension () fall within the lower OoD accuracy mode, while those with higher dimensions ( and ) tend to reside in the higher accuracy mode. This observation will be further discussed in detail in Sec. 4.4.
4.2 Can ID accuracy serve as a good indication for OoD accuracy?
While existing works [2, 3, 6, 7, 8, 9, 12, 18] study the impact of ViT architectures to ID accuracy, studies on OoD accuracy are limited. To what extent can we directly apply existing findings of ViT architecture insights for ID to OoD accuracy? To answer this question, we investigate the relationship between ViT ID and ViT OoD accuracy.
Several studies [69, 70, 71, 72] investigates the relationship between ID and OoD accuracy for the CNNs model. However, there is no work on such study particularly for ViT. Utilizing our OoD-ViT-NAS benchmark, we provide the first comprehensive study on the relationship between ViT ID and OoD accuracy. Through our investigation, we find that the correlation between ViT ID and ViT OoD accuracy is not very high. This suggests that architectural insights optimized for ViT ID accuracy, as presented in previous work [2, 3, 6, 7, 8, 9, 12, 18] may not be applicable for ViT OoD generalization.
Experimental Setup. Following previous work [71], we use Kendall’s rank correlation coefficient to compute the correlation between OoD and ID accuracy of all architectures from a search space on one OoD dataset. Our examination comprehensively computes the correlations across all OoD datasets, search spaces, and architectures within our OoD-ViT-NAS benchmark. We compute the average correlations across search spaces and datasets as general statistics.
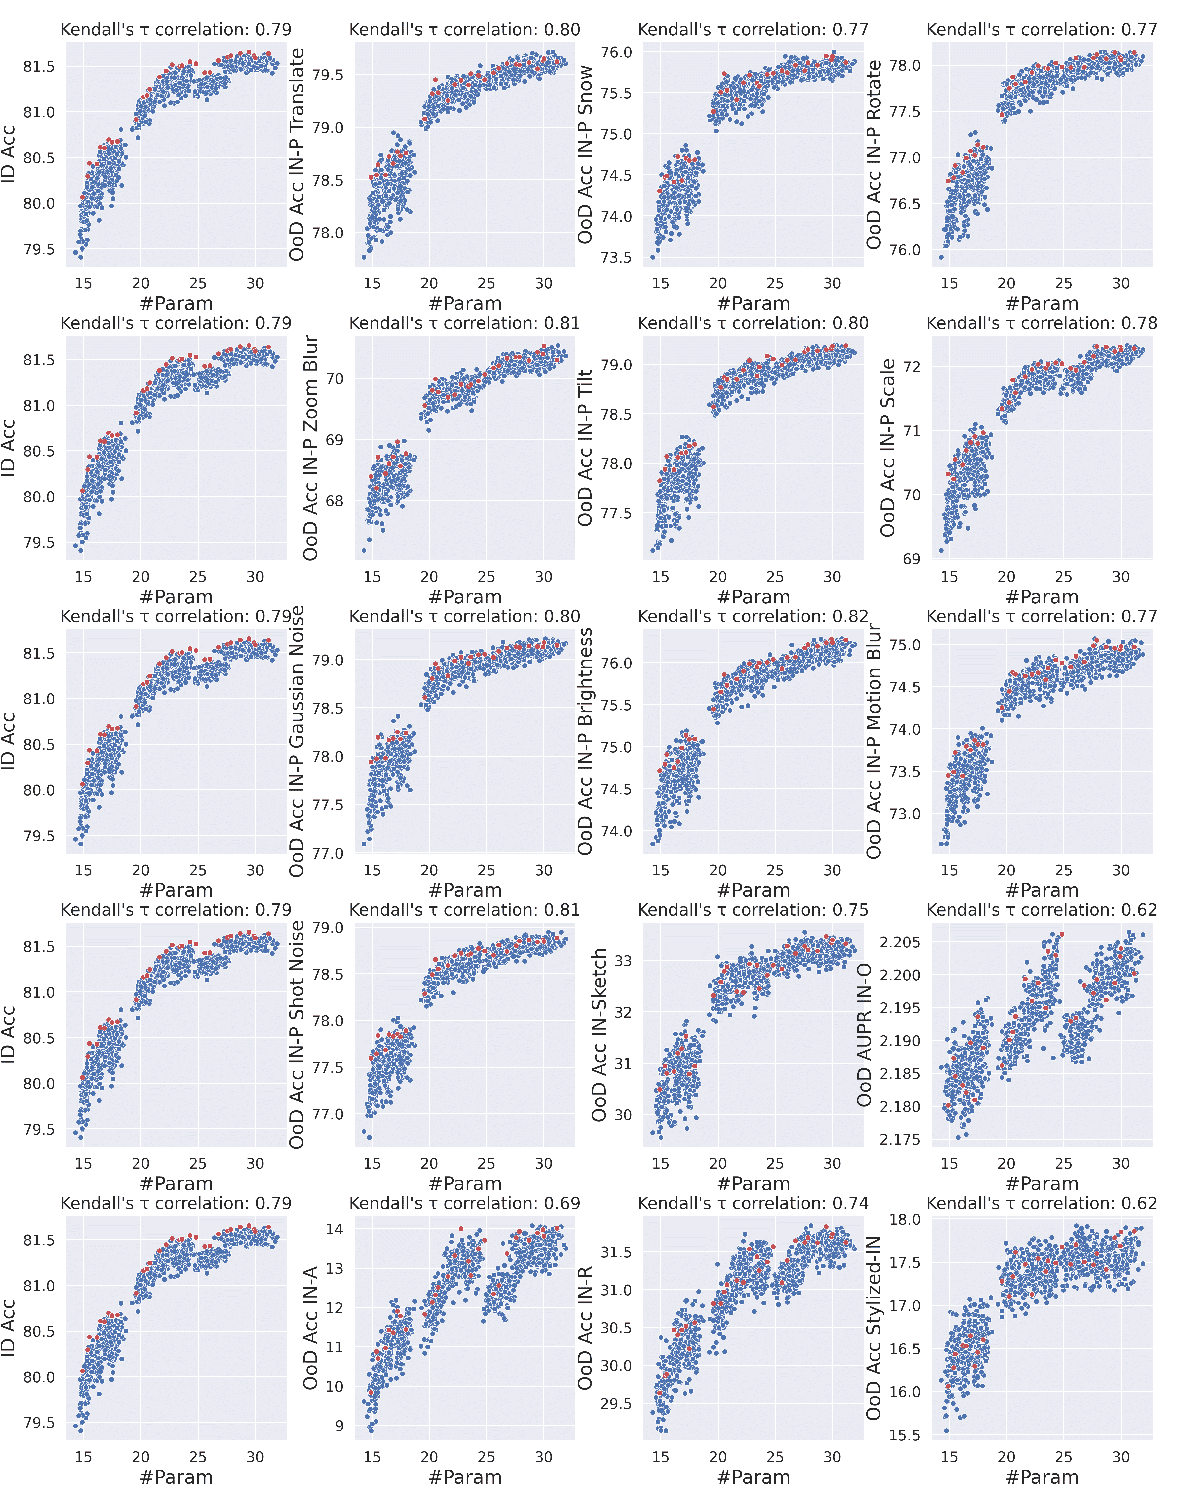
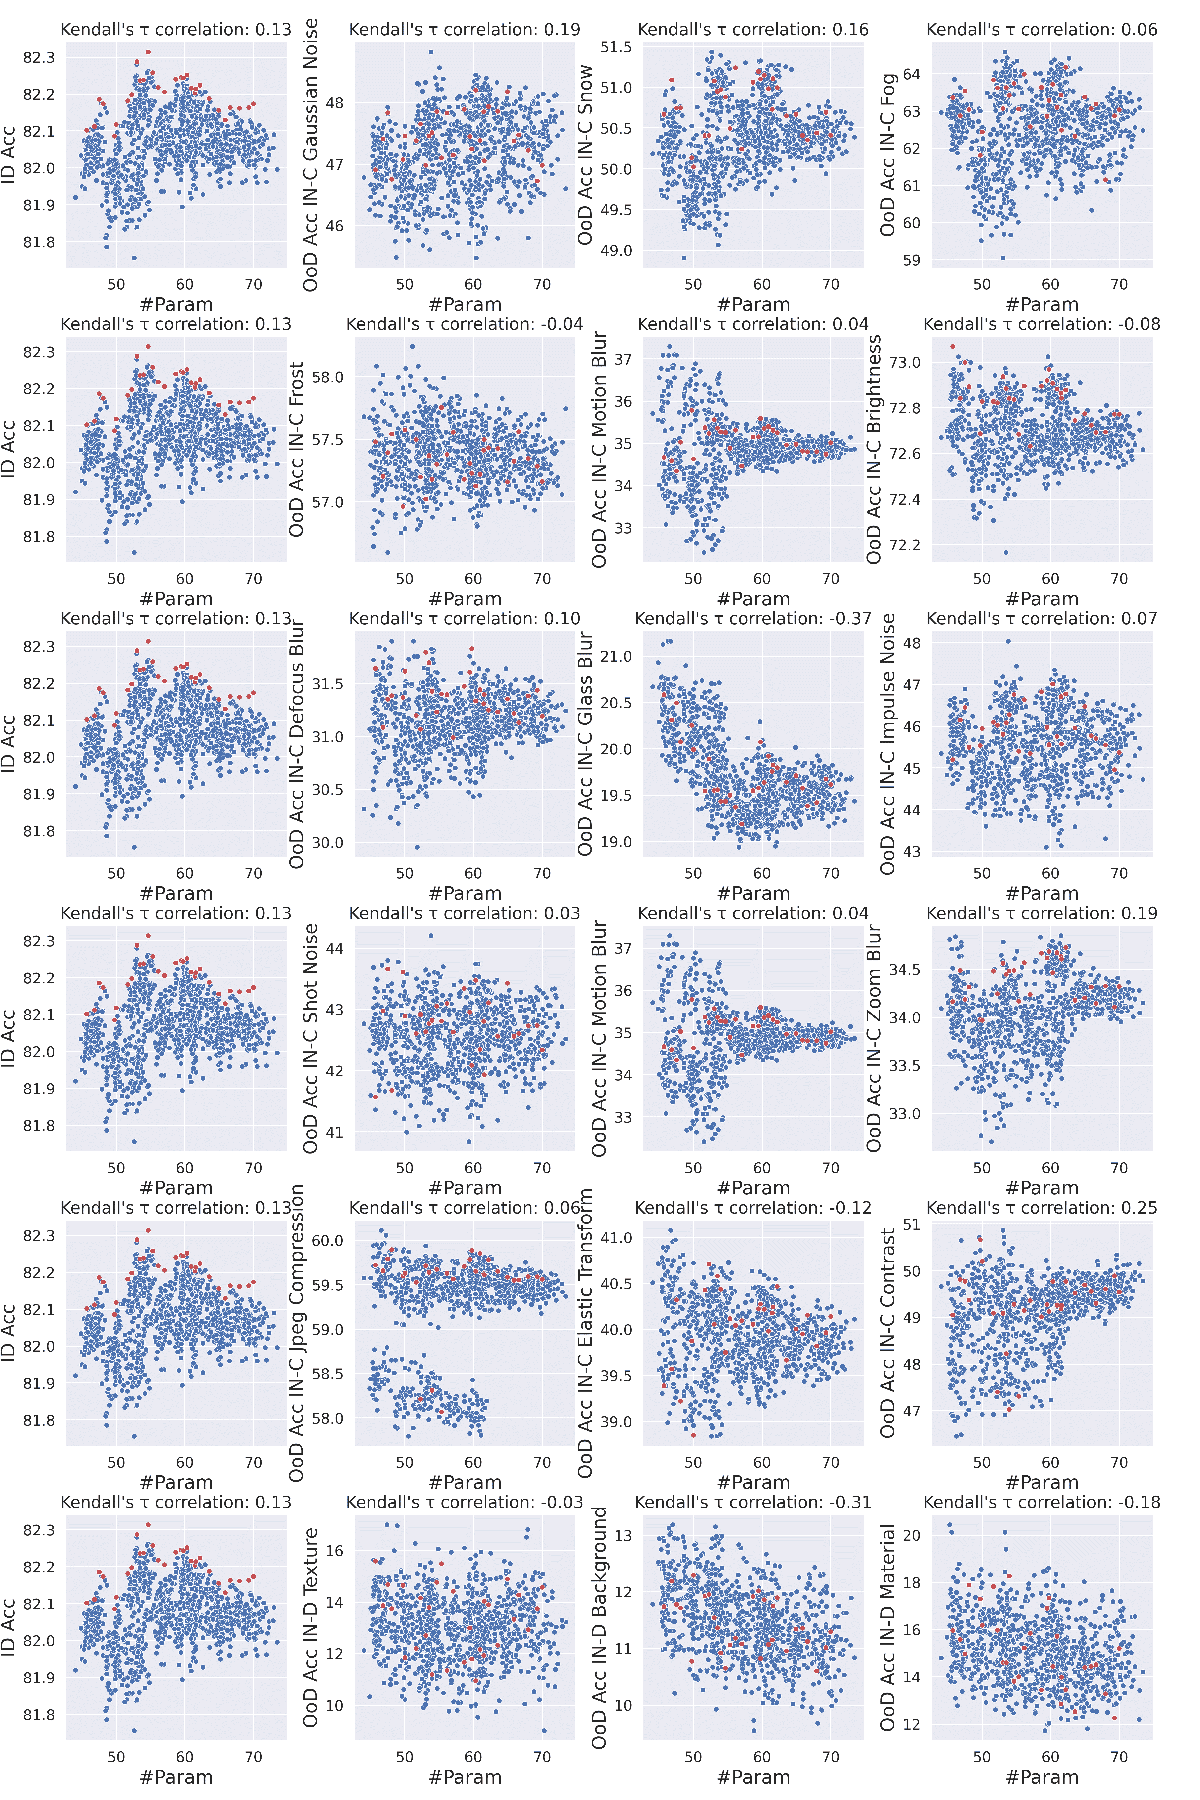
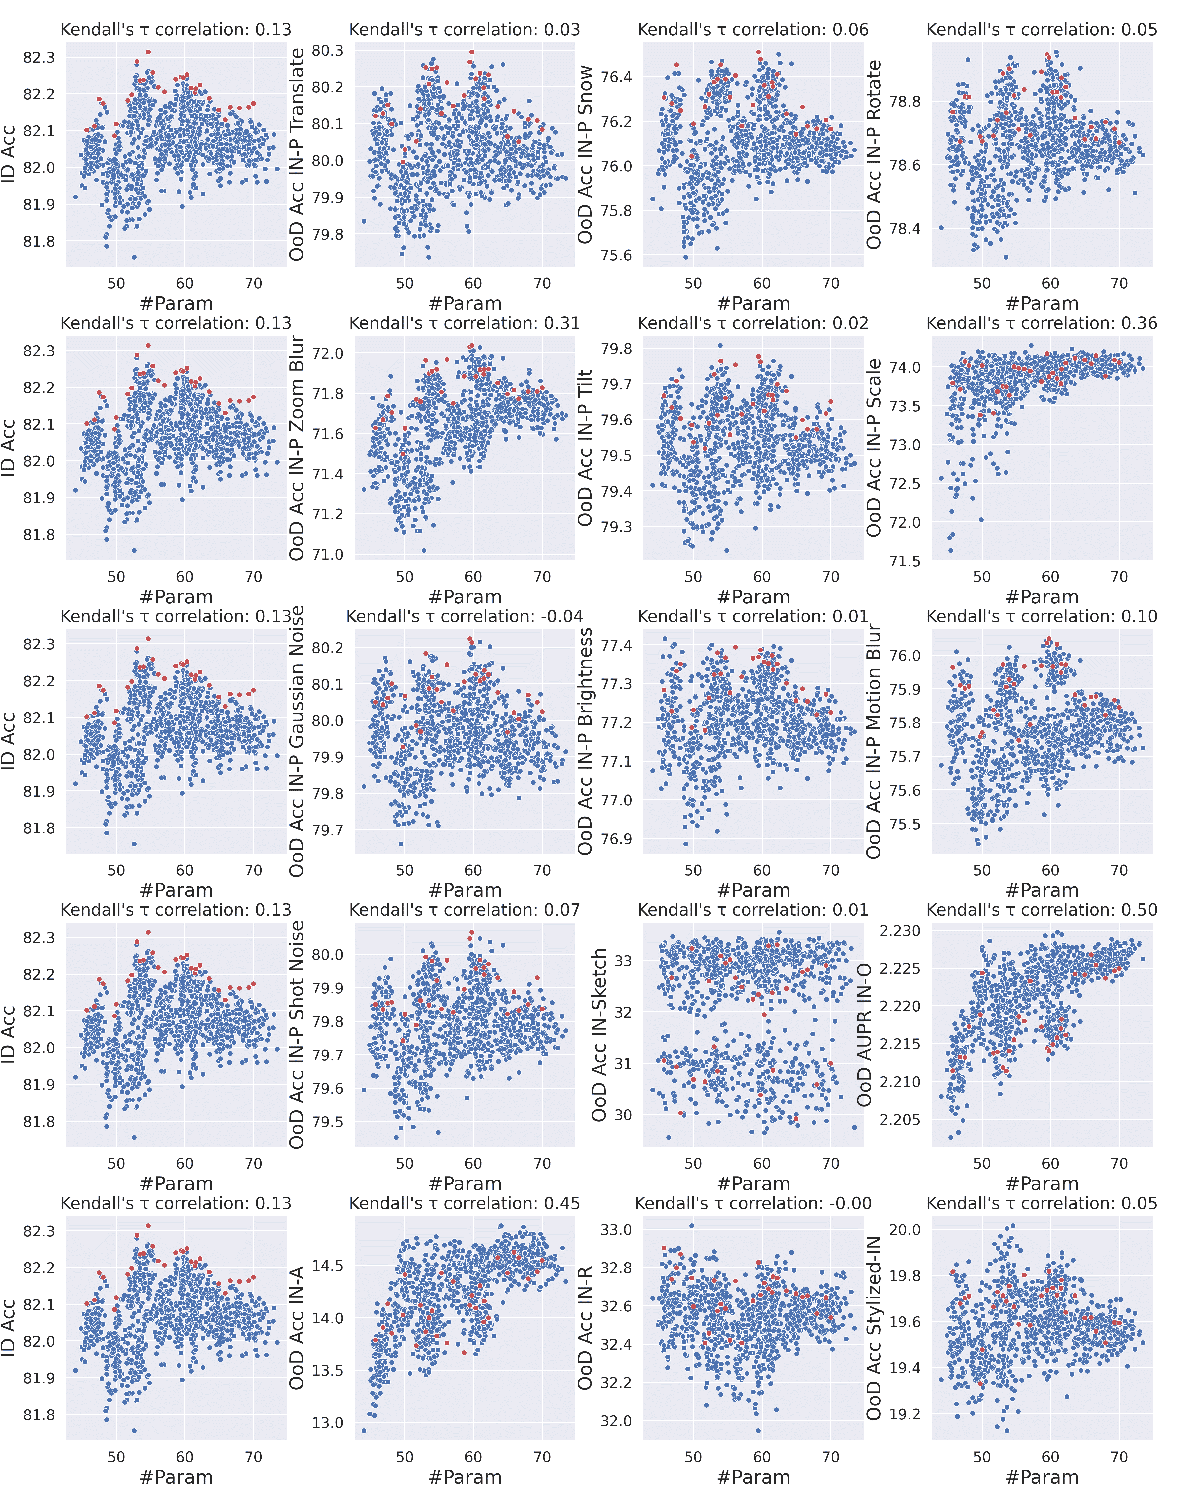
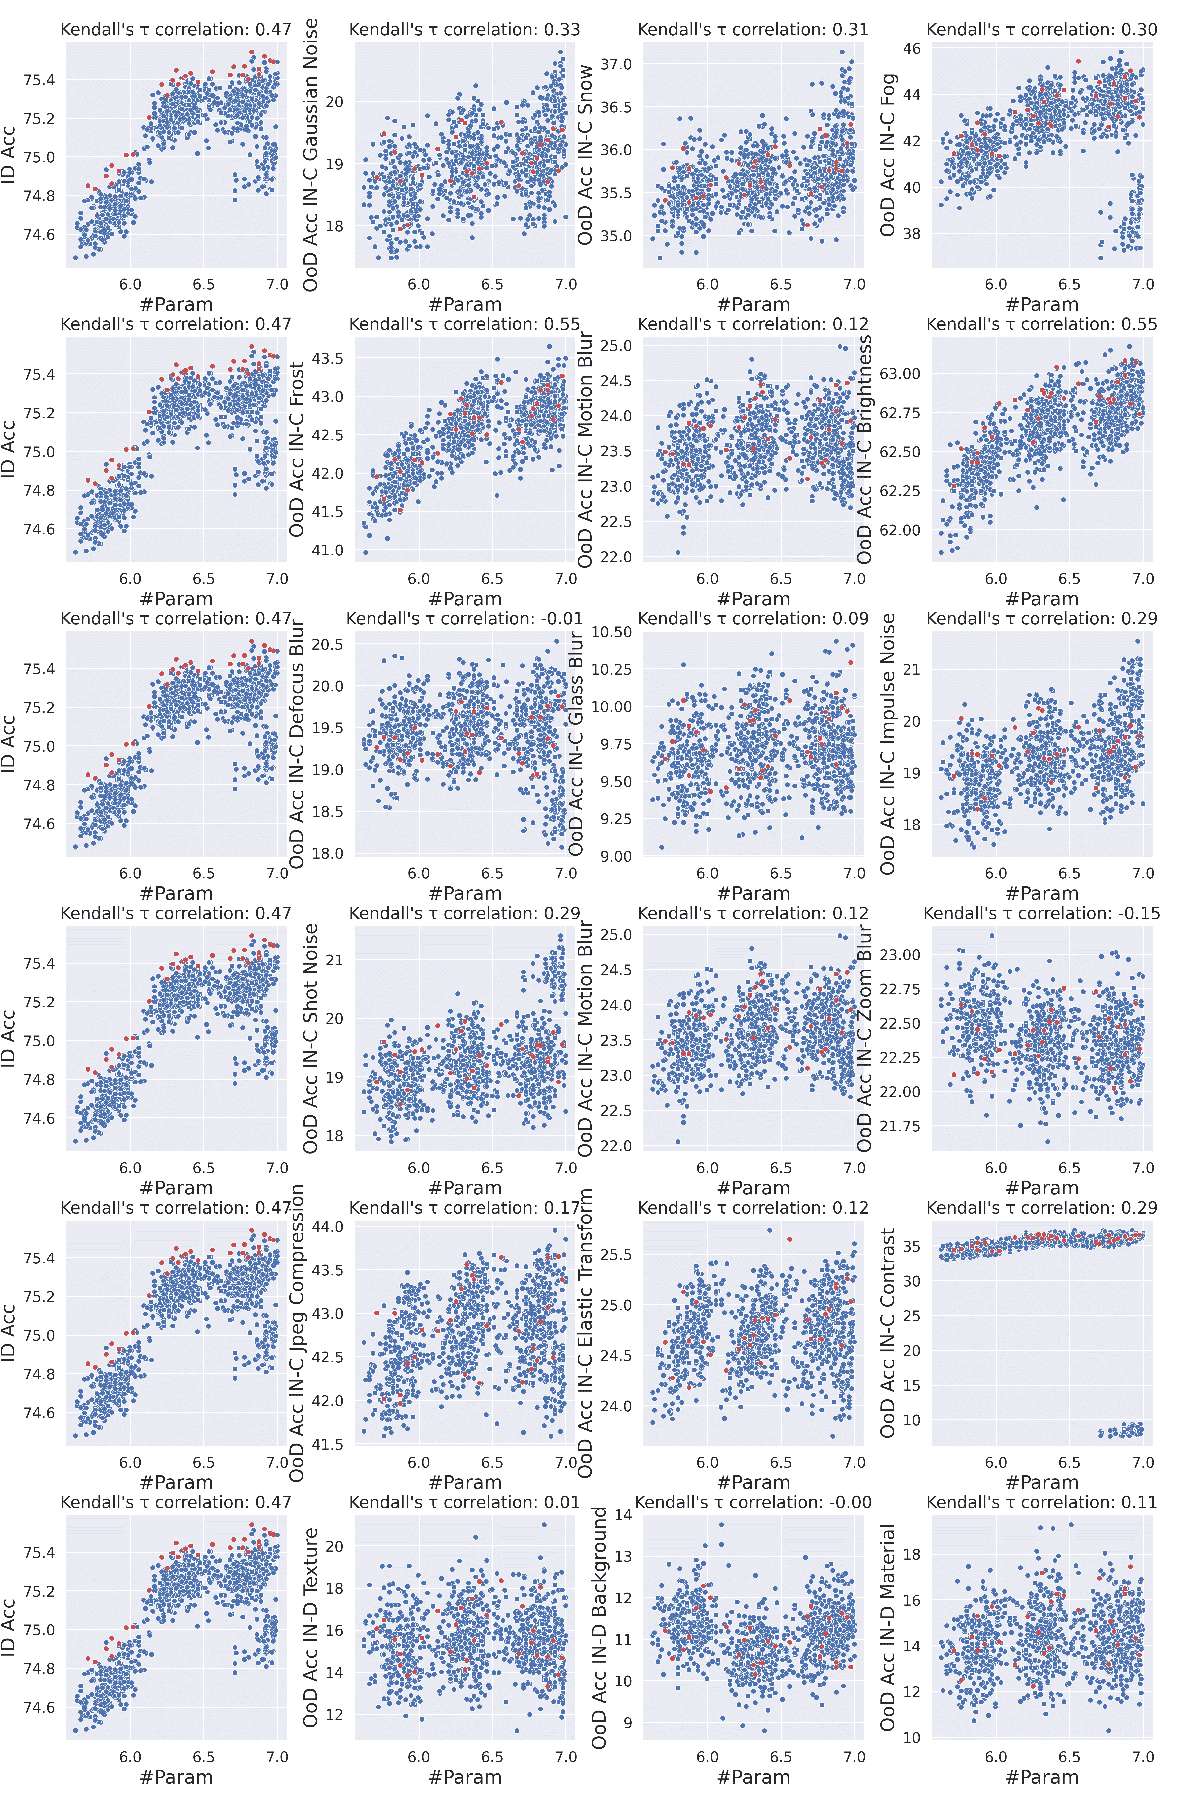
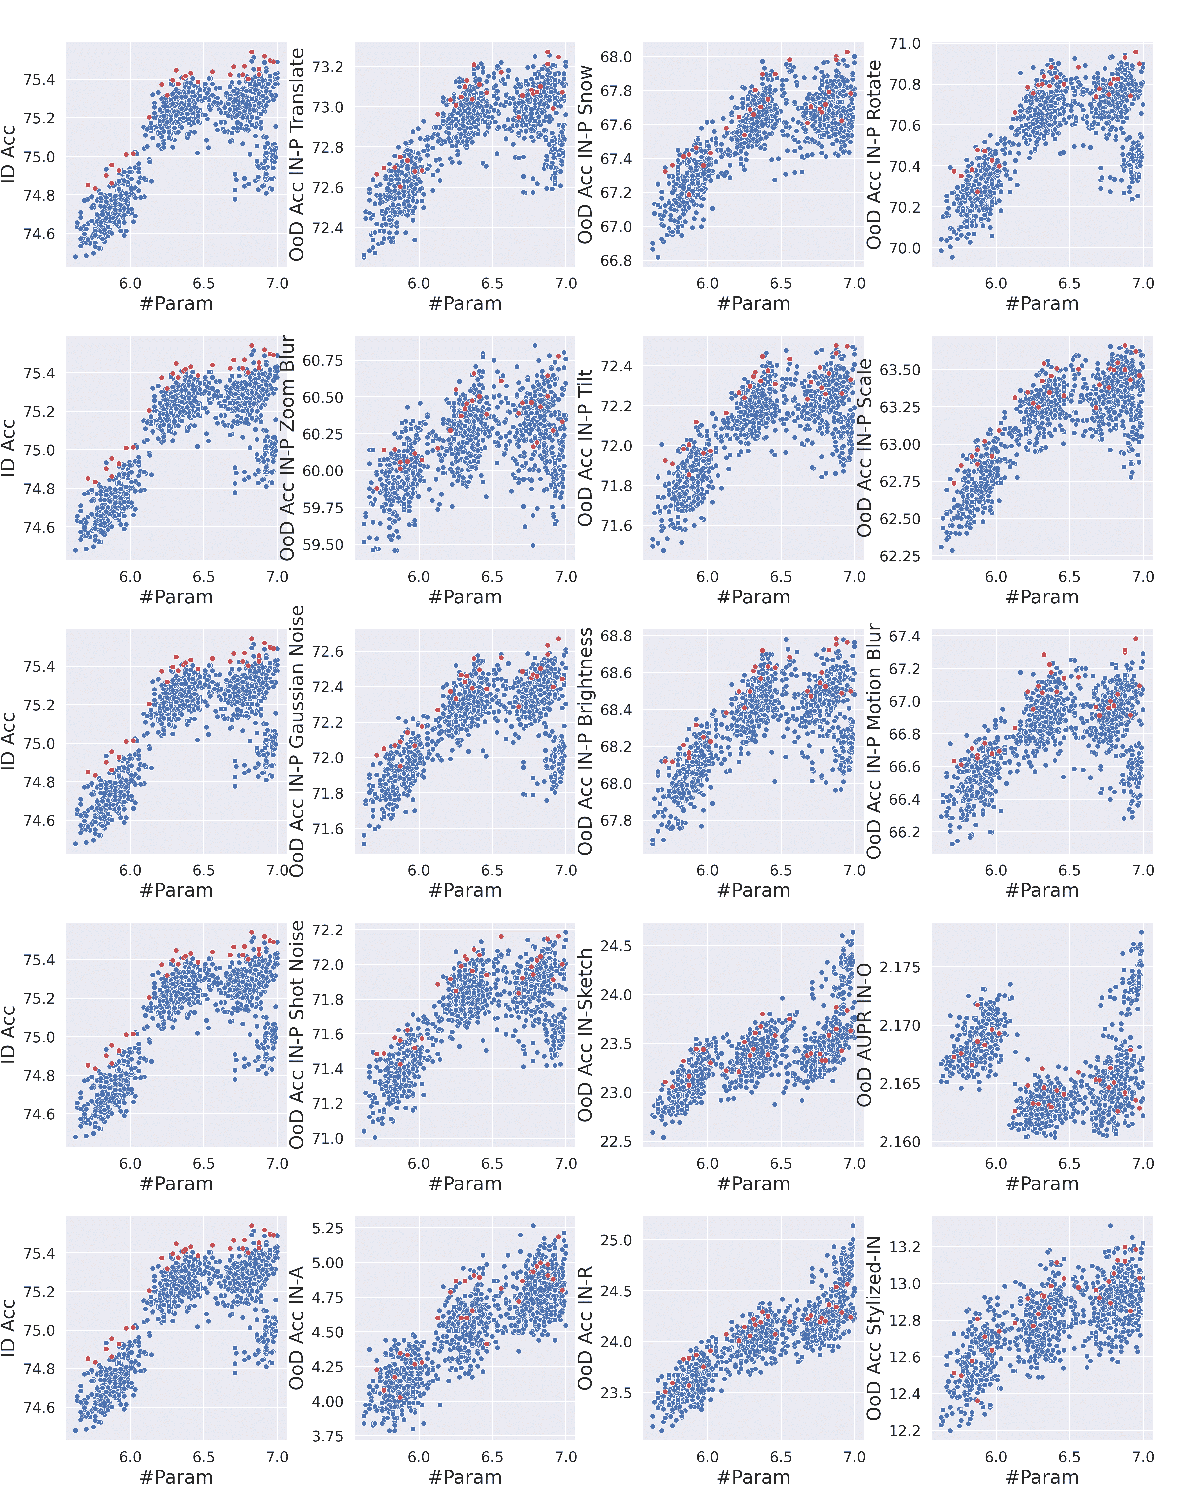
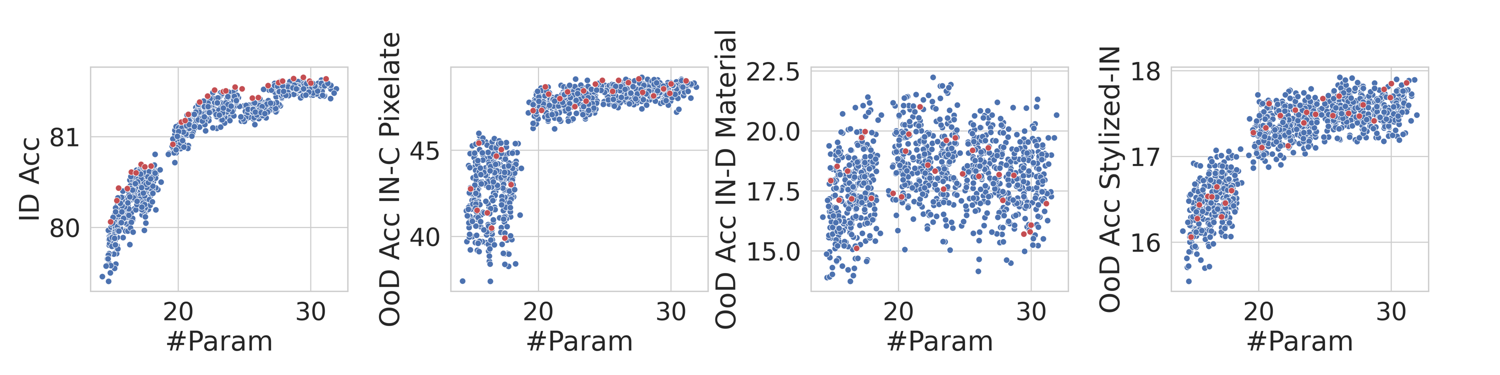
Besides the investigation of the correlation of various architectures, we further study the relationship between ViT ID and ViT OoD accuracy for Pareto architectures, representing the top-performing architectures for a certain model size. As shown in Fig. 4-a, the red dots represent Pareto architectures for ID accuracy In this study, we analyze architectures from the Autofomer-Small search space within our OoD-ViT-NAS benchmark. To identify Pareto architectures for ID accuracy, we divide the total parameter budget into equal intervals and select the architecture with the best ID performance within each interval.
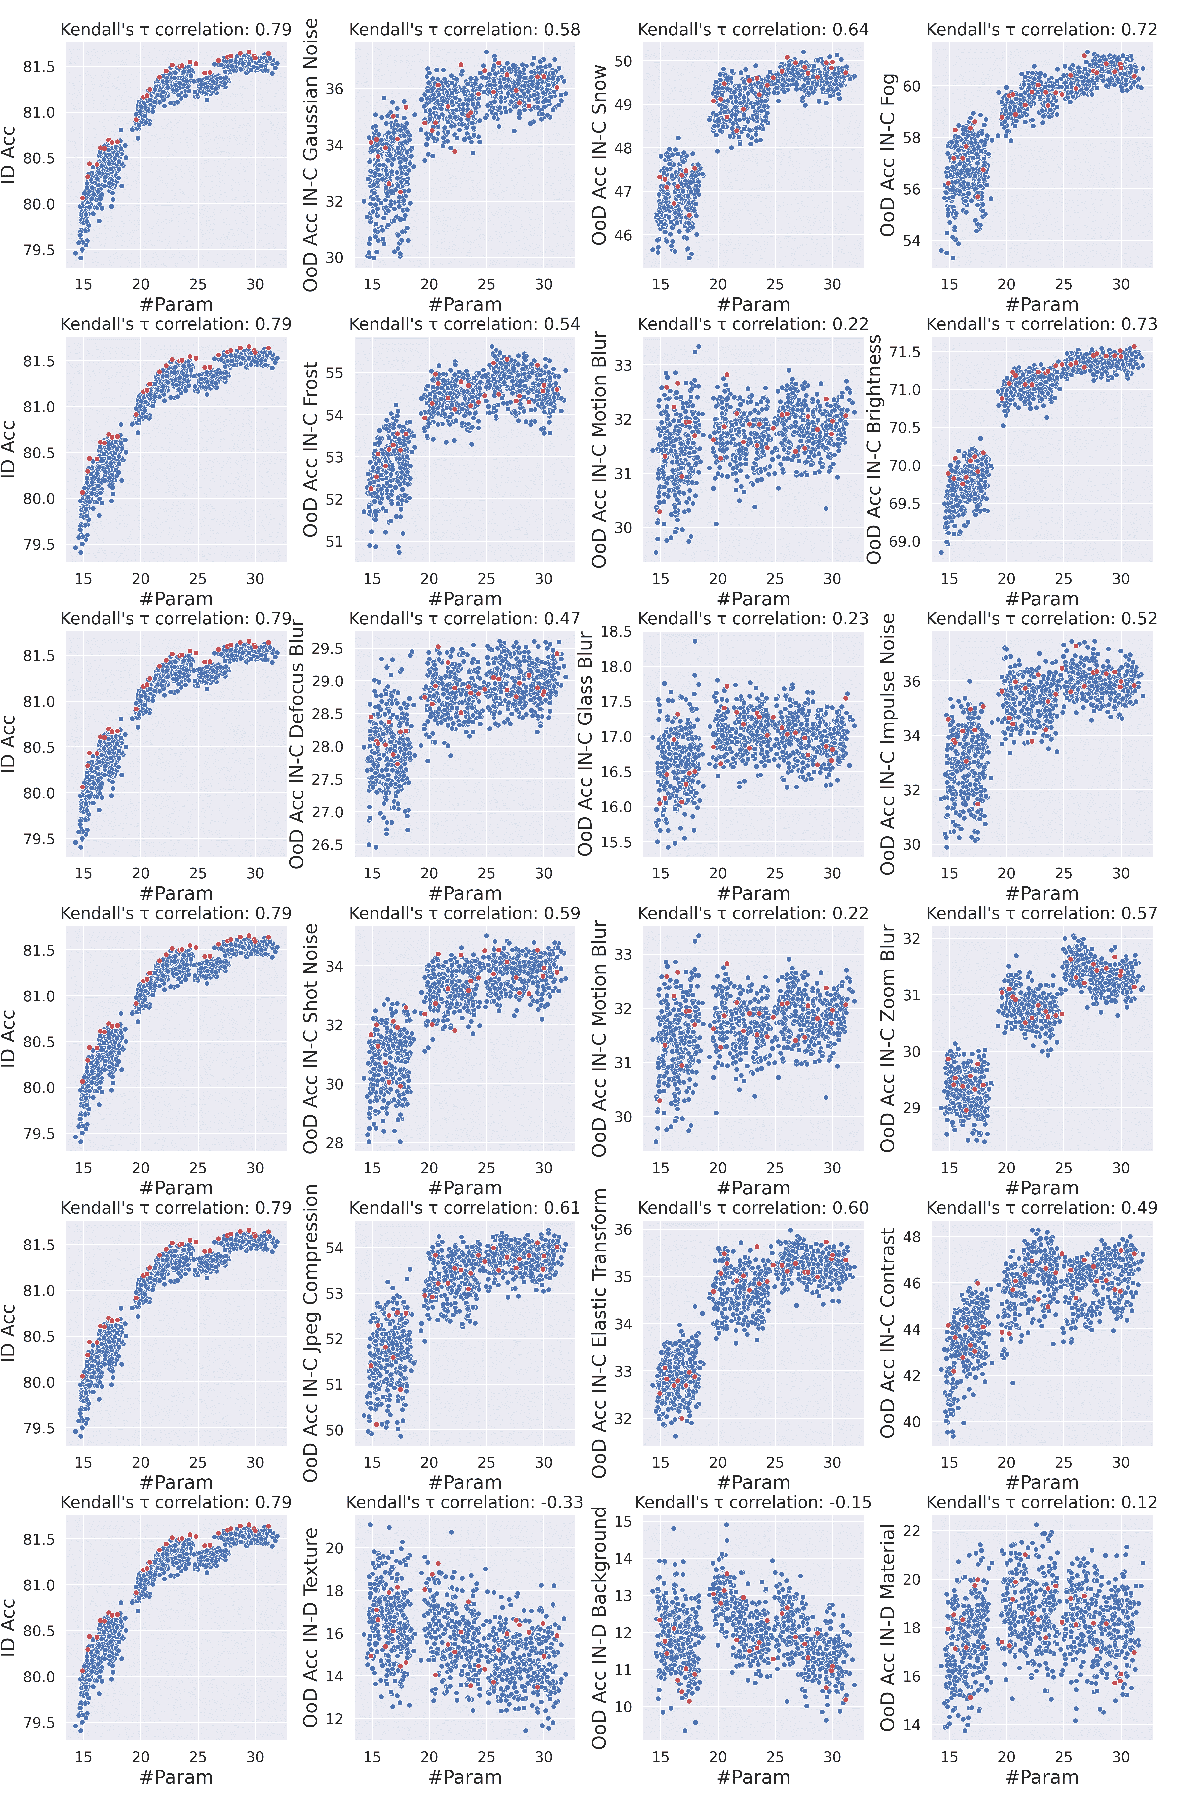
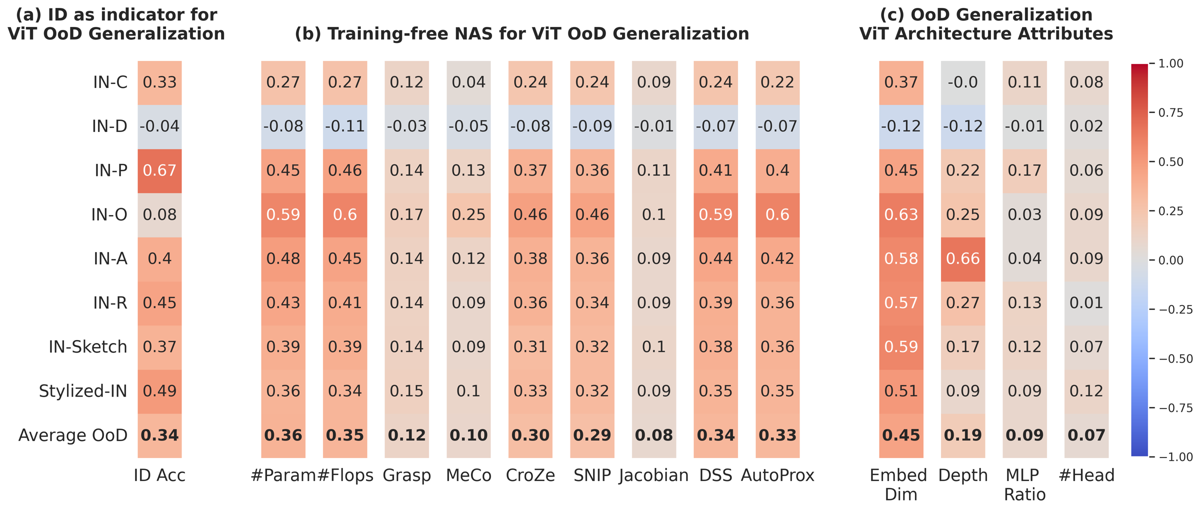
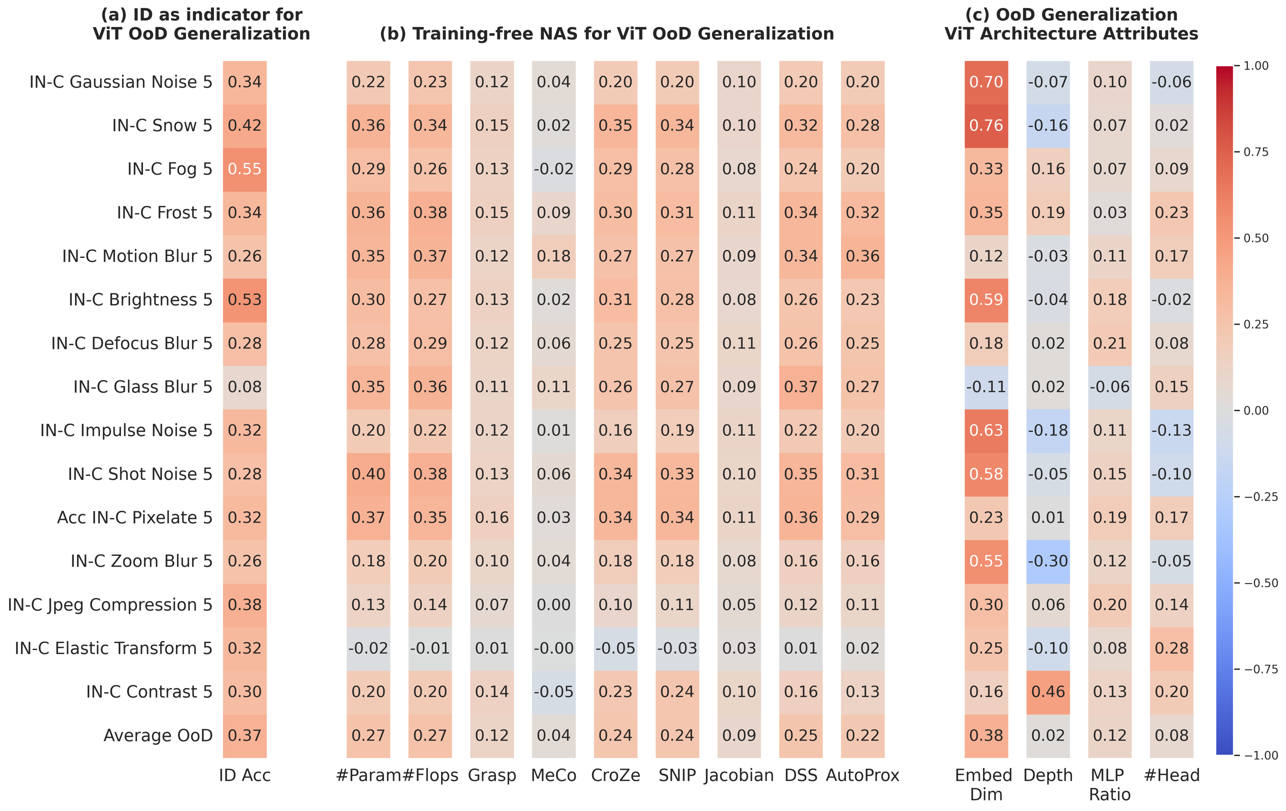
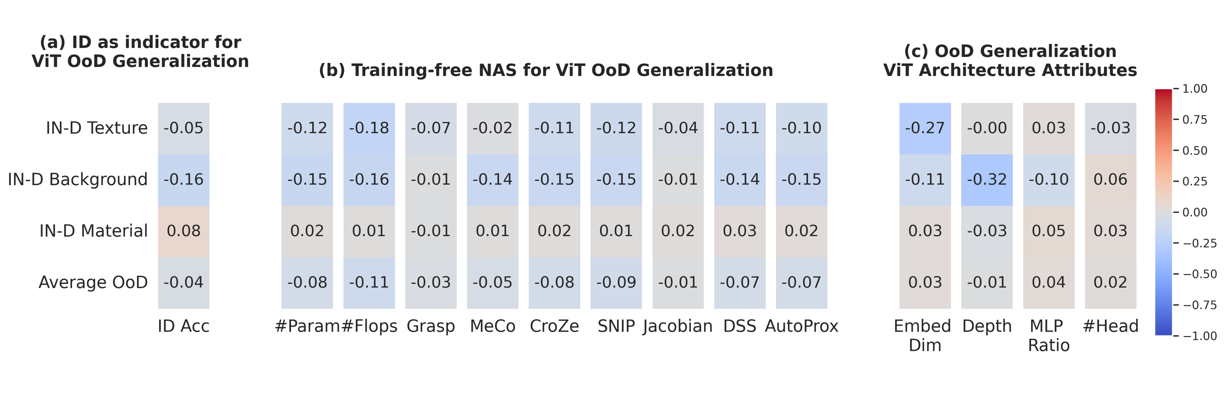
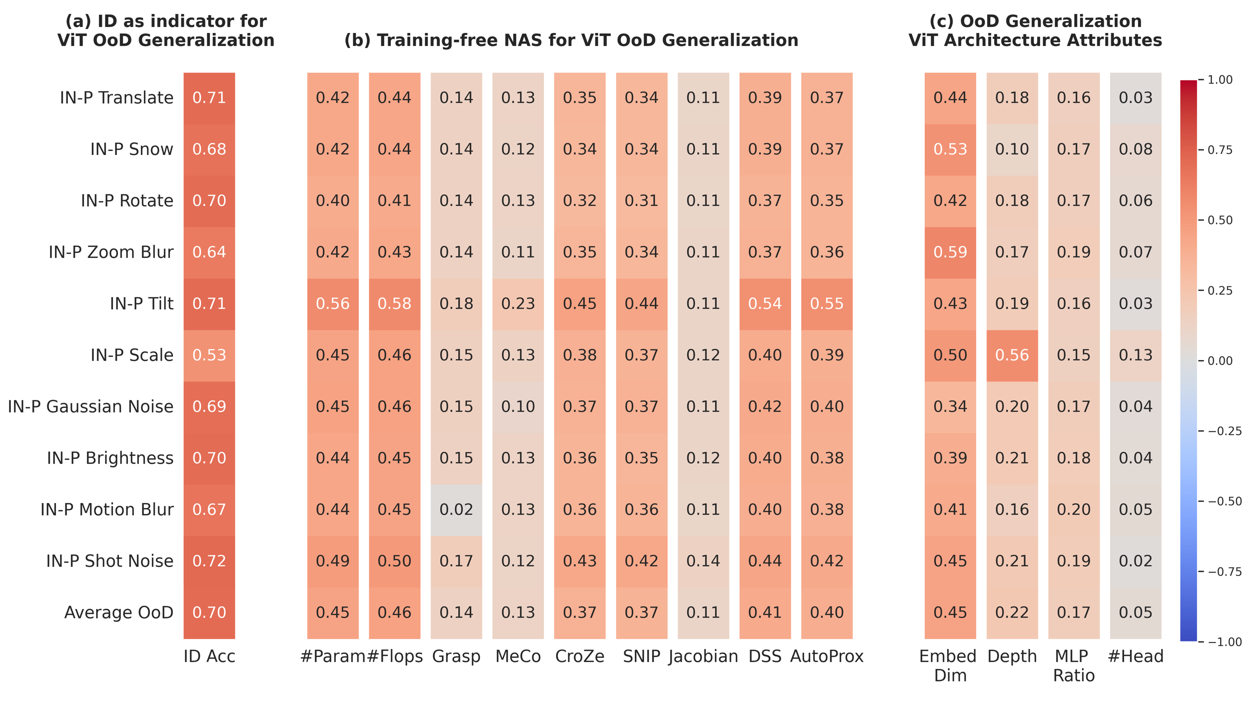
Results. The correlation results are illustrated in Fig. 1-a. The individual correlations can be found in the Appx. 13. We show that the correlation between ID and OoD accuracy is generally not very high. This suggests that current architectural insights based solely on ID accuracy might not effectively translate to OoD generalization.
Among all OoD datasets, the IN-P dataset exhibits the strongest correlation with ID accuracy. This can be attributed to its weaker OoD shift compared to other datasets (see the visualization in Appx. 10). As a result, the OoD examples in IN-P are not very different from ID examples, leading to a relatively high correlation between OoD and ID performance. For the remaining seven datasets with stronger OoD shifts, the correlations remain relatively low.
The results of the Pareto architectures analysis are illustrated in Fig. 4. Additional results can be found in the Appx. 14. We observe that Pareto architectures for ID accuracy generally perform sub-optimally under the OoD shift. This observation further supports our previous finding that ID accuracy might not be a very good indicator of OoD accuracy.
4.3 Explore Training-free NAS for OoD Generalization
Recently, there has been a new research focus on Training-free NAS, aimed at identifying high-performing architectures without the computational expense of training each candidate. To do so, [10, 11, 17, 62, 60, 73, 74] propose zero-cost proxies to predict the performance of candidate architectures in the initialization or the first training iteration, significantly accelerating NAS. While these works focus on ID accuracy, a few attempts have been made in searching for architectures robust against adversarial attacks [62, 75]. However, there is no work to explore Training-free NAS for ViT for OoD generalization.
Experimental Setup. To address this gap, we comprehensively explore the existing Training-free NAS for OoD generalization on ViT architectures within our OoD-ViT-NAS benchmark. Our study includes common and SOTA Training-free NAS originally proposed for CNNs for ID Acc (Grasp [74], SNIP [73], MeCo [60]), ViTs for ID Acc (DSS [10], AutoProx [17]), and CNNs for adversarial robustness (Jacobian [75], CroZe [62]). We complement this study on Training-free NAS to our OoD-ViT-NAS benchmark to equip the NAS research community with valuable tools to develop more effective Training-free NAS for OoD generalization.
| Training-free NAS | Originally Proposed For | Correlation with ID Acc | Correlation with OoD Acc | |
| Performance | Architecture | |||
| Grasp [74] | ID Acc | CNNs | 0.1490 0.1951 | 0.1207 0.1575 |
| SNIP [73] | ID Acc | CNNs | 0.3750 0.3023 | 0.2889 0.2274 |
| MeCo [60] | ID Acc | CNNs | 0.1440 0.2371 | 0.0975 0.0819 |
| CroZe [62] | Adv Robustness | CNNs | 0.3823 0.3046 | 0.2951 0.2223 |
| Jacobian [75] | Adv Robustness | CNNs | 0.1053 0.1509 | 0.0841 0.1232 |
| DSS [10] | ID Acc | ViTs | 0.4165 0.3461 | 0.3421 0.2365 |
| AutoProx-A [17] | ID Acc | ViTs | 0.4023 0.3827 | 0.3303 0.2384 |
| #Param | - | - | 0.4607 0.3318 | 0.3600 0.2321 |
| #Flops | - | - | 0.4705 0.3391 | 0.3537 0.2327 |
Results. Our exploration provides several practical insights for designing a Training-free NAS for ViT for OoD generalization. The results of Kendall [76] ranking correlation between the OoD accuracy and Training-free NAS proxies on common large OoD datasets are illustrated in Tab. 2. The average OoD accuracy is computed across OoD datasets and search spaces. Detailed results can be found in Fig. 1 and Appx. 15.
We observe that existing Training-free NAS are largely ineffective in predicting OoD accuracy. Even recent Training-free NAS designed for ViT (i.e., DSS [10] and AutoProx-A [17] ) or Training-free NAS designed adversarial robustness [62] struggle with predicting OoD accuracy.
Surprisingly, simple zero-cost proxies such as #Param or #Flops outperform all existing, more complex proxies in predicting both OoD accuracy for ViTs. This finding poses a challenge to the Training-free NAS research community: to devise a Training-free NAS that surpasses #Params or #Flops in OoD Acc prediction for ViT.
From Fig. 1-b, we observe that all Training-free NAS methods consistently fail to predict IN-D performance. This is due to the IN-D dataset’s unique generation process using Stable Diffusion, which creates images labelled with object names and varying nuisances like background, texture, and material variations. Only the most challenging images are retained, resulting in highly difficult examples, such as distorted images and unrealistic object-background placements (see Fig. 10.2). These examples degrade ViT model performance significantly [26] and cause unpredictable behaviour.
Our investigation into ID accuracy for ViTs also reveals a surprising observation. While proposals for Training-free NAS designed for ViTs (i.e., DSS [10] and AutoProx-A [17]), improve the prediction of ID accuracy compared to counterparts designed for CNNs. Our study marks the first attempt to explore simple Training-free NAS like #Param or #Flops. The ID prediction of such simple proxies surprisingly outperforms SOTA Training-free NAS designed for predicting ID accuracy for ViT.
4.4 ViT Structural Attributes on OoD Generalization: Increasing Embedding Dimension is Generally Helpful
Our OoD-ViT-NAS benchmark with ViT architectures covers diverse design choices in ViT structural attributes, including embedding dimension (Embed_Dim), network depth, number of heads (#Heads), and MLP ratio (MLP_Ratio), which allows for finding a wide range of ViT with different structures and complexities. Utilizing our comprehensive benchmark, we are the first to provide an analysis of the impact of these ViT structural attributes. We investigate which structural attributes in ViTs could lead to better OoD generalization. Through our analysis, we find that increasing the embedding dimension of a ViT architecture can generally improve OoD generalization. The additional analysis on another search space [1] further confirms our finding. The details for this additional analysis can be found in Appx. 8
Experimental Setup.
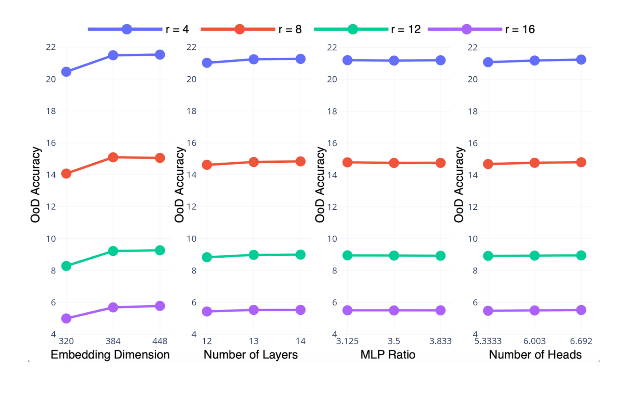
To verify the effectiveness of ViT architectural attributes on our OoD generalization benchmark, we present the results from two perspectives: (1) an analysis of rank correlation for our OoD-ViT-NAS benchmark and (2) a comparison of OoD accuracy across different embedding dimensions. To gain insights into the relationship between embedding dimension (Embed_Dim) and OoD performance, we created the visualizations for all architectures in our OoD-ViT-NAS benchmark. These visualizations compare the average OoD accuracies across different ViT architectures with varying embedding dimensions and depths. Examples of these visualizations are shown in Fig. 5. Additional results can be found in the App.16.
Results.
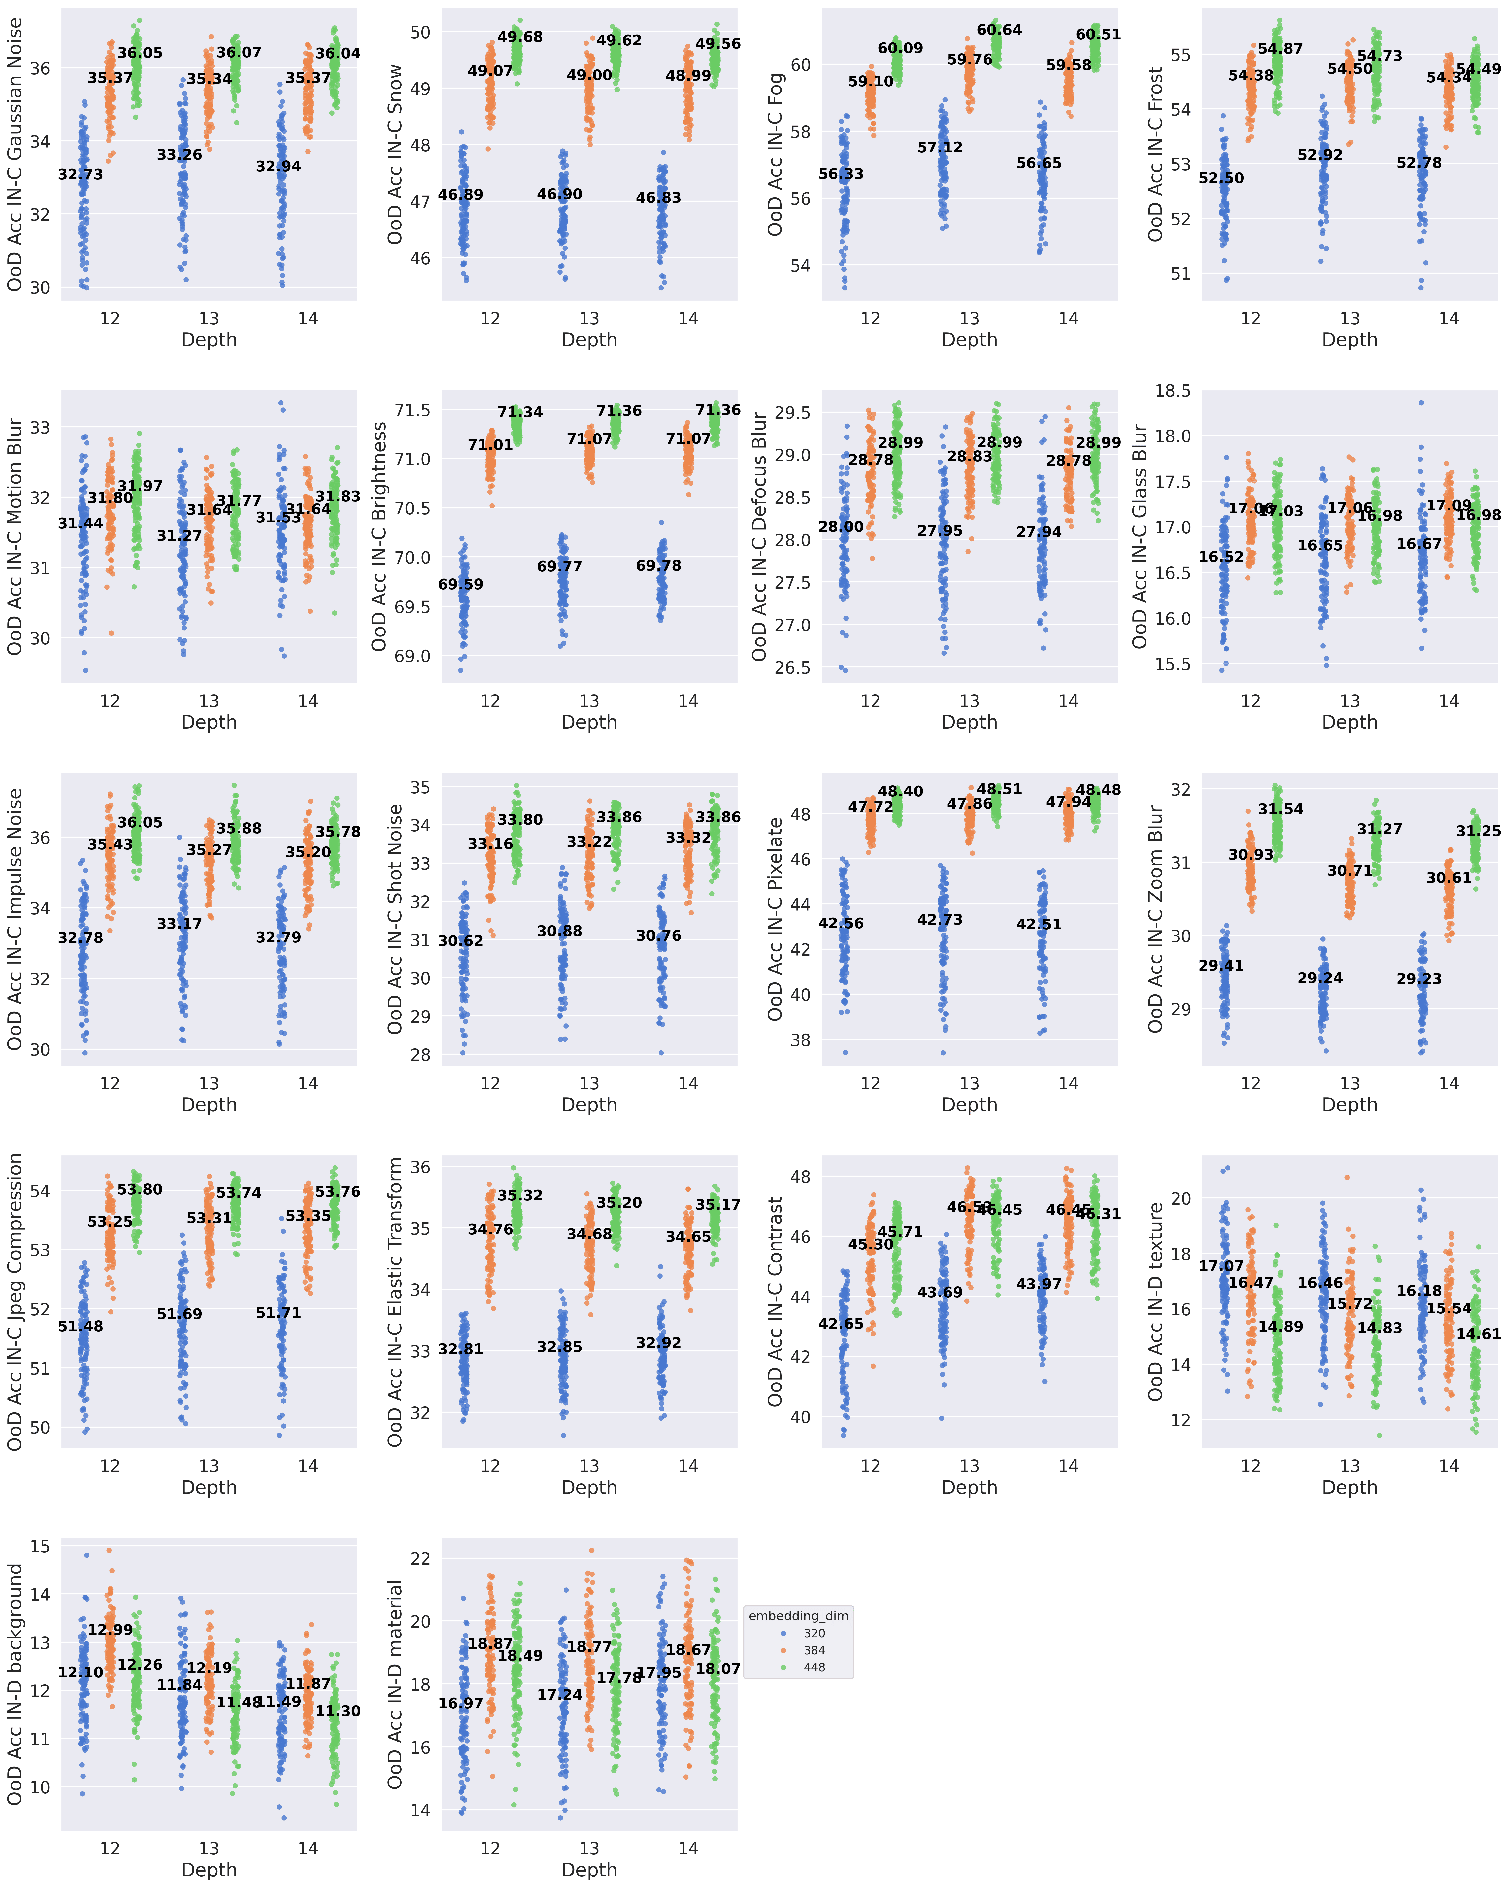
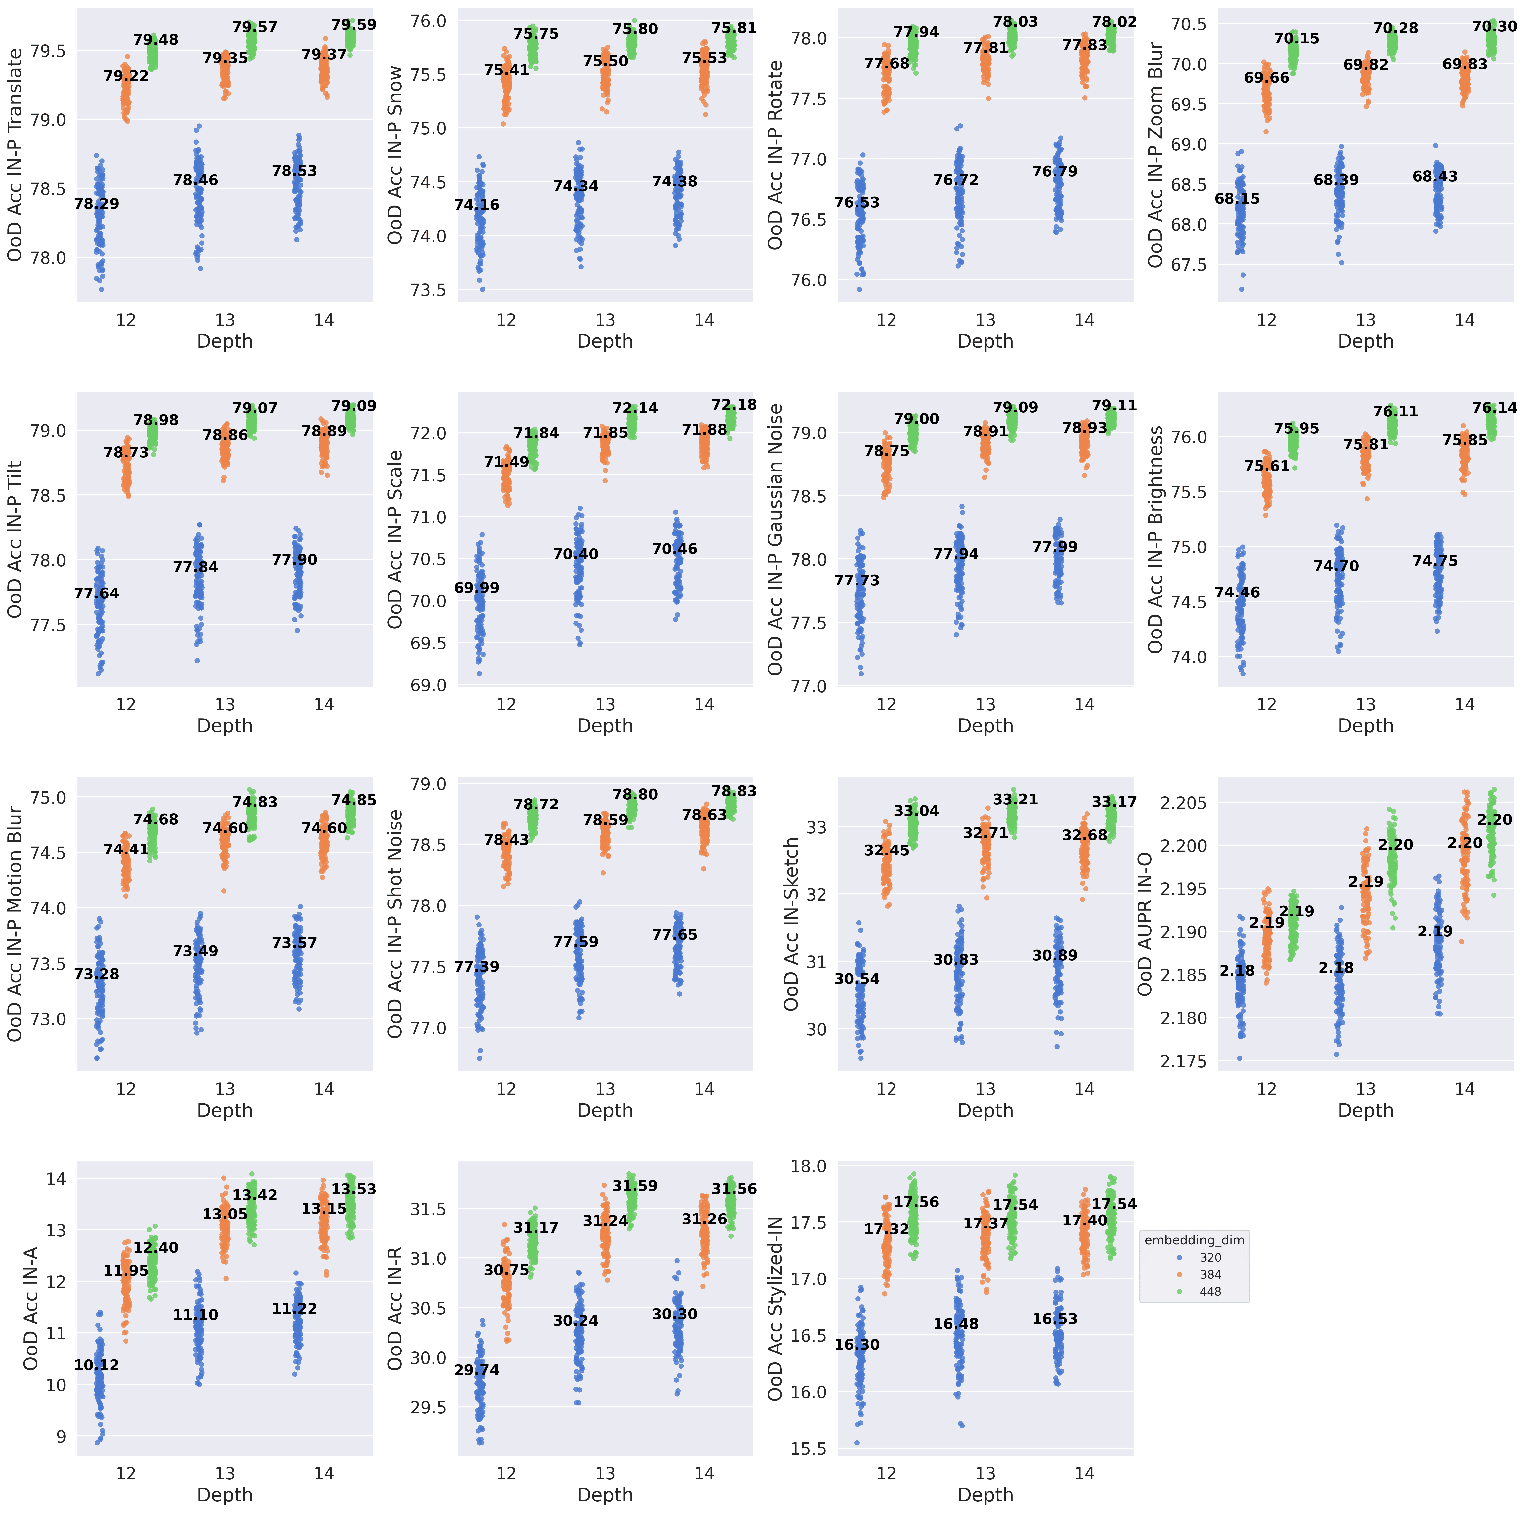
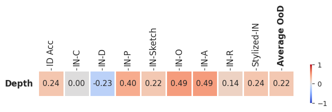
In Fig. 1-c, we find that the embedding dimension generally has the highest correlation with OoD accuracy among all ViT architectural attributes. This positive correlation indicates that Embed_Dim could play a crucial role in achieving OoD generalization performance. Our comprehensive OoD-ViT-NAS benchmark sheds light on a previously unknown relationship: the potential impact of embedding dimension (Embed_Dim) on OoD generalization in ViTs. This trend holds across most OoD shifts in our benchmark (Fig. 5), suggesting that among other architectural attributes, the design choice of Embed_Dim might significantly influence a model’s OoD generalization.
Our experiments yield several intriguing phenomena. Based on Fig. 1-c, we observe that network depth has a slight impact on overall OoD generalization performance (correlation: ). Also, as shown in Fig. 5, for a given embedding dimension (represented by a distinct colour), we report the mean OoD accuracy, showing how the mean OoD accuracy changes among ViT architectures of varying depths, which aligns with our empirical insight. Fig. 5 shows that while increasing depth can be beneficial for improving ViT’s OoD generalization in some cases, there exist shallower models that tend to perform better in terms of OoD accuracy compared to those with deeper models.
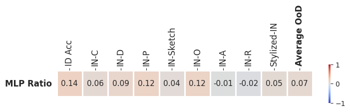
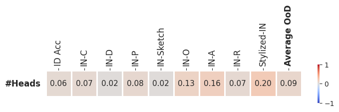
It is evident from Fig. 1-c, where both the MLP ratio (0.09) and the number of heads () exhibit very low correlation values with overall OoD performance. These findings highlight that increasing the MLP ratio and the number of heads may not substantially enhance a model’s robustness to OoD data. Due to space constraints, we defer additional experiments to the Appx. 17, showing that the network depth, MLP ratio, and #Heads might have non-obvious impacts on OoD generalization.
Increasing Embedding Dimension help ViT learn more high-frequency patterns, leading to improve OOD generalization. In this section, we design a frequency study to understand our finding: why increasing ViT Embedding Dimension can generally improve ViT’s OOD generalization. In the literature, the models obtain higher performance on preserving High-Frequency-Component (HFC) samples tend to learn more HFC [77, 78]. By learning more HFC, the models improve OOD generalization [77, 79]. Our hypothesis is that Increasing embedding dimension helps ViTs learn more HFC resulting in improving OOD generalization. We adapt the experiment from [77] to verify our hypothesis. The details on this experimental setup can be found in the Appx. 9. In a nutshell, we filter HFC by hyper-parameter radius r, where the higher the r, the lesser HFC. As shown in Fig. 6, we observe that when increasing Embedding Dimension, the performances obtained on filtering-HFC samples are improved. This observation holds true across setups varying radius r, supporting that increasing Embedding Dimension helps ViT learn more HFC. In contrast, increasing other ViT structural attributes does not help improve ViT learn more HFC.
Robust ViT architectures designed by our finding.
Our study provides significant insights for guiding the design of ViT architectures. Specifically, among ViT structural attributes, increasing embedding dimension can generally improve OoD generalisation of ViT architectures. Our insight leads to a simple method which can achieve ViT architectures that can outperform well-established human-designed. We demonstrate the superiority of ViT based on our insights in Tab. 3. Scaling up ViT architecture (e.g., from ViT-B-32 to ViT-L-32) by humans typically involves compound scaling of various ViT structural attributes. However, our findings suggest that not all ViT structural attributes need to be increased to benefit OoD generalisation. Among these attributes, increasing the embedding dimension is the most crucial factor for improving OoD generalisation. By only increasing the embedding dimension, ours ViT architectures (e.g., Increasing embedding dimension of ViT-B-32) are significantly more efficient and outperform compound scaling architectures (e.g., ViT-L-32).
| Architecture | Embed Dim | Depth | #Head | MLP Ratio | Latency (ms) | #Param (M) | IN-R OoD Acc | wrt Latency | wrt #Param |
| ViT-B-32 | 768 | 12 | 12 | 4.0 | 105.00 | 87.53 | 41.58 | - | - |
| Ours | 840 | 12 | 12 | 4.0 | 113.32 | 98.64 | 48.28 | 0.8054 | 0.6032 |
| ViT-L-32 [1] | 1024 | 16 | 24 | 4.0 | 258.83 | 305.61 | 44.33 | 0.0179 | 0.0126 |
| Swin-T | 96 | 12 | 32 | 4.0 | 100.31 | 28.29 | 46.22 | - | - |
| Ours | 128 | 12 | 32 | 4.0 | 165.80 | 49.91 | 48.28 | 0.0315 | 0.0954 |
| Swin-S [3] | 96 | 24 | 32 | 4.0 | 184.48 | 49.60 | 47.77 | 0.0184 | 0.0725 |
5 Conclusion
In this work, we introduce OoD-ViT-NAS, the first comprehensive benchmark for NAS on OoD generalization of ViT architectures. Using this benchmark, we conduct a comprehensive investigation on OoD generalization for ViT. Firstly, we show that ViT architecture design significantly impacts OoD accuracy. Secondly, we show that the architectural findings from existing works for ID performance could not apply to OoD generalization due to the low correlation between ID and OoD accuracy. Thirdly, we conduct the first study of NAS for ViT’s OoD generalization and show that existing Training-free NAS methods struggle with OoD prediction. Surprisingly, simple proxies like #Param or #Flops outperform other complex Training-free NAS. Finally, we conduct the first study on the impact of ViT architectural attributes on OoD generalization. Our study reveals that increasing a ViT architecture’s embedding dimensions can generally improve OoD generalization. We believe our benchmark OoD-ViT-NAS and comprehensive analysis will catalyze and streamline future research on understanding how ViT architecture design influences OoD generalization.
Acknowledgement. This research is supported by the National Research Foundation, Singapore under its AI Singapore Programmes (AISG Award No.: AISG2-TC-2022-007); The Agency for Science, Technology and Research (A*STAR) under its MTC Programmatic Funds (Grant No. M23L7b0021). This research is supported by the National Research Foundation, Singapore and Infocomm Media Development Authority under its Trust Tech Funding Initiative. Any opinions, findings and conclusions or recommendations expressed in this material are those of the author(s) and do not reflect the views of National Research Foundation, Singapore and Infocomm Media Development Authority.
References
- [1] Alexey Dosovitskiy, Lucas Beyer, Alexander Kolesnikov, Dirk Weissenborn, Xiaohua Zhai, Thomas Unterthiner, Mostafa Dehghani, Matthias Minderer, Georg Heigold, Sylvain Gelly, et al. An image is worth 16x16 words: Transformers for image recognition at scale. arXiv preprint arXiv:2010.11929, 2020.
- [2] Zhengzhong Tu, Hossein Talebi, Han Zhang, Feng Yang, Peyman Milanfar, Alan Bovik, and Yinxiao Li. Maxvit: Multi-axis vision transformer. In European conference on computer vision, pages 459–479. Springer, 2022.
- [3] Ze Liu, Yutong Lin, Yue Cao, Han Hu, Yixuan Wei, Zheng Zhang, Stephen Lin, and Baining Guo. Swin transformer: Hierarchical vision transformer using shifted windows. In Proceedings of the IEEE/CVF international conference on computer vision, pages 10012–10022, 2021.
- [4] Yanghao Li, Hanzi Mao, Ross Girshick, and Kaiming He. Exploring plain vision transformer backbones for object detection. In European Conference on Computer Vision, pages 280–296. Springer, 2022.
- [5] Bowen Zhang, Zhi Tian, Quan Tang, Xiangxiang Chu, Xiaolin Wei, Chunhua Shen, et al. Segvit: Semantic segmentation with plain vision transformers. Advances in Neural Information Processing Systems, 35:4971–4982, 2022.
- [6] Minghao Chen, Houwen Peng, Jianlong Fu, and Haibin Ling. Autoformer: Searching transformers for visual recognition. In Proceedings of the IEEE/CVF international conference on computer vision, pages 12270–12280, 2021.
- [7] Haibin Wang, Ce Ge, Hesen Chen, and Xiuyu Sun. Prenas: Preferred one-shot learning towards efficient neural architecture search. In International Conference on Machine Learning, pages 35642–35654. PMLR, 2023.
- [8] Xiu Su, Shan You, Jiyang Xie, Mingkai Zheng, Fei Wang, Chen Qian, Changshui Zhang, Xiaogang Wang, and Chang Xu. Vitas: Vision transformer architecture search. In European Conference on Computer Vision, pages 139–157. Springer, 2022.
- [9] Chen Tang, Li Lyna Zhang, Huiqiang Jiang, Jiahang Xu, Ting Cao, Quanlu Zhang, Yuqing Yang, Zhi Wang, and Mao Yang. Elasticvit: Conflict-aware supernet training for deploying fast vision transformer on diverse mobile devices. In Proceedings of the IEEE/CVF International Conference on Computer Vision, pages 5829–5840, 2023.
- [10] Qinqin Zhou, Kekai Sheng, Xiawu Zheng, Ke Li, Xing Sun, Yonghong Tian, Jie Chen, and Rongrong Ji. Training-free transformer architecture search. In Proceedings of the IEEE/CVF Conference on Computer Vision and Pattern Recognition, pages 10894–10903, 2022.
- [11] Qinqin Zhou, Kekai Sheng, Xiawu Zheng, Ke Li, Yonghong Tian, Jie Chen, and Rongrong Ji. Training-free transformer architecture search with zero-cost proxy guided evolution. IEEE Transactions on Pattern Analysis and Machine Intelligence, 2024.
- [12] Chengyue Gong and Dilin Wang. Nasvit: Neural architecture search for efficient vision transformers with gradient conflict-aware supernet training. ICLR Proceedings 2022, 2022.
- [13] Srinadh Bhojanapalli, Ayan Chakrabarti, Daniel Glasner, Daliang Li, Thomas Unterthiner, and Andreas Veit. Understanding Robustness of Transformers for Image Classification. In Proceedings of the IEEE/CVF International Conference on Computer Vision (ICCV), pages 10231–10241, oct 2021.
- [14] Shiyu Tang, Ruihao Gong, Yan Wang, Aishan Liu, Jiakai Wang, Xinyun Chen, Fengwei Yu, Xianglong Liu, Dawn Song, Alan Yuille, et al. Robustart: Benchmarking robustness on architecture design and training techniques. arXiv preprint arXiv:2109.05211, 2021.
- [15] Salman Rahman and Wonkwon Lee. Out of distribution performance of state of art vision model. arXiv preprint arXiv:2301.10750, 2023.
- [16] Minghao Chen, Kan Wu, Bolin Ni, Houwen Peng, Bei Liu, Jianlong Fu, Hongyang Chao, and Haibin Ling. Searching the search space of vision transformer. Advances in Neural Information Processing Systems, 34:8714–8726, 2021.
- [17] Zimian Wei, Peijie Dong, Zheng Hui, Anggeng Li, Lujun Li, Menglong Lu, Hengyue Pan, and Dongsheng Li. Auto-prox: Training-free vision transformer architecture search via automatic proxy discovery. In Proceedings of the AAAI Conference on Artificial Intelligence, number 14, pages 15814–15822, 2024.
- [18] Mingyu Ding, Xiaochen Lian, Linjie Yang, Peng Wang, Xiaojie Jin, Zhiwu Lu, and Ping Luo. Hr-nas: Searching efficient high-resolution neural architectures with lightweight transformers. In Proceedings of the IEEE/CVF conference on computer vision and pattern recognition, pages 2982–2992, 2021.
- [19] Jihao Liu, Xin Huang, Guanglu Song, Hongsheng Li, and Yu Liu. Uninet: Unified architecture search with convolution, transformer, and mlp. In European Conference on Computer Vision, pages 33–49. Springer, 2022.
- [20] Jiahui Yu, Pengchong Jin, Hanxiao Liu, Gabriel Bender, Pieter-Jan Kindermans, Mingxing Tan, Thomas Huang, Xiaodan Song, Ruoming Pang, and Quoc Le. Bignas: Scaling up neural architecture search with big single-stage models. In Computer Vision–ECCV 2020: 16th European Conference, Glasgow, UK, August 23–28, 2020, Proceedings, Part VII 16, pages 702–717. Springer, 2020.
- [21] Zi-Hang Jiang, Qibin Hou, Li Yuan, Daquan Zhou, Yujun Shi, Xiaojie Jin, Anran Wang, and Jiashi Feng. All tokens matter: Token labeling for training better vision transformers. Advances in neural information processing systems, 34:18590–18602, 2021.
- [22] Chun-Fu Richard Chen, Quanfu Fan, and Rameswar Panda. Crossvit: Cross-attention multi-scale vision transformer for image classification. In Proceedings of the IEEE/CVF international conference on computer vision, pages 357–366, 2021.
- [23] Hanting Chen, Yunhe Wang, Tianyu Guo, Chang Xu, Yiping Deng, Zhenhua Liu, Siwei Ma, Chunjing Xu, Chao Xu, and Wen Gao. Pre-trained image processing transformer. In Proceedings of the IEEE/CVF conference on computer vision and pattern recognition, pages 12299–12310, 2021.
- [24] Dan Hendrycks and Thomas Dietterich. Benchmarking neural network robustness to common corruptions and perturbations. arXiv preprint arXiv:1903.12261, 2019.
- [25] Dan Hendrycks, Kevin Zhao, Steven Basart, Jacob Steinhardt, and Dawn Song. Natural adversarial examples. In Proceedings of the IEEE/CVF conference on computer vision and pattern recognition, pages 15262–15271, 2021.
- [26] Chenshuang Zhang, Fei Pan, Junmo Kim, In So Kweon, and Chengzhi Mao. Imagenet-d: Benchmarking neural network robustness on diffusion synthetic object. arXiv preprint arXiv:2403.18775, 2024.
- [27] Dan Hendrycks, Steven Basart, Norman Mu, Saurav Kadavath, Frank Wang, Evan Dorundo, Rahul Desai, Tyler Zhu, Samyak Parajuli, Mike Guo, et al. The many faces of robustness: A critical analysis of out-of-distribution generalization. In Proceedings of the IEEE/CVF international conference on computer vision, pages 8340–8349, 2021.
- [28] Haohan Wang, Songwei Ge, Zachary Lipton, and Eric P Xing. Learning robust global representations by penalizing local predictive power. Advances in Neural Information Processing Systems, 32, 2019.
- [29] Robert Geirhos, Patricia Rubisch, Claudio Michaelis, Matthias Bethge, Felix A Wichmann, and Wieland Brendel. Imagenet-trained cnns are biased towards texture; increasing shape bias improves accuracy and robustness. arXiv preprint arXiv:1811.12231, 2018.
- [30] Haoyue Bai, Yifei Ming, Julian Katz-Samuels, and Yixuan Li. HYPO: Hyperspherical out-of-distribution generalization. In The Twelfth International Conference on Learning Representations, 2024.
- [31] Martin Arjovsky, Léon Bottou, Ishaan Gulrajani, and David Lopez-Paz. Invariant risk minimization. arXiv preprint arXiv:1907.02893, 2019.
- [32] Muhammad Ghifary, W Bastiaan Kleijn, Mengjie Zhang, and David Balduzzi. Domain generalization for object recognition with multi-task autoencoders. In Proceedings of the IEEE international conference on computer vision, pages 2551–2559, 2015.
- [33] Divyat Mahajan, Shruti Tople, and Amit Sharma. Domain generalization using causal matching. In International conference on machine learning, pages 7313–7324. PMLR, 2021.
- [34] Krikamol Muandet, David Balduzzi, and Bernhard Schölkopf. Domain generalization via invariant feature representation. In International conference on machine learning, pages 10–18. PMLR, 2013.
- [35] Alexandre Rame, Corentin Dancette, and Matthieu Cord. Fishr: Invariant gradient variances for out-of-distribution generalization. In International Conference on Machine Learning, pages 18347–18377. PMLR, 2022.
- [36] Mateo Rojas-Carulla, Bernhard Schölkopf, Richard Turner, and Jonas Peters. Invariant models for causal transfer learning. Journal of Machine Learning Research, 19(36):1–34, 2018.
- [37] Yuge Shi, Jeffrey Seely, Philip HS Torr, N Siddharth, Awni Hannun, Nicolas Usunier, and Gabriel Synnaeve. Gradient matching for domain generalization. arXiv preprint arXiv:2104.09937, 2021.
- [38] Shiori Sagawa, Pang Wei Koh, Tatsunori B Hashimoto, and Percy Liang. Distributionally robust neural networks for group shifts: On the importance of regularization for worst-case generalization. arXiv preprint arXiv:1911.08731, 2019.
- [39] Kaiyang Zhou, Yongxin Yang, Timothy Hospedales, and Tao Xiang. Learning to generate novel domains for domain generalization. In Computer Vision–ECCV 2020: 16th European Conference, Glasgow, UK, August 23–28, 2020, Proceedings, Part XVI 16, pages 561–578. Springer, 2020.
- [40] Yimeng Chen, Tianyang Hu, Fengwei Zhou, Zhenguo Li, and Zhi-Ming Ma. Explore and exploit the diverse knowledge in model zoo for domain generalization. In International Conference on Machine Learning, pages 4623–4640. PMLR, 2023.
- [41] Alexandre Ramé, Kartik Ahuja, Jianyu Zhang, Matthieu Cord, Léon Bottou, and David Lopez-Paz. Model ratatouille: Recycling diverse models for out-of-distribution generalization. In International Conference on Machine Learning, pages 28656–28679. PMLR, 2023.
- [42] Jungwuk Park, Dong-Jun Han, Soyeong Kim, and Jaekyun Moon. Test-time style shifting: Handling arbitrary styles in domain generalization. In International Conference on Machine Learning, pages 27114–27131. PMLR, 2023.
- [43] Liang Chen, Yong Zhang, Yibing Song, Ying Shan, and Lingqiao Liu. Improved test-time adaptation for domain generalization. In Proceedings of the IEEE/CVF Conference on Computer Vision and Pattern Recognition, pages 24172–24182, 2023.
- [44] Hyeonseob Nam, HyunJae Lee, Jongchan Park, Wonjun Yoon, and Donggeun Yoo. Reducing domain gap by reducing style bias. In Proceedings of the IEEE/CVF Conference on Computer Vision and Pattern Recognition, pages 8690–8699, 2021.
- [45] Liang Chen, Yong Zhang, Yibing Song, Lingqiao Liu, and Jue Wang. Self-supervised learning of adversarial example: Towards good generalizations for deepfake detection. In Proceedings of the IEEE/CVF conference on computer vision and pattern recognition, pages 18710–18719, 2022.
- [46] Daehee Kim, Youngjun Yoo, Seunghyun Park, Jinkyu Kim, and Jaekoo Lee. Selfreg: Self-supervised contrastive regularization for domain generalization. In Proceedings of the IEEE/CVF International Conference on Computer Vision, pages 9619–9628, 2021.
- [47] Pan Li, Da Li, Wei Li, Shaogang Gong, Yanwei Fu, and Timothy M Hospedales. A simple feature augmentation for domain generalization. In Proceedings of the IEEE/CVF International Conference on Computer Vision, pages 8886–8895, 2021.
- [48] Kaiyang Zhou, Yongxin Yang, Yu Qiao, and Tao Xiang. Domain generalization with mixstyle. arXiv preprint arXiv:2104.02008, 2021.
- [49] Qinwei Xu, Ruipeng Zhang, Ya Zhang, Yanfeng Wang, and Qi Tian. A fourier-based framework for domain generalization. In Proceedings of the IEEE/CVF conference on computer vision and pattern recognition, pages 14383–14392, 2021.
- [50] Shen Yan, Huan Song, Nanxiang Li, Lincan Zou, and Liu Ren. Improve unsupervised domain adaptation with mixup training. arXiv preprint arXiv:2001.00677, 2020.
- [51] Yingjun Du, Xiantong Zhen, Ling Shao, and Cees GM Snoek. Metanorm: Learning to normalize few-shot batches across domains. In International Conference on Learning Representations, 2020.
- [52] Yang Shu, Zhangjie Cao, Chenyu Wang, Jianmin Wang, and Mingsheng Long. Open domain generalization with domain-augmented meta-learning. In Proceedings of the IEEE/CVF conference on computer vision and pattern recognition, pages 9624–9633, 2021.
- [53] Shiori Sagawa, Aditi Raghunathan, Pang Wei Koh, and Percy Liang. An investigation of why overparameterization exacerbates spurious correlations. In International Conference on Machine Learning, pages 8346–8356. PMLR, 2020.
- [54] Jonathan Frankle and Michael Carbin. The lottery ticket hypothesis: Finding sparse, trainable neural networks. arXiv preprint arXiv:1803.03635, 2018.
- [55] Dinghuai Zhang, Kartik Ahuja, Yilun Xu, Yisen Wang, and Aaron Courville. Can subnetwork structure be the key to out-of-distribution generalization? In International Conference on Machine Learning, pages 12356–12367. PMLR, 2021.
- [56] Geon Yeong Park, Sangmin Lee, Sang Wan Lee, and Jong Chul Ye. Training debiased subnetworks with contrastive weight pruning. In Proceedings of the IEEE/CVF Conference on Computer Vision and Pattern Recognition, pages 7929–7938, 2023.
- [57] Haoyue Bai, Fengwei Zhou, Lanqing Hong, Nanyang Ye, S-H Gary Chan, and Zhenguo Li. Nas-ood: Neural architecture search for out-of-distribution generalization. In Proceedings of the IEEE/CVF International Conference on Computer Vision, pages 8320–8329, 2021.
- [58] Dilin Wang, Chengyue Gong, Meng Li, Qiang Liu, and Vikas Chandra. Alphanet: Improved training of supernets with alpha-divergence. In International Conference on Machine Learning, pages 10760–10771. PMLR, 2021.
- [59] Dilin Wang, Meng Li, Chengyue Gong, and Vikas Chandra. Attentivenas: Improving neural architecture search via attentive sampling. In Proceedings of the IEEE/CVF conference on computer vision and pattern recognition, pages 6418–6427, 2021.
- [60] Tangyu Jiang, Haodi Wang, and Rongfang Bie. Meco: Zero-shot nas with one data and single forward pass via minimum eigenvalue of correlation. Advances in Neural Information Processing Systems, 36, 2024.
- [61] Steffen Jung, Jovita Lukasik, and Margret Keuper. Neural architecture design and robustness: A dataset. arXiv preprint arXiv:2306.06712, 2023.
- [62] Hyeonjeong Ha, Minseon Kim, and Sung Ju Hwang. Generalizable lightweight proxy for robust nas against diverse perturbations. Advances in Neural Information Processing Systems, 36, 2024.
- [63] Yongtao Wu, Fanghui Liu, Carl-Johann Simon-Gabriel, Grigorios G Chrysos, and Volkan Cevher. Robust nas under adversarial training: benchmark, theory, and beyond. arXiv preprint arXiv:2403.13134, 2024.
- [64] Boyu Chen, Peixia Li, Chuming Li, Baopu Li, Lei Bai, Chen Lin, Ming Sun, Junjie Yan, and Wanli Ouyang. Glit: Neural architecture search for global and local image transformer. In Proceedings of the IEEE/CVF International Conference on Computer Vision, pages 12–21, 2021.
- [65] Mingyang Zhang, Xinyi Yu, Haodong Zhao, and Linlin Ou. Shiftnas: Improving one-shot nas via probability shift. In Proceedings of the IEEE/CVF International Conference on Computer Vision, pages 5919–5928, 2023.
- [66] Shiguang Wang, Tao Xie, Jian Cheng, Xingcheng Zhang, and Haijun Liu. Mdl-nas: A joint multi-domain learning framework for vision transformer. In Proceedings of the IEEE/CVF Conference on Computer Vision and Pattern Recognition, pages 20094–20104, 2023.
- [67] Yaowei Li, Ruijie Quan, Linchao Zhu, and Yi Yang. Efficient multimodal fusion via interactive prompting. In Proceedings of the IEEE/CVF conference on computer vision and pattern recognition, pages 2604–2613, 2023.
- [68] Li Fei-Fei, Jia Deng, and Kai Li. Imagenet: Constructing a large-scale image database. Journal of vision, 9(8):1037–1037, 2009.
- [69] John P Miller, Rohan Taori, Aditi Raghunathan, Shiori Sagawa, Pang Wei Koh, Vaishaal Shankar, Percy Liang, Yair Carmon, and Ludwig Schmidt. Accuracy on the line: on the strong correlation between out-of-distribution and in-distribution generalization. In Marina Meila and Tong Zhang, editors, Proceedings of the 38th International Conference on Machine Learning, volume 139 of Proceedings of Machine Learning Research, pages 7721–7735. PMLR, 18–24 Jul 2021.
- [70] Benjamin Recht, Rebecca Roelofs, Ludwig Schmidt, and Vaishaal Shankar. Do ImageNet classifiers generalize to ImageNet? In Kamalika Chaudhuri and Ruslan Salakhutdinov, editors, Proceedings of the 36th International Conference on Machine Learning, volume 97 of Proceedings of Machine Learning Research, pages 5389–5400. PMLR, 09–15 Jun 2019.
- [71] Damien Teney, Yong Lin, Seong Joon Oh, and Ehsan Abbasnejad. Id and ood performance are sometimes inversely correlated on real-world datasets. In A. Oh, T. Neumann, A. Globerson, K. Saenko, M. Hardt, and S. Levine, editors, Advances in Neural Information Processing Systems, volume 36, pages 71703–71722. Curran Associates, Inc., 2023.
- [72] Florian Wenzel, Andrea Dittadi, Peter Gehler, Carl-Johann Simon-Gabriel, Max Horn, Dominik Zietlow, David Kernert, Chris Russell, Thomas Brox, Bernt Schiele, Bernhard Schölkopf, and Francesco Locatello. Assaying Out-Of-Distribution Generalization in Transfer Learning. In S Koyejo, S Mohamed, A Agarwal, D Belgrave, K Cho, and A Oh, editors, Advances in Neural Information Processing Systems, volume 35, pages 7181–7198. Curran Associates, Inc., 2022.
- [73] Namhoon Lee, Thalaiyasingam Ajanthan, and Philip HS Torr. Snip: Single-shot network pruning based on connection sensitivity. arXiv preprint arXiv:1810.02340, 2018.
- [74] Chaoqi Wang, Guodong Zhang, and Roger Grosse. Picking winning tickets before training by preserving gradient flow. arXiv preprint arXiv:2002.07376, 2020.
- [75] Ramtin Hosseini, Xingyi Yang, and Pengtao Xie. Dsrna: Differentiable search of robust neural architectures. In Proceedings of the IEEE/CVF Conference on Computer Vision and Pattern Recognition, pages 6196–6205, 2021.
- [76] Maurice G Kendall. A new measure of rank correlation. Biometrika, 30(1/2):81–93, 1938.
- [77] Jiawang Bai, Li Yuan, Shu-Tao Xia, Shuicheng Yan, Zhifeng Li, and Wei Liu. Improving vision transformers by revisiting high-frequency components. In European Conference on Computer Vision, pages 1–18. Springer, 2022.
- [78] Rulin Shao, Zhouxing Shi, Jinfeng Yi, Pin-Yu Chen, and Cho-Jui Hsieh. On the adversarial robustness of vision transformers. arXiv preprint arXiv:2103.15670, 2021.
- [79] Paul Gavrikov and Janis Keuper. Can biases in imagenet models explain generalization? In Proceedings of the IEEE/CVF Conference on Computer Vision and Pattern Recognition, pages 22184–22194, 2024.
- [80] Haohan Wang, Xindi Wu, Zeyi Huang, and Eric P Xing. High-frequency component helps explain the generalization of convolutional neural networks. In Proceedings of the IEEE/CVF conference on computer vision and pattern recognition, pages 8684–8694, 2020.
- [81] Xun Huang and Serge Belongie. Arbitrary style transfer in real-time with adaptive instance normalization. In Proceedings of the IEEE international conference on computer vision, pages 1501–1510, 2017.
- [82] Robin Rombach, Andreas Blattmann, Dominik Lorenz, Patrick Esser, and Björn Ommer. High-resolution image synthesis with latent diffusion models. In Proceedings of the IEEE/CVF conference on computer vision and pattern recognition, pages 10684–10695, 2022.
6 Appendix Overview
This appendix provides supplementary information that are not included in the main paper due to space limitations.
7 Limitations and Broader Impact
Given the extensive set of experiments presented in this work, the evaluation of training-free NAS proxies is significantly dependent on the initial robust benchmarks, which can be costly and resource intensive to create in the first place.
As this work studies the robustness of ViT architectures to OoD shift, we could demonstrate that carefully designed ViT architectures can significantly enhance OoD generalization. Our approach focuses on evaluating training-free NAS for ViT architectures, offering valuable insights that can complement research exploring the effects of robust architectural design. Finally, we publicly release our OoD-NAS-ViT and code base for future research.
8 Analysis on Human-design ViT Search Space
Our findings on embedding dimensions are derived from analysing ViT architectures sampled through AutoFormer. To further validate these results, we also investigate the impact of ViT structural attributes on OoD generalisation within the human-designed ViT search space [1].
| Architecture | Configuration |
|
|
OoD Acc | wrt Latency | wrt #Param | |||||||
| Embed Dim | #Head | Depth | MLP Ratio | ||||||||||
| Vanila | 768 | 12 | 12 | 3072 | 105.00 | 87.53 | 41.58 | - | - | ||||
|
840 | 12 | 12 | 3072 | 113.32 | 98.64 | 48.28 | 0.8053 | 0.6032 | ||||
|
768 | 128 | 12 | 3072 | 120.44 | 87.53 | 43.47 | 0.1224 | - | ||||
|
768 | 12 | 16 | 3072 | 137.36 | 115.88 | 37.80 | -0.1168 | -0.1333 | ||||
|
768 | 12 | 12 | 3840 | 120.05 | 101.70 | 42.61 | 0.0685 | 0.0728 | ||||
Experimental setup. We begin with the vanilla ViT-B-32 architecture [1], varying each structural attribute independently. For the altered ViT architectures, we increase these attributes to ensure that the capacities of the altered models remain comparable. Each architecture is trained on IN-100 and evaluated on IN-R.
Results. As shown in Tab. 8.1, the results further confirms our findings that embedding dimension is the most important ViT structural attribute to OoD generalisation.
9 Detailed description of the Frequency Analysis Setup
We adapt the experiment from [77] to verify our hypothesis. We quantify how the amount of HFC learnt in the ViTs changes if the embedding dimension of ViTs changes. Particularly, we first filter HFC from testing images of IN-R following [77, 79, 80] then evaluate the performance of 1000 ViTs in our search space on IN-R with filtering data points. Following [80] to generate HFC-preserving images, we first convert original images to FFT images. Then, we filter HFC by hyper-parameter radius r (r is set to 4, 8, 12, 16 in our experiments). In a nutshell, the higher the r, the lesser HFC.
10 The details for our benchmark OoD-ViT-NAS
10.1 Detailed description of Autoformer Search Space
We strictly follow the search space in Autoformer [6] to construct our OoD-ViT-NAS. The variable factors of basic transformer blocks include the embedding dimension, Q-K-V dimension, number of heads, MLP ratio, and network depth. The detailed search spaces are illustrated in Tab. 10.2
| Embedding Dim | Q-K-V Dim | MLP Ratio | Head Num | Depth Num | ||
| Supernet-Tiny | Max | 192 | 192 | 3.5 | 3 | 12 |
| Min | 240 | 256 | 4 | 4 | 14 | |
| Step | 24 | 64 | 0.5 | 1 | 1 | |
| Supernet-Small | Max | 320 | 320 | 3 | 5 | 12 |
| Min | 448 | 448 | 4 | 7 | 14 | |
| Step | 64 | 64 | 0.5 | 1 | 1 | |
| Supernet-Base | Max | 528 | 512 | 3 | 8 | 14 |
| Min | 624 | 640 | 4 | 10 | 16 | |
| Step | 48 | 64 | 0.5 | 1 | 1 |
10.2 Detailed description of OoD Datasets
To construct OoD-ViT-NAS benchmark, we evaluate 3,000 architectures within our benchmark on common and most SOTA OoD datasets, including:
-
•
ImageNet-1k [68]: This is a large and common image dataset widely used in computer vision research. It contains over 1.3 million labeled high-resolution images belonging to 1,000 different object categories (classes). Each image is labeled with a class (e.g., "cat", "airplane", "chair").
-
•
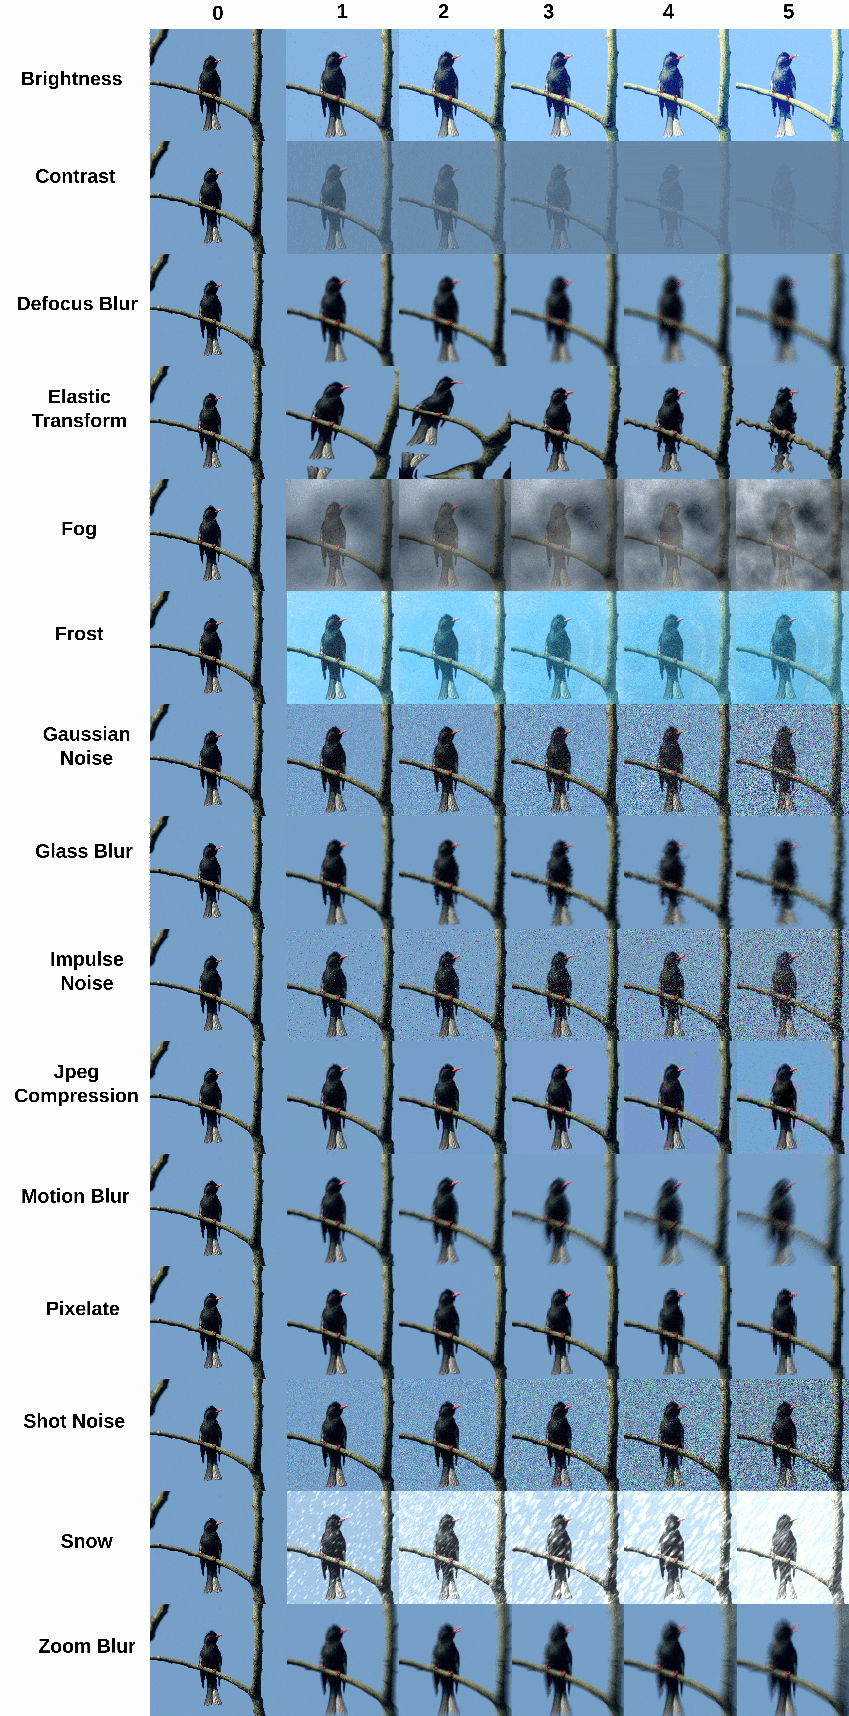
ImageNet-C [24]: This dataset builds upon the original ImageNet test set by applied algorithmically corruptions. These corruptions simulate real-world factors that can deviate data from the training set, such as blur, noise, digital, and weather effects. ImageNet-C offers a comprehensive OoD scenarios with 15 different corruption types, each with 5 severity levels, resulting in a total of 75 unique OoD setups.
-
•
ImageNet-P [24]: This benchmark is constructed similarly to Imagnet-C. The difference is that ImageNet-P utilizes perturbation sequences generated from each ImageNet validation image.
-
•
ImageNet-A [25]: This dataset is a real-world OoD scenarios by leveraging adversarially filtered images that are highly likely to fool current image classifiers. ImageNet-A selects a 200 classes out of 1,000 classes from ImageNet-1K so that errors among these 200 classes would be considered egregious [68].
-
•
ImageNet-O [25]: Similar to ImageNet-A, this dataset includes adversarially filtered examples specifically designed to challenge OoD detectors trained on ImageNet. ImageNet-O selects a 200 classes out of 1,000 classes from ImageNet-1K.
-
•
ImageNet-R [27]: This dataset is a rendition of ImageNet, containing images with manipulated textures and local image statistics.
-
•
ImageNet-Sketch [28]: This dataset introduces a unique OoD challenge by providing black-and-white sketch images corresponding to the ImageNet-1K test set. This significant divergence in visual representation tests a model’s ability to generalize beyond photographic data.
-
•
Stylized ImageNet [29]: This dataset consists of a stylized version of ImageNet generated through techniques like AdaIN [81] style transfer, resulting in variations like greyscale, silhouettes, and edges. This dataset assesses a model’s ability to handle data with different artistic interpretations.
-
•
ImageNet-D [26]: This dataset is a variation of ImageNet generated through diffusion models. These models aim at creating images with rich diversity in backgrounds, textures, and materials.

We visualize a few examples of OoD datasets in Fig. 10.1. For ImageNet-C, we provide the visualization of different OoD shift severity in Fig. 10.3.
11 Overview of using the OoD-NAS-ViT benchmark
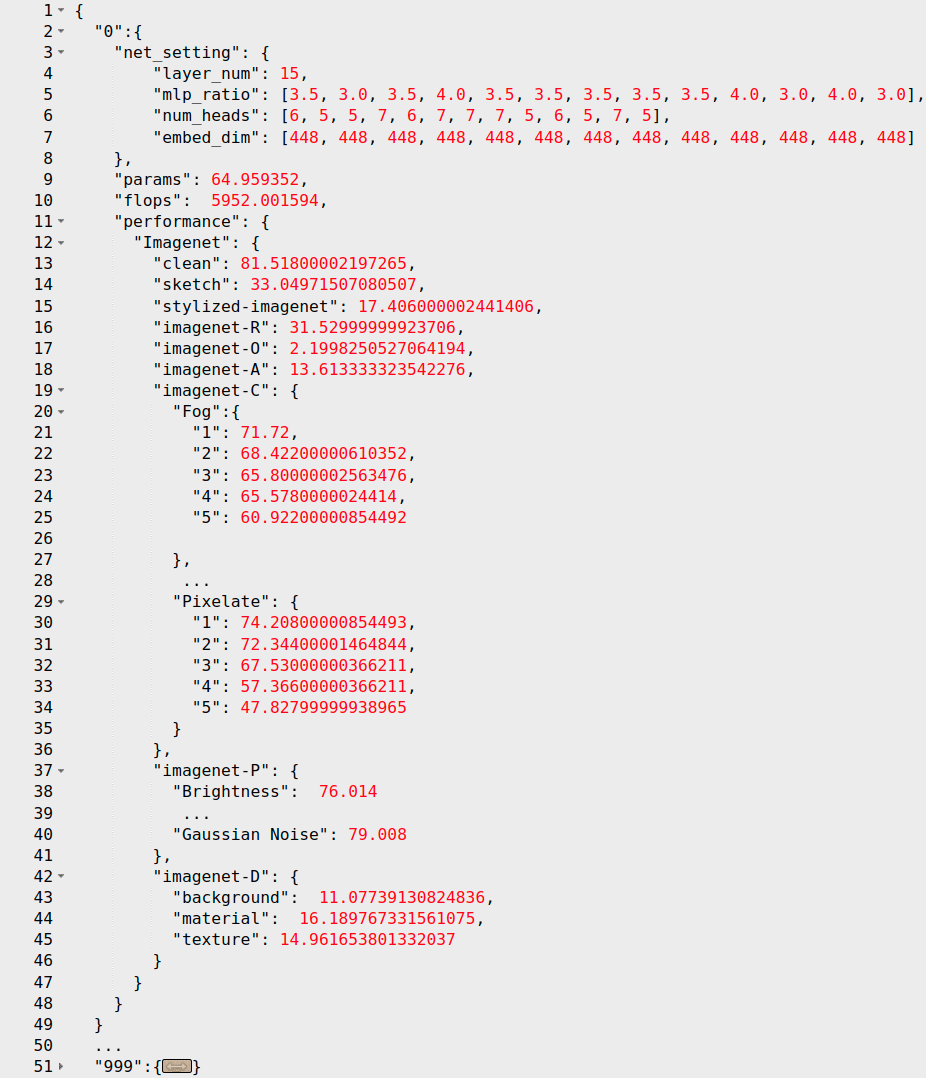
Our OoD-NAS-ViT benchmark consists of multiple json individual files. Each file includes the evaluation of one search space (Autoformer-Tiny/Small/Base [6]) on 8 most common and state-of-the-art (SOTA) OoD datasets: ImageNet-C [24], ImageNet-A [25], ImageNet-O [25], ImageNet-P [24], ImageNet-D [26], ImageNet-R [27], ImageNet-Sketch [28], and Stylized ImageNet [29] (Sec. 3).
We further provide a merged json file for each search space. The structure of each merged json is illustrated as in Fig. 11.4. Specifically, each merged json file includes 1,000 ViT architectures denoted by the index. Each architecture consists of:
-
•
net_setting: ViT structural attributes information:
-
–
layer_num: network depth
-
–
mlp_ration: MLP ration each layer, can be varied among layers
-
–
num_heads: number of attention heads each layer, can be varied among layers
-
–
embed_dim: embedding dimension heads each layer, fixed among layers
-
–
-
•
params: number of parameters
-
•
flops: number of flops
-
•
performance: performance on different dataset:
Imagenet: performance on IN-based datasets:
-
–
clean: performance on IN
-
–
sketch: performance on IN
-
–
stylized-imagenet: performance on IN
-
–
imagenet-R: performance on IN
-
–
imagenet-O: performance on IN
-
–
imagenet-A: performance on IN-A
-
–
corruption: performance on IN-C
-
*
Fog: performance on one out of 15 corruption in IN-C: Fog, Gaussian Noise, Fog, Snow, Elastic Transform, Jpeg Compression, Frost, Motion Blur, Brightness, Defocus Blur, Glass Blur, Impulse Noise, Shot Noise, Zoom Blur, Constrast, Pixelate
-
·
1: performance at OoD shift severity level 1. There are total 5 level of OoD shift severity for each corruption in IN-C
-
·
-
*
-
–
corruption_P: performance on IN-P
-
*
Brightness: performance on one out of 10 corruption in IN-P: Brightness, Motion Blur, Rotate, Scale, Shot Noise, Snow, Tilt, Translate, Zoom Blur, Gaussian Noise
-
*
-
–
imagenet-D: performance on IN-D
-
*
background: performance on one out of 3 nuisances in IN-D: background, material, texture
-
*
-
–
With our the provided a merged json file for each search space, we can easily retrieve the OoD shift performance of various ViT architectures and their OoD performance on 8 prevelent and SOTA OoD datasets.
12 Additional results on the analysis of OoD accuracy range
In the main paper, we visualize OoD accuracy ranges and ID accuracy range for reference. In this Appx. section, we provide the visualization of the remaining OoD accuracy ranges. The results are illustrated in Fig. 12.5. Our observation on other OoD accuracy ranges are generally consistent with our findings in Sec. 4.1.
13 Additional results on the analysis of the correlation between ID and OoD accuracy
In the main paper, we provide the Kendall correlation between ID accuracy and 8 OoD datasets. For some OoD datasets with different OoD shift types, we average the correlation with ID accuracy of different OoD shift types to obtain average correlation with ID accuracy for that OoD dataset. In this Appx. section, we provide the detailed correlations with ID accuracy of each OoD shifts in such OoD data. Specifically, we provide the detailed correlation for IN-C, IN-D, and IN-P in Fig. 13.7, Fig. 13.8, and Fig. 13.9, respectively.
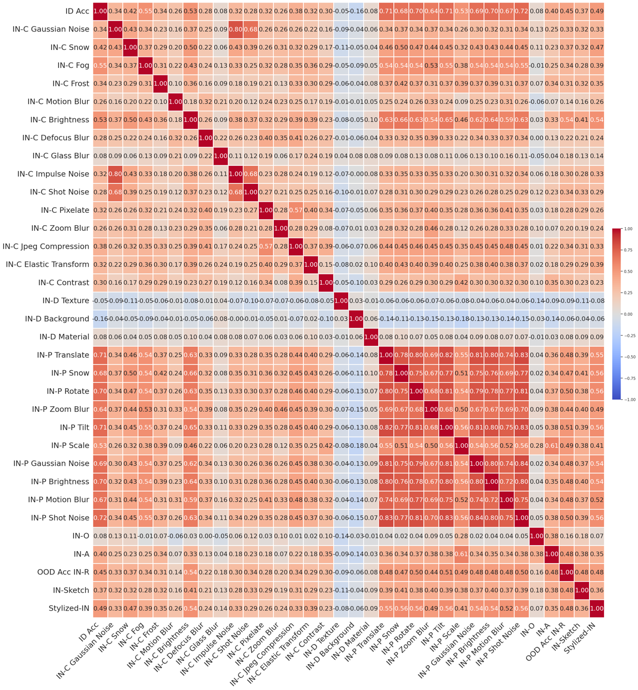
Furthermore, we provide a comprehensive correlation between OoD accuracy and ID accuracy in Fig. 13.10.
14 Additional results on the analysis of OoD Performance of Pareto architectures for ID
In the main paper, due to space constraints, we only provide the Pareto analysis results on a few representative OoD datasets. In this Appx. section, we provide additional results on this Pareto architecture analysis in Fig. 18.24, 18.19, 18.20, 18.21, 18.22, 18.23. In the following scatter plots, blue dots represent architectures in the search space, while red dots represent the ID Pareto architectures.
15 Additional Results for Benchmarking Zero-cost Proxies
In the main submission, we provides the comparison of Kendall ranking correlation between the ID/OoD accuracies and the zero-cost proxy values across all OoD datasets. In this section, we provides the correlation for each dataset for a detailed observation. The results can be found in Tab. 15.3, 15.4, 15.5, 15.6, 15.7, 15.8, 15.9, 15.10. Our observations on individual OoD datasets are consistent with our findings in Sec. 4.3.
| Training-free NAS | Originally Proposed For | Correlation with ID Acc | Correlation with OoD Acc | |
| Performance | Architecture | |||
| Grasp [74] | ID Acc | CNNs | 0.1490 0.1951 | 0.1179 0.1713 |
| SNIP [73] | ID Acc | CNNs | 0.3750 0.3023 | 0.2371 0.2579 |
| MeCo [60] | ID Acc | CNNs | 0.1440 0.2371 | 0.0392 0.1206 |
| CroZe [62] | Adv Robustness | CNNs | 0.3823 0.3046 | 0.2356 0.2593 |
| Jacobian [75] | Adv Robustness | CNNs | 0.1053 0.1509 | 0.0894 0.1369 |
| DSS [10] | ID Acc | ViTs | 0.4165 0.3461 | 0.2454 0.2630 |
| AutoProx-A [17] | ID Acc | ViTs | 0.4023 0.3827 | 0.2271 0.2758 |
| #Param | - | - | 0.4607 0.3318 | 0.2651 0.2546 |
| #Flops | - | - | 0.4705 0.3391 | 0.2656 0.2572 |
| Training-free NAS | Originally Proposed For | Correlation with ID Acc | Correlation with OoD Acc | |
| Performance | Architecture | |||
| Grasp [74] | ID Acc | CNNs | 0.1490 0.1951 | 0.1373 0.1907 |
| SNIP [73] | ID Acc | CNNs | 0.3750 0.3023 | 0.3652 0.3306 |
| MeCo [60] | ID Acc | CNNs | 0.1440 0.2371 | 0.1324 0.2240 |
| CroZe [62] | Adv Robustness | CNNs | 0.3823 0.3046 | 0.3698 0.3307 |
| Jacobian [75] | Adv Robustness | CNNs | 0.1053 0.1509 | 0.1142 0.1590 |
| DSS [10] | ID Acc | ViTs | 0.4165 0.3461 | 0.4128 0.3621 |
| AutoProx-A [17] | ID Acc | ViTs | 0.4023 0.3827 | 0.3975 0.3888 |
| #Param | - | - | 0.4607 0.3318 | 0.4487 0.3475 |
| #Flops | - | - | 0.4705 0.3391 | 0.4592 0.3547 |
| Training-free NAS | Originally Proposed For | Correlation with ID Acc | Correlation with OoD Acc | |
| Performance | Architecture | |||
| Grasp [74] | ID Acc | CNNs | 0.1490 0.1951 | -0.0306 0.0307 |
| SNIP [73] | ID Acc | CNNs | 0.3750 0.3023 | -0.0863 0.0887 |
| MeCo [60] | ID Acc | CNNs | 0.1440 0.2371 | -0.0518 0.0486 |
| CroZe [62] | Adv Robustness | CNNs | 0.3823 0.3046 | -0.0818 0.0906 |
| Jacobian [75] | Adv Robustness | CNNs | 0.1053 0.1509 | -0.0090 0.0318 |
| DSS [10] | ID Acc | ViTs | 0.4165 0.3461 | -0.0743 0.1131 |
| AutoProx-A [17] | ID Acc | ViTs | 0.4023 0.3827 | -0.0742 0.1066 |
| #Param | - | - | 0.4607 0.3318 | -0.0837 0.1117 |
| #Flops | - | - | 0.4705 0.3391 | -0.0827 0.1133 |
| Training-free NAS | Originally Proposed For | Correlation with ID Acc | Correlation with OoD Acc | |
| Performance | Architecture | |||
| Grasp [74] | ID Acc | CNNs | 0.1490 0.1951 | 0.1413 0.1854 |
| SNIP [73] | ID Acc | CNNs | 0.3750 0.3023 | 0.3175 0.2658 |
| MeCo [60] | ID Acc | CNNs | 0.1440 0.2371 | 0.0937 0.1739 |
| CroZe [62] | Adv Robustness | CNNs | 0.3823 0.3046 | 0.3091 0.2620 |
| Jacobian [75] | Adv Robustness | CNNs | 0.1053 0.1509 | 0.1017 0.1442 |
| DSS [10] | ID Acc | ViTs | 0.4165 0.3461 | 0.3800 0.3294 |
| AutoProx-A [17] | ID Acc | ViTs | 0.4023 0.3827 | 0.3619 0.3573 |
| #Param | - | - | 0.4607 0.3318 | 0.3899 0.3004 |
| #Flops | - | - | 0.4705 0.3391 | 0.3905 0.3094 |
| Training-free NAS | Originally Proposed For | Correlation with ID Acc | Correlation with OoD Acc | |
| Performance | Architecture | |||
| Grasp [74] | ID Acc | CNNs | 0.1490 0.1951 | 0.1395 0.2299 |
| SNIP [73] | ID Acc | CNNs | 0.3750 0.3023 | 0.3434 0.3696 |
| MeCo [60] | ID Acc | CNNs | 0.1440 0.2371 | 0.0896 0.1112 |
| CroZe [62] | Adv Robustness | CNNs | 0.3823 0.3046 | 0.3610 0.3616 |
| Jacobian [75] | Adv Robustness | CNNs | 0.1053 0.1509 | 0.0871 0.1872 |
| DSS [10] | ID Acc | ViTs | 0.4165 0.3461 | 0.3885 0.4021 |
| AutoProx-A [17] | ID Acc | ViTs | 0.4023 0.3827 | 0.3599 0.3939 |
| #Param | - | - | 0.4607 0.3318 | 0.4317 0.4013 |
| #Flops | - | - | 0.4705 0.3391 | 0.4060 0.3917 |
| Training-free NAS | Originally Proposed For | Correlation with ID Acc | Correlation with OoD Acc | |
| Performance | Architecture | |||
| Grasp [74] | ID Acc | CNNs | 0.1490 0.1951 | 0.1435 0.1956 |
| SNIP [73] | ID Acc | CNNs | 0.3750 0.3023 | 0.3576 0.3416 |
| MeCo [60] | ID Acc | CNNs | 0.1440 0.2371 | 0.1224 0.1820 |
| CroZe [62] | Adv Robustness | CNNs | 0.3823 0.3046 | 0.3751 0.3342 |
| Jacobian [75] | Adv Robustness | CNNs | 0.1053 0.1509 | 0.0935 0.1518 |
| DSS [10] | ID Acc | ViTs | 0.4165 0.3461 | 0.4364 0.4047 |
| AutoProx-A [17] | ID Acc | ViTs | 0.4023 0.3827 | 0.4164 0.4027 |
| #Param | - | - | 0.4607 0.3318 | 0.4773 0.4179 |
| #Flops | - | - | 0.4705 0.3391 | 0.4507 0.4028 |
| Training-free NAS | Originally Proposed For | Correlation with ID Acc | Correlation with OoD Acc | |
| Performance | Architecture | |||
| Grasp [74] | ID Acc | CNNs | 0.1490 0.1951 | 0.1663 0.1483 |
| SNIP [73] | ID Acc | CNNs | 0.3750 0.3023 | 0.4588 0.1477 |
| MeCo [60] | ID Acc | CNNs | 0.1440 0.2371 | 0.2495 0.0180 |
| CroZe [62] | Adv Robustness | CNNs | 0.3823 0.3046 | 0.4642 0.1415 |
| Jacobian [75] | Adv Robustness | CNNs | 0.1053 0.1509 | 0.1050 0.1172 |
| DSS [10] | ID Acc | ViTs | 0.4165 0.3461 | 0.5930 0.1021 |
| AutoProx-A [17] | ID Acc | ViTs | 0.4023 0.3827 | 0.6048 0.0794 |
| #Param | - | - | 0.4607 0.3318 | 0.5923 0.1288 |
| #Flops | - | - | 0.4705 0.3391 | 0.5959 0.1230 |
| Training-free NAS | Originally Proposed For | Correlation with ID Acc | Correlation with OoD Acc | |
| Performance | Architecture | |||
| Grasp [74] | ID Acc | CNNs | 0.1490 0.1951 | 0.1503 0.1638 |
| SNIP [73] | ID Acc | CNNs | 0.3750 0.3023 | 0.3178 0.3219 |
| MeCo [60] | ID Acc | CNNs | 0.1440 0.2371 | 0.1049 0.2860 |
| CroZe [62] | Adv Robustness | CNNs | 0.3823 0.3046 | 0.3277 0.3307 |
| Jacobian [75] | Adv Robustness | CNNs | 0.1053 0.1509 | 0.0911 0.1242 |
| DSS [10] | ID Acc | ViTs | 0.4165 0.3461 | 0.3546 0.3478 |
| AutoProx-A [17] | ID Acc | ViTs | 0.4023 0.3827 | 0.3490 0.3915 |
| #Param | - | - | 0.4607 0.3318 | 0.3583 0.3559 |
| #Flops | - | - | 0.4705 0.3391 | 0.3445 0.3887 |
16 Additional Figures of ViT Structural Attributes: Embedding Dimension
17 Additional Analysis of ViT Structural Attributes on OoD Generalization
17.1 Ablation Study on the Impact of ViT Architectural Attributes to OoD Generalization
In this section, we demonstrate the effectiveness of each ViT architectural attribute on OoD accuracy from the ablation study perspective. All ablation studies are based on 1,000 ViT architectures sampled from Autoformer-Small search space in our OoD-ViT-NAS benchmark. Through our general analysis in Sec. 4.4 in the main and ablation study, we show that the embedding dimension has the highest impact among ViT architectural attributes, while network depth has a slight impact on OoD generalization.
Experimental Setups. We conduct the ablation study on the impact of ViT architectural attributes on OoD generalization. Particularly, for each ablation study of one ViT architectural attribute, we vary that attribute while keeping all other attributes fixed. Then, we compute Kendall’s rank correlation coefficient between each attribute and different OoD shifts. While we can directly adjust the depth and embedding dimension, adjusting MLP_Ration and #Head is challenging. This is because these two attributes for each ViT arch are in the form of a list with depth elements. Each element is selected among 3 choices. This results in a huge combination. To deal with this difficulty, we first compute the means of MLP_Ration/#Head for each architecture. Then, during the ablation study, we explore a range of values for MLP ratio and the number of heads (mean #Head = , mean MLP_Ratio = ) to capture the impact of these more nuanced architectural variations. We note that this range of values is small, allowing us to approximately fix these two attributes.
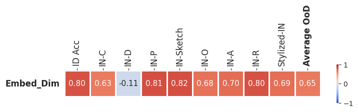
First, we assess the impact of embedding dimension on OoD generalization by fixing the configurations of all other ViT structural attributes (i.e., network depth = 13, mean #Head = , and mean MLP_Ratio = ). The correlation results are shown in Fig. 17.11. We observe an overall positive correlation of 0.65. This further supports our observation in Sec. 4.4 that increasing the embedding dimension generally could lead to better OoD performance across most OoD shifts for these ViT architectures.
To demonstrate how the number of layers (i.e., network depth) in a ViT architecture affects the model’s OoD generalization, we fix other ViT architectural attributes (i.e., Embed_Dim = , mean #Head = , and mean MLP_Ratio = ). The ranking correlation for all architectures between depth and OoD accuracy in Fig. 17.12 suggests a weak correlation between the ViT network depth and OoD accuracy. This observation is consistent with our finding in Sec. 4.4 that the depth has a minimal influence on OoD generalization.
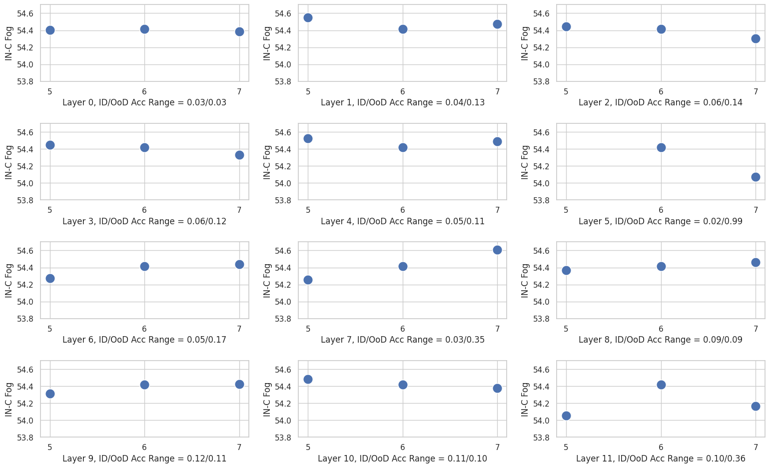
For MLP_Ratio and #Heads, we observe that the rank correlation coefficients of MLP_Ratio and #Heads in Fig. 17.13 and 17.14, respectively, reveals a weak correlation between the #Heads/MLP_Ratio and OoD generalization. This suggests that within the explored range, these two architectural attributes have a non-obvious impact on the model’s OoD generalization. To delve deeper into this observation, Section 17.2 presents a layer-wise analysis of these two architectural attributes in ViT models.
17.2 Layer-Wise Analysis
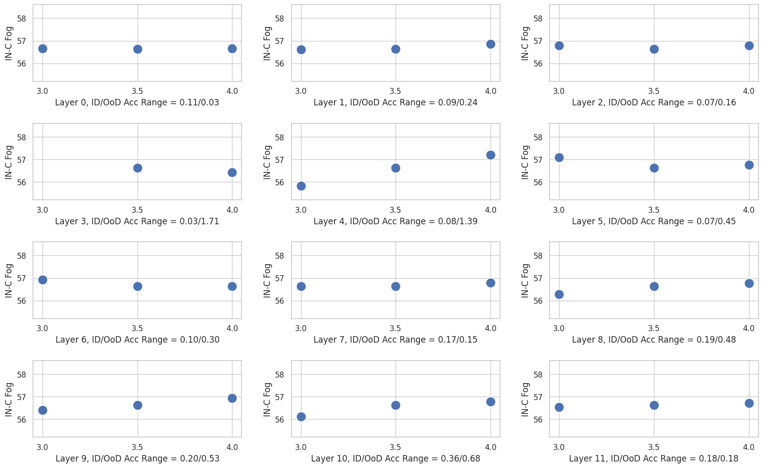
The number of heads and MLP ratio vary across layers, which allows for searching more diverse architectures. In this section, we provide the layer-wise analysis of the influence of MLP_Ratio/#Heads in each layer on OoD generalization.
Experimental Setups:
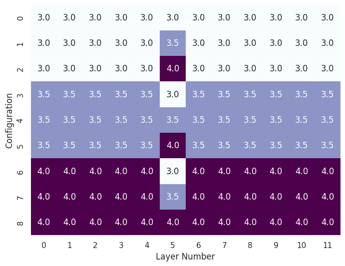
In Autoformer-Small search space, the MLP ratio at any given layer — referred to as the -th layer — can be set to 3.0, 3.5, or 4. In addition to architectures in our benchmark, we create a set of 108 sampled architectures from Autoformer-Small. These architectures are fixed with three architectural design attributes: (Depth , Embed_Dim , #Heads for all layers ). With these parameters fixed, the total number of potential MLP_Tatio configurations is still extensive (i.e., ), making it impractical to absolutely fix the MLP_Ration in our ablation study. To specifically assess the influence of the MLP_Ration at the -th layer, we further fix a constant MLP_Ration across all other layers. For example, Fig. 18.18 depicts the nine configurations of MLP_Ration to analyze the impact of -th layer.
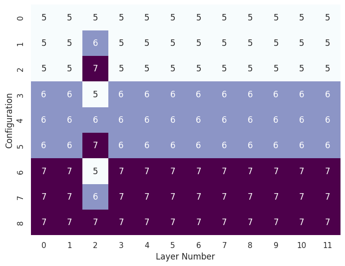
We carry out a similar layer-wise analysis to demonstrate the effect of #Heads at a specific layer (-th layer). In addition to architectures in our benchmark, we create a set of 108 sampled from Autoformer-Small. These architectures are fixed with three architectural design attributes: (Depth = , Embed_Dim =, #MLP_Ratio for all layers =). To specifically assess the influence of the #Head at the -th layer, we further fix a constant #Head across all other layers. For example, Fig. 18.18 depicts the nine configurations of #Head to analyze the impact of -th layer.
Results. The layer-wise analysis for MLP_Ratio are shown in Fig. 17.15. Each sub-figure demonstrates the change in OoD Accuracy when varying MLP_Ratio at a particular layer. While increasing it improved OoD accuracy in some layers, it decreased it in others. This aligns with our observations in Sec. 4.4, suggesting no clear overall impact of MLP_Ratio on OoD generalization.
The layer-wise analysis for #Head is illustrated in Fig. 17.16. Similar to our observation in the layer-wise analysis for MLP_Ratio, the impact of #Head is non-obvious, which is consistent with our finding in Sec. 4.4.
18 Reproducibility
18.1 Hyper-parameters
| IN-C | IN-P | IN-A | IN-O | IN-R | IN-Sketch | Stylized-IN | IN-D | |
| Batch Size | 256 | 256 | 256 | 64 | 256 | 256 | 256 | 100 |
| Number of workers | 10 | 10 | 10 | 4 | 10 | 10 | 10 | 10 |
To ensure reproducibility, we provide a detailed description of the hyper-parameters used for evaluating 3,000 ViT architectures in our OoD-NAS-ViT benchmarks on common large-scale OoD datasets: ImageNet-C [24], ImageNet-A [25] [24], ImageNet-O [25], ImageNet-P [24], ImageNet-D [26], ImageNet-R [27], ImageNet-Sketch [28], and Stylized ImageNet [29]. The evaluation for ImageNet-D, ImageNet-O and Stylized ImageNet strictly follows previous works [26, 25, 29] to ensure consistency and comparability. The details of the evaluation are shown in Table 18.11. The evaluated architectures are sampled on AutoFormer-Tiny/Small/Base Search Spaces [6].
18.2 Compute Resource
All our experiments are conducted using NVIDIA RTX A6000 GPUs. We utilized GPUs for each experiment. The substantial computational resources required for these evaluations underscore the complexity and scale of our work. Detailed information on the GPU-hour consumed for all experiments to construct our OoD-ViT-NAS Benchmark can be found in Table 18.12. In total, the experiments demanded a significant investment of approximately 3900 GPU-hours, reflecting the extensive computational effort involved.
| IN-C | IN-P | IN-A | IN-O | IN-R | IN-Sketch | Stylized-IN | IN-D | Total | |
| GPU-Hour | 2958 | 672 | 12 | 93 | 28 | 53 | 37 | 50 | 3903 |