The parenthood effect in urban mobility
Abstract
The modelling of human mobility is vital for the understanding of the complexity of urban dynamics, informing city planning, and guiding effective interventions to improve quality of life. Traditional modelling approaches focus on ‘average citizens,’ which overlook the multitude of experiences from distinct sociodemographic groups. Recent studies have unveiled significant variations in mobility patterns related to gender and socioeconomic status, yet the impact of parenthood — a major life event — remains under-explored. Parenthood brings profound changes to daily routines, influenced by factors such as increased caregiving responsibilities, altered work-life balance, and the need for family-friendly environments. Parents often prioritise considerations such as cost of living, social wellbeing, environmental quality, and safety. Quantifying how ‘friendly’ a city is becomes more and more important for parents, especially in the context of rising remote work opportunities which, in turn, reverberate on the choices on where to settle. This work investigates whether these considerations lead to distinct mobility patterns between parents and non-parents, also accounting for the impact of partnership — another life-altering factor. Using extensive census data across American cities, we analyse how parenthood and partnership reshape their urban experiences. Our findings indicate that cities can indeed be classified by their level of friendliness towards parents and partners. For example, Dallas and Nashville can be more suited for single individuals, New York and Chicago can be more accommodating to parents, while Washington and Baltimore favour married people. These insights contribute to the growing body of research advocating for more nuanced and equitable urban planning. By recognising the diverse needs of different demographic groups, particularly parents, our study underscores the importance of tailored urban design strategies over universal solutions.
Introduction
Human mobility is a fundamental aspect of societal functioning, representing the movement of people to satisfy a variety of needs; whether it is commuting to work, seeking medical care, or engaging in leisure activities. Understanding and modelling this mobility is crucial for several reasons, including its impact on urban infrastructure, economic productivity, and environmental sustainability [1]. Mobility modelling allows researchers and policymakers to predict travel patterns, optimise transportation systems, and plan for future urban growth [2]. As urban populations continue to grow, particularly in developing regions, the importance of accurate mobility models accounting for the diversity observed in today’s world has never been greater.
Although mobility can be studied in various contexts, the vast majority of mobility studies pertains to urban environments. This focus is justified by the demographic reality that over 55% of the global population currently resides in cities (as of 2018), a figure expected to rise to 68% by 2050 according to the United Nations [3]. In the United States, approximately 82% of the population lived in urban areas as of the 2010 census, with this proportion expected to increase further [3]. Urban areas are not only densely populated but also generate copious amounts of data [4, 5, 6, 7, 8], making them fertile ground for data-driven studies. Additionally, urbanites face unique mobility challenges and opportunities, (e.g., navigating congested road networks, adapting to multi-modal transportation systems, access to a variety of resources) that differ significantly from those in rural areas, further reinforcing the need to concentrate on cities when modelling human movement.
Mobility modelling is closely connected to problems addressed by multiple United Nations Sustainable Development Goals (SDGs) [9], such as reducing carbon emissions (SDG 7 and 13), improving access to public transportation (SDG 11), and promoting inclusive and sustainable urbanisation (SDG 7 and 11). These goals underscore the need to consider the diversity of urban residents in mobility studies to create cities that are not only efficient but also equitable and environmentally responsible.
Cities are inherently diverse and cosmopolitan places, composed of individuals from varied backgrounds, with different needs, preferences, and resources. Consequently, modelling urban mobility by averaging the behaviour of a generic citizen encourages oversimplification and can lead to policies that do not account for the diverse realities of city dwellers. Equity in urban planning demands that we move beyond one-size-fits-all models and, instead, develop approaches accounting for the differences in how various demographic groups experience and navigate cities.
Life-changing events are known to fundamentally alter an individual’s priorities, routines, and interactions with their environment [10, 11]. Such events include major milestones like completing education, entering the workforce, retirement, and perhaps most significantly, the decision to become a parent. Parenthood introduces a new set of responsibilities and constraints profoundly reshaping daily life, including mobility patterns [12]. Parents may prioritise proximity to schools, childcare facilities, and safe, family-friendly neighbourhoods when coming to the decision on where to settle. The concept of a ‘friendly’ city becomes particularly relevant in this context, as parents increasingly seek environments that cater to their needs, especially in an era where remote work has made relocating more feasible. Furthermore, it has become evident that the parents’ own well-being improves when they spend more time with their children [13].
Another significant, albeit slightly less impactful, life change is the decision to have a partner, whether in the form of marriage or other long-term living arrangements. The transition of becoming married also brings changes in lifestyle and mobility needs, such as the need for housing that accommodates two adults, increased economic status due to possible dual incomes, and shared household responsibilities. While these changes might not be as transformative as those induced by parenthood, they still represent a shift that could influence mobility behaviour. In this paper, we will refer to married people or partners as the people that declared living together and replied married in the survey. We rely on the data collected by the American Census Survey, and we avoid counting flatmates as partners. Here, we consider homosexual and heterosexual partners, we did not account for the gender of the partners or parents in this paper.
The recognition that different groups, whether defined by parenthood, marriage, gender, or socioeconomic status, experience cities differently has gained traction in recent years. Early mobility models often treated travellers as homogeneous, indistinguishable entities, failing to grasp the diversity inherent in human populations [14, 15, 16]. However, this general approach has been increasingly challenged as researchers have begun to explore how these demographic differences manifest in mobility patterns, leading to more nuanced and effective urban planning strategies [17, 18, 19, 20, 21, 22].
In addition to these demographic factors, the concept of multimodality and multiple scales in mobility (where individuals use multiple forms of transportation within a single trip) further complicates the picture [23, 24, 2, 25, 26, 18, 27, 28, 29]. Different demographic groups exploit these transportation modes in varying ways, depending on factors like income, gender, and family status. For instance, parents may rely more heavily on cars for the convenience of transporting children, whereas younger, single individuals might prefer public transit or cycling.
Parenthood, in particular, brings significant costs and considerations. The financial burden of raising children, the time demands of caregiving, and the need for access to specific amenities such as schools and healthcare facilities can all influence individuals’ mobility patterns. Research indicates that parents are more likely to prioritise living near essential services, even if it means longer commutes to work. According to the USDA, the cost of raising a child to the age of 18 in the United States averages around 233,610 US dollars, excluding college expenses, underscoring the significant impact of parenthood on household decision-making [30].
Despite the importance of parenthood and marriage in shaping individuals’ lives and mobility patterns, there has been little systematic study of how these life events alter their mobility, access to amenities, and overall urban experiences. This paper aims to fill that gap by examining how parenthood and partnership influence mobility patterns across several metropolitan areas in the United States. Using extensive census data, we analyse how these life-changing events reshape urban experiences and how cities can be classified by their level of friendliness towards parents and married people. Our findings indicate that cities like New York and Chicago are more accommodating to parents, while cities like Houston and Virginia Beach are better suited for single individuals. These results are robust while considering the distribution of groups, travels, and travel distances. We also found that non parents and single people tend to be less widely distributed within metropolitan regions, indicating a tendency for them to be living in particular regions. Leisure and work for instance are types of amenity that tend to be more spatially concentrated than education and health, that might influence the decision on where non parents and single people live more than parents and married people. These insights contribute to the growing body of research advocating for more nuanced, equitable, and effective urban planning.
Results
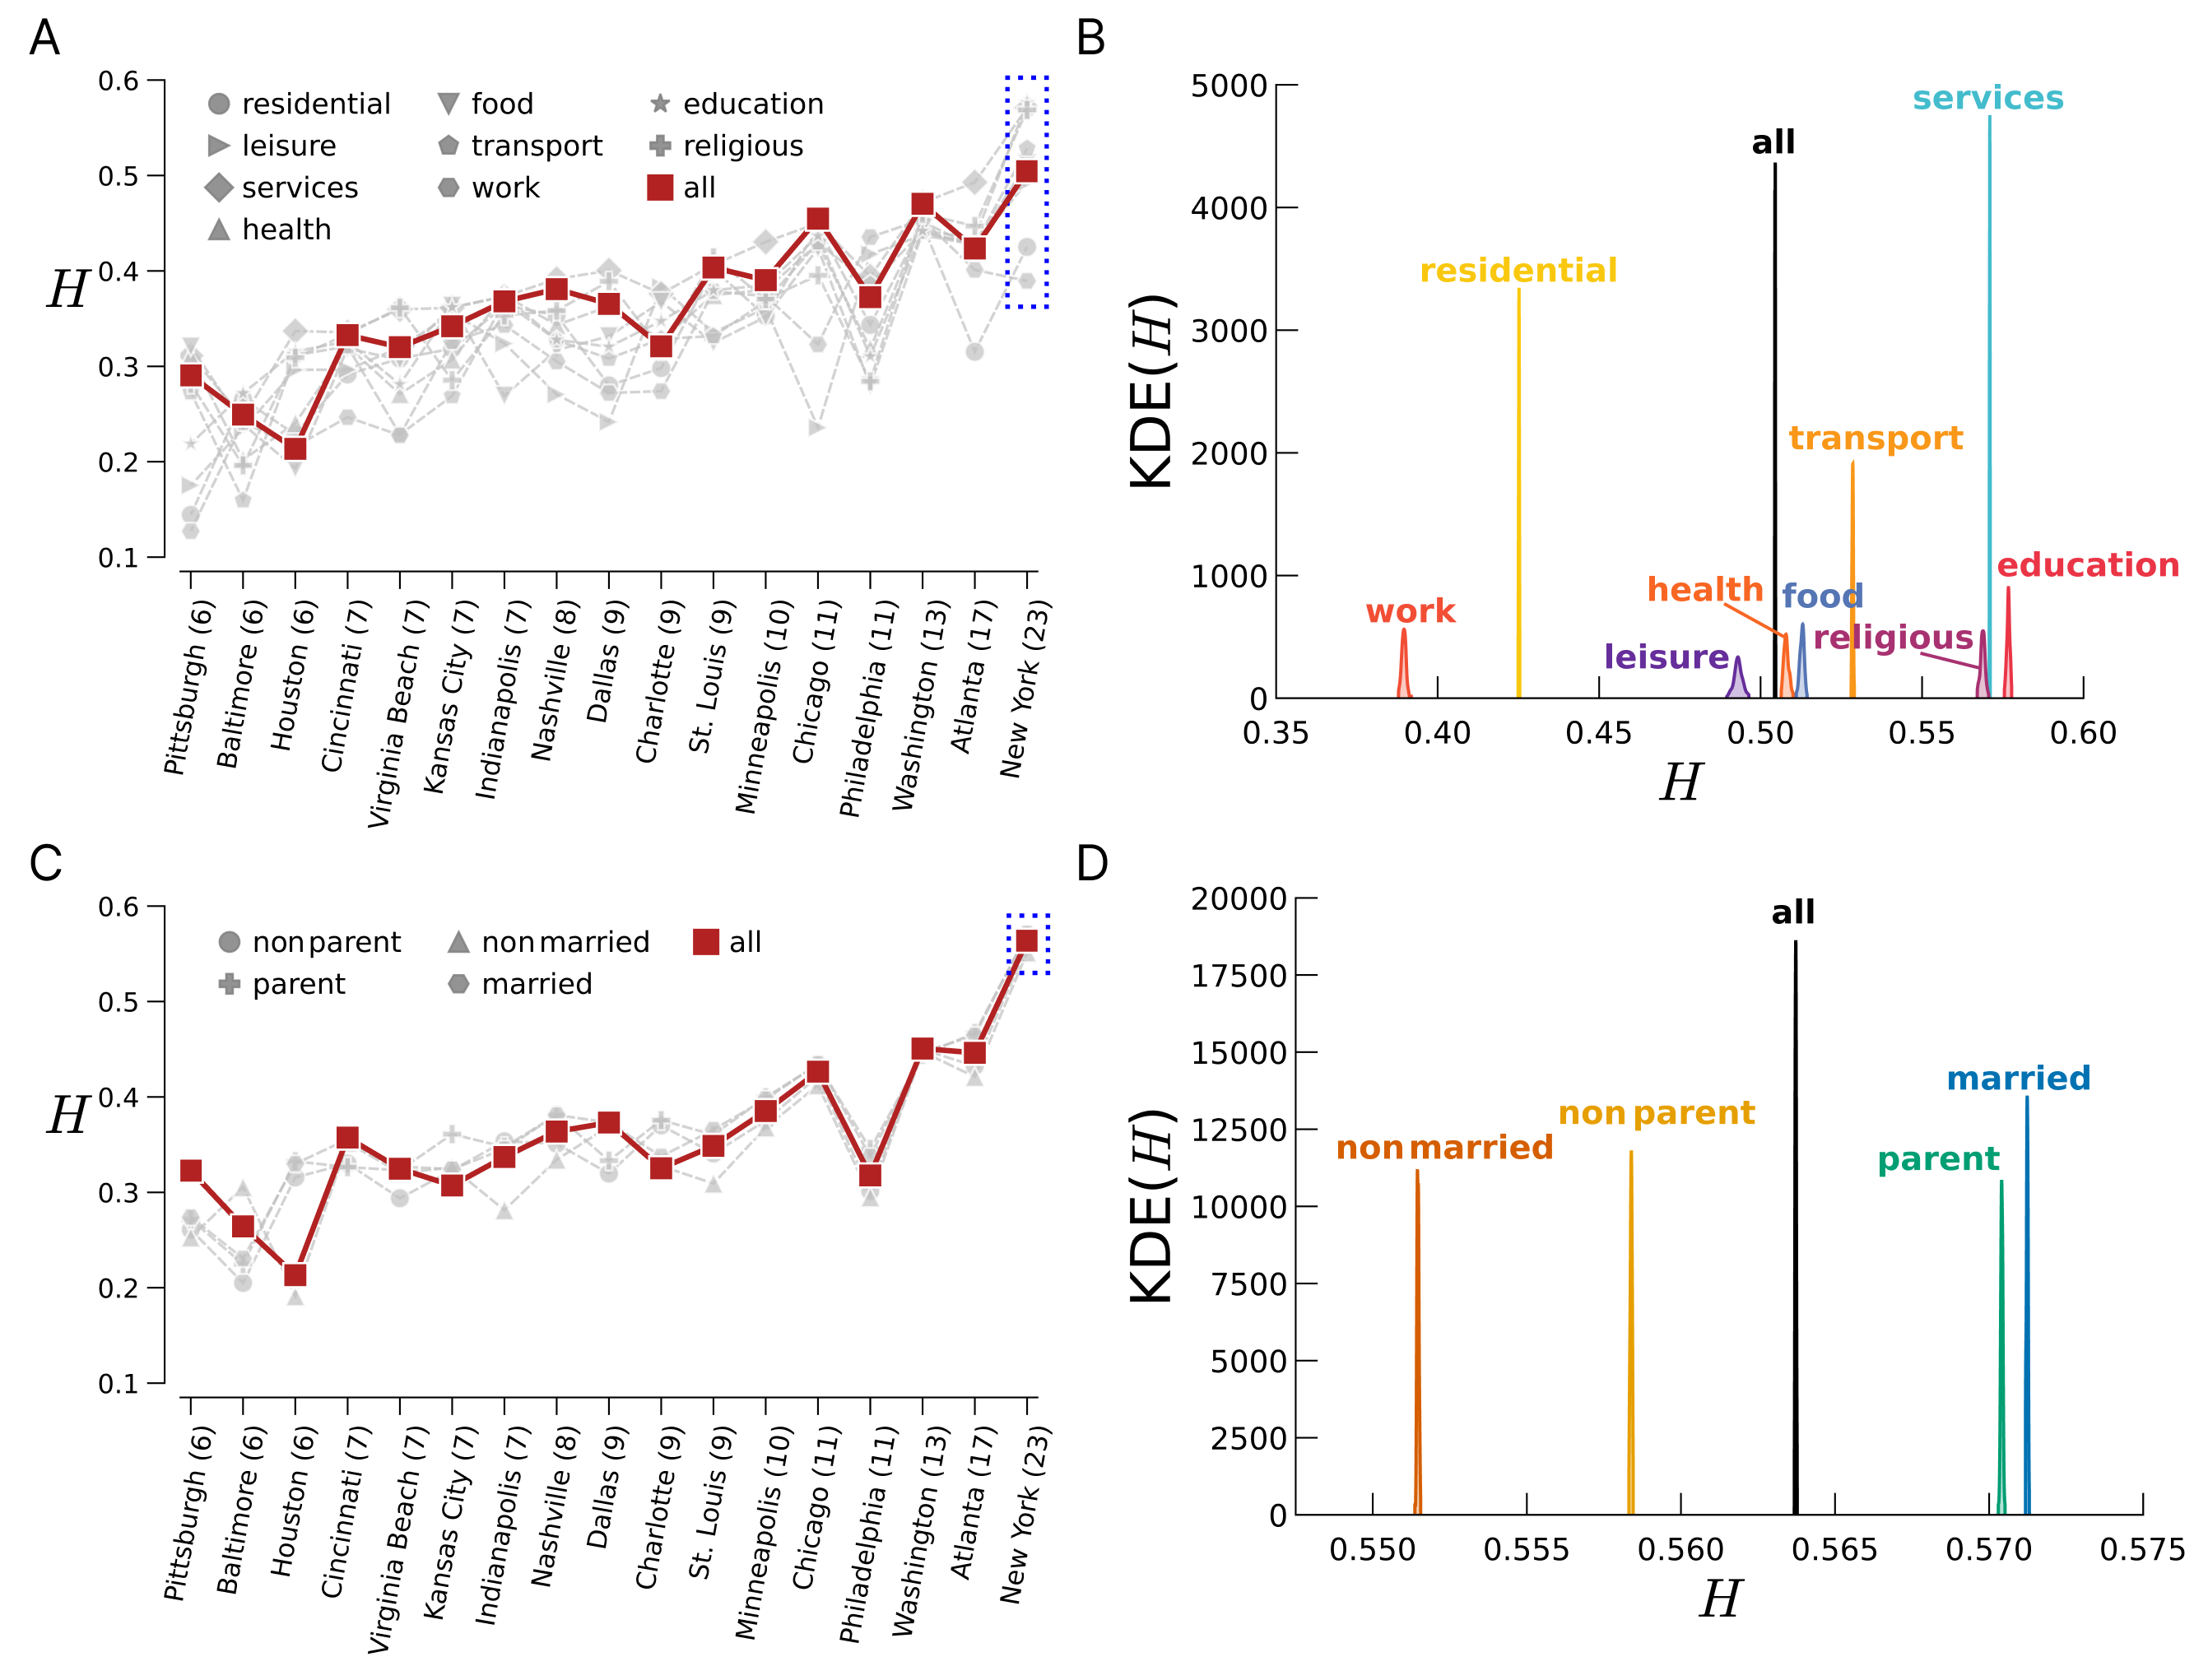
We begin by characterising the spatial distribution of amenities and population (i.e., travellers) within the 17 United States metropolitan areas included in our study (see Methods and Tab. 1 for the details). Looking at the distribution of amenities (Figure 1A), we notice that the values of diversity, , span approximately between 0.1 and 0.6. Such a range of values indicates that metropolitan areas like Baltimore and Pittsburgh have (on average) more inhomogeneously distributed amenities than, for instance, Atlanta and New York. Such inhomogeneity hinges marginally on the type of amenity considered (e.g., leisure), whereas it seems to depend more on the number of zones into which the metropolitan area is divided. In fact, metropolitan areas with more zones exhibit more homogeneous distributions, as confirmed by the analysis of the bootstrapped values of . For instance, for the New York area (Figure 1B) we have found that work and residential amenities are more inhomogeneously distributed than amenities classified as education or services (see Methods and Supplementary Material for more details).
Concerning the population’s distribution (Figure 1C), despite the presence of a similar cross-area trend in the overall values of , the differences between distinct household arrangements within the same metropolitan area are narrower than for amenities. Taking New York area as an example (Figure 1D), the difference between the peaks of of the most inhomogeneously distributed group (non married) and the most homogeneously distributed one (married) is approximately equal to 0.02, thus confirming the weaker, but statistically significant, dependence on household arrangement. These findings already suggest that the differences in the distribution of amenities and sociodemographic groups within metropolitan areas might be amplified by mobility.
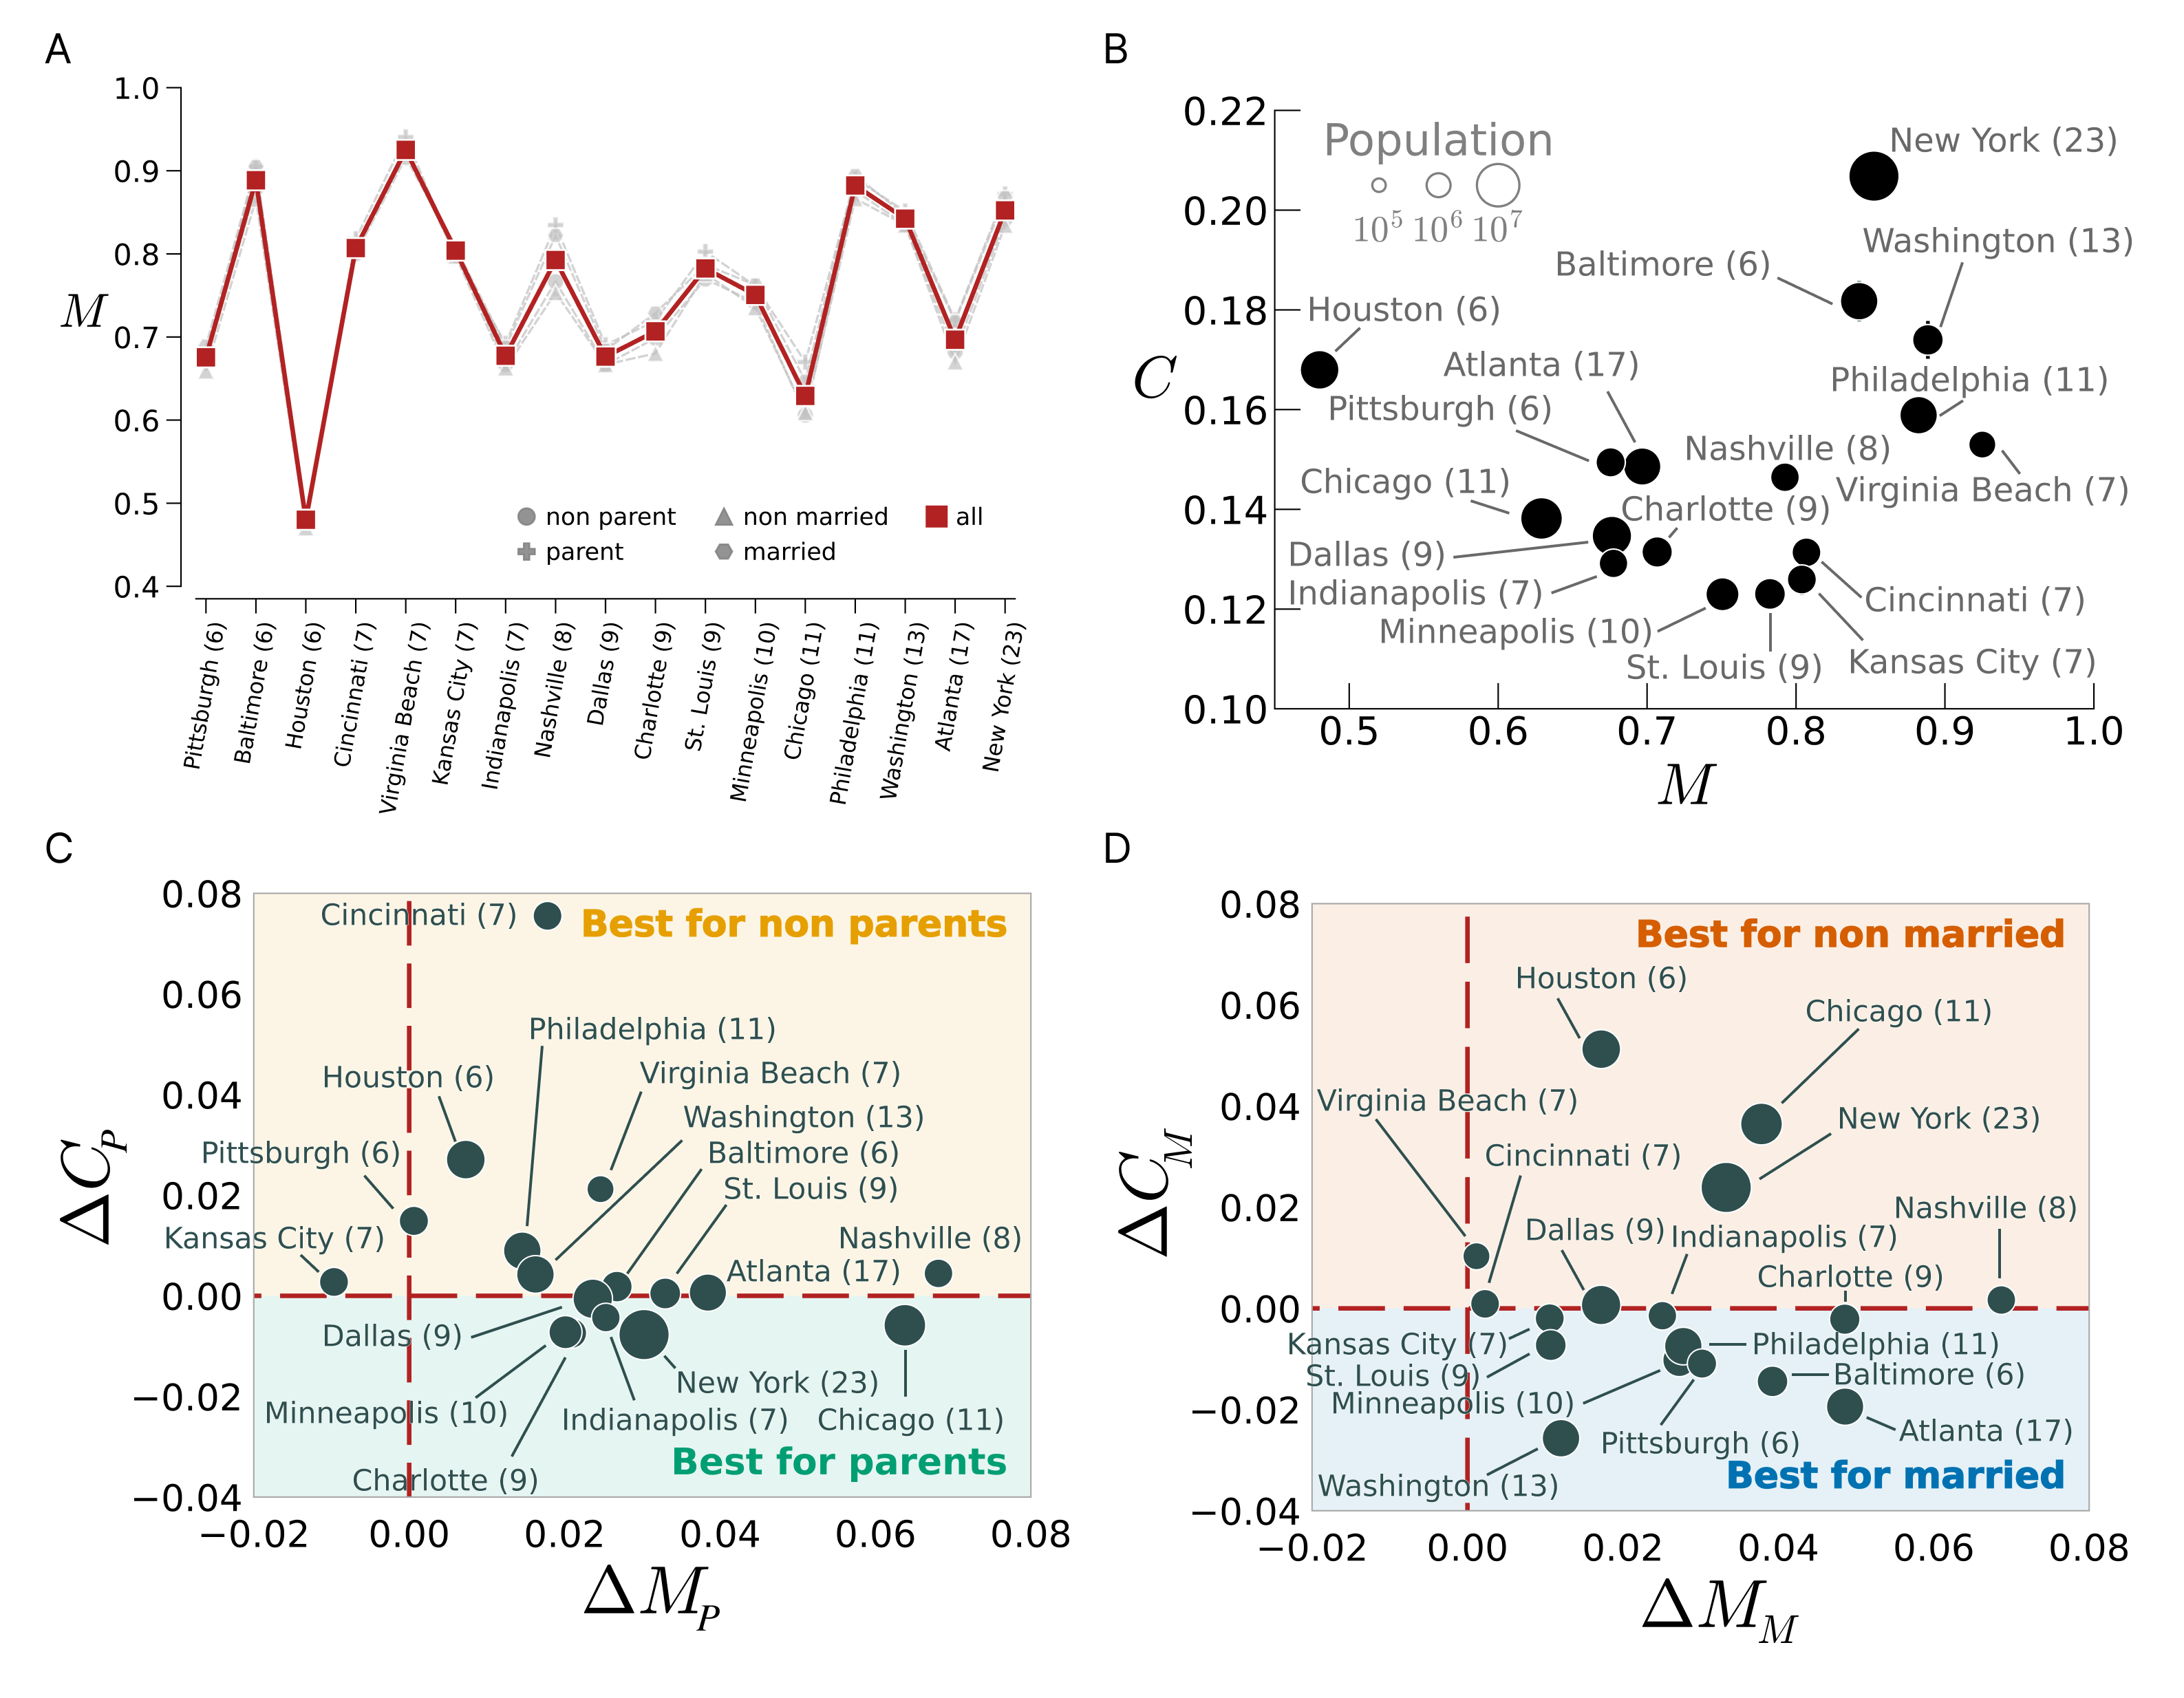
Now that we understand the static distribution of amenities and their visitation patterns by groups (Figure 1), we can switch our attention to mobility. In Figure 2A we display the values of mobility diversity (see Methods) for travellers of different household arrangements. At first glance, we notice that the values of span a wider range than those of displayed in Figure 1C. Moreover, we do not observe the same dependency on the number of zones as for the case of , and different types of travellers do not display significantly different values of . However, these values are in line with those available in the literature on human mobility [1] and urban systems [24]. The relationship between diversity, , and average cost, , displayed in Figure 2B suggests that — except for Houston — metropolitan areas with higher values of (e.g., Baltimore) are those with higher values of . Such a relationship, however, does not depend on the population, as areas like Chicago display average costs inferior to those of areas like Nashville which are significantly less populated (see Tab. 1). If we compute the differences of entropy and cost between non parents and parents travellers (Figure 2C), we observe that areas like New York, Charlotte, Minneapolis and Chicago appear more favourable to parents travellers. However, areas like Cincinnati, Houston, Virginia Beach, Pittsburgh, Philadelphia, and Nashville display the opposite tendency, best for non parents. Last, areas like St Louis, Dallas, and Atlanta are more neutral towards parenthood status (). The probable reason for these phenomena is that parents tend to live preferentially in residential areas (with more availability of bigger houses, children’s entertainment and/or closer to schools) [31]. Curiously, there is only one area with : Kansas City, indicating that non parents from this region tend to explore the metropolitan area more homogeneously than parents.
If we now look at the presence of inequalities for the case of married travellers (Figure 2D), the scenario changes slightly. The values of in 11 areas are, on average, closer to 0 for married/non married travellers than those for parents/non parents. We notice the presence of areas neutral towards the marital status of people like Cincinnati and Dallas; whereas areas like Washington, Atlanta, and Baltimore seem to favour the mobility of married people. Taken the two dimensions together, it might be possible that Indianapolis, Minneapolis, and Charlotte are a good place for parents and married people ( and ) showing also, in Figure 2B, a low mobility cost () and average mobility diversity ().
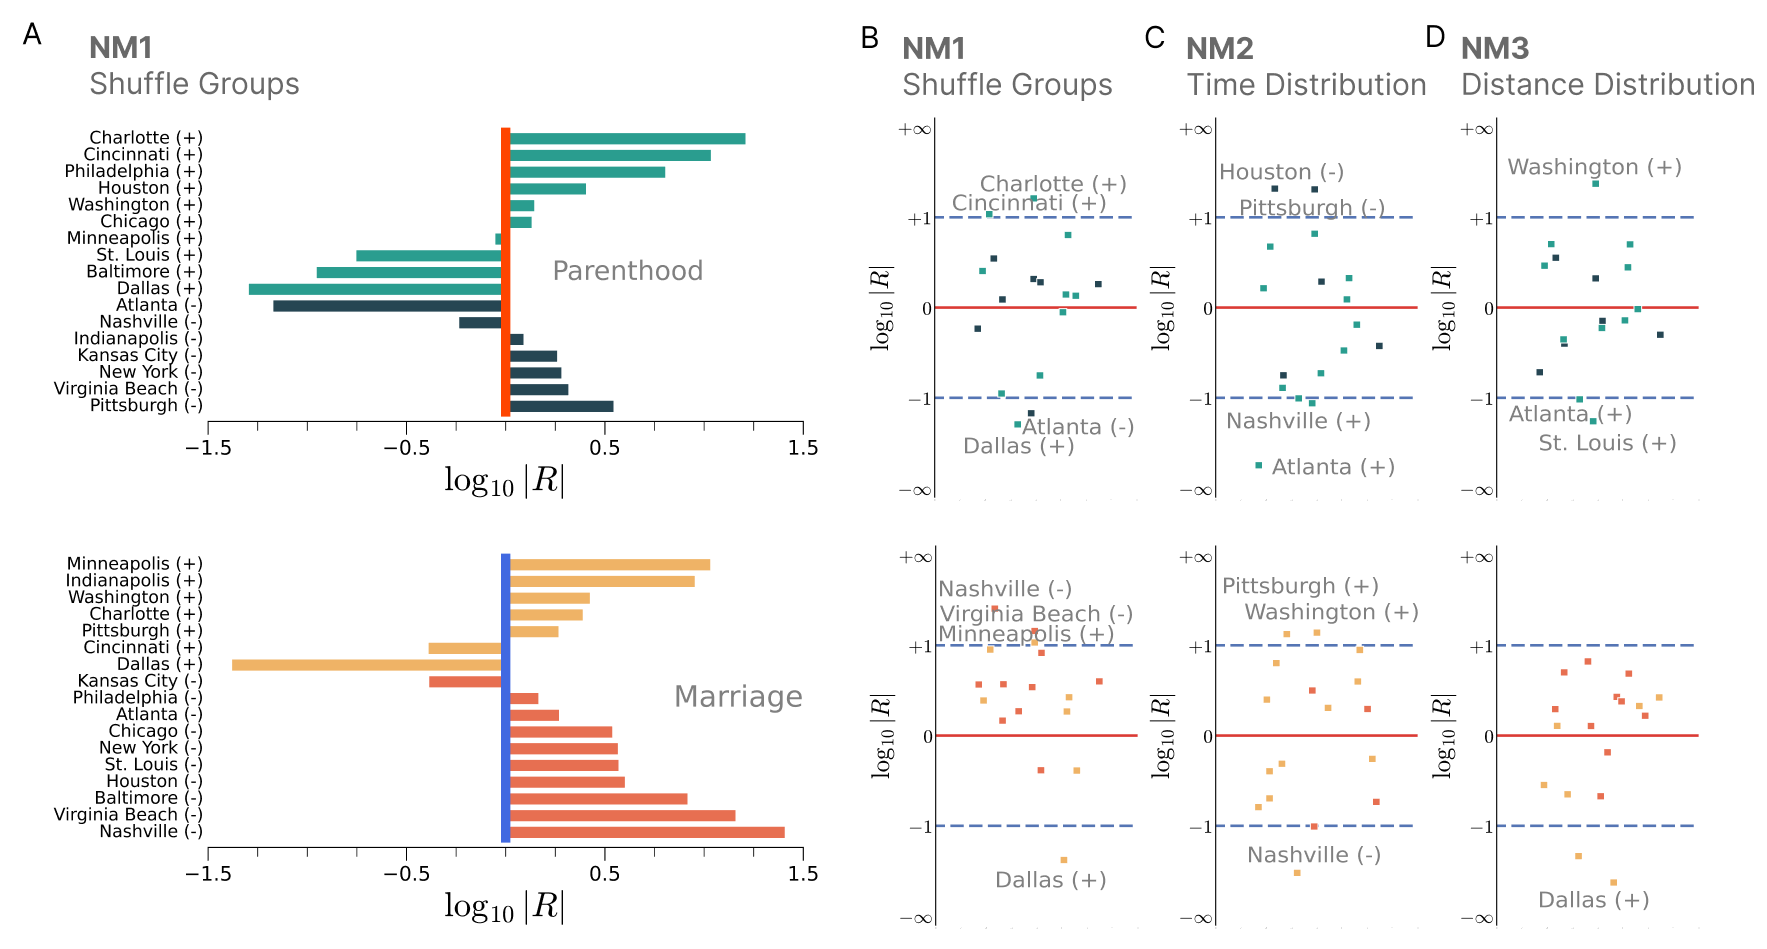
All the differences observed in Figure 2 raise the following question: ‘Are these differences meaningful, or they are just the by-product of noise/chance?’ To address this question, in Figure 3 we report the values of the ratio, , between the differences of cost for travellers of type and , , measured in the empirical case as well as in five hypotheses/null cases (see SM for the details).
Taking the case of parenthood as an example (Figure 3A), note that implies , meaning the differences are identical in both the empirical and null scenarios. Conversely, indicates that the empirical differences are ten times larger (or smaller) than those in the null case. Finally, the sign of (reflected in both the metropolitan-area label and the hue of the bar colour) reveals whether the differences share the same sign (i.e., the same direction) or not. In particular, a negative sign of indicates that the empirical and null differences have different signs, thus denoting that the hierarchy of costs in empirical and null cases are different.
A more concise way of summarising the values of is via the diagrams appearing on the right-hand side of panel A and on panels B, C, and D of Figure 3. There, we display the values of to understand whether these values are close to zero (i.e., ), within the range (i.e., ), or in the range (i.e., or ); Table S2 of the SM presents all the symbols and values. We considered five null hypothesis/models: NM1: We keep the travels (i.e., their origin, destination, and time) but we shuffle the household arrangement feature (i.e., married/non married or parent/non parent). NM2: We keep the travels’ origin, destination, and traveller’s type but the travel time is extracted from a probability distribution obtained fitting the empirical travel times. NM3: We keep the travels’ origin, time, and traveller’s type but the travel distance is extracted from a probability distribution obtained fitting the empirical travel distance where each selected distance will fall into a new travel destination zone. NM4: We keep the travels’ origin, destination, and traveller’s type but we shuffle the travel time feature. NM5: We keep the travels’ origin, time, and traveller’s type but we pick a random travel destination. For each null cases, we average the results over an ensemble of 100 realizations with a bootstrapping of 80% of the data (see Methods). NM1 tries to understand whether the cost differences observed, , are due exclusively to the type of travellers (e.g., parent) and their distribution across the metropolitan area. NM2 and NM3 test whether the distributions of travel time and distance explains most of the differences. NM4 aims at understanding whether the differences are due to the ‘speed’ at which travels are made. Finally, NM5 checks whether the differences are due to the ‘spatial tessellation’ at which zones are made. The results of NM4 and NM5 are displayed in the SM, together with the results for the difference of diversity (NM1, NM3, and NM5).
A quick glance to Figure 3 and Table S2 of the SM (NM1, NM2, NM3, and NM4) reveals that, with a few exceptions, cost differences ratios, , are always significantly different from zero (i.e., ). We observe that for the marriage case for the vast majority of urban areas (e.g., panel A), albeit this is not the case for parenthood. We notice that some areas (Cincinnati, Washington, Atlanta, and Dallas) tend to display differences which are remarkably bigger (or smaller) than those of the other areas. The simultaneous presence of small and big values of suggests that beyond morphology, some cities (e.g., Dallas) seem to mitigate better than others (e.g., Cincinnati) the cost burden on parents. Finally, the hierarchy of costs (i.e., the sign of ) does not seem to affect the values of , as both halves of the diagram are equally populated by areas with positive and negative differences. In the case of mobility diversity, differences are even starker than for cost while shuffling the travellers’ type (see Figure S1 Panel A of the SM). For NM3 and NM5, the values of for most cities varies between 0 and -1 for both travellers’ type (see Figure S1 Panels B and C of the SM). All in all, our analysis reveals patterns consistent with previous findings related to the travel and time distributions across urban areas [1, 20], demonstrating that mobility costs are not merely artefacts of random processes. This evidence underscores that the differences in cost captured in Figure 2 are not stochastic noise but, rather, a hallmark of the parenthood/marital effect on mobility.
Discussion
People do not experience urban systems in a similar manner. Some works have shown that differences in mobility reveal inequalities dealt by specific sociodemographic groups. For instance, works have found that socioeconomic status [32], gender [21], race [33], and age [17] unveil differences in mobility that should be further studied for addressing health and safety issues [34, 35, 36] and avoiding the reinforcement of inequalities in the labour market [37]. That is why data-driven policies and interventions are crucial for improving urban systems and ensuring a good accessibility for everyone; as cities become more challenging, expensive and complex to manage/intervene [7, 38, 35]. Some works have shown successful policies and interventions addressing barriers in urban systems, benefiting the overall transportation system [39], women [40, 41, 42], and individuals with disabilities [43].
Our study examines the mobility and urban experiences of individuals in different household arrangements, specifically focusing on whether being a parent and/or married plays a pivotal role in shaping urban mobility patterns. Our findings align with the existing literature [12], which highlights how life circumstances such as parenthood can significantly impact mobility choices — for example, by increasing reliance on cars for commuting or, conversely, forcing some families to sell a car due to financial constraints. However, our work goes beyond mere confirmation, offering a nuanced understanding of these changes in the context of access to amenities, which plays a crucial role in enabling individuals to fulfil their daily responsibilities [44, 45, 46].
In this paper, we show that both access to amenities and associated travel costs are affected by parenthood and marriage, underscoring the heightened importance of decisions regarding residential and workplace locations in certain metropolitan areas. For instance, across most examined US cities, non parents and unmarried individuals generally spend less time travelling ( in Fig. 2), whereas parents and married individuals tend to live in closer proximity to a range of essential amenities. Notably, these observed patterns show no clear correlation with either population size or city scale. Moreover, our comparisons with null models confirm that the results are robust to potential fluctuations in travel distributions, household characteristics, and spatial delineations, reinforcing the validity of our conclusions.
Our findings indicate that in most cities, parents and married individuals work closer to a broader range of amenities. However, in some metropolitan areas, this advantage is coupled with longer average commuting times, suggesting a need for tailored interventions to alleviate the mobility burden on these demographic groups. In the literature, we also observe that changes in the household arrangements and status increases more the gender and race differences in commuting travel time [47].
These insights offer valuable guidance for policymakers and urban planners aiming to refine public transportation, reduce inequalities in access to services, foster more sustainable urban environments, and strengthen community cohesion. Moreover, cities that successfully accommodate diverse household arrangements may serve as models for other regions seeking to optimise their urban ecosystems.
Urban environmental changes offer significant potential to improve neighbourhoods and family life, even if their impacts can vary [48, 49]. For instance, enhancing or creating parks may not always increase usage, but such interventions are associated with reduced injury rates and decreased screen time for children. Similarly, improvements in walkability, road speed reduction, and road signage near schools have successfully encouraged more families to walk or cycle, fostering active and healthier lifestyles. Broader urban interventions, such as the inclusion of cable cars in Bogotá, have demonstrated positive impacts by reducing travel time, increasing satisfaction with public transportation, promoting physical activity, improving access to amenities, and decreasing perceptions of insecurity [50, 51]. Despite these successes, the concept of a ‘child-friendly’ city remains a topic of debate among practitioners [52], and mobility consistently emerges as a crucial factor in shaping environments that support children’s and parents’ well-being.
The findings of this study underscore the critical importance of acknowledging demographic diversity in urban mobility frameworks. While broad, generalised models can offer initial guidance, they often fail to capture the complexity arising – among others – from demographic, socio-economic, and cultural variables. As cities continue to expand and evolve, traditional approaches that treat populations as homogeneous units are increasingly inadequate. Crucially, the growing availability of comprehensive data sources now enables more refined analyses that can incorporate a range of factors (e.g., household status, income levels, and cultural norms) into our understanding of mobility patterns. By examining how life-altering events like parenthood and marriage shape these dynamics, we highlight the necessity of designing cities that are both efficient and inclusive. Recognising that parents, cohabitants, and single individuals navigate urban spaces differently not only empowers policymakers to develop more targeted interventions but also contributes to building more sustainable, equitable, and resilient urban systems.
Our work also contributes to the broader discourse on urban planning and sustainability. By revealing the diverse mobility needs and preferences of various demographic groups, our study provides insights that can guide policymakers in creating urban spaces catering to the realities of contemporary urban living. As cities strive to become more adaptable and responsive to their residents, the findings presented here offer a valuable framework for integrating demographic considerations into the design and management of urban areas, promoting a more just and sustainable future for all.
While current data sources provide initial insights, they often lack the necessary granularity to capture the evolving mobility experiences of different demographic groups. Additionally, our datasets reflect a reality in which the majority of travels are performed by men, married people, and non-parent individuals. This predominance has been recognised as a challenge in data collection, as highlighted by [40, 41], pointing out that datasets are often biased in favour of majorities. This underscores the importance of works like ours in advancing the understanding of how minority-specific groups behave and may face disadvantages. Furthermore, as we strive to integrate more detailed information, it becomes essential to prioritise ethical considerations and privacy protections. Developing frameworks combining advanced anonymisation techniques, secure data-sharing protocols, and strict governance can help maintain public trust while granting researchers and policymakers access to critical evidence. With such safeguards in place, it becomes possible to craft policies and interventions that truly reflect the complex, multifaceted realities of urban life, resulting in more inclusive, efficient, and resilient cities.
Despite the insights gained, this study is not exempt from limitations. One key constraint lies in the nature of the data employed. Although the census and related datasets offer valuable information on household arrangements and work-related travel, they do not fully capture the complexity and dynamics of individuals’ mobility decisions. Factors such as non-work trips, nuanced cultural influences, and the role of social networks remain underexplored. Moreover, the predominance of data reflecting majority groups, as discussed earlier, limits the understanding of how minority groups navigate urban systems. Furthermore, our analysis draws from a limited number of metropolitan areas in the United States, leaving open whether these findings generalise to other global contexts or urban systems. While we have considered household-level distinctions and demographic diversity, other aspects, including ethnicity, age, and access to various transportation options, may also influence mobility in ways not fully accounted here.
Our data sources further restrict the ability to examine long-term trends or the evolving nature of urban mobility with the level of detail that emerging longitudinal and multimodal datasets might provide. This temporal limitation makes it challenging to understand how life events or policy changes shape travel patterns over time; as individuals transition between different household arrangements or life stages, the patterns and demands of urban mobility may shift, emphasising the need for dynamic, long-term analyses capturing the evolving character of urban life. In addition, the lack of high-resolution, privacy-preserving information on trip purpose or travel modes may have constrained the scope of our analysis. Nevertheless, we believe that the core findings remain both robust and instructive. Acknowledging these constraints highlights avenues for future research, which could draw on richer data sources and more advanced analytical methods. Such efforts would deepen our understanding of urban mobility and better equip policymakers and planners to build more adaptive, equitable, and inclusive urban environments.
Methods
Data
Our data are a combination of mobility data obtained from US census and data on amenities obtained via Open Street Maps. In the following, we present a description of how the data have been extracted, processed, and compiled together.
Mobility data and cost
Our data were collected using the United States Census Bureau’s API [53] for all the urban regions with information available on mobility and demographics available under the 2019 edition of the so-called American Community Survey [54] (ACS). For the purpose of our study, we have considered only trips related to work. The variables collected by the ACS are: the state, city, metropolitan region, individual (traveller) characteristics, mobility characteristics, and expansion factors (the entire list of variables is available on https://api.census.gov/data/2022/acs/acs1/pums/variables.html). For each individual, the ACS survey reports information like: gender, household status, socioeconomic status, and age. In particular, we will refer to people as married or partners if they live together and replied married in the survey. We rely on the data collected by the ACS, and avoid counting flatmates as partners. Moreover, we do not account for the gender of people and considered indiscriminately both homosexual and heterosexual partners. Following a similar reasoning, we refer to people as parents if they replied parent in the survey.
For each urban area, the space is divided into zones. The spatial tessellations of home and work zones provided by the US census do not coincide. In particular, multiple home zones map into a single work zone, hence we had to collapse together home zones. This preliminary step avoids inconsistencies in the comparison of differences in residential and mobility concentration, albeit it diminishes considerably the number of available zones. We decided to use the Metropolitan areas classified by the US census[54] as our reference, as they are well recognised functional area in which people are more likely to work in.
The cost of one travel, , is given by the ratio between the time needed to reach the destination, , divided by the maximum travel time, . By rescaling the travel time by its maximum, , we ensure a fair comparison between urban areas of different sizes. The average cost of travels made by travellers of type , , is given by
| (1) |
where is the total number of travels made by travellers of type . The average cost of all travels made, , is nothing but , with being the total number of travels made.
The statistics of our collected dataset is displayed in Table 1. We selected the 17 metropolitan areas with the highest number of zones available after the merging process, resulting in urban areas having a number of zones, , ranging from 6 to 23. Although our data on spatial tessellation is limited, this paper leverages a rich dataset to study sociodemographic groups—an area where such data is typically scarce and constrained [41, 40].
Amenities
For each of our zones, we extracted from Open Street Maps [55] all amenities located inside those zones and classified as: amenity, highway, building, or healthcare. To obtain homogeneous and meaningful groups of amenities, we manually grouped them into these categories: work, residential, leisure, health, food, transport, religious, education, and services. Among the amenities available, we excluded those that we could not map easily into any of the aforementioned categories. A sample of the categories that we removed includes: karaoke box, compressed air, binoculars, concussion, and show house. The detailed list of all the amenities included and excluded is available in the Supplementary Materials.
| Reference | Urban areas | State(s) | () | () | () | () | ||
|---|---|---|---|---|---|---|---|---|
| 1 | Pittsburgh | Pittsburgh | PA | 6 | 1,078,656 (2,275,783) | 0.48 (0.51) | 0.51 (0.41) | 0.29 (0.35) |
| 2 | Baltimore | Baltimore Columbia Towson | MD | 6 | 1,211,966 (2,749,210) | 0.50 (0.52) | 0.49 (0.38) | 0.33 (0.40) |
| 3 | Houston | Houston The Woodlands Sugar Land | TX | 6 | 3,258,783 (6,980,075) | 0.45 (0.50) | 0.53 (0.39) | 0.39 (0.49) |
| 4 | Virginia Beach | Virginia Beach Norfolk Newport News | VA & NC | 7 | 828,636 (1,672,613) | 0.48 (0.51) | 0.50 (0.38) | 0.33 (0.41) |
| 5 | Indianapolis | Indianapolis Carmel Anderson | IN | 7 | 988,100 (2,076,620) | 0.49 (0.51) | 0.51 (0.37) | 0.36 (0.44) |
| 6 | Cincinnati | Cincinnati | OH, KY, & IN | 7 | 1,014,468 (2,150,810) | 0.49 (0.51) | 0.52 (0.39) | 0.36 (0.41) |
| 7 | Kansas City | Kansas City | MO & KS | 7 | 1,080,449 (2,208,182) | 0.48 (0.51) | 0.53 (0.40) | 0.37 (0.45) |
| 8 | Nashville | Nashville Davidson county Murfreesboro Franklin | TN | 8 | 1,059,418 (2,106,031) | 0.48 (0.51) | 0.54 (0.41) | 0.35 (0.43) |
| 9 | Charlotte | Charlotte Concord Gastonia | NC & SC | 9 | 1,277,111 (2,649,709) | 0.49 (0.52) | 0.52 (0.39) | 0.36 (0.43) |
| 10 | St. Louis | St. Louis | MO & IL | 9 | 1,352,422 (2,834,644) | 0.49 (0.51) | 0.53 (0.40) | 0.35 (0.40) |
| 11 | Dallas | Dallas Fort Worth Arlington | TX | 9 | 3,701,991 (7,503,488) | 0.46 (0.51) | 0.53 (0.39) | 0.38 (0.48) |
| 12 | Minneapolis | Minneapolis St. Paul Bloomington | MN & WI | 10 | 1,924,212 (3,700,304) | 0.48 (0.50) | 0.53 (0.40) | 0.37 (0.45) |
| 13 | Philadelphia | Philadelphia Camden Wilmington | PA, NJ, DE, & MD | 11 | 2,815,605 (6,146,130) | 0.49 (0.52) | 0.50 (0.37) | 0.32 (0.40) |
| 14 | Chicago | Chicago Naperville Elgin | IL, IN, & WI | 11 | 4,634,178 (9,408,177) | 0.48 (0.51) | 0.50 (0.38) | 0.35 (0.43) |
| 15 | Washington | Washington Arlington Alexandria | DC, VA, MD, & WV | 13 | 3,157,880 (6,170,921) | 0.48 (0.51) | 0.51 (0.39) | 0.36 (0.45) |
| 16 | Atlanta | Atlanta Sandy Springs Roswell | GA | 17 | 2,848,348 (5,996,700) | 0.49 (0.52) | 0.51 (0.38) | 0.35 (0.44) |
| 17 | New York | New York Newark Jersey City | NY, NJ, & PA | 23 | 9,619,820 (19,839,535) | 0.48 (0.51) | 0.51 (0.38) | 0.33 (0.41) |
Quantifying diversity
Given a metropolitan area divided into zones, one can compute the diversity, , of the spatial coverage of a given feature over such an area [56, 57]. The latter is — up to a multiplicative factor — the Shannon entropy of the coverage, yielding:
| (2) |
Being the probability of observing feature (e.g., hospitals) in zone which, in turn, is given by:
| (3) |
where is the number of entities (i.e., amenities or travellers) of type in zone , and is the total number of such entities in the whole metropolitan area. Diversity , where corresponds to the case in which feature is concentrated in a single zone, whereas denotes the case in which feature is homogeneously distributed across all zones.
We can use the same formalism of Eq. (2) to compute the mobility diversity (i.e., diversity of accessibility to amenities) by travellers of type , as:
| (4) |
Where — following the structure of Eq. (3), — the probability corresponds to the ratio between the product of the number of amenities in zone , , and the number of travellers of type whose destination’s zone is , (i.e., ), and its sum over all zones . Eventually, one could calculate also the mobility diversity of accessibility of travellers of type to amenities of type , . It is worth noting that the values of and appearing in the above equations correspond to those of the peak of the resulting from the bootstrap sampling.
Computing ratios of cost and diversity
The difference between the average costs sustained by travellers of type and , , is computed as:
| (5) |
A positive value of indicates that travellers of type sustain, on average, higher costs than those of type , whereas indicates the opposite situation. The relative ratio of cost, , sustained by travellers of type and is defined as:
| (6) |
where is the value of cost computed in a suitable null case (check the Supplementary Materials for the details) and the operator denotes the ensemble average. A value of denotes that the both the numerator and the denominator have the same sign, whereas denotes the opposite case. If , then the empirical difference is smaller than its null case counterpart, whereas indicates the opposite (i.e., empirical difference bigger than the null one). Lastly, indicates that the difference is (up to a sign) exactly the same in both the empirical data and the null case. Analogously, we can define the same quantities for mobility diversity. It is worth noting that the values of and appearing in the above equations correspond to those of the peak of the resulting from the bootstrap sampling.
References
- [1] Barbosa, H. et al. Human mobility: Models and applications. \JournalTitlePhysics Reports 734, 1–74, DOI: 10.1016/j.physrep.2018.01.001 (2018).
- [2] Alessandretti, L., Aslak, U. & Lehmann, S. The scales of human mobility. \JournalTitleNature 587, 402–407, DOI: 10.1038/s41586-020-2909-1 (2020).
- [3] United Nations. World urbanization prospects: The 2018 revision. Tech. Rep. ST/ESA/SER.A/420, Department of Economic and Social Affairs, Population Division, New York, UN (2019).
- [4] Gallotti, R. & Barthelemy, M. The multilayer temporal network of public transport in Great Britain. \JournalTitleScientific data 2, 1–8 (2015).
- [5] Lenormand, M. & Ramasco, J. J. Towards a better understanding of cities using mobility data. \JournalTitleBuilt Environment 42, 356–364 (2016).
- [6] Kujala, R., Weckström, C., Darst, R. K., Mladenović, M. N. & Saramäki, J. A collection of public transport network data sets for 25 cities. \JournalTitleScientific data 5, 1–14 (2018).
- [7] Volpati, V. & Barthelemy, M. The spatial organization of the population density in cities. \JournalTitlearXiv preprint arXiv:1804.00855 (2018).
- [8] Reia, S. M., Rao, P. S. C., Barthelemy, M. & Ukkusuri, S. V. Spatial structure of city population growth. \JournalTitleNature Communications 13, 5931 (2022).
- [9] United Nations. Transforming our world: the 2030 agenda for sustainable development. Tech. Rep., Department of Economic and Social Affairs, Sustainable Development, New York, UN (2015).
- [10] Raymore, L. A., Barber, B. L. & Eccles, J. S. Leaving home, attending college, partnership and parenthood: The role of life transition events in leisure pattern stability from adolescence to young adulthood. \JournalTitleJournal of Youth and Adolescence 30, 197–223 (2001).
- [11] Larouche, R., Charles Rodriguez, U., Nayakarathna, R. & Scott, D. R. Effect of major life events on travel behaviours: a scoping review. \JournalTitleSustainability 12, 10392 (2020).
- [12] McCarthy, L., Delbosc, A., Currie, G. & Molloy, A. Trajectories and transitions: mobility after parenthood. \JournalTitleTransportation 48, 239–256 (2021).
- [13] Nomaguchi, K. & Milkie, M. A. Parenthood and well-being: A decade in review. \JournalTitleJournal of Marriage and Family 82, 198–223 (2020).
- [14] Song, C., Qu, Z., Blumm, N. & Barabási, A.-L. Limits of predictability in human mobility. \JournalTitleScience 327, 1018–1021, DOI: 10.1126/science.1177170 (2010).
- [15] Simini, F., González, M. C., Maritan, A. & Barabási, A.-L. A universal model for mobility and migration patterns. \JournalTitleNature 484, 96, DOI: 10.1038/nature10856 (2012).
- [16] Barbosa, H., de Lima-Neto, F. B., Evsukoff, A. & Menezes, R. The effect of recency to human mobility. \JournalTitleEPJ Data Science 4, 21, DOI: epjds/s13688-015-0059-8 (2015).
- [17] Lenormand, M. et al. Influence of sociodemographic characteristics on human mobility. \JournalTitleScientific Reports 5, 10075, DOI: 10.1038/srep10075 (2015).
- [18] Lotero, L., Hurtado, R. G., Floría, L. M. & Gómez-Gardeñes, J. Rich do not rise early: spatio-temporal patterns in the mobility networks of different socio-economic classes. \JournalTitleRoyal Society open science 3, 150654, DOI: 10.1098/rsos.150654 (2016).
- [19] Gauvin, L. et al. Gender gaps in urban mobility. \JournalTitleHumanities and Social Sciences Communications 7, 1–13, DOI: 10.1057/s41599-020-0500-x (2020).
- [20] Macedo, M., Lotero, L., Cardillo, A., Barbosa, H. & Menezes, R. Gender patterns of human mobility in Colombia: Reexamining Ravenstein’s laws of migration. In Complex Networks XI: Proceedings of the 11th Conference on Complex Networks CompleNet 2020, 269–281, DOI: 10.1007/978-3-030-40943-2_23 (Springer Nature, 2020).
- [21] Macedo, M., Lotero, L., Cardillo, A., Menezes, R. & Barbosa, H. Differences in the spatial landscape of urban mobility: gender and socioeconomic perspectives. \JournalTitlePlos one 17, e0260874, DOI: 10.1371/journal.pone.0260874 (2022).
- [22] Battison, A. et al. Revealing the determinants of gender inequality in urban cycling with large-scale data. \JournalTitleEPJ Data Science 12, DOI: 10.1140/epjds/s13688-023-00385-7 (2023).
- [23] Brockmann, D., Hufnagel, L. & Geisel, T. The scaling laws of human travel. \JournalTitleNature 439, 462–5, DOI: 10.1038/nature04292 (2006).
- [24] Batty, M. The Size, Scale, and Shape of Cities. \JournalTitleScience 319, 769–771, DOI: 10.1126/science.1151419 (2008).
- [25] Molkenthin, N., Schröder, M. & Timme, M. Scaling Laws of Collective Ride-Sharing Dynamics. \JournalTitlePhysical Review Letters 125, 248302, DOI: 10.1103/PhysRevLett.125.248302 (2020).
- [26] França, U., Sayama, H., Mcswiggen, C., Daneshvar, R. & Bar-Yam, Y. Visualizing the “heartbeat” of a city with tweets. \JournalTitleComplexity 21, 280–287, DOI: 10.1002/cplx.21687 (2016).
- [27] Alessandretti, L., Natera Orozco, L. G., Battiston, F., Saberi, M. & Szell, M. Multimodal urban mobility and multilayer transport networks. \JournalTitleEnvironment and Planning B: Urban Analytics and City Science 239980832211081, DOI: 10.1177/23998083221108190 (2022).
- [28] Kurant, M. & Thiran, P. Layered Complex Networks. \JournalTitlePhysical Review Letters 96, 138701, DOI: 10.1103/PhysRevLett.96.138701 (2006).
- [29] Aleta, A., Meloni, S. & Moreno, Y. A multilayer perspective for the analysis of urban transportation systems. \JournalTitleScientific Reports 7, 44359, DOI: 10.1038/srep44359 (2017).
- [30] Lino, M., Kuczynski, K., Rodriguez, N. & Schap, T. Expenditures on children by families, 2015. Tech. Rep. 1528-2015, United States Department of Agriculture (2017). Revised March 2017.
- [31] Wolf, J. P., Freisthler, B., Kepple, N. J. & Chavez, R. The places parents go: understanding the breadth, scope, and experiences of activity spaces for parents. \JournalTitleGeoJournal 82, 355–368, DOI: 10.1007/s10708-015-9690-y (2017).
- [32] Barbosa, H. et al. Uncovering the socioeconomic facets of human mobility. \JournalTitleScientific Reports 11, 8616, DOI: 10.1038/s41598-021-87407-4 (2021).
- [33] Anderson, K. F. & Galaskiewicz, J. Racial/Ethnic Residential Segregation, Socioeconomic Inequality, and Job Accessibility by Public Transportation Networks in the United States. \JournalTitleSpatial Demography 1–33, DOI: 10.1007/s40980-021-00093-8 (2021).
- [34] Luca, M., Campedelli, G. M., Centellegher, S., Tizzoni, M. & Lepri, B. Crime, inequality and public health: a survey of emerging trends in urban data science. \JournalTitleFrontiers in Big Data 6, 1124526, DOI: 10.3389/fdata.2023.1124526 (2023).
- [35] Moreira, G. C. & Ceccato, V. A. Gendered mobility and violence in the São Paulo metro, Brazil. \JournalTitleUrban Studies 58, 1–20, DOI: 10.1177/0042098019885552 (2020).
- [36] Tiznado-Aitken, I., Sagaris, L. et al. Uncovering gender-based violence and harassment in public transport: Lessons for spatial and transport justice. \JournalTitleJournal of Transport Geography 114, 103766, DOI: 10.1016/j.jtrangeo.2023.103766 (2024).
- [37] Giupponi, G. & Machin, S. Labour market inequality. \JournalTitleOxford Open Economics 3, i884–i905, DOI: 10.1093/ooec/odad039 (2024).
- [38] Hrelja, R., Khan, J. & Pettersson, F. How to create efficient public transport systems? A systematic review of critical problems and approaches for addressing the problems. \JournalTitleTransport Policy 98, 186–196, DOI: 10.1016/j.tranpol.2019.10.012 (2020).
- [39] Chacon-Hurtado, D., Kumar, I., Gkritza, K., Fricker, J. D. & Beaulieu, L. J. The role of transportation accessibility in regional economic resilience. \JournalTitleJournal of Transport Geography 84, 102695, DOI: 10.1016/j.jtrangeo.2020.102695 (2020).
- [40] D’ignazio, C. & Klein, L. F. Data feminism (MIT press, 2023).
- [41] Perez, C. C. Invisible women: Data bias in a world designed for men (Abrams, 2019).
- [42] Roy, S., Bailey, A. & van Noorloos, F. Understanding the barriers affecting women’s mobility in the first-and last-mile stretches in low-and middle-income countries: A systematic review. \JournalTitleJournal of Transport Geography 121, 104036, DOI: 10.1016/j.jtrangeo.2024.104036 (2024).
- [43] Kapsalis, E., Jaeger, N. & Hale, J. Disabled-by-design: effects of inaccessible urban public spaces on users of mobility assistive devices – a systematic review. \JournalTitleDisability and Rehabilitation: Assistive Technology 19, 604–622, DOI: 10.1080/17483107.2022.2111723 (2024).
- [44] Hanson, S. Gender and mobility: new approaches for informing sustainability. \JournalTitleGender, Place & Culture 17, 5–23, DOI: 10.1080/09663690903498225 (2010).
- [45] Hail, Y. & McQuaid, R. The concept of fairness in relation to women transport users. \JournalTitleSustainability 13, 2919, DOI: 10.3390/su13052919 (2021).
- [46] Pereira, R. H., Schwanen, T. & Banister, D. Distributive justice and equity in transportation. \JournalTitleTransport Reviews 37, 170–191, DOI: 10.1080/01441647.2016.1257660 (2017).
- [47] Hu, L. Gender differences in commuting travel in the US: interactive effects of race/ethnicity and household structure. \JournalTitleTransportation 48, 909–929, DOI: 10.1007/s11116-020-10085-0 (2021).
- [48] Audrey, S. & Batista-Ferrer, H. Healthy urban environments for children and young people: A systematic review of intervention studies. \JournalTitleHealth & Place 36, 97–117, DOI: 10.1016/j.healthplace.2015.09.004 (2015).
- [49] Schipperijn, J. et al. The role of playgrounds in promoting children’s health – a scoping review. \JournalTitleInternational Journal of Behavioral Nutrition and Physical Activity 21, 72, DOI: 10.1186/s12966-024-01618-2 (2024).
- [50] Baldovino-Chiquillo, L. et al. Effects of an urban cable car intervention on physical activity: the TrUST natural experiment in Bogotá, Colombia. \JournalTitleThe Lancet Global Health 11, e1290–e1300, DOI: 10.1016/S2214-109X(23)00274-7 (2023).
- [51] Rubio, M. A. et al. The impacts of an urban cable car system on liveability: a mixed methods study in Bogotá, Colombia. In The Empathic City: An Urban Health and Wellbeing Perspective, 311–345, DOI: 10.1007/978-3-031-32840-4_14 (Springer, 2023).
- [52] Powell, R. Child-friendly cities and communities: opportunities and challenges. \JournalTitleChildren’s Geographies 1–14, DOI: 10.1080/14733285.2024.2353746 (2024).
- [53] United States Census Bureau. Census Data API User Guide. Available at: https://www.census.gov/data/developers/guidance/api-user-guide.html (2024).
- [54] United States Census Bureau. American Community Survey. Available at: https://www.census.gov/programs-surveys/acs/.
- [55] OpenStreetMap contributors. Planet dump retrieved from https://planet.osm.org . https://www.openstreetmap.org (2017).
- [56] Pappalardo, L., Pedreschi, D., Smoreda, Z. & Giannotti, F. Using big data to study the link between human mobility and socio-economic development. \JournalTitleProceedings - 2015 IEEE International Conference on Big Data, IEEE Big Data 2015 871–878, DOI: 10.1109/BigData.2015.7363835 (2015).
- [57] Lenormand, M. et al. Entropy as a measure of attractiveness and socioeconomic complexity in Rio de Janeiro metropolitan area. \JournalTitleEntropy 22, 368, DOI: 10.3390/e22030368 (2020).
- [58] Oliphant, T. Guide to NumPy (Trelgol Publishing, 2006).
- [59] van der Walt, S., Colbert, S. C. & Varoquaux, G. The NumPy Array: A Structure for Efficient Numerical Computation. \JournalTitleComputing in Science Engineering 13, 22–30, DOI: 10.1109/MCSE.2011.37 (2011).
- [60] Joris, V. et al. geopandas/geopandas: v1.0.1, DOI: 10.5281/zenodo.12625316 (2024).
- [61] Hunter, J. D. Matplotlib: a 2D graphics environment. \JournalTitleComputing in Science & Engineering 9, 90–95, DOI: 10.1109/MCSE.2007.55 (2007).
Declaration
For the purpose of open access, the authors have applied a Creative Commons Attribution (CC BY) licence to any accepted manuscript version arising from this submission.
Acknowledgements
The authors are grateful to Laura Lotero for helpful discussions during the preliminary stages of the work. AC acknowledges financial support from the Ramón y Cajal program through the grant RYC2023-044587-I.
Author contributions statement
MM and RM developed the original ideas; All authors designed the study; AC supervised the development of the experiments; AC wrote the formalisms; MM collected, curated, and integrated the raw data; MM performed the analysis; All authors analysed the results; All authors wrote the paper; MM and AC prepared the graphics. All authors read, reviewed, and approved the final manuscript.
Additional information
- Competing interests
-
The authors declare no competing interests.
- Availability of data and materials
-
The data will be made publicly available upon acceptance of the paper.
- Ethical approval
-
This article does not contain any studies with human participants performed by any of the authors.
- Informed consent
-
This article does not contain any studies with human participants performed by any of the authors.