AppSupplemental Materials References
.tocmtchapter \etocsettagdepthmtchaptersection \etocsettagdepthmtappendixnone
Are Politicians Responsive to Mass Shootings? Evidence from U.S. State Legislatures††thanks: The authors thank Emily Rusting and Luis Muñoz for their excellent research assistance, the Giffords Law Center for providing conditional access to internal data, as well as the Violence Project and Gun Violence Archive for data on mass shootings. We are also indebted to the participants of the qualitative interviews reported in this paper, and thank them for their time and public service. For helpful discussion and comments, we thank Kathy Bawn, Ryan Baxter-King, Nathaniel Birkhead, Chad Hazlett, Justin Kirkland, Matthew Lacombe, Adam Lankford, Jeffery Lewis, James Macinko, Amanda Mauri, Julia Payson, Diana Silver, Chris Tausanovitch, Dan Thompson, Lynn Vavreck, attendees of the 2024 American Political Science Association Annual Meeting and 2024 National Research Conference for the Prevention of Firearm-Related Harms, members of the Practical Causal Inference Lab, and members of the UCLA American Politics Working Group. Special thanks to UCLA’s Initiative to Study Hate for their generous support of this research. The authors contributed equally and are listed alphabetically.
Abstract
The United States leads the world in the number of violent mass shootings that occur each year, and policy making on firearms remains polarized along party lines. Are legislators responsive to mass shootings? We estimate the latent positions of nearly 2,000 state legislators on gun policy from their roll-call voting records on firearm-related bills from 2011 to 2022. Employing a staggered difference-in-differences design, we find that mass shootings within or near a state legislator’s district do not alter their voting behavior on firearm policy, on average, for members of both parties. Our estimated effects of mass shootings on treated legislators’ support for restrictive gun policies (on a -1 to 1 scale) range from a 4.8% reduction among California Democrats and a 0.9% increase among California Republicans to, across six total states, a 5% (among Democrats) and 7.1% (among Republicans) increase, with 95% confidence intervals spanning opposite directions. We conclude that, on average, mass shootings fail to produce changes in a legislator’s support (opposition) for restrictive (permissive) firearms bills. Our findings suggest that even the most heinous acts of mass violence — that are squarely in the domain of events that state legislators might respond to — fail to produce any measurable effects on legislators’ positions on firearm-related policy.
1 Introduction
On May 24th, 2022, an 18-year-old gunman armed with a semi-automatic AR-15 style rifle entered Robb Elementary School in Uvalde, Texas, and fatally shot 2 teachers and 19 fourth-grade students. In the wake of the tragedy, state legislators called on Governor Greg Abbott (R) to convene a special legislative session to debate methods of reducing gun violence. Ultimately, the session was called, and legislation to raise the minimum age required to purchase semi-automatic rifles from 18 to 21 was introduced. In a surprise turn, two Republicans, Representatives Sam Harless (TX-126) and Justin Holland (TX-33), voted with Democrats to advance the legislation out of committee, though the bill died soon after. Both representatives defended their breaking with the Republican party, with Harless saying his vote “was the least [lawmakers] could do for the families” of the victims.333https://www.houstonpublicmedia.org/articles/news/politics/gun-control/2023/05/08/451146/texas-raise-age-assault-rifle-bill-passes-committee-house.
Are legislators responsive to tragedies that occur in their districts? Scholarship on whether citizens hold governmental institutions and representatives accountable for negative shocks — including unanticipated ones — generally suggests that voters consider elected officials at least somewhat responsible when disasters occur under their watch (e.g., Fiorina, 1978; Healy and Malhotra, 2009; Gasper and Reeves, 2011; Heersink, Peterson and Jenkins, 2017). Under the theories presented in the extant scholarship on this subject, one might anticipate that legislators who represent districts experiencing increasing rates of crime adjust their voting behavior to be tougher on criminals Arnold and Carnes (2012), or that representatives of districts affected by economic shocks from international competition may vote in a more protectionist manner on trade-specific bills (Feigenbaum and Hall, 2015). One might also think that legislators representing areas devastated by wildfires (Hazlett and Mildenberger, 2020; Ramos and Sanz, 2020), floods (Arceneaux and Stein, 2006; Bechtel and Hainmueller, 2011; Stout, 2018), or other natural disasters (e.g., Malhotra and Kuo, 2008, 2009; Atkeson and Maestas, 2012; Carlin, Love and Zechmeister, 2014; Katz and Levin, 2016) vote more favorably for emergency aid spending measures, for instance, so that their respective electorates approve of their responses to crises when election day rolls around. But do individual legislators change their voting behaviors to respond to these crises in a measurable manner?
The current scholarship on behavioral responses to mass shootings — an example of a crisis event that legislators might respond to — has particularly focused on the effects of these events on public opinion (Gunn et al., 2018; Barney and Schaffner, 2019; Newman and Hartman, 2019; Rogowski and Tucker, 2019), the electoral behavior of affected constituencies (Hassell, Holbein and Baldwin, 2020), and the firearm-related policy environments of states (Luca, Malhotra and Poliquin, 2020), but the results are decidedly mixed. In some instances, scholars find that mass shootings cause surges in engagement with gun policy (Reny et al., 2023) while others find that other responses are limited by temporal, spatial, and political factors (Sharkey and Shen, 2021). In a similar vein, it appears that some mass shootings — particularly those with high levels of media coverage — coincide with increases in firearms purchasing while others do not (Iwama and McDevitt, 2021; Liu and Wiebe, 2019). Additional evidence suggests that legislators may lack the ability or incentive to adjust their behavior even when facing possible ideological, environmental, or electoral pressures (Butler and Hassell, 2018; Bromley-Trujillo and Poe, 2020). Even if we believe that mass shootings might lead to shifts in opinions on firearm-related policies — which is not obvious, as per Baxter-King (2024) — there may not be enough of a change in the electoral behavior of affected constituencies to cause a legislator to alter their voting behavior on relevant policies, even as some scholars find that members of Congress who are facing reelection pressures, and represent sizable “pro-gun constituencies”, may be more likely change how they vote on gun-related legislation (Bouton et al., 2014). Furthermore, it is not clear that changes in the voting behaviors or policy preferences of a legislator’s constituency (should they occur) would prompt changes in a representative’s actions (Rogers, 2017).
Our paper investigates the effects of exposure to mass shootings on the voting behavior of state legislators who represent the communities most directly impacted by these events. We focus our analysis on estimating the aggregate effect of mass shootings on the behavior of lawmakers rather than shooting-specific effects. We combine roll-call voting records of California state legislators with a novel dataset from the Giffords Law Center (GLC) that ranks every firearm-related bill introduced in the California State Assembly and Senate from 2011 to 2022 on a permissive to restrictive scale.444We validated the GLC’s bill rankings, which is discussed in greater detail in S.3. Using pairwise comparison and the Bradley-Terry model (Bradley and Terry, 1952), we construct a yearly score of each individual lawmaker’s directionality of support for gun control legislation from the 2011-2012 to 2021-2022 sessions. Our scoring regime covers 264 individual California legislators over twelve years.
Using this measure of an individual legislator’s latent position on firearms policy over time, we identify which legislators represented districts that experienced a mass shooting between 2011 and 2022. Through a difference-in-differences design accounting for heterogeneity in treatment timing, we estimate whether the occurrence of a mass shooting within a legislator’s district causes a measurable change in their position on gun policy. We find that when a mass shooting occurs within a legislator’s district, California lawmakers reduce their support for gun control policies by approximately 1.45% compared to all other legislators (ATT = -0.029, SE = 0.062, outcome measured on a -1 to 1 scale), though this estimate is a precise and statistically insignificant null. Our results find no evidence of such responsiveness and these statistically insignificant estimates persist across multiple estimation strategies and varied treatment assignments (such as estimations accounting for the distance of a legislator’s district from a mass shooting). This finding conflicts with the self-reported assessments of responsiveness to mass shootings that these same legislators described in a series of qualitative interviews we conducted. In sum, our mixed-methods approach in California finds that legislators do not change their voting behavior following a mass shooting — though this finding only speaks to a single metric of legislator behavior in a single state.
As a robustness check on our main findings for California, we analyze the effects of mass shootings on the gun control positions of state legislators in five additional states: Colorado, Florida, Georgia, Missouri, and Texas.555The GLC ranks every state in terms of how restrictive the gun policy environment is. In this paper, we focus on states that had at least one mass shooting occur during our period of study and select one state from each of the quintiles of the GLC ranking: California (1), Colorado (10), Florida (24), Georgia (33), and Missouri (48). Texas (31) is also included as it experienced a large number of shootings (6) during our period of study, and has a more permissive policy environment than California. This offers an opportunity to assess the effects of mass shootings in varying firearms policy environments. These states all experienced at least one mass shooting during the time period we study in this paper. Ultimately, we find that across a twelve year period, 28 mass shootings — occurring in 6 states and requiring the scoring of nearly 2,000 individual state legislators over time — caused no discernible change in the gun control positions of state legislators on regulatory proposals on firearms, on average, when such an event occurs within their districts. We also inspect other forms of behavior that legislators may engage in: similar to our main results, we find that legislators do not cosponsor or author more or fewer firearm-related bills following a mass shooting, on average.
The following section discusses the theoretical framework situating these findings, and reports the results of a series of qualitative interviews with California lawmakers who represented affected districts at the time of mass shootings. These legislators largely reported positive self-assessments of their responsiveness to the crises brought about by mass shootings in their districts, claiming that they brought legislation to the floor or voted favorably on certain bills that they would not have in the absence of the shooting. Our assessments of the roll-call voting records of these same legislators (and others) tells a different story. Overall, our findings suggest that partisan polarization has led to a policy environment wherein even highly salient focusing events such as mass shootings, which may otherwise be reasonably thought to cause changes in a legislator’s stance on firearms related policy, fail to produce any measurable effects on legislative voting behavior.
2 Theory and Qualitative Findings
To better inform our expectations regarding the effects of mass shootings on the voting behaviors of state legislators, we conducted a series of qualitative interviews with five current and former members of the California state legislature who represented districts in which a mass shooting had occurred between July 2010 and 2022.666Additional details on the procedures and results of these qualitative interviews can be found in section S.1 of the Supplemental Materials. In this section, we introduce the literature that informs our theoretical expectations, and discuss the results of these qualitative interviews that support and contradict our priors.
2.1 Do Mass Shootings Incentivize Agenda Setting or Act as Windows of Policy Opportunity?
Political agenda setting — which can be conceptualized as political elites’ ability to influence public opinion and public policy, for instance — has long been considered the “prime instrument of power” wielded by lawmakers to alter the nature of political conflict (Schattschneider, 1960). At the sub-national level, political agenda setting is largely driven by questions of issue prioritization, as state or local officials determine which areas to focus their rather limited policy making resources on addressing (Franklin and Ebdon, 2004; Erie, Kogan and MacKenzie, 2011). Mass shootings, as highly salient events that capture the attention of the mass public and media, may then serve as an opportunity for state legislators to set legislative priorities and build on the public’s attention towards specific issues. As Legislator A (D, Southern California) said in their interview with us, the shooting in their district offered them an opportunity to “use the moment, in all its horrifying nature, to also give [the victim’s] lives and their deaths meaning.”
Media and public attention directed to mass shootings is essentially an opportunity for cost-less agenda setting for legislators, as they do not need to expend their own political capital to raise the issue (McCombs and Shaw, 1972; Iyengar and Kinder, 1987; Gerber, Karlan and Bergan, 2009). As Legislator B (D, Southern California) told us: “If you’re a gun violence prevention advocate and you don’t try to act in the aftermath of a horrific tragedy, you have, in many ways, lost an opportunity for public attention to be focused for long enough to get something to actually change.”
On the other hand, one may doubt that elected officials, perhaps particularly at the sub-national level, can readily change political agendas or set legislative priorities, and therefore mass shootings may not be capable of influencing political actions such as voting behaviors (Butler and Hassell, 2018; Barberá et al., 2019). It may well be the case that in a highly polarizing partisan environment, the parties and party leadership exercise more control over agenda setting than individual legislators (Edwards and Wood, 1999). This was echoed by Legislator C (R, Southern California), who said:
“I was basically told by my own party to shut up. I was told ‘if you speak on [gun control issues], we’re going to disown you’, effectively. And so that was a big giant thumb on the scale right there — the neutralization of an opposing viewpoint was critical to the Republican Party.”
The threat of sanctions or punishment for stepping out of line with party leaders may serve as a deterrent to individual legislators considering options to use mass shootings to set the agenda, even as their overall ability to do so, separately from responding to mass shootings, is still an active area of debate in the broader agenda setting literature.
Mass shootings may also serve as “policy windows” of opportunity (Kingdon, 1984; Baumgartner and Jones, 2010) for legislators to propose and enact legislation directly related to firearms violence. Legislator D (D, Northern California) spoke on how their legislative priorities changed following the shooting: “I think in the aftermath of [the shooting], you look at what happened… and I brought legislation forward in that regard. Legislation that we should have seen at [the] time [of the shooting].” And, as Legislator A told us, “If you look at history, great public policy opportunities always come out of great tragedies happening.”
Mass shootings might also be thought of as “focusing events” that serve to lead groups (such as interest groups or parties) to act on particular issues in the wake of an event that can be specifically tied to a policy domain (Kingdon, 1984; Birkland, 1997; Hassell, Holbein and Baldwin, 2020). Legislator C (a Republican) expressed frustration with how the Democratic Party, from their perspective, used the shooting occurring within their district to focus the legislative agenda on gun control policies:
“What really frustrated me with my Democratic colleagues at the time [was that] they took advantage of that tragedy… [and] pushed through a whole bunch of legislation that would have had no impact on… what occurred in the slightest. It was just a Trojan horse to be able to push through legislation that I think was unconstitutional.”
Democratic lawmakers are generally more favorable to restrictive firearms policies (Cook and Goss, 2020; Spitzer, 2023), so it is perhaps unsurprising that Legislator C saw Democrats using the shooting in their district as a focusing event more so than Republican legislators.
But if mass shootings serve as windows of policy opportunity or focusing events, do they actually lead to substantive or measurable changes in the firearm-related policy environment of a state? The extant scholarship suggests that they do, in some limited circumstances, such as with specially tailored legislation designed to address gaps in policy that, if they had been filled, may have prevented the tragedy from occurring (Tomsich et al., 2023). Studying the effects of mass shootings in the United States more broadly, scholars show that the number of firearm-related bills introduced in a state in the year after a shooting increases by roughly 15%, on average, with this estimate increasing if a shooting received greater media coverage, and the effect depending on the party in power — as more bills are introduced in Republican-controlled legislatures (Luca, Malhotra and Poliquin, 2020). Whether these bills lead to substantive policy change that would prevent mass shootings is something that is still up for some debate, however, and as Legislator E (D, Southern California) said,
“I think you can liken all the legislation we passed with Swiss cheese. If you put enough layers of Swiss cheese on top, you eventually start filling some holes.”
Some legislators clearly grappled with whether the policy windows or focusing events provided by mass shootings were effective in reducing gun violence or substantially changing the firearms policy environment. Perhaps, then, one might expect mass shootings to serve as events that cause a legislator to change their voting behavior on firearms policy to become more (for Democrats) or less (for Republicans) supportive of restrictive gun laws, relative to other legislators and members of their party who have not had mass shootings occur within their district.
2.2 The Limited Effects of Mass Shootings in an Era of Partisan Polarization
Over the time that we study in this paper (2011-2022), public opinion on gun policy has become increasingly divided along partisan lines (Joslyn et al., 2017; Joslyn, 2020; Cook and Goss, 2020; Sides, Tausanovitch and Vavreck, 2022; Merry, 2023), and the partisanship of elected officials oftentimes serves as a heuristic to voters about where a candidate stands on firearm-related policy.777https://www.politico.com/news/2022/11/03/dems-finally-passed-gun-legislation-and-they-havent-paid-an-electoral-price-for-it-00064885. Policymakers, particularly at the state-level, may reasonably be under immense pressure from gun rights advocates, considering the distinct level of political engagement and organization among gun owners (Lacombe, 2019), the close attention paid to and strong opinions on firearms policy held by these individuals (Lacombe, Howat and Rothschild, 2019), and the outsize role of gun rights and industry-related interest groups in campaign contributions to elected officials (Richards, 2017). One might think, then, that legislators are unwilling to alienate these groups at the risk of jeopardizing their chances of reelection (Bouton et al., 2014).
Scholarship on the politics of gun control characterizes debates in this policy domain as a reoccurring cycle of “outrage-action-reaction” that ultimately contributes to gridlock on firearm-related policy (Spitzer, 2023) — events such as mass shootings produce a demand for legislation which is then followed by the possibility or reality of policy being adopted, and, finally, a subsequent backlash against these gains from opposing groups. This cyclicality all but ensures a stagnant policy environment, especially when one also considers the relative stability of public opinion on firearms policy in the aftermath of a shooting (Gunn et al., 2018; Barney and Schaffner, 2019; Newman and Hartman, 2019; Rogowski and Tucker, 2019; Hassell, Holbein and Baldwin, 2020; Baxter-King, 2024), and the polarized nature of state legislatures during this time period (Phillips et al., 2024). This begs the question: In an era of intense partisan polarization on firearms policy, do mass shootings affect the behaviors of legislators?
The results from our qualitative interviews suggest that partisan polarization may play a substantial role in informing the responsiveness of legislators to mass shootings that occur within their respective districts. Legislator E, a Democrat, spoke about how partisan polarization certainly informed their responses to the shooting in their district, saying “[I was] trying to walk that very fine line because of political differences in a community that’s more conservative. There were definitely some families [of victims] that were a little more Second Amendment oriented than others.” Legislator C, a Republican, spoke about the role of partisan polarization more bluntly, explaining what their party told them after the shooting: “I was told directly, if I speak about [gun control], it’s going to cost $1,000,000 per Tweet. For us to defend you in the next election, it’s going to cost 1,000,000 bucks a Tweet.” The direct threat of sanctions from party leadership that would affect a legislator’s campaign warchest suggests that any sort of defection — even one as mundane as a Tweet — from policy positions preferred by the party would result in severe consequences.888We cannot confirm the veracity of Legislator C’s claims about sanctions threatened by the California GOP. We can, however, confirm that Legislator C did not post a single Tweet related to a firearms policy proposal until 181 days after the shooting. This Tweet was expressing opposition to a permissive policy.
We posit that as partisan polarization has increased and firearms policy has been delegated to state legislatures, Democratic and Republican legislators have become less willing to defect from their party when voting on firearm-related policy. Given that the parties are so starkly divided, voting on firearms policy may be constrained by floor and ceiling effects. Republicans, for instance, may not be able to become more permissive in their voting behavior if permissive bills are seldom introduced in a liberal state legislature (or vice versa for Democrats), nor if they’re already voting favorably on every permissive bill and against all restrictive bills. Furthermore, they may be unwilling to vote in favor of restrictive policies so long as threats about sanctions from party leaders persist (such as those allegedly leveled against Legislator C). On the other hand, Democrats may not vote more favorably on restrictive policy after a shooting if they are already voting as favorably as possible in the time before a shooting (following cues from their party), and similarly may be unwilling to break with their party to support permissive policy, thus moving them more in line with Republicans.
Even with the results of our qualitative interviews suggesting that California lawmakers perceive themselves as very responsive to mass shootings that occur within their districts, we expect to find null results when assessing the effects of mass shootings on the voting behavior of legislators on firearm-related policies. We expect this lack of change in behavior to be driven by partisan polarization — absent polarization, Republicans might favor gun control bills, or Democrats may favor more permissive policies. However, we predict that the partisan environment prevents “defections” in voting behavior, though we do not presume to suggest that other forms of behavior that legislators may engage in would be similarly unaffected. Voting is but a single behavior of many that legislators engage in, and quantifying voting is constrained by the fact that legislators can really only do three things when voting: vote “yea”, vote “nay”, or not vote at all (or abstain, which is, in effect, the same as not voting). A legislator cannot vote “extra yea” on an item, so floor and ceiling effects on our measure of voting behavior are reasonable concerns for our empirical approach.
We expect that mass shootings will not cause a measurable change in the voting behavior of legislators that represent affected districts. With our theoretical expectations in mind, we turn next to describing the data underlying this paper, and our methodological approach for causally identifying the effects of mass shootings on legislative voting behavior.
3 Data and Methods
3.1 Mass Shootings in Scope of Study
To identify mass shootings for the purposes of this study, we rely upon a definition established by the Congressional Research Service, which is aligned with definitions used by researchers across a variety of disciplines (e.g., Luca, Malhotra and Poliquin, 2020; Peterson and Densley, 2022). Under this definition, a mass shooting is an incident in which four or more victims (not including the shooter) are murdered with firearms in a single, continuous incident in a public location that is unrelated to other types of criminal activity (such as gang violence).999We note that this definition certainly does not encompass all gun violence incidents that might reasonably act as focusing events or opportunities for agenda setting, but this definition covers a large number of shootings and is used widely in research on these incidents. See https://sgp.fas.org/crs/misc/R44126.pdf.
We consider all mass shootings that occur in the United States between 2011 and 2022 as within our scope of study. Figure 1 shows which districts in particular states were affected by mass shootings occurring during this time period.
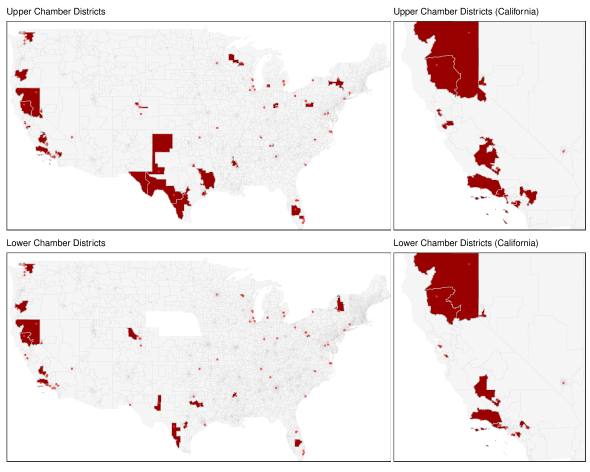
Note: Red districts are those affected by a mass shooting, shown as the small, light red points at the location of the shooting. The map uses district boundaries adopted after the redistricting cycle following the 2010 Census, and only plots shootings that affected districts under these new maps (accounting for variation in timing of adoption of these maps across states). For a full list of affected districts and shootings (including those happening prior to redistricting), see S.2. Nebraska has a unicameral state legislature, so we do not report lower chamber districts and only show upper chamber districts on the map.
Additional details on these shootings and the selection decisions underlying the inclusion of these states in our analyses can be found in Table S.2.1. For California, we consider the effects of eleven mass shootings.
3.2 Measuring Legislators’ Gun Policy Ideal Points
How polarized have legislators become on gun policy, and to what degree do mass shootings lead them to adjust their voting behavior on firearm-related bills? To answer this question, we first turn to a dataset maintained by the Giffords Law Center (GLC), a gun violence prevention advocacy organization.
3.2.1 GLC Firearm Bill Rankings and Bill Effects
From 2011 to 2023, the GLC hand-coded every bill introduced or enacted by every state legislature that was directly related to firearms policy — with the universe of legislation ranging from provisions allowing the permitless carry of concealed firearms, to large-scale budgetary items mentioning firearms in a single sub-item, to bans on assault-style weapons. This yields a total of 15,299 legislative attempts at the state level. For each of them, the GLC ranked it on a “weaken/neutral/strengthen” scale with regards to the bill’s likely effect on a state’s respective gun control policy environment (with “strengthen” bills making a state policy more restrictive and therefore more favorable to gun violence prevention advocates, for instance).101010Under the terms of a non-disclosure agreement dictating the amount and type of data that we are able to share in replication materials and publications, we arranged for conditional access to this as-of-yet untapped source of internal lobbying data. In Figure S.3.1, we plot the number of bills introduced in California over each legislative session, according to the GLC Firearm Bill Rankings, and find that California saw a large increase in the number of restrictive bills introduced over the period we study.
| Session Year | Bill Number | Status | Description | GLC Ranking | Bill Effect |
|---|---|---|---|---|---|
| 2013 | A.B.1014 | Enacted | Allows family members or law enforcement to petition for a Gun Violence Restraining Order (GVRO) if there is evidence that an individual poses a danger. The GVRO temporarily prohibits the individual from purchasing or possessing firearms or ammunition and permits law enforcement to remove existing firearms or ammunition. | Strengthen | +1 |
| 2013 | S.B.916 | Failed | This bill would allow a handgun manufacturer to return a model to the CA handgun roster without retesting if it was removed for reasons other than failing testing. It would expand exemptions for “new model” designation to include minor changes and permit dealers to sell off-roster handguns within 30 days. | Weaken | –1 |
| 2019 | A.B.1009 | Vetoed | This bill allows firearm transaction records to be submitted electronically, instead of by mail or in person, and authorizes the CA DOJ to charge reasonable processing fees for forms submitted by mail or in person. | Neutral | 0 |
-
•
Note: Bill descriptions and coding provided conditionally as a part of a data sharing agreement with the Giffords Law Center (GLC) and cannot be shared as a part of the replication materials. Descriptions of bills have been edited from original bill descriptions provided by the GLC to remove any confidential information.
In section S.3 of the supplemental materials, we discuss our validation procedure used for the GLC Bill Rankings, and we ultimately accept that “weaken” laws (according to the GLC) can generally be considered permissive (-1), “neutral” as neutral (0), and “strengthen” laws as restrictive (+1). We refer to this -1/0/+1 score as the “Bill Effect” throughout this paper — a novel measure of the relative restrictiveness or permissiveness of a firearm-related legislative measure introduced in a state. Table 1 shows three examples of bills from California during the period that we study, with the original GLC ranking and the Bill Effect.
3.2.2 Measuring Legislators’ Latent Position on Firearm-related Issues
Political Scientists have developed various methods of measuring a legislator’s ideal points through their roll-call votes (e.g., Poole and Rosenthal, 1997; Ansolabehere, Snyder Jr and Stewart III, 2001; Shor and McCarty, 2011). To measure an individual legislator’s position on firearm-related policies over time, we develop an issue-specific ideal point (), which we refer to as the “Gun Control Score”, by combining the Bill Effects and the roll-call vote data for both chambers of the state legislatures:111111The California Assembly and Senate roll call vote data is accessed through California Legislative Information website (https://leginfo.legislature.ca.gov). Roll call voting data for other states is collected from LegiScan (https://legiscan.com).
For state legislator , let be their latent gun control ideal points in a given year. We first map each vote on firearm-related legislation in the direction of supporting restrictive policies (support for gun control) for direct comparison (including floor votes among the entire chamber and committee or procedural votes where available). We then employ the Bradley–Terry model (Bradley and Terry, 1952; Hopkins and Noel, 2022) so that in each of the pairwise comparisons between legislator and legislator , the probability of being more supportive of restrictive policies than is . Then, the log-odds corresponding to is:
| (1) |
Assuming that each pairwise comparison is independent, the latent trait can be estimated by maximum likelihood. As we wish to compare legislators across time, we utilize a “bridge” legislator for every state who served in all sessions for which we have data — in California, Tori Atkins is used as our anchor to align the latent scores ().121212The assumption is that the bridging legislators’ underlying ideology changes only modestly from one year to the next. We select Toni Atkins because she is never treated in any of the specifications and she was a consistent leader in Democratic politics in CA during our period of study, serving as President Pro Tempore of the California State Senate, and previously as the Majority Leader of the California State Assembly. This assumption does not imply cross-state comparability. See Bailey (2007); Lewis and Tausanovitch (2015); Lewis and Sonnet (2020) for discussions on the limitations on the comparability of ideal point estimates. Finally, we rescale the scores to range from -1 to 1, from least to most supportive of restrictive firearms policies. For California legislators, the Gun Control Scores are calculated using 1927 votes on firearm-related issues (on average, 160.6 votes each year).
Unlike the conventional methods of using a spatial choice model or Bayesian Item Response Theory (IRT) model on a subset of roll-call voting records, our scoring regime uses the direct Bill Effects to orient scores in the direction of supporting gun control policies. As robustness checks, we also estimate latent traits using the IRT model (Clinton, Jackman and Rivers, 2004) in S.5.5 and discuss alternative measures such as survey responses in S.4.1. Figure 2 shows the distribution of the Gun Control Scores over time for California state legislators. We pick up a small, upward trend for all California state legislators over the years, indicating that California’s gun policy environment has become more restrictive just as the majority of legislators have become more favorable to restrictive policies, on average. However, there is still a clear separation between Democratic and Republican legislators, suggesting that partisan legislators are polarized on this policy domain.
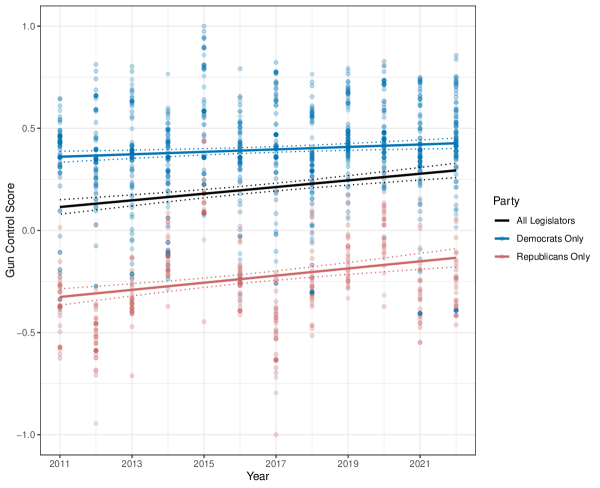
Note: Each point is an individual legislator’s score (N = 264, including legislators who switched party affiliation) for the corresponding year of the legislative session. Points are colored by the party affiliation of the legislator, and linear regression smoothers (with dotted standard errors) are fit to legislators in either party and across parties to show general trends in partisan voting behaviors across session years.
3.3 Treatment Assignment and Causal Identification
As seen in Figure 1 and Table S.2.1, the shootings we consider as “treatments” in this paper happened in different legislative districts across a wide time period, and in different states. Given this heterogeneity in treatment timing and location, traditional difference-in-differences (DiD) estimators (such as two-way fixed effects) are not appropriate for this setting as they fail to account for fluctuations in the effects of treatment due to adaptation, changing environmental conditions, or the immediacy of responses among treated units (Goodman-Bacon, 2021). For these reasons, we follow the staggered DiD estimation strategy proposed by Callaway and Sant’Anna (2021). In Section S.5.2, we validate these results by employing a stacked DiD estimation strategy similar to one used by Cengiz et al. (2019) to account for varied treatment timing.
The two central assumptions underlying these approaches are that of staggered treatment adoption and parallel trends with never-treated units. For this first assumption, we posit that once units (legislators in state A) receive a treatment (a shooting in state A occurring within or near their district, depending on the specification), they remain treated throughout the entire period of observation and treatment is irreversible. For parallel trends with never-treated units, we assume that groups of units during periods where treatment is not yet applied serve as control units — in other words, legislators who have not had a mass shooting occur within or near their district (and never do within the time frame we study) serve as controls — and these units would have followed similar trends in voting behavior in all post-treatment periods. This assumption relies on two conditions that our setting satisfies: (1) there must be a sufficiently powered group of units that never received treatment (we have 240 never-treated legislators in California, for example), and (2) these never treated units must be similar to those that receive treatment so that we can compare their outcomes. Additionally, we assume that there is limited anticipation of the treatment among all groups of units that are eventually treated. We report our validation and sensitivity analysis for these assumptions in Section S.5.1.
3.3.1 Formal Models
Our staggered DiD design follows the formal specification from Callaway and Sant’Anna (2021) and estimates the aggregated average treatment effect on treated units (ATT) across treatments as
| (2) |
where denotes a particular group of treated units at time period . Hence, is the expected difference between the observed Gun Control Score for treated legislators and untreated legislators at time t. In other words, this yields the group-time average treatment effect (Callaway and Sant’Anna, 2021; Baker, Larcker and Wang, 2022). In this setting, we consider a legislator as treated if they represented a district in which a shooting occurred at the time of the shooting. In this sense, we consider the effects of a shooting within legislators, and not within districts. This is detailed in the following section.
In practice, we need to estimate group-time-specific treatment effects to estimate , and we do so via the following regression
| (3) |
where denotes the Gun Control Score for legislator in time and group . represents the effect associated with group g at time t, with indicating if legislator i belongs to group g. We also include a time indicator effect, , where represents the effect associated with time t for group g. Using never-treated legislators as our control units, serves as an estimator for , as this term represents the interaction effect for group g at time t. In the formal specification of our model for California, we also include interacted legislator- and chamber-fixed effects. In models where we expand our study to include additional states, we include state-fixed effects with the interacted legislator- and chamber-fixed effects.
Ultimately, the unbalanced nature of our panel poses some issues for estimation insofar as we are limited in our ability to explicitly model the outcome evolution for individual legislators who drop out of (and, sometimes, back into) the data. Therefore, we use inverse probability weighting to model the conditional probability of legislator i being in group g, or an appropriate control group, given a set of included covariates.131313In the case of models for only California lawmakers, these covariates are unique legislator identifiers and an indicator for chamber, and for models including multiple states, we also include a state indicator. The benefit with this approach is that we essentially inflate the weights for units who are potentially under-represented due to the imbalanced nature of our data — an issue that is inherently present with a panel of legislators who rarely remain in office for the entire period of study.
3.3.2 Treatment Assignment
In assigning treatment, we consider the timing of a mass shooting during the course of a given year. If a shooting happens in the first 6 months of a year, the observations for that year are considered as post-treatment. If the shooting happens in the last 6 months, the observations for that year are considered pre-treatment, and the following year is considered post-treatment.141414The same strategy is ultimately used in Texas and Georgia, though many shootings occur between legislative sessions and therefore treatment timing is less attuned to what month the shooting occurred. Additionally, our identification strategy requires both a pre- and post-shooting observation for legislators in order to assess the effects of the shooting on their respective voting behavior. To that end, we filter out observations for legislators who assume office in the same year that is considered as the first post-treatment period, and those whose last session in office is the final pre-treatment period.151515From our original sample of 264 individual legislators in California with at least one year of a Gun Control Score, we are left with 255 total individual legislators for observation, and of the 24 initially treated legislators, we are left with 18 for our analyses, which can be seen in Figure S.6.1. We drop 3 additional control legislators who switched parties during the period of study. See Section S.5 for additional details.
4 Results
4.1 Shootings Occurring Within a California Legislator’s District Do Not Affect Their Position on Firearm-Related Policies
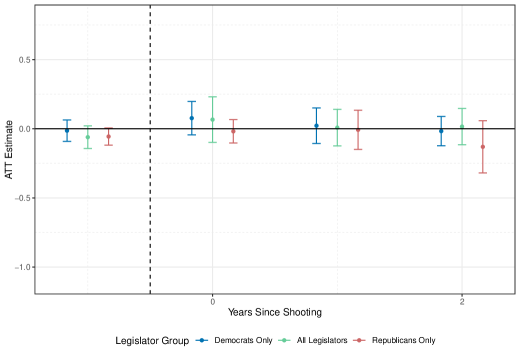
We report the results of our staggered DiD estimation for California legislators in Figure 3 and Table 2. For each time period relative to treatment,161616Under this design, the first period of observation is dropped to account for multicollinearity. we estimate the average treatment effect on the treated (ATT) legislator’s Gun Control Score, and consider never treated legislators as our control group. We rely on inverse probability weighting and cluster our standard errors (bootstrapped over 5,000 iterations) at the legislator-level. This approach has a number of benefits compared to the stacked design in Cengiz et al. (2019), which we use as a robustness check for our main results and report in Section S.5.2.
Figure 3 suggests that the occurrence of a mass shooting within a legislator’s district does not cause a legislator to change their gun control positions, on average. This null finding persists when we restrict our models to only compare treated legislators to all other legislators (green points), and compare treated legislators to untreated legislators who are members of the same party (red and blue points). We report the formal ATT estimates for the first post-treatment time period, , by each respective legislator group, in Table 2. In Table S.5.1, we report the full results of our staggered and stacked DiD designs across all three legislator groups.
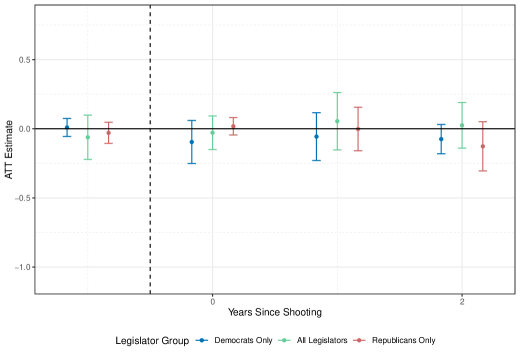
Note: This figure plots the ATT estimates for the period immediately prior to treatment, , the first post-treatment period, , and the periods 1 and 2 years following treatment ( and 2, respectively). The dashed vertical line represents the onset of treatment. 95% confidence intervals are based on standard errors clustered at the legislator level using inverse probability weighting. We confine the periods for which we report our estimates to only those that are most proximate to treatment, as we expect that these periods would be the most responsive to the mass shooting.
| Gun Control Score | |||
| (1) | (2) | (3) | |
| Shooting | -0.029 | -0.096 | 0.018 |
| (0.062) | (0.079) | (0.032) | |
| Legislator Group | All | Democrats | Republicans |
| # of Legislators | 255 | 172 | 83 |
| # of Mass Shootings | 11 | 6 | 5 |
| Leg. x Chamber FE | |||
| Pre-Treatment Mean | 0.005 | 0.306 | -0.272 |
-
•
Note: Robust standard errors clustered at the legislator level in parentheses. Gun Control Score is measured from -1 to 1, from least to most supportive of restrictive firearms legislation. Table reports the estimated effects of mass shootings occurring within a legislator’s district on a legislator’s Gun Control Score for the first post-treatment period, . Individual legislators who switch parties throughout the duration of study are also removed.
Across all three specifications, our results are null, and considering that the Gun Control Score is measured on a -1 to 1 scale, the model in Column 1 of Table 2 can be interpreted as a 1.45% decrease in a legislator’s support for restrictive firearms policies. The ATT in column 2 represents a 4.8% reduction among California Democrats and the estimate in column 3 translates to a 0.9% increase among California Republicans, with 95% confidence intervals spanning opposite directions. In sum, we find no statistically significant change in a California legislator’s annual Gun Control Score after a mass shooting occurs within the bounds of their district. In Section S.5.5, we report the results of these same model specifications but use a Bayesian IRT model to estimate positionality on gun policy as a robustness check (rather than using the Gun Control Score), and, again, find null results.
Our decision to limit the periods for which we report the ATT is motivated by a concern that periods far after treatment are subject to some source of unobserved confounding that our models are not accounting for. As only certain “types” of legislators (i.e., legislators who consistently get re-elected, or those who go on to serve in another chamber, for instance) persist as observations into the periods far after treatment (or, inversely, “survive” to eventually be treated from periods long before the shooting), the variation in the Gun Control Scores for these legislators is potentially biased by increased (or decreased) homogeneity in the observations, and a smaller number of observations in general. This can also be thought of as a form of selection bias: we are losing observations in the tails due to legislators not being re-elected or being term-limited from holding office again. With that in mind, our estimates closer to treatment are better powered and estimates far from treatment are less precise. In the following section, we widen our definition of treatment, and we ask whether legislators who represent a district near a mass shooting experience changes in behavior — not limiting treatment assignment to only those legislators who represented the districts in which the shootings occurred.
4.2 Null Effects of Mass Shootings Regardless of Distance from Shooting Location
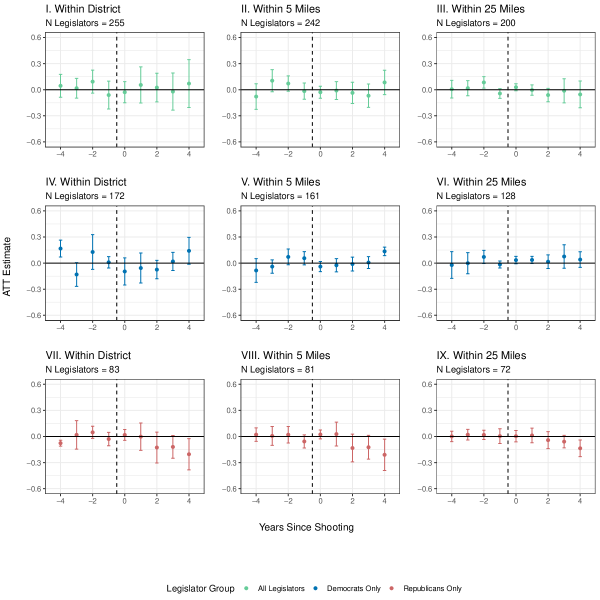
Note: We report the null effects of a mass shooting on the voting behavior of CA state legislators on firearm-related policy, with the staggered DiD models fit on all legislators, only Democratic legislators, and only Republican legislators — at varying distances of treatment assignment. For the models fit to legislators within 5 or 25 miles of a shooting, we consider legislators whose district boundaries intersect at any point within a 5 or 25 mile radii drawn from the location of a shooting as treated, respectively.
One concern with our previous approach is that we may have been overly restrictive in our treatment assignment. Mass shootings are highly salient events that presumably affect individuals in geographic areas that may be larger than the average legislative district in California (Hassell, Holbein and Baldwin, 2020; Reny et al., 2023). To identify legislators who may reasonably be treated (beyond those representing the districts in which the shootings occur) we turn to neighboring districts. In Section S.7, we detail the strategy through which we identified legislators that would be affected if we expanded our definition of treatment beyond “within district” — and we consider districts whose boundaries intersect with or are contained within 5 and 25 mile radii drawn from the location of the shooting, respectively.
As seen in Figure 4, as we expand the geographic range for treatment assignment, the number of grouped legislators declines as these multiple-treated units are removed from our analyses.171717Broadening our identification strategy poses some issues for the staggered DiD design that need to be resolved. The primary issue is that in widening the boundaries, some districts and legislators receive treatment at multiple time periods. To continue relying on never treated legislators as our control units, we drop any legislators who were treated by multiple shootings throughout their time in office. Even with this broadened definition of treatment, Figure 4 shows that the null finding holds. We do find some statistically significant estimates in the periods long after treatment, though for the same reasons mentioned in preceding sections, we are skeptical that these estimates are particularly reliable given (1) the relatively small number of legislators who remain in office for long periods in California; (2) the possibility that these estimates are driven by some unobserved confounding or are otherwise extraneous; and (3) these changes in voting behavior are not obviously caused by the treatment. Taken together, Figure 4 suggests that even when the effects of a mass shooting are assumed to be felt by legislators who are geographically proximate to a shooting — and not just the representatives for the district in which the shooting occurred — mass shootings do not appear to cause changes in a legislator’s positionality on gun control, regardless of party.
4.3 No Effect of Mass Shooting on Gun Control Score of Affected District’s Representatives
Our prior results estimated the effect of a mass shooting on the Gun Control Score of the individual legislators representing the district at the time of the shooting. In this section, we estimate the effect of a mass shooting on the Gun Control Score of any of the legislators representing a district in which a shooting occurred. In this sense, “treated” legislators are those who held office in the lower or upper chamber of an affected district, though they need not to have been in office at the time of a shooting. As we continue to rely on never-treated units as our control group, control units can only be legislators who never held office in a district that was previously or subsequently affected by a mass shooting.
Note: We report the null effects of a mass shooting on the voting behavior of CA state legislators on firearm-related policy, with the staggered DiD models fit on all legislators, only Democratic legislators, and only Republican legislators — who, at any time, represented a district that was affected by a mass shooting. Full results and additional details can be found in Section S.8.
One might think that mass shootings cause shifts in opinions on firearms policy among the electorate that lead to changes in the firearms-related policy positions of elected officials representing said district. Scholarship demonstrating the relative stability of public opinion on firearms-related issues would suggest that this is not the case (Baxter-King, 2024; Hassell, Holbein and Baldwin, 2020), and our results are in line with these findings. Figure 5 demonstrates that mass shootings have no effect, on average, on the Gun Control Score of state legislators representing affected districts.
5 Null Result Holds Across Additional States
To validate our null result for California lawmakers and discern whether the finding is generalizable in other contexts, we utilized GLC bill rankings paired with roll-call voting records from LegiScan in five additional states — Colorado, Florida, Georgia, Missouri, and Texas — to estimate the Gun Control Scores for an additional 1,707 state legislators between 2011 and 2022.181818Unfortunately, merging the LegiScan data and the GLC Bill Rankings led to some roll call votes not being included. This is an issue inherent with the LegiScan data as not all roll call votes are collected in every state in every year. We only report results for states with the most complete roll call data, and we drop years for which multiple votes are missing. The distribution of these scores over time and across states can be seen in Figure S.9.1.191919It is worth noting that not every state had data available for the entire period of study, though this ultimately has little bearing on our staggered DiD design. Additionally, the Texas and Georgia state legislatures meet biennially, so instead of having Gun Control Scores for every year, we have scores for legislators in these states once every two years. The addition of these five states brings the total number of mass shootings that we can study to 28, as seen in Table S.2.1. We score a total of 1,975 legislators across 6 states, 1,848 of whom are retained in our analyses, and 48 of whom are treated, and expect that the power and precision of our estimates should also improve.
Our estimation strategy largely follows the one outlined in Section 3.3.1, with the exception of interacting a state-fixed effect with the legislator- and chamber-fixed effect. The results of this analysis can be seen in Figure 6, in which we plot the ATT estimates at -1, 0, 1, and 2. Table 3 reports the formal estimates for .
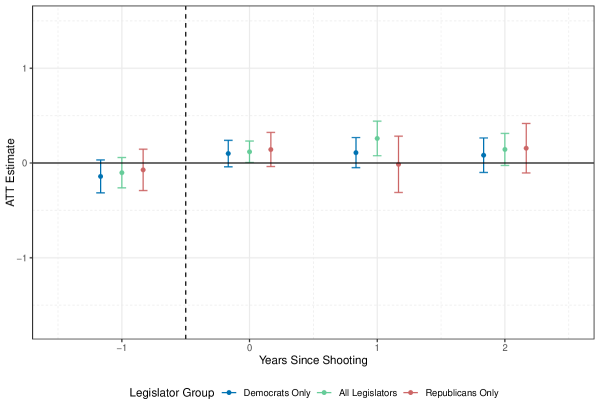
Note: We report the null effects, on average, of a mass shooting on the voting behavior of state legislators in California, Colorado, Georgia, Florida, Missouri, and Texas on firearm-related policy, with the staggered DiD models fit on all legislators, only Democratic legislators, and only Republican legislators. 95% confidence intervals are based on standard errors clustered at the legislator level using inverse probability weighting. We restrict our estimates to the legislative period immediately before a mass shooting and the three immediate post-treatment sessions ( -1, 0, 1, and 2). We consider the effects of 28 shootings across 1,956 individual legislators, 48 of whom are considered treated.
| Gun Control Score | |||
| (1) | (2) | (3) | |
| Shooting | 0.118 | 0.100 | 0.142 |
| (0.058) | (0.071) | (0.092) | |
| Legislator Group | All | Dems | Reps |
| # of Legislators | 1,848 | 795 | 1,057 |
| # of Mass Shootings | 28 | 17 | 14 |
| Leg. x Chamber x State FE | |||
| Pre-Treatment Mean | 0.032 | 0.227 | -0.178 |
-
•
Note: Robust standard errors clustered at the legislator level in parentheses. Gun Control Score is measured from -1 to 1, from least to most supportive of restrictive firearms legislation. Table records the estimated effects of mass shootings occurring within a legislator’s district on a legislator’s Gun Control Score for the first post-treatment period, . Independents are retained in the models including all legislators, but are dropped for the models estimating effects within party. Individual legislators who switch parties throughout the duration of study are also removed.
Figure 6 demonstrates that, as in California alone, mass shootings do not appear to have any statistically significant effect on the Gun Control Score of state legislatures representing the districts in which the shooting occurs. Considering the effects of a mass shooting on treated legislators compared to members of their same party, we find statistically insignificant increases among Democrats (Table 3, Column 2: a 5% increase) and Republicans (Table 3, Column 3: a 7.1% increase), respectively. The estimate of the effect of a mass shooting on the Gun Control Score of all treated legislators, regardless of party, at is 0.118 (SE = 0.058), which translates into a statistically significant ( = 0.05) 5.9% increase in a legislator’s gun control positions, on average, in the period immediately following treatment. Taken together, our results in this section confirm the generalizability of the null effect that we estimate in California: mass shootings do not cause a change in a legislator’s positions on firearm-related policy, on average.
6 Do Shootings Produce Differential Effects?
To answer this question, we turn to a strategy under the staggered DiD design that estimates the ATT by treatment groups that are assigned according to the first post-treatment year for treated observations. Therefore, for any shooting in which the first post-treatment year is coded as 2019, for example, the group would be 2019. As our assignment of treatment timing considers when in the course of a year the shooting took place and is not entirely dependent upon the year of the shooting, we end up constructing 10 group cohorts for the 28 shootings across the six states we study, as seen in Table S.2.1. Figure S.10.1 presents the group-time ATT estimates for accordingly, and while some estimates are statistically significant, many are quite noisy and most are null. This suggests that there is variation in the effects of particular shootings within post-treatment period groups.
Is Figure S.10.1 evidence of individual shootings producing measurable effects? Not necessarily. One limitation of our design is that we are unable to estimate the effects of particular shootings due to the binning of treatment events by post-treatment period. Subsequent work may benefit from a more fine-grained analysis regarding the characteristics of mass shootings that produce differential effects on legislator’s behavior. While disaggregating our estimates by group and time reveals some suggestive patterns, our overall null finding regarding the effect of mass shootings on the Gun Control Score of state legislators holds.
7 Do Legislators Respond to Shootings in Other Ways?
The preceding sections focus on only a subset of behaviors that legislators engage in: roll call voting on introduced bills. Would legislators respond to mass shootings in other ways that the Gun Control Score may fail to capture?
In the California State Legislature, legislators frequently sign bills as a cosponsor as a means of signaling support for a bill in a low-cost manner. We manually collected the sponsor and cosponsor lists of all firearm-related bills in both chambers of the California State Legislature from 2011 to 2022. Following Fowler (2006), we construct a directed cosponsorship network, with each edge drawn from a cosponsor of a bill to its sponsor. Figure S.11.1 describes this network. This network is densely interconnected, particularly among Democrats, suggesting partisan homophily in the sponsorship network. Table S.11.1 records the most “important” legislators in each session and chamber, measured by highest Outdegree (the number of bills a given legislator cosponsors in a year) centrality, Betweenness centrality, and Eigenvector centrality.
How might mass shootings affect the sponsorship and cosponsorship behaviors of California lawmakers? Beyond Outdegree (which only captures the cosponsorship activities), we define “Activity” as the fraction of firearm-related bills each legislator sponsors and cosponsors out of all firearm-related bills in a year. Together, these measures serve as proxies for a legislator’s level of activity in the gun policy domain, along distinct albeit complementary dimensions. In Table S.11.2, we report the results of our staggered DiD on these two outcomes of interest — Activity and Outdegree. We only find a statistically significant decrease in both the overall Activity measure and the Outdegree measure for treated Democrats, relative to other Democrats, following a shooting in the first post-treatment period. This suggests that treated Democratic legislators in California are less active in the gun policy domain, on average, in the year immediately following a mass shooting. This estimate, however, must be taken with a grain of salt considering possible pre-trending observed in the pre-treatment periods, suggesting a violation of the parallel trends assumption.
Of course, it is possible that legislators engage in other forms of behavior outside of the legislative process that we may fail to capture in this paper. In subsequent work, we aim to consider the effects of mass shootings on the public-facing behavior of lawmakers — such as social media activity and visits to victims — rather than just the more “official” forms of behavior our current study focuses on.
8 Conclusion
In this paper, we introduce a novel measure of an individual legislator’s position on firearm-related issues, measured on a permissive (-1) to restrictive (+1) scale. In introducing this scale, the Gun Control Score, our study contributes a robust tool for understanding legislative behavior on policy-area-specific issues. This approach enables a more nuanced analysis of legislative responses to mass shootings, a topic that remains underexplored despite its policy relevance. We define treated legislators as those who represent the districts in which mass shootings occur and we assess the effects of a shooting on the behavior of an individual elected official. While our analysis does not identify statistically significant changes in voting behavior, the findings underscore the durability of partisan polarization in shaping legislative responses to mass shootings. This resilience is evident across diverse states, legislative contexts, and definitions of treatment.
In California, we find a statistically insignificant 1.45% reduction in treated legislator’s support for restrictive firearm-related policies, compared to all other legislators, an insignificant 4.8% reduction among California Democrats, and an insignificant 0.9% increase among California Republicans. This null finding persists when we expand our definition of treatment to consider the role of geographic proximity and the effects of mass shootings on the voting behavior of legislators who represent districts near the shooting’s location and not just the district in which the shooting occurred. When we expand our analysis to include Colorado, Florida, Georgia, Missouri, and Texas, we again estimate statistically insignificant effects of mass shootings on legislators compared to members of their own party. Our scoring regime ultimately covers a total of 1,975 unique, individual legislators across six states from 2011 to 2022.
Our findings challenge canonical theories that posit focusing events, such as mass shootings, as critical junctures for policy change. Instead, the results highlight the limits of these events in altering entrenched partisan dynamics, suggesting that focusing events may have differential impacts based on the issue domain and political context. Legislators we interviewed told us that mass shootings led them to sponsor additional gun safety legislation, or reconsider how they could best represent the victims of mass shootings, but also admitted that pressures from party leaders constrained their autonomy in responding to the tragedy at hand. Others suggested that political differences within their constituencies led them to walk a “fine line” as a representative — they could not push a policy agenda at odds with the wishes of the families of victims, for instance. This was in stark contrast to others who told us that the tragedy offered an opportunity to push through policy changes deemed “great” by some legislators and “unconstitutional” Trojan horses by others.
This nuance helps contextualize our finding that shootings in particular periods of time may produce differential effects. Some scholarship suggests that particular mass shootings may lead to differential responses, with characteristics such as the race of victims leading to disparate legislative reactions or swings in public opinion (Markarian, 2024; Walker, Collingwood and Bunyasi, 2020). Future research should disaggregate the effects of individual shootings to explore whether high-profile events produce unique responses among legislators. Additionally, future studies focusing on other policy domains could assess whether the limited effect estimated in this study is unique to firearm-related issues or generalizable to other policy areas marked by polarization. In this sense, policy-specific ideal points estimates need not be tailored to firearms-related policies alone.
Partisan polarization has contributed to a stagnant firearms policy environment at the federal level, and our findings suggest that this may persist at the sub-national level both within the California Legislature and across five other states with varying gun policy environments. Our results suggest that while state legislatures are active on gun policy issues, mass shootings do not cause any measurable changes in individual-level voting behaviors of elected officials, on average. Every legislator we spoke with said, at different points, that they felt a degree of responsibility to act in the aftermath of the shooting, and yet our results suggest that these events, on average, do not cause a legislator to change their positions on firearm-related policies. This does not, however, indicate that a state’s firearm policy environment is necessarily stagnant — shootings may be changing the scope of legislation that lawmakers vote on (Luca, Malhotra and Poliquin, 2020), but that is beyond the scope of our current study.
This has mixed implications for the state of representative democracy, broadly speaking. On the one hand, the stagnation we observe in the voting behavior of state legislators suggests that they are not accountable to focusing events that may otherwise be thought to incite changes in their behaviors. On the other hand, perhaps this is to be expected, given the relative stability of public opinion on firearm policies after mass shootings. Regardless, while we do not intend to claim that individual votes on niche policies by state legislators capture the attention of the mass public, the outcomes of these votes do have long-lasting and far-reaching implications for accountability and representation.
Ultimately, our study demonstrates that mass shootings, while profoundly tragic, fail to cause disruptions in the entrenched partisan polarization that dominates gun policy debates in the United States. This stagnation underscores the need for innovative approaches to policymaking that do not rely upon legislative inertia, particularly at the state level. Without addressing these barriers, the potential for meaningful policy responses to mass violence will remain constrained.
References
- (1)
- Ansolabehere, Snyder Jr and Stewart III (2001) Ansolabehere, Stephen, James M Snyder Jr and Charles Stewart III. 2001. “The effects of party and preferences on congressional roll-call voting.” Legis. Stud. Q. 26:533.
- Arceneaux and Stein (2006) Arceneaux, Kevin and Robert M. Stein. 2006. “Who Is Held Responsible When Disaster Strikes? the Attribution of Responsibility for a Natural Disaster in an Urban Election.” Journal of Urban Affairs 28(1):43–53.
- Arnold and Carnes (2012) Arnold, R. Douglas and Nicholas Carnes. 2012. “Holding Mayors Accountable: New York’s Executives from Koch to Bloomberg.” American Journal of Political Science 56(4):949–963.
- Atkeson and Maestas (2012) Atkeson, Lonna Rae and Cherie D. Maestas. 2012. Catastrophic Politics: How Extraordinary Events Redefine Perceptions of Government. Cambridge University Press.
- Bailey (2007) Bailey, Michael A. 2007. “Comparable preference estimates across time and institutions for the court, congress, and presidency.” American Journal of Political Science 51(3):433–448.
- Baker, Larcker and Wang (2022) Baker, Andrew C, David F Larcker and Charles CY Wang. 2022. “How much should we trust staggered difference-in-differences estimates?” Journal of Financial Economics 144(2):370–395.
- Barberá et al. (2019) Barberá, Pablo, Andreu Casas, Jonathan Nagler, Patrick J. Egan, Richard Bonneau, John T. Jost and Joshua A. Tucker. 2019. “Who Leads? Who Follows? Measuring Issue Attention and Agenda Setting by Legislators and the Mass Public Using Social Media Data.” American Political Science Review 113(4):883–901.
- Barney and Schaffner (2019) Barney, David J. and Brian F. Schaffner. 2019. “Reexamining the Effect of Mass Shootings on Public Support for Gun Control.” British Journal of Political Science 49(4):1555–1565.
- Baumgartner and Jones (2010) Baumgartner, Frank R. and Bryan D. Jones. 2010. Agendas and Instability in American Politics. University of Chicago Press.
- Baxter-King (2024) Baxter-King, Ryan. 2024. “The Effect of Real-World Events on Political Attitudes and Preference Intensity: Evidence from Mass Shootings.”.
- Bechtel and Hainmueller (2011) Bechtel, Michael M. and Jens Hainmueller. 2011. “How Lasting Is Voter Gratitude? An Analysis of the Short- and Long-Term Electoral Returns to Beneficial Policy.” American Journal of Political Science 55(4):852–868.
- Birkland (1997) Birkland, Thomas A. 1997. After Disaster: Agenda Setting, Public Policy, and Focusing Events. Georgetown University Press.
-
Bouton et al. (2014)
Bouton, Laurent, Paola Conconi, Francisco Pino and Maurizio Zanardi. 2014.
Guns and Votes. Working Paper 20253 National Bureau of Economic Research.
http://www.nber.org/papers/w20253 - Bradley and Terry (1952) Bradley, Ralph Allan and Milton E Terry. 1952. “Rank analysis of incomplete block designs: I. The method of paired comparisons.” Biometrika 39(3/4):324–345.
- Bromley-Trujillo and Poe (2020) Bromley-Trujillo, Rebecca and John Poe. 2020. “The importance of salience: public opinion and state policy action on climate change.” Journal of Public Policy 40(2):280–304.
- Butler and Hassell (2018) Butler, Daniel M. and Hans J. G. Hassell. 2018. “On the Limits of Officials’ Ability to Change Citizens’ Priorities: A Field Experiment in Local Politics.” American Political Science Review 112(4):860–873.
- Callaway and Sant’Anna (2021) Callaway, Brantly and Pedro HC Sant’Anna. 2021. “Difference-in-differences with multiple time periods.” Journal of Econometrics 225(2):200–230.
- Carlin, Love and Zechmeister (2014) Carlin, Ryan E., Gregory J. Love and Elizabeth J. Zechmeister. 2014. “Natural Disaster and Democratic Legitimacy: The Public Opinion Consequences of Chile’s 2010 Earthquake and Tsunami - Ryan E. Carlin, Gregory J. Love, Elizabeth J. Zechmeister, 2014.” Political Research Quarterly 67(1):3–15.
- Cengiz et al. (2019) Cengiz, Doruk, Arindrajit Dube, Attila Lindner and Ben Zipperer. 2019. “The effect of minimum wages on low-wage jobs.” The Quarterly Journal of Economics 134(3):1405–1454.
- Clinton, Jackman and Rivers (2004) Clinton, Joshua, Simon Jackman and Douglas Rivers. 2004. “The Statistical Analysis of Roll Call Data.” American Political Science Review 98(2):355–370.
- Cook and Goss (2020) Cook, Philip J. and Kristin A. Goss. 2020. The Gun Debate: What Everyone Needs to Know. Oxford University Press.
- Edwards and Wood (1999) Edwards, George C. and B. Dan Wood. 1999. “Who Influences Whom? The President, Congress, and the Media.” American Political Science Review 93(2):327–344.
- Erie, Kogan and MacKenzie (2011) Erie, Steven P., Vladimir Kogan and Scott A. MacKenzie. 2011. Paradise Plundered: Fiscal Crisis and Governance Failures in San Diego. Stanford University Press.
- Feigenbaum and Hall (2015) Feigenbaum, James J and Andrew B Hall. 2015. “How legislators respond to localized economic shocks: Evidence from Chinese import competition.” The Journal of Politics 77(4):1012–1030.
- Fiorina (1978) Fiorina, Morris P. 1978. “Economic Retrospective Voting in American National Elections: A Micro-Analysis.” American Journal of Political Science 22(2):426–443.
- Fowler (2006) Fowler, James H. 2006. “Connecting the Congress: A study of cosponsorship networks.” Political Analysis 14(4):456–487.
- Franklin and Ebdon (2004) Franklin, Aimee and Carol Ebdon. 2004. “Aligning priorities in local budgeting processes.” Journal of Public Budgeting, Accounting & Financial Management 16(2):210–227.
- Gasper and Reeves (2011) Gasper, John T. and Andrew Reeves. 2011. “Make It Rain? Retrospection and the Attentive Electorate in the Context of Natural Disasters.” American Journal of Political Science 55(2):340–355.
- Gerber, Karlan and Bergan (2009) Gerber, Alan S., Dean Karlan and Daniel Bergan. 2009. “Does the Media Matter? A Field Experiment Measuring the Effect of Newspapers on Voting Behavior and Political Opinions.” American Economic Journal: Applied Economics 1(2):35–52.
- Goodman-Bacon (2021) Goodman-Bacon, Andrew. 2021. “Difference-in-differences with variation in treatment timing.” Journal of Econometrics 225(2):254–277.
- Gunn et al. (2018) Gunn, Laura H., Enrique ter Horst, Talar W. Markossian and German Molina. 2018. “Online interest regarding violent attacks, gun control, and gun purchase: A causal analysis.” PLOS ONE 13(11):e0207924.
- Hassell, Holbein and Baldwin (2020) Hassell, Hans J. G., John B. Holbein and Matthew Baldwin. 2020. “Mobilize for Our Lives? School Shootings and Democratic Accountability in U.S. Elections.” American Political Science Review 114(4):1375–1385.
- Hazlett and Mildenberger (2020) Hazlett, Chad and Matto Mildenberger. 2020. “Wildfire exposure increases pro-environment voting within democratic but not republican areas.” American Political Science Review 114(4):1359–1365.
- Healy and Malhotra (2009) Healy, Andrew and Neil Malhotra. 2009. “Myopic Voters and Natural Disaster Policy.” American Political Science Review 103(3):387–406.
- Heersink, Peterson and Jenkins (2017) Heersink, Boris, Brenton D. Peterson and Jeffery A. Jenkins. 2017. “Disasters and Elections: Estimating the Net Effect of Damage and Relief in Historical Perspective.” Political Analysis 25(2):260–268.
- Hopkins and Noel (2022) Hopkins, Daniel J and Hans Noel. 2022. “Trump and the shifting meaning of “conservative”: Using activists’ pairwise comparisons to measure politicians’ perceived ideologies.” American Political Science Review 116(3):1133–1140.
- Iwama and McDevitt (2021) Iwama, Janice and Jack McDevitt. 2021. “Rising Gun Sales in the Wake of Mass Shootings and Gun Legislation.” The Journal of Primary Prevention 42(1):27–42.
- Iyengar and Kinder (1987) Iyengar, Shanto and Donald R. Kinder. 1987. News that matters: Television and American opinion. University of Chicago Press.
- Joslyn (2020) Joslyn, Mark R. 2020. The Gun Gap: The influence of gun ownership on political behavior and attitudes. Oxford University Press.
- Joslyn et al. (2017) Joslyn, Mark R., Donald P. Haider-Markel, Michael Baggs and Andrew Bilbo. 2017. “Emerging Political Identities? Gun Ownership and Voting in Presidential Elections.” Social Science Quarterly 98(2):382–396.
- Katz and Levin (2016) Katz, Gabriel and Ines Levin. 2016. “The Dynamics of Political Support in Emerging Democracies: Evidence from a Natural Disaster in Peru.” International Journal of Public Opinion Research 28(2):173–195.
- Kingdon (1984) Kingdon, John W. 1984. Agendas, Alternatives, and Public Policies. Harper Collins.
- Lacombe (2019) Lacombe, Matthew J. 2019. “The Political Weaponization of Gun Owners: The National Rifle Association’s Cultivation, Dissemination, and Use of a Group Social Identity.” The Journal of Politics 81(4):1342–1356.
- Lacombe, Howat and Rothschild (2019) Lacombe, Matthew J., Adam J. Howat and Jacob E. Rothschild. 2019. “Gun Ownership as a Social Identity: Estimating Behavioral and Attitudinal Relationships.” Social Science Quarterly 100(6):2408–2424.
- Lewis and Tausanovitch (2015) Lewis, Jeffrey B and Chris Tausanovitch. 2015. When does joint scaling allow for direct comparisons of preferences? In Conference on ideal point models. Vol. 1.
- Lewis and Sonnet (2020) Lewis, Jeffrey B and Luke Sonnet. 2020. “Estimating NOMINATE scores over time using penalized splines.”.
- Liu and Wiebe (2019) Liu, Gina and Douglas J. Wiebe. 2019. “A Time-Series Analysis of Firearm Purchasing After Mass Shooting Events in the United States.” JAMA Network Open 2(4):e191736.
- Luca, Malhotra and Poliquin (2020) Luca, Michael, Deepak Malhotra and Christopher Poliquin. 2020. “The impact of mass shootings on gun policy.” Journal of Public Economics 181:104083.
- Malhotra and Kuo (2008) Malhotra, Neil and Alexander G. Kuo. 2008. “Attributing Blame: The Public’s Response to Hurricane Katrina.” The Journal of Politics 70(1):120–135.
- Malhotra and Kuo (2009) Malhotra, Niel and Alexander G. Kuo. 2009. “Emotions as Moderators of Information Cue Use: Citizen Attitudes Toward Hurricane Katrina.” American Politics Research 37(2):301–326.
- Markarian (2024) Markarian, G Agustin. 2024. “Racially disparate policy responses to mass shootings.” Political Research Quarterly 77(1):297–315.
- McCombs and Shaw (1972) McCombs, Maxwell E. and Donald L. Shaw. 1972. “The Agenda-Setting Function of Mass Media.” Public Opinion Quarterly 36(2):176–187.
- Merry (2023) Merry, Melissa K. 2023. “The prospects for gun policy change following mass shootings.” Politics & Policy 51(3):426–436.
- Newman and Hartman (2019) Newman, Benjamin J. and Todd K. Hartman. 2019. “Mass Shootings and Public Support for Gun Control.” British Journal of Political Science 49(4):1527–1553.
- Peterson and Densley (2022) Peterson, Jillian and James Densley. 2022. The Violence Project: How to Stop a Mass Shooting Epidemic. Abrams Press.
- Phillips et al. (2024) Phillips, Connor Halloran, James M Snyder Jr, Andrew B Hall et al. 2024. “Who Runs for Congress? A Study of State Legislators and Congressional Polarization.” Quarterly Journal of Political Science 19(1):1–25.
- Poole and Rosenthal (1997) Poole, Keith T and Howard Rosenthal. 1997. Congress: A political-economic history of roll call voting. Oxford University Press, USA.
- Ramos and Sanz (2020) Ramos, Roberto and Carlos Sanz. 2020. “Backing the Incumbent in Difficult Times: The Electoral Impact of Wildfires.” Comparative Political Studies 53(3-4):469–499.
- Reny et al. (2023) Reny, Tyler T, Benjamin J Newman, John B Holbein and Hans J G Hassell. 2023. “Public mass shootings cause large surges in Americans’ engagement with gun policy.” PNAS Nexus 2(12):pgad407.
- Richards (2017) Richards, Robert. 2017. “The Role of Interest Groups and Group Interests on Gun Legislation in the U.S. House.” Social Science Quarterly 98:471–484.
- Rogers (2017) Rogers, Steven. 2017. “Electoral accountability for state legislative roll calls and ideological representation.” American Political Science Review 111(3):555–571.
- Rogowski and Tucker (2019) Rogowski, Jon C. and Patrick D. Tucker. 2019. “Critical Events and Attitude Change: Support for Gun Control After Mass Shootings.” Political Science Research and Methods 7(4):903–911.
- Schattschneider (1960) Schattschneider, E.E. 1960. The Semi-Sovereign People: A Realist’s View of Democracy in America. Holt, Rinehart & Winston.
- Sharkey and Shen (2021) Sharkey, Patrick and Yinzhi Shen. 2021. “The effect of mass shootings on daily emotions is limited by time, geographic proximity, and political affiliation.” Proceedings of the National Academy of Sciences 118(23):e2100846118.
- Shor and McCarty (2011) Shor, Boris and Nolan McCarty. 2011. “The ideological mapping of American legislatures.” American Political Science Review 105(3):530–551.
- Sides, Tausanovitch and Vavreck (2022) Sides, John, Chris Tausanovitch and Lynn Vavreck. 2022. The Bitter End: The 2020 Presidential Campaign and the Challenge to American Democracy. Princeton University Press.
- Spitzer (2023) Spitzer, Robert J. 2023. The Politics of Gun Control. 9th ed. Routledge.
- Stout (2018) Stout, Kevin R. 2018. “Weathering the Storm: Conditional Effects of Natural Disasters on Retrospective Voting in Gubernatorial Elections—A Replication and Extension.” Research & Politics 5(4):2053168018813766.
- Tomsich et al. (2023) Tomsich, Elizabeth A., Veronica A. Pear, Julia P. Schleimer and Garen J. Wintemute. 2023. “The origins of California’s gun violence restraining order law: a case study using Kingdon’s multiple streams framework.” BMC Public Health 23(1):1275.
- Walker, Collingwood and Bunyasi (2020) Walker, Hannah, Loren Collingwood and Tehama Lopez Bunyasi. 2020. “White response to black death: a racialized theory of white attitudes towards gun control.” Du Bois Review: Social Science Research on Race 17(1):165–188.
Supplemental Materials
Intended for online publication only.
.tocmtappendix \etocsettagdepthmtchapternone \etocsettagdepthmtappendixsubsection
S.1 Qualitative Interview Procedures
To inform our theoretical expectations, we conducted a series of qualitative interviews with California state legislators who represented districts affected by mass shootings that occurred within their district.202020As these interviews were conducted with public officials about their roles as public servants, our project is exempt from IRB regulations typically associated with human subject research. That said, we followed all relevant IRB guidelines to ensure the validity of our findings. Our sample of 5 interview participants worked out to be a roughly 21% response rate of all legislators who represented districts affected by mass shootings during our period of study.212121All other affected legislators were contacted, though 5 directly refused to participate. All others either did not respond directly (6 legislators), or stopped responding after we made initial contact (7 legislators). We were unable to make contact with an additional legislator who did not have any contact information publicly available. All interviews except for the one with Legislator E were conducted on Zoom, and the interview with Legislator E was conducted in their field office, in person, with their chief of staff also present.
The following questions were used to guide the interview:
-
•
How did you first become aware of the mass shooting, and what were your initial reactions upon learning about it?
-
–
Follow-ups:
-
*
Did you feel personally affected by the shooting considering your role as an elected representative for the community?
-
*
How did you engage with the affected community members, survivors, and families of victims in the aftermath of the mass shooting?
-
*
-
–
-
•
What were some of the primary concerns expressed by your community following the mass shooting, and how did community leaders address those concerns?
-
–
Follow-ups:
-
*
How did you collaborate with other legislators, government agencies, and community leaders in your response to the mass shooting?
-
*
Were there any specific challenges faced during this collaborative effort?
-
*
-
–
-
•
In what ways did the mass shooting in your district influence your legislative priorities and agenda moving forward?
-
–
Follow-ups:
-
*
Can you discuss any legislative measures or policies you proposed or supported in response to the mass shooting?
-
*
What was the rationale behind these proposals?
-
*
-
–
-
•
Were there any specific challenges or obstacles you encountered while attempting to implement legislative or policy changes in response to the mass shooting?
-
–
Follow-ups:
-
*
Did you face any obstacles or support from members of the opposing party?
-
*
Did you face any obstacles or support from interest groups?
-
*
-
–
-
•
Looking back, what do you feel were the most significant lessons learned from your experience responding to the mass shooting, both personally and legislatively?
-
–
Follow-up:
-
*
What advice might you offer to other legislators or leaders whose communities are affected by mass shootings in the future?
-
*
-
–
-
•
Is there anything else that you would like to share with us?
While all participants waived anonymity, we ultimately decided to keep all quotations anonymous due to the sensitive nature of the interviews. While all interviews were recorded and transcribed, we will not be publicly sharing the full transcripts of the interviews in order to protect the anonymity of the participants.
S.2 Locations and Details of Mass Shootings
In this paper, we consider the effect of mass shootings on legislative behavior in California from the 2011-2012 legislative session to the 2021-2022 session. To that end, we focus on shootings occurring between 2011 and 2022 in the state, though we also include the 2010 North Hollywood shooting that may have reasonably affected legislators serving in the 2011-2012 session. As these legislators would reasonably be considered treated in these early sessions, we cannot use them as control units in our later estimations. Table S.2.1 identifies the shootings that are included in our study — specifying the date, location, number of victims (not including the shooter), and the State Senate and Assembly districts in which the shooting occurred (accounting for redistricting following the 2010 Census).
| State | Date | City | # Killed | Upper | Lower | Post-Treat |
|---|---|---|---|---|---|---|
| CA | 10/12/2011 | Seal Beach | 8 | 35 | 67 | 2012 |
| CA | 4/2/2012 | Oakland | 7 | 9 | 16 | 2012 |
| CO | 7/20/2012 | Aurora | 12 | 29 | 29 | 2013 |
| CA | 6/7/2013 | Santa Monica | 5 | 26 | 50 | 2013 |
| FL | 7/26/2013 | Hialeah | 6 | 36 | 103 | 2014 |
| CA | 2/20/2014 | Alturas | 4 | 1 | 1 | 2014 |
| CA | 5/23/2014 | Isla Vista | 6 | 19 | 35 | 2014 |
| TX | 11/14/2015 | Tennessee Colony | 6 | 3 | 8 | 2016 |
| CA | 12/2/2015 | San Bernardino | 14 | 23 | 63 | 2016 |
| FL | 6/12/2016 | Orlando | 49 | 9 | 47 | 2016 |
| TX | 7/7/2016 | Dallas | 5 | 23 | 108 | 2017 |
| FL | 1/6/2017 | Fort Lauderdale | 5 | 34 | 100 | 2017 |
| FL | 6/5/2017 | Orlando | 5 | 13 | 47 | 2017 |
| TX | 11/5/2017 | Sutherland Springs | 25 | 21 | 44 | 2018 |
| CA | 11/14/2017 | Rancho Tehama | 5 | 4 | 3 | 2018 |
| FL | 2/14/2018 | Parkland | 17 | 29 | 81 | 2018 |
| TX | 5/18/2018 | Santa Fe | 10 | 11 | 24 | 2018 |
| CA | 9/12/2018 | Bakersfield | 5 | 14 | 32 | 2019 |
| CA | 11/7/2018 | Thousand Oaks | 12 | 27 | 44 | 2019 |
| FL | 1/23/2019 | Sebring | 5 | 26 | 66 | 2019 |
| TX | 8/3/2019 | El Paso | 23 | 29 | 76 | 2020 |
| TX | 8/31/2019 | Midland-Odessa | 7 | 31 | 82 | 2020 |
| MO | 3/15/2020 | Springfield | 4 | 30 | 135 | 2020 |
| GA | 3/16/2021 | Atlanta | 8 | 36 | 40 | 2021 |
| CO | 3/22/2021 | Boulder | 10 | 18 | 13 | 2021 |
| CA | 3/31/2021 | Orange | 4 | 37 | 68 | 2021 |
| CA | 5/26/2021 | San Jose | 9 | 15 | 27 | 2021 |
| CO | 12/27/2021 | Denver | 5 | 32 | 2 | 2022 |
-
•
Note: Data on shooting location and number of victims (not including the shooter) comes from the Violence Project. Upper refers to the upper chamber district in which the shooting occurred and Lower refers to the respective lower chamber district. Both of these districts are identified through mapping the latitude/longitude location of a shooting to the appropriate state legislative district shapefiles from the United States Census Bureau. These locations are cross-referenced with records from the Gun Violence Archive, when available. The 2010 North Hollywood, CA shooting is effectively dropped from our analyses – as we do not have pre-shooting observations, we cannot consider the effects of the shooting on the voting behavior of affected legislators, so the legislators representing this district that appear in our data from 2011-2022 are considered as previously treated, and removed from subsequent models. Post-Treat reports the year that is considered as in our formal models, and is assigned as the year of the shooting date if the date of the shooting occurs within the first six months of the year, or the subsequent year following the year of the shooting date if the shooting occurs within the last six months of the year. For shootings occurring before the redistricting done following the 2010 Census, we report the district that was affected under the earlier maps, and cross-reference district boundaries after the Census to ensure that legislators who were redistricted to represent a new area are still considered treated if they previously represented an affected district. District shapefiles from this earlier period are sourced primarily from the Redistricting Data Hub.
Table S.2.1 highlights an important feature of the data worth considering: these mass shootings, like many others across the United States, are concentrated in urban areas with higher rates of population density \citeAppviolence_project, kwon_mass_shootings_2019. Of the California shootings studied in this paper, only two (the 2017 Rancho Tehama and 2018 Bakersfield shootings) occurred outside of the San Francisco Bay Area or Greater Los Angeles metropolitan areas. However, even as the California shootings studied in this paper tend to affect the Bay Area or Los Angeles more frequently, no individual district or legislator is repeatedly treated by having a mass shooting occur within their district on multiple occasions. Furthermore, of the California legislators representing these districts at the time of the shooting, 13 were Democrats and 11 were Republicans, offering us comparable numbers of treated legislators from either party.
S.3 Validating the GLC Legislative Scoring Regime
As the GLC claims on their website, “Giffords is an organization dedicated to saving lives from gun violence.” In other official communications, the GLC states that it “is fighting to end the gun lobby’s stranglehold on our political system,” which may reasonably lead one to believe that the GLC scoring system could suffer from pro-gun control bias in their scoring of state firearm-related legislation. To validate their scoring regime, we hired a team of research assistants (RAs) to hand-code a sample of the bills also coded by the GLC to assess the degree to which the GLC data may have been biased due to the original coder’s association with a gun control advocacy organization. We provided the RAs with instruction on the types of firearms policy that exist within the United States and instructed them to code bills on a -1 to +1 scale, with -1 being considered a “permissive” bill that makes it easier for individuals to access/purchase/own/possess firearms, 0 being a neutral policy, and +1 being a “restrictive” policy that makes it harder for someone to access/purchase/own/possess firearms.
After coding samples of bills from all states and from California in particular, we found that our RAs had an average of a 73.5% match with the GLC coding scheme, and 80% consistency with each other. After digging into this further, we determined that the majority of mismatches between the RAs and the GLC were from the RAs considering many of the procedural budgetary bills as neutral, and the GLC coding some bills our RAs coded as neutral as “strengthen” or “weaken” based on very specific clauses or items in the bills that our RAs had not considered to be as relevant to the overall bill. Overall, we are confident that our RAs’ coding is consistent with the GLC coding scheme, and given the small number of uncoded bills in California (25), we used the bill ranking provided by the GLC when available, and filled in all missing bill rankings with assessments from our RAs (and confirmed by the authors). We are therefore left with 366 bills that were voted on between 2011 and 2022 in the California Legislature.
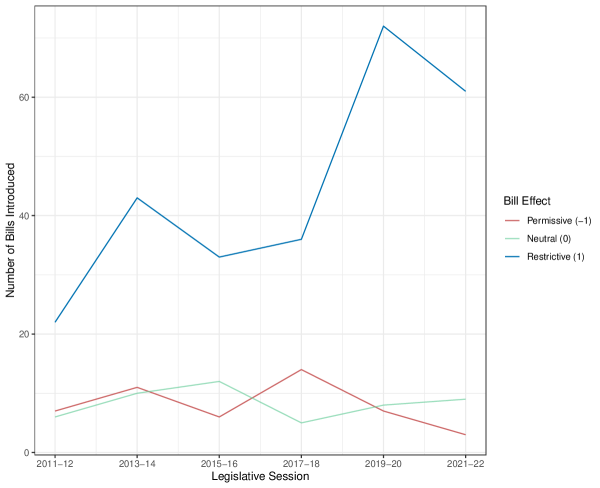
Note: Counts of bills by original GLC coding, with missing observations corrected according to RA scoring.
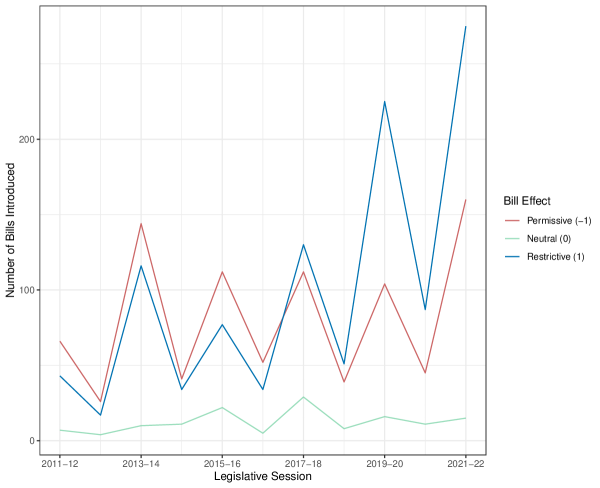
Note: Counts of bills by original GLC coding, with missing observations corrected according to RA scoring.
S.4 Measuring Firearm-Related Policy Preference
Leading scholars in political methodology have developed various methods to estimate legislators’ ideal points using data from roll-call votes, survey responses, campaign contributions, political speeches, and social media. But how do these ideological measures translate to a context in which we wish to specifically capture a legislator’s positionality on a policy domain as particular as gun control? Considering that other scholars argue that gun control preferences are not effectively computed through ideology estimates derived from a legislator’s overall roll call voting behavior \citeAppansolabehere_roll_call_2001, we are constrained in our ability to rely on such canonical measures.
We choose to employ the Bradley–Terry model to pairwise compare the legislators in terms of supporting restrictive gun policies \citeAppbradley1952rank. Similar to the DW-NOMINATE scores, our scores reveal the relative positions of legislators on gun control in each legislative session. In terms of measuring state legislators’ stances on specific issue areas, two other common practices are to 1) use survey responses from the individual legislators, and 2) use the spatial choice model or Bayesian Item Response Theory (IRT) model on a subset of roll-call voting records \citeAppjeong2018measuring. We discuss these alternative measures of gun-policy-specific ideal points in Sections S.4.1 and S.5.5.
S.4.1 NRA Ratings
As for survey responses from state legislators on firearms policy, the most commonly used source is the National Rifle Association (NRA) scorecards, which rate state legislators’ favorability towards firearms policies from self-reported surveys.222222The NRA sent surveys to candidates to assess their alignment with NRA core values, and grade them from a F to A+ letter grade scale. Upon close examination of the NRA scores, they suffer from severe missingness and inconsistencies in measurement that pose issues that ultimately prevent us from analyzing them.232323See, for example, https://www.thetrace.org/2016/11/nra-gun-record-rating-system-straight-a-students. However, as Figure S.4.1 shows, the Gun Control Score tracks more variation in legislators’ scoring, as most legislators’ NRA ratings stayed unchanged from past elections. At the same time, when a legislator’s NRA score changes, we find that the Gun Control Score also moves in the same direction.
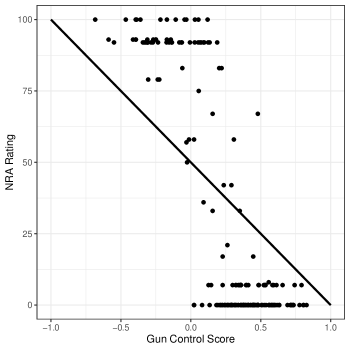
Note: This figure plots the correlation between the NRA scoring for legislators in California (where available) and the Gun Control Score. We convert an A+ rating to a score of 100, an F rating to 0, and scale the intermediate scores proportionally.
S.5 Estimation Strategy for California Legislators
Legislative sessions in California start on the first Monday in December following an election to convene for an organizational meeting, though the chambers thereafter recess until the first Monday in January, whereupon the legislature is in session year-round until November 30th of the following even-numbered year. Considering each legislative session therefore spans two calendar years, we calculated annual Gun Control Scores for each legislator in our study, so that we could estimate the more immediate effects of mass shootings on voting behavior by considering a legislator’s behavior over the course of one year rather than two.242424In analyses where we expand the number of states included in our estimations, we adopt a similar strategy of splitting sessions by years for Colorado, Florida, and Missouri. Texas and Georgia, on the other hand, meet once every two years, so we only have Gun Control Scores for odd-numbered calendar years. Having more votes within a year (and more votes spread throughout the year) would allow for a more precise identification strategy for treatment timing (i.e., monthly effects rather than annual), but this also serves to generally account for the relatively slow pace at which legislation is introduced and deliberated. However, one issue we cannot account for is the concern that votes in the first year of a session may be more procedural than votes in the later year.
S.5.1 Parallel Trends Assumption Holds Overall
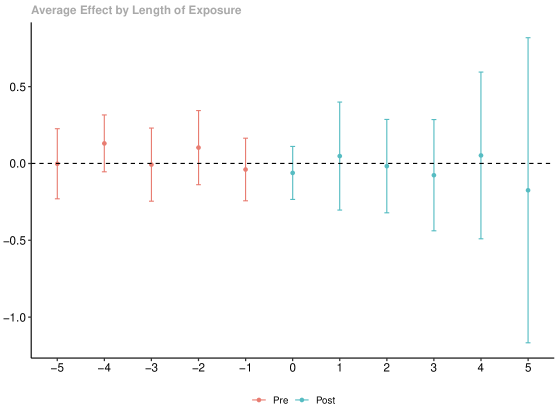
Note: This figure plots the aggregated ATT at given time periods using the “dynamic” specification of the did package for a model fit to all legislators in California \citeAppcallaway_did_multiple_t_2021.
We also combine the staggered DiD and the sensitivity analysis for potential violations of the parallel trends assumption \citeAppcallaway_did_multiple_t_2021, rambachan2023more in Figure S.5.2 and Figure S.5.3.
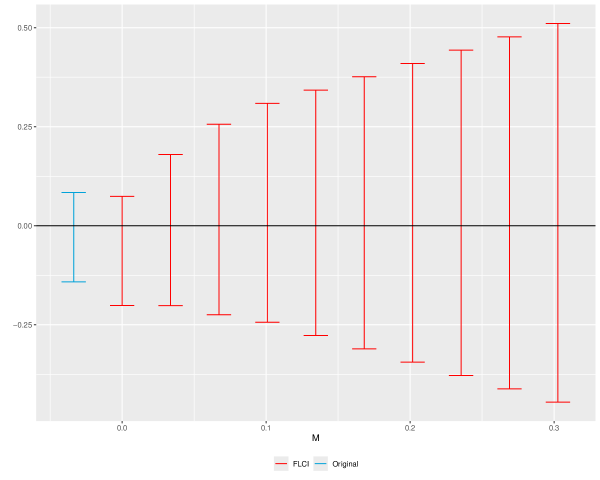
Note: We implemented the sensitivity analysis using the HonestDiD package under smoothness restrictions \citeApprambachan2023more.
Figure S.5.2 plots the original staggered DiD estimate for the effect of a mass shooting on the Gun Control Score of a California lawmaker in blue. The red fixed length confidence intervals (FLCIs) report different effect estimates along values of M, where allows only for linear violations of the parallel trends and larger deviations from linearity are allowed under larger values of M \citeApprambachan2023more. The breakdown value is 0: we cannot rule out null effects for the effect of a mass shooting on the Gun Control Score of California legislators.
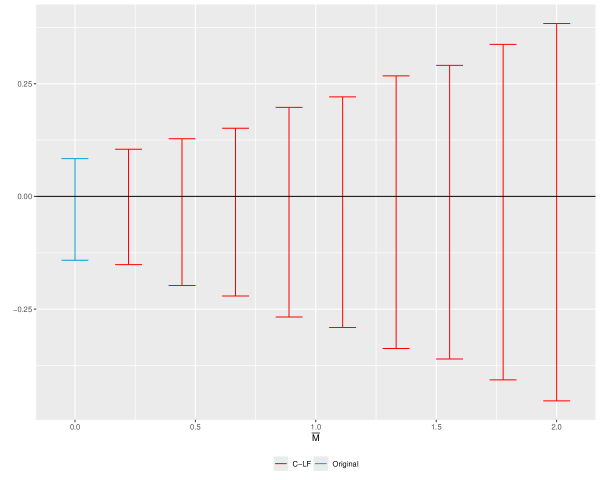
Note: We implemented the sensitivity analysis using the HonestDiD package under relative magnitudes restrictions \citeApprambachan2023more.
In Figure S.5.3, we see that there is no “breakdown value” \citeApprambachan2023more for a significant effect. Were we to see a significant effect at, say, , this would suggest that a significant result is robust to allowing for violations of parallel trends no larger than the maximum pre-treatment violation. Given the null finding across all values, this suggests that we cannot rule out null results even when allowing for large or small violations of parallel trends.
S.5.2 Alternative Estimation Strategy
For our stacked DiD estimation strategy, we create shooting-specific 2 2 datasets with clean controls for our California Analysis — in other words, datasets (g) including the outcome variable and controls for the treated group and all other observations that are never treated within the observation window \citeAppcengiz_stacked_2019. These datasets are then stacked together and, with a shooting-specific identifying variable, a two-way fixed effects (TWFE) DiD regression is estimated on the stacked data, via the following regression
| (4) |
where denotes the Gun Control Score for legislator in year — the average treatment effect on the treated units (ATT). Under this specification, we utilize relative-time indicators (i.e., “Years Since Shooting”) for treatment () instead of a binary treatment indicator (i.e., ) from a canonical TWFE DiD regression. Here, is an indicator for legislator i in group being k periods from the start of treatment (i.e., ), such that the first summation captures time periods leading to treatment, and the second summation captures those following treatment.
We include interacted legislator- and chamber-fixed effects, as well as year-fixed effects, to account for individual- and time-specific heterogeneity and control for any unobserved factors that are constant within individuals in a chamber over time, or constant across all individuals within a time period. Heteroskedasticity-robust standard errors are clustered at the legislator and year levels. Further, to avoid issues with multicollinearity, we exclude the relative-time indicator for the period immediately prior to treatment. Hence, the ’s are our main parameters of interest and can be interpreted as the difference in the differences in Gun Control Scores across the treated and untreated legislators l years from a shooting, relative to the differences in Gun Control Scores between treated and untreated legislators in the excluded period (). One issue with the approach following Cengiz et al. (2019) is that the stacked regression estimator offers less flexibility for aggregation, and may introduce bias into the ATT \citeAppbaker_trust_staggered_did_2022.
S.5.3 Shootings Occurring Within a Legislator’s District Do Not Affect Their Voting Behavior
Figure S.5.4 presents the results of our stacked DiD estimation following Cengiz et al. (2019), for California legislators. We report the results of three models following the specification outlined in Equation 3: one comparing all treated legislators to all others regardless of party, and two that compare treated and untreated legislators within party. Across the specifications for all legislators, Democrats, and Republicans, we find null results — this suggests that the occurrence of a mass shooting within a legislator’s district does not cause a legislator to change their voting behavior on firearm-related policies. Relative to all other legislators, as well as legislators within one’s party, legislators who experience a shooting in their district do not change their voting behavior.
We limit the time periods relative to treatment that we report to those that contain at least one treated legislator in each model specification, and report the formal estimates in Table S.5.1. Due to California’s relatively strict term limit law (12 years in any legislative chamber), we are ultimately limited in assessing the long-running effects of a shooting as legislators tend to be term-limited from holding office before reaching, say, and having pre-treatment observations necessary for our analysis.
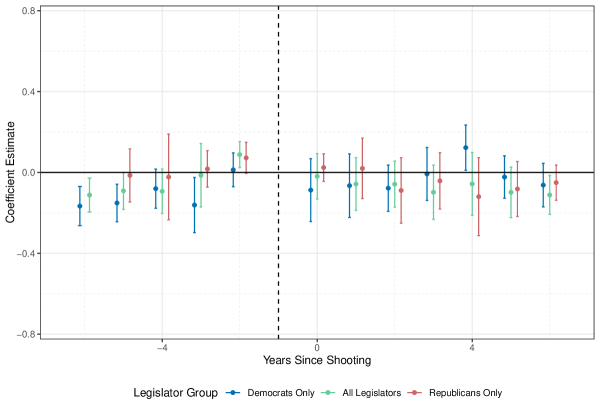
Note: We report the null effects of a mass shooting on the voting behavior of CA state legislators on firearm-related policy, with models fit on all legislators, only Democratic legislators, and only Republican legislators. 95% confidence intervals are based on heteroskedasticity-robust standard errors clustered at the legislator and year level. The period immediately prior to treatment, , is excluded to account for multicollinearity.
As discussed in the main text, the stacked DiD approach suffers from some issues that the staggered design resolves. One such benefit with the staggered design is that our uncertainty estimates are more realistic in the years far from treatment, in comparison to the stacked DiD results. Instead of a lack of observations leading to narrower confidence intervals due to less variability in our observations (as we observe in Figure S.5.4), we find that the confidence intervals in the periods far removed from treatment are generally larger under the design from \citeAppcallaway_did_multiple_t_2021. Instances of particularly narrow confidence intervals in periods far from treatment appear to instead be driven by attrition among our treated units. This trade-off can be seen in the calculation of the 95% confidence intervals in the latter time periods in Fig. S.5.4, as our data are essentially affected by attrition or survivorship bias.
In sum, this finding can be interpreted as evidence that (1) mass shootings do not affect the Gun Control Scores of legislators who represent districts in which shootings occur compared to all other legislators; (2) mass shootings do not affect the Gun Control Scores of Democrats representing affected districts relative to other Democrats; and (3) mass shootings do not affect the Gun Control Scores of Republicans representing affected districts relative to other Republicans. However, due to some of the estimation limitations and issues with bias in the ATT that the Callaway and Sant’Anna (2021) estimator resolves, we turn to this alternative estimation strategy to validate the robustness of our finding before making a final conclusion about the effects of a mass shooting on a legislator’s Gun Control Score for those representing the affected districts.
| Overall | Democrats | Republicans | ||||
| Time | (1) | (2) | (3) | (4) | (5) | (6) |
| -4 | -0.093 | 0.045 | -0.080 | 0.167 | -0.022 | -0.077 |
| (0.056) | (0.067) | (0.049) | (0.049) | (0.108) | (0.017) | |
| -3 | -0.014 | 0.017 | -0.161 | -0.131 | 0.018 | 0.018 |
| (0.080) | (0.058) | (0.070) | (0.069) | (0.046) | (0.084) | |
| -2 | 0.088 | 0.093 | 0.013 | 0.127 | 0.072 | 0.047 |
| (0.033) | (0.068) | (0.043) | (0.102) | (0.039) | (0.035) | |
| -1 | -0.062 | 0.009 | -0.030 | |||
| (0.082) | (0.033) | (0.039) | ||||
| 0 | -0.019 | -0.029 | -0.087 | -0.096 | 0.024 | 0.018 |
| (0.057) | (0.062) | (0.079) | (0.079) | (0.035) | (0.032) | |
| 1 | -0.057 | 0.055 | -0.065 | -0.057 | 0.020 | -0.002 |
| (0.066) | (0.106) | (0.080) | (0.088) | (0.076) | (0.080) | |
| 2 | -0.058 | 0.025 | -0.078 | -0.075 | -0.089 | -0.127 |
| (0.058) | (0.084) | (0.058) | (0.054) | (0.082) | (0.091) | |
| 3 | -0.098 | -0.022 | -0.007 | 0.019 | -0.041 | -0.120 |
| (0.068) | (0.109) | (0.067) | (0.053) | (0.071) | (0.067) | |
| 4 | -0.057 | 0.071 | 0.123 | 0.141 | -0.120 | -0.204 |
| (0.079) | (0.140) | (0.057) | (0.079) | (0.098) | (0.091) | |
| Agg. ATT | -0.122 | 0.020 | -0.145 | |||
| (0.072) | (0.037) | (0.068) | ||||
| N | 8,590 | 255 | 6,174 | 172 | 2,416 | 83 |
| Leg. x Chamber FE | ||||||
| Year FE | ||||||
| Est. Strategy | CDLZ | CS | CDLZ | CS | CDLZ | CS |
-
•
Note: Table records the estimated effects of mass shootings occurring within a legislator’s district on a legislator’s Gun Control Score for varying time units (with standard errors reported in parentheses). Estimation strategy refers to the difference-in-differences design utilized in each estimation, with CDLZ referring to the stacked DiD following Cengiz et al. (2019), and CS referring to the staggered DiD following Callaway and Sant’Anna (2021). For the estimations using the CDLZ design, the number of observations counts all repeated control units, which inflates the number of observations through the stacking of datasets due to repeated inclusion. CDLZ leaves out time period -1 to account for multicollinearity. For CS, we use group/cohort aggregation to determine the aggregated ATT and report these estimates. Due to the aggregation by group and time of treatment in CS, year-fixed effects are superfluous, though we include these fixed effects in the CDLZ models.
S.5.4 How Stable is the Gun Control Score for Treated Legislators?
Figure S.5.5 plots the annual Gun Control Score for only the legislators who had a shooting occur within their district, subset by party. The large dots represent averages of the Gun Control Score binned by year and party, with the underlying individual scores being denoted by the x points.
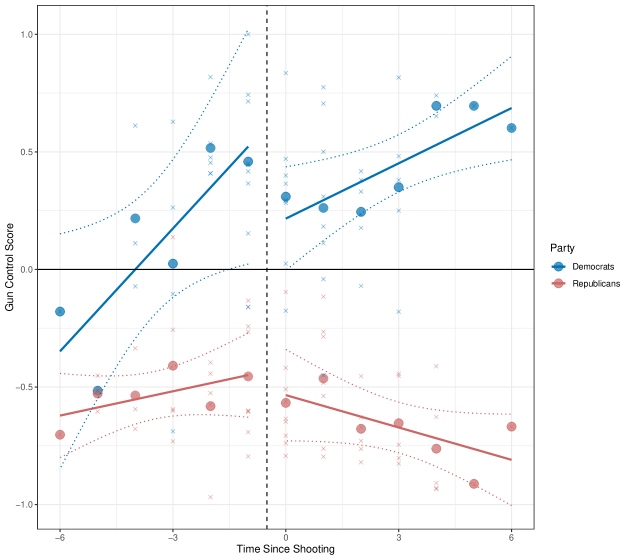
Note: Large points are the average scores for legislators of a given party at time t, with smaller x points representing individual treated legislators. Linear regressions have been fit to the averages, not the underlying points, and are subset by pre- and post-treatment.
S.5.5 Results Using IRT Estimates
As a robustness check, we estimate the latent positions of California legislators on firearm-related issues using the Bayesian IRT model (implemented through the brms package in R) and the same subset of roll-call votes as described in Section 3.2.2 \citeAppclinton2004statistical, bafumi2005practical. Figure S.5.6 compares the Gun Control Score and the estimated gun-related ideal points (rescaled from -1 to 1). The correlation coefficient between the pairwise comparison estimates and the IRT estimates is 0.89.
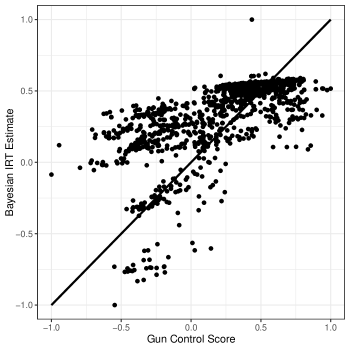
Note: This figure plots the correlation between the Bayesian IRT estimates for legislators in California and the Gun Control Score.
Following the same staggered DiD design, we report the ATT estimates using the IRT estimates instead in Figure S.5.7. Similarly, the null effect after a shooting ( and beyond) holds for all sets of comparisons.
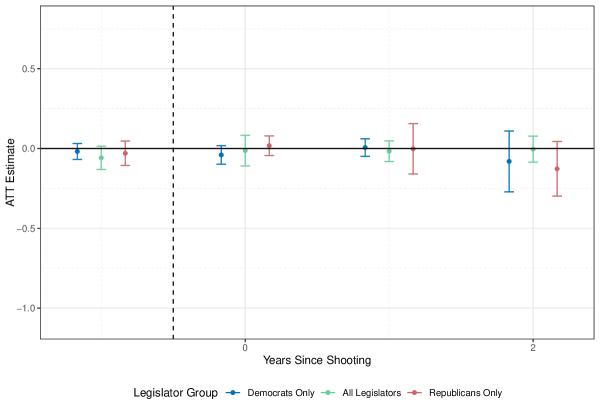
Note: We report the null effects of a mass shooting on the voting behavior of CA state legislators on firearm-related policy, with models fit on all legislators, only Democratic legislators, and only Republican legislators.
S.6 Treatment Timing in California
In California, Legislators Bloom, Cortese, Feuer, Hurtado, Liu, and Min (the semi-transparent green observations) are dropped due to the fact that we do not have at least one pre-treatment and one post-treatment observation. Two other treated legislators, Assemblyman Mike Feuer and State Senator Carol Liu, are dropped because they were previously treated by the North Hollywood shooting (so we do not have a pre-treatment observation for them, only post-treatment). This can be seen in Figure S.6.1.
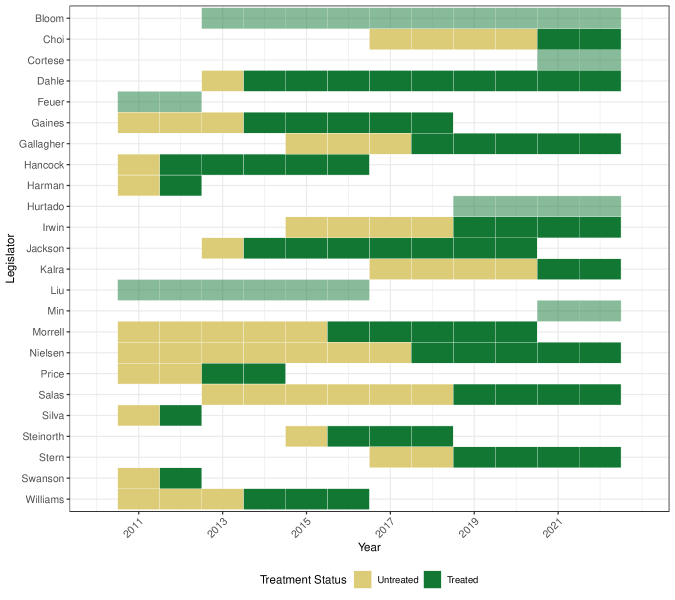
Note: Dropped observations appear semi-transparent in the figure. Under our identification strategy, any legislators missing at least one untreated and one treated observation must be dropped, leaving us with 18 treated legislators. A shooting in months 1-6 of a year leads to that year being considered post-treatment, while a shooting occurring in months 7-12 of a given year leads to that year being considered pre-treatment.
S.7 Treatment at Varying Distances
We rely on state legislative district shapefiles from the United States Census Bureau252525https://www.census.gov/geographies/mapping-files.html. to identify district boundaries following the 2012 redistricting cycle. These boundaries are used for shootings occurring after the adoption of the new district boundaries, which varies across states in our study. For shootings occurring before the redistricting done following the 2010 Census, we report the district that was affected under the earlier maps, and cross-reference district boundaries after the Census to ensure that legislators who were redistricted to represent a new area are still considered treated if they previously represented an affected district. District shapefiles from this earlier period are sourced primarily from the Redistricting Data Hub.262626https://redistrictingdatahub.org. Shooting locations are from the Violence Project,272727https://www.theviolenceproject.org. and are cross-referenced with records from the Gun Violence Archive,282828https://www.gunviolencearchive.org. when available.
To determine shootings that are affected under the varying distance, we calculate a 5 and 25 mile radii, in euclidean distance, around each shooting’s location. We use the North American Datum of 1983 (NAD83) geodetic datum as our Coordinate Reference System (CRS). Figure S.7.1 shows these buffers, in blue and green, respectively. Figure S.7.1 zooms in on Southern California and shows shootings occurring between 2012 and 2022 only.
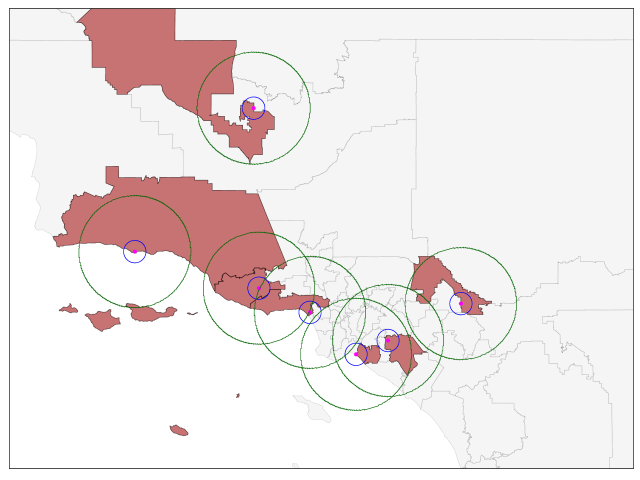
Note: Legislative district shapefiles used to determine shooting location and affected districts vary across states and redistricting cycles. In this figure, we use boundaries defined after the 2012 redistricting in California, and zoom in on shootings occurring in Southern California between 2012 and 2022. We only map lower chamber districts in this figure as an example. Districts shaded red as those in which the shooting (red points) occurred. The blue buffer represents a 5 mile radius (euclidean distance) from the shooting’s location, while green buffers are 25 mile radii.
S.8 Assigning Treatment to a District
To estimate the effects of a mass shooting on the Gun Control Score of a district, we first confine our period of study to 2012-2022 to remove any concerns that we are not appropriately accounting for redistricting. Our estimation strategy is similar to those underlying our analyses of individual legislators, though we include an interacted district- and chamber-fixed effect and cluster standard errors by district and chamber. The full results can be seen in Table S.8.1.
| Gun Control Score | |||
| (1) | (2) | (3) | |
| -4 | 0.076 | 0.104 | -0.012 |
| (0.043) | (0.044) | (0.068) | |
| -3 | 0.045 | -0.034 | 0.019 |
| (0.063) | (0.08) | (0.067) | |
| -2 | 0.003 | 0.021 | 0.017 |
| (0.071) | (0.124) | (0.036) | |
| -1 | -0.061 | -0.014 | -0.056 |
| (0.042) | (0.039) | (0.032) | |
| 0 | 0.066 | 0.077 | -0.019 |
| (0.084) | (0.062) | (0.043) | |
| 1 | 0.008 | 0.022 | -0.008 |
| (0.067) | (0.066) | (0.072) | |
| 2 | 0.016 | -0.017 | -0.13 |
| (0.067) | (0.054) | (0.096) | |
| 3 | 0.034 | 0.048 | -0.118 |
| (0.078) | (0.047) | (0.069) | |
| 4 | -0.001 | 0.113 | -0.204 |
| (0.103) | (0.112) | (0.088) | |
| Legislator Group | All | Democrats | Republicans |
| # of District-Chambers | 117 | 89 | 44 |
| # of Mass Shootings | 11 | 11 | 10 |
| District x Chamber FE | |||
| Pre-Treatment Mean | 0.056 | 0.343 | -0.176 |
-
•
Note: Robust standard errors are clustered at the district and chamber level. Gun Control Score is measured from -1 to 1, from least to most supportive of restrictive firearms legislation. Table reports the estimated effects of mass shootings occurring within a district on the Gun Control Score of the district. Individual legislators who switch parties throughout the duration of study are removed.
S.9 Additional States
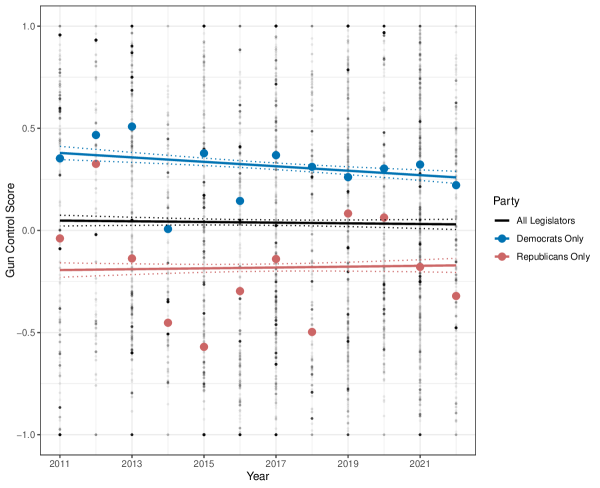
Note: Each black point is an individual legislator’s score for the corresponding year of the legislative session. Large colored points are binned averages of each party’s score, across states, in a given year. Linear regression smoothers (with dotted CIs) are fit to legislators in either party (and across parties, in black) to show general trends in partisan voting behaviors across session-years. The figure includes legislators in the upper and lower chambers of California (2011-2022), Colorado (2012-2022), Florida (2011-2021), Texas (biennial, 2013-2021), Missouri (2019-2022), and Georgia (biennial, 2011-2021). The “bridge” agents in these states are: Donald Coram (CO); David Ralston (GA); Debbie Mayfield (FL); Mike Bernskoetter (MO); Dan Huberty (TX).
S.10 Differential Effects of Shootings
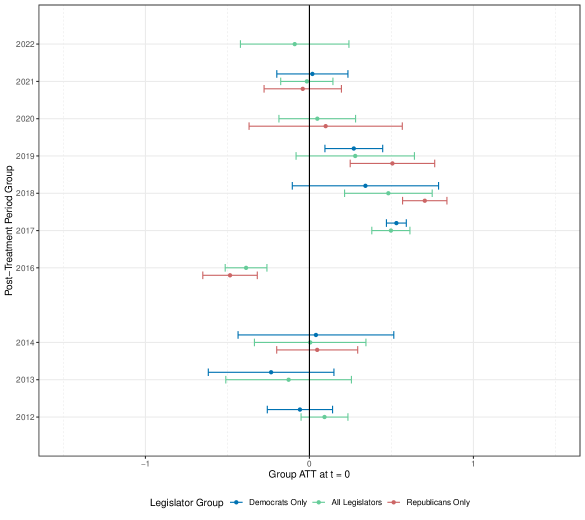
Note: Figure plots the ATT and 95% Confidence Intervals for each treatment cohort in the first post-treatment period, . Treatment cohorts are defined by the first year in which observations are considered post-treatment, and the y-axis reports the group while the x-axis plots the ATT.
As Figure S.10.1 shows, we find statistically significant positive effects for mass shootings on the Gun Control Scores of treated Republicans, relative to other Republicans, in groups 2019 and 2018, and a negative effect in 2016. We find statistically significant positive effects on treated Democrats in groups 2019 and 2017. We also find statistically significant positive effects on all legislators in 2018 and 2017, and a negative effect in 2016. Across all other groups, the estimates are not statistically significant, and many are quite noisy, further suggesting that there is variation in the effects of particular shootings within post-treatment period groups.
Our most precise estimate in Figure S.10.1 is for Democrats in group 2017 (ATT = 0.530, SE = 0.031, which suggests an 26.5% increase in votes for restrictive policies among treated Democrats), though this estimate does not represent the ATT of a particular shooting. Instead, it is the aggregated ATT for three distinct shootings: (1) a July 2016 shooting in Dallas, TX with 5 victims killed, (2) a January 2017 shooting in Fort Lauderdale, FL with 5 victims killed, and (3) a June 2017 shooting in Orlando, FL with 5 victims killed.
The largest estimate is for Republicans in group 2018 (ATT = 0.703, SE = 0.069, representing a 35.15% increase in votes for restrictive policies among treated Republicans), and this estimate is the aggregated effect of four shootings: two school shootings (Parkland, FL and Santa Fe, TX), including one that set off a wave of nationwide protests for restrictive firearms policy \citeApphassell_mobilize_2020; the Sutherland Springs, TX church shooting; and a shooting in Rancho Tehama, CA that has been dubbed “California’s forgotten mass shooting”.292929https://www.latimes.com/california/story/2022-07-09/rancho-tehama-california-mass-shooting-victims-suffer. Thus, it is not clear from either estimate that the media coverage or public salience of a shooting plays a role in shaping the behavior of lawmakers — though, the Rancho Tehama shooting aside, the 2018 estimate for Republicans does correspond with a group that contains shootings that certainly received a great deal of public attention.
S.11 Cosponsorship Network Analysis and Gun Policy Activity
S.11.1 Cosponsorship Network

| Session | Most Bills | Highest Betweenness | Highest Eigenvector |
|---|---|---|---|
| Cosponsored | Centrality | Centrality | |
| State Assembly | |||
| 2011 | Huffman | Ammiano | Huffman |
| 2013 | Ting | Achadjian | Ting |
| 2015 | Gipson | Chiu | Gipson |
| 2017 | Chiu | Gloria | Chiu |
| 2019 | Chiu | McCarty | Chiu |
| 2021 | Cristina Garcia | Ting | Cristina Garcia |
| Senate | |||
| 2011 | Hancock | De Leon | Hancock |
| 2013 | Steinberg | Steinberg | Steinberg |
| 2015 | Leno | Hall | Leno |
| 2017 | Portantino | Wiener | Wiener |
| 2019 | Wiener | Wiener | Wiener |
| 2021 | Wiener | Portantino | Wiener |
S.11.2 Alternative Behavior
| Activity | Outdegree | |||||
| (1) | (2) | (3) | (4) | (5) | (6) | |
| -1 | 0.014 | 0.026 | 0.003 | 0.709 | 1.298 | -0.062 |
| (0.007) | (0.007) | (0.007) | (0.433) | (0.369) | (0.332) | |
| 0 | -0.010 | -0.026 | 0.001 | -0.743 | -1.929 | 0.147 |
| (0.009) | (0.013) | (0.007) | (0.426) | (0.702) | (0.279) | |
| 1 | 0.003 | -0.000 | -0.011 | -0.167 | -0.362 | -0.414 |
| (0.011) | (0.009) | (0.007) | (0.559) | (0.598) | (0.383) | |
| 2 | -0.011 | -0.034 | -0.002 | -0.528 | -1.705 | 0.184 |
| (0.010) | (0.012) | (0.008) | (0.454) | (0.688) | (0.494) | |
| Agg. ATT | -0.020 | -0.033 | -0.003 | -1.156 | -1.790 | 0.059 |
| (0.008) | (0.008) | (0.008) | (0.450) | (0.239) | (0.244) | |
| Legislator Group | All | Democrats | Republicans | All | Democrats | Republicans |
| # of Legislators | 258 | 175 | 86 | 258 | 175 | 86 |
| # of Shootings | 11 | 6 | 5 | 11 | 6 | 5 |
| Leg. x Chamber FE | ||||||
| Pre-Treatment Mean | 0.014 | 0.017 | 0.0.12 | 0.600 | 0.792 | 0.423 |
-
•
Note: Standard errors are clustered at the legislator level in parentheses. Table reports the estimated effects of mass shootings occurring within a legislator’s district on a legislator’s activity in the gun policy domain for periods to 2. Activity is a measure of the number of bills sponsored or cosponsored by a legislator related to gun policy out of all bills related to gun policy in a given year. Outdegree is a measure of legislator’s level of activity in cosponsoring firearms-related legislation. Individual legislators who switch parties throughout the duration of study are also removed.
apsr \bibliographyAppbib.bib