Adrenaline: Adaptive Rendering Optimization System for Scalable Cloud Gaming
Abstract
Cloud gaming requires a low-latency network connection, making it a prime candidate for being hosted at the network edge. However, an edge server is provisioned with a fixed compute capacity, causing an issue for multi-user service and resulting in users having to wait before they can play when the server is occupied. In this work, we present a new insight that when a user’s network condition results in use of lossy compression, the end-to-end visual quality more degrades for frames of high rendering quality, wasting the server’s computing resources. We leverage this observation to build Adrenaline, a new system which adaptively optimizes the game rendering qualities by considering the user-side visual quality and server-side rendering cost. The rendering quality optimization of Adrenaline is done via a scoring mechanism quantifying the effectiveness of server resource usage on the user-side gaming quality. Our open-sourced implementation of Adrenaline demonstrates easy integration with modern game engines. In our evaluations, Adrenaline achieves up to 24% higher service quality and 2 more users served with the same resource footprint compared to other baselines.
1 Introduction
Cloud gaming services enable users to play video games on commodity devices by offloading games to remote servers and streaming the rendered frames. Unlike video streaming services delivering pre-generated content, game frames are rendered based on a game state and streamed on the fly, and the state changes in real time through user interactions. This requires the server to have enough computing power with graphics processing units (GPU) and a low-latency network connection for responsive and smooth gameplay experiences with high frames per second (FPS) and visual quality.
While cloud gaming offers the benefit of playing video games without powerful user devices, its network and computation requirements present challenges in providing satisfactory gaming experiences with an increasing number of users [29, 35, 2]. The servers with GPU should be close to the users, at edge sites in the access tier of the network, in order to have a low-latency connection [37, 5, 27]. However, placing game servers close to users poses a scalability challenge as the edge server has limited computing resources. Cloud gaming service providers can rely on datacenter clouds for scalability, but this compromises service accessibility, as only users near the datacenters can have a low-latency connection to the game servers [3, 26, 11].
The existing cloud gaming services [21, 20] deal with the scalability issue by limiting the user playtime and queuing users when the nearby game servers are fully occupied. This approach can guarantee the service quality for the served users, but it decreases the service availability with long wait times during high-demand periods. Although there are previous research efforts for cloud gaming to serve multiple users [2, 33, 28, 16, 35], their focus is mainly on the network resources for effective bandwidth usage across users via network resource allocation and adaptive compression quality control (more details in §7).
We identify an opportunity to increase the number of users that can served by each GPU on a server via utilizing the characteristics of cloud gaming, which has not been leveraged by existing cloud gaming services and previous works. In cloud gaming, a game runs on the server, and the rendered game frames are encoded and streamed with lossy compression. When a user’s network condition is poor, game frames are more compressed and transmitted with lower visual quality. Even with the highest rendering quality (RQ) setting on the server, the user-side visual quality can hugely degrade, wasting the server’s computing resources for high RQ.
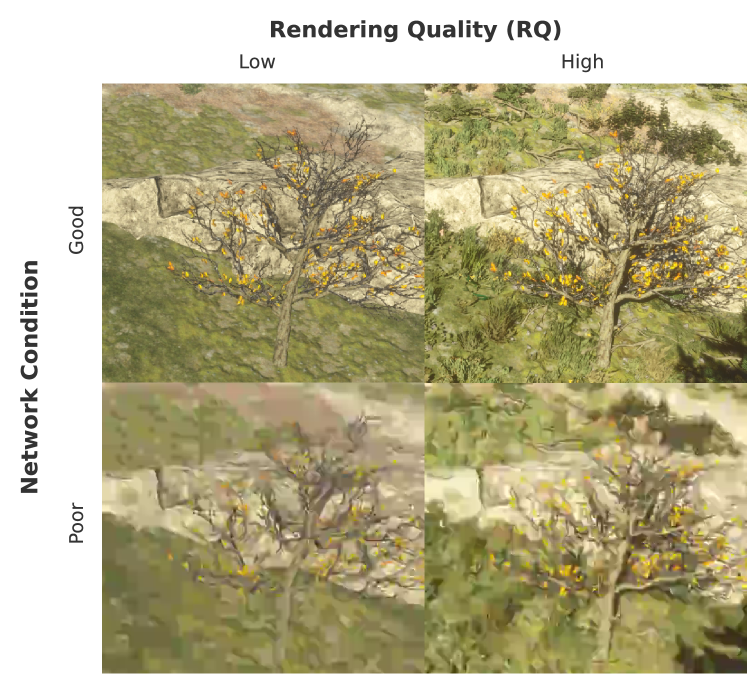
Concretely, in a sample scene in Figure 1 on our testbed (§6.1), the per-frame rendering takes 5.4 ms for the highest RQ and 1.5 ms for the lowest RQ. When the compression loss is severe by a poor network condition (bottom row in Figure 1), the higher RQ taking 3.6 more rendering time becomes ineffective as the user-side quality is hugely degraded by compression. In contrast, for a good network condition (top row), the resource usage for the higher RQ is better justified as it is effective in improving the user-side visual quality.
With this observation, the following question arises: If a server can estimate the user-side visual quality for given RQ and compression parameter corresponding to a user’s network condition, could this be systematically utilized to optimize the users’ RQ to serve more users with limited computing capacity while maintaining the gaming service quality?
To demonstrate its feasibility and benefits, we built Adrenaline, an adaptive game-rendering optimization system for scalable cloud gaming. Adrenaline aims to increase the number of users each GPU on a game server can serve while maintaining their FPS threshold and minimizing user-side visual quality loss. It runs on the server and adaptively optimizes users’ RQs based on estimated user-side visual quality, considering compression and rendering qualities, current FPS, and FPS threshold.
Adrenaline’s RQ optimization is based on three main features. (1) Adrenaline estimates the user-side visual quality with a given RQ and compression parameter on the server side. To estimate the user-side visual quality, we train a regression model on a quality metric [40] and standard video codec [34], and Adrenaline leverages the pretrained model for its RQ optimization (§4.2). (2) When serving multiple users with different network conditions and workloads, the optimization process prioritizes and coordinates the RQ adaptation among them to maximize the aggregate gaming service quality and efficiency of the resource usage. To enable this, we propose a scoring mechanism that quantifies the efficiency of RQ settings with respect to the rendering cost and estimated visual quality (§4.3). (3) Changing RQ presents the overheads to reconfigure and reload the graphical game contents on GPU. To reduce the negative impact of oscillatory and frequent RQ adjustments on user experience, Adrenaline has a backoff mechanism that prevents it and allows the user’s RQ to stabilize at a suitable level (§4.4).
We demonstrate the effectiveness of Adrenaline through the evaluations and user study with two off-the-shelf games and a Adrenaline plugin for Unreal Engine [8]. Overall, this paper makes the following contributions:
-
We identify the opportunity to improve the resource efficiency of edge game servers: the visual quality loss due to compression varies by rendering qualities. We present a prediction method to estimate the user-side visual quality of a given RQ and compression parameter on a server.
-
We build Adrenaline and propose its multi-user RQ optimization with a scoring mechanism quantifying the resource efficiency of RQ settings and a backoff mechanism to stabilize users’ RQs at suitable levels.
-
We evaluate and show Adrenaline’s effectiveness in improving scalability and maintaining gaming service quality.
-
We open-source Adrenaline, hoping that would reduce the barriers for further research in cloud gaming at scale.
2 Background
Cloud Gaming. Cloud gaming allows users to play high quality games like watching a real-time video stream. As long as the user has a low-latency Internet connection, the user can play computationally intensive video games even with commodity devices.
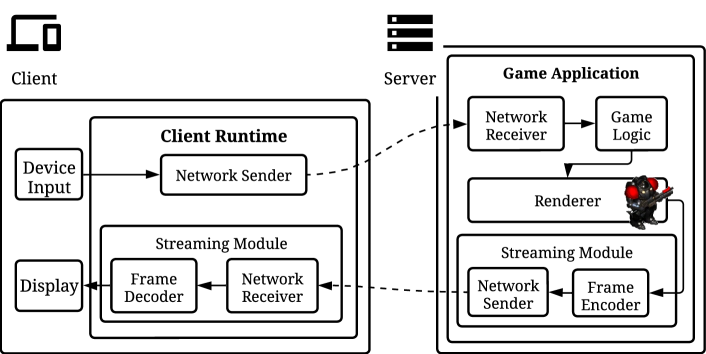
Figure 2 shows the general architecture of a cloud gaming service. The client runtime on the user side gets user inputs and sends them to the server. The game application runs on the server with the game logic and received user inputs. When the game frame is rendered, it is encoded and transmitted to the client via a streaming module. The client decodes the received frame, and it is displayed.
When the game frames are streamed, it involves lossy compression, e.g., H.264 [34] and HEVC [31], for efficient transmission. The streaming module with modern streaming methods such as WebRTC [10], estimates the available bandwidth by using congestion control algorithms, e.g., Google congestion control [15], and adapts its compression parameter to the estimated bandwidth [2].
| Term | Description | ||
| RQ |
|
||
| QP |
|
Rendering Optimization and Quality. 3D graphics rendering is performed via a rendering pipeline, which consists of processing steps including vertex, geometry, and pixel shaders to render 3D objects and convert them into a 2D raster image. Across the pipeline, there are optimization opportunities, e.g., visibility and distance-based culling, anti-aliasing, lighting model, and texture mipmaps. These optimizations compromise the quality of the rendered frame, but they also reduce the rendering cost. In existing games, it is possible for users to set the rendering quality during play, as state-of-the-art game engines, e.g., Unity [32], Unreal Engine [8], and Godot [6], provide preset options for different levels of optimizations.
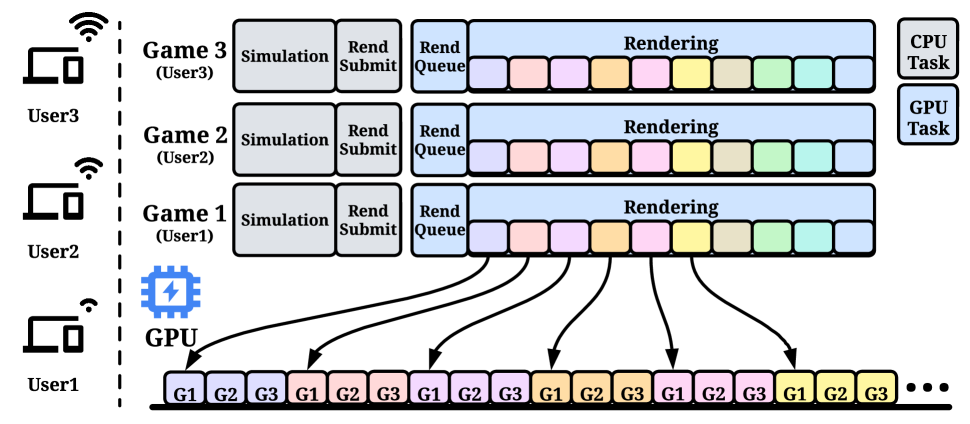
Rendering Multiple Game Applications on GPU. As modern GPU and drivers use time multiplexing, GPU resources can be shared among multiple applications. Figure 3(a) shows the simplified visualization of how multiple game applications are rendered on GPU. The game simulation is done on CPU, and rendering commands are submitted to GPU. GPU processes the applications’ rendering commands in a time-multiplexed manner, where GPU switches between the applications’ rendering commands in the round-robin fashion. Therefore, in cloud gaming, the more users are served by a shared GPU, the more rendering latency is presented to users, degrading their gaming experiences with lower FPS and responsiveness.
Rendering Quality and Compression Parameter Settings. In this paper, by using the optimization presets of Unreal Engine, we set 4 levels of rendering quality (RQ): Low, Medium, High, and Very High, as summarized in Table 1. For each RQ level, the rendering optimization techniques are applied with different levels of aggressiveness; when the RQ is Low, the optimization techniques are applied with the most aggressiveness, causing the lowest visual quality and cost.
Video codecs have a lossiness parameter to determine compression rates. Adrenaline currently supports H.264 and HEVC. These codecs employ a quantization parameter (QP) ranging from 0 (lossless) to 51 (most lossy). We establish three QP settings to different network conditions: 10 for good, 30 for fair, and 40 for poor as summarized in Table 1.
3 Motivation
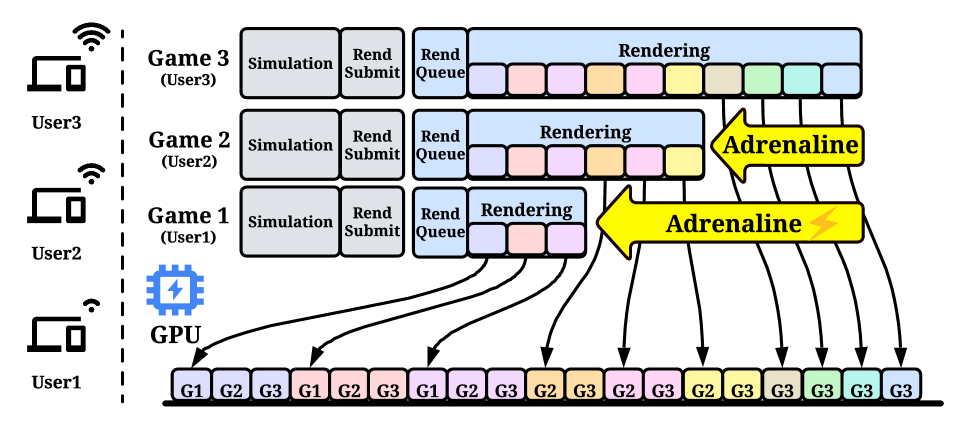
Opportunity and Motivation. In cloud gaming, the visual quality is influenced by both RQ and QP. While QP is determined by network conditions, RQ can be adjusted to balance a rendering cost and quality. Lowering RQ reduces the rendering cost, allowing GPU to accommodate more game instances with playable FPS as described with Figure 3. However, streaming low-quality frames can lead to unsatisfactory visual experiences. Thus, instead of blindly lowering RQ, it is important to determine adequate RQs across users to increase the number of users served above their FPS threshold, while minimizing the visual quality loss.
Observation for Adrenaline. The insight is that the operation on the server may not be fully effective on the user side. The key observation for Adrenaline is that the quality loss due to compression is more significant for frames of higher RQ than frames of lower RQ. As introduced, Figure 1 shows the qualitative results of the visual quality loss due to compression. When QP is low with good network condition, all the details of the rendered frame with high RQ are vividly visible (the upper two patches). As more compression loss is presented with high QP of poor network condition, the details become blurred and difficult to appreciate (the lower two patches), even when expensive high RQ rendering is used.
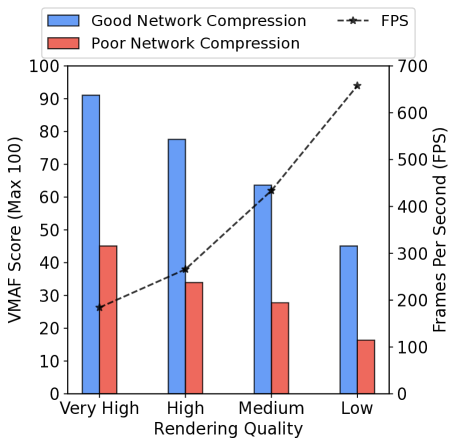
Figure 4 shows the FPS and visual quality measurements from the scene in Figure 1, using various RQs and QPs. Visual quality is quantified using Netflix’s VMAF metric [40], which ranges from 0 (worst) to 100 (best). Our testbed results show that Low RQ achieves up to 657.7 FPS, while Very High RQ reaches 184.3 FPS. Visual quality degrades more significantly with Very High RQ by network conditions: 91.1 (good) to 45.3 (poor). Low RQ shows less quality loss: 45.1 (good) to 16.4 (poor). Notably, Very High RQ under poor network conditions yields similar quality (45.3) to Low RQ under good network conditions (45.1), while requiring 3.6 more rendering time per frame.
These qualitative and quantitative results demonstrate that RQ impact on user-side visual quality varies with network conditions; high-quality rendering is less effective under poor network conditions. For efficient resource use, user RQs should be set considering both rendering costs and user-side visual quality, which depends on both RQ and QP.
4 Adrenaline
Based on our observation, we build Adrenaline, a system that optimizes users’ RQs in an online manner to improve scalability and resource-usage efficiency of a game server. Adrenaline adapts the application-level knob (RQ) to reduce the rendering workloads on the server GPU as shown in Figure 3(b), and resolves a key challenge: how to adapt the RQs of users with different network conditions in a coordinated manner to improve the server capability in serving more users while maintaining user-side gaming service quality.
We propose a novel approach that adaptively optimizes multi-user RQs using a prediction model for the user-side visual quality based on given RQs and QPs. This RQ optimization relies on our scoring mechanism that quantifies the efficiency of resource usage based on the current rendering cost, FPS threshold, and estimated visual quality change (gain/loss) by the RQ adjustment. Our scoring mechanism enables multi-user optimization by comparing the users’ scores and prioritizing the RQ adjustments to maximize the aggregate service quality and efficiency of the resource usage across users. Additionally, Adrenaline has a stabilization mechanism based on exponential backoff to stabilize the users’ RQs at suitable levels and prevent the overheads of unnecessary RQ adjustments from degrading a user’s gaming experience.
4.1 System Overview
Adrenaline runs on the server side as shown in Figure 5, not requiring any modification on the client side. There are two main components: the Adrenaline plugin and runtime system.
The Adrenaline plugin integrates into each game application, monitoring rendering latency and reporting FPS to the Adrenaline runtime (every second by default). Despite requiring game modifications, the plugin is easily attachable to existing games using the game engine’s extension interface. The Adrenaline runtime determines efficient RQs for users based on FPS thresholds, QP from the streaming module, and current FPS.
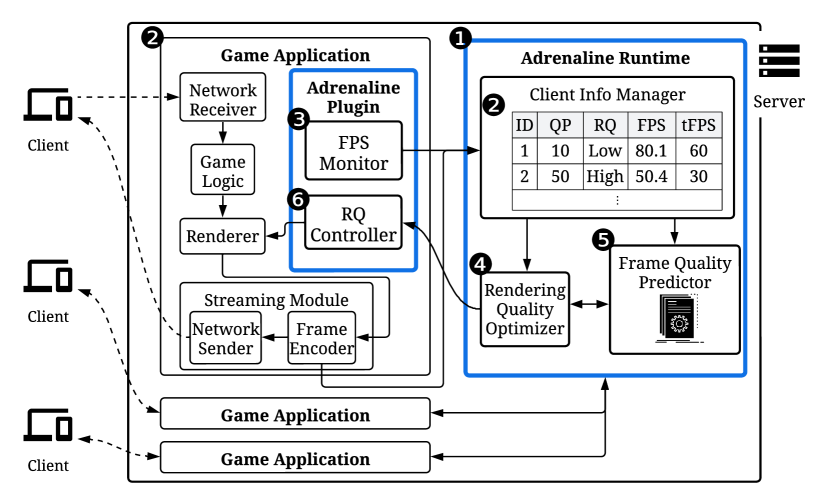
Figure 5 shows Adrenaline’s design and operation. The server-side runtime system includes a client information manager and RQ optimizer with quality prediction models for estimating user-side visual quality. When a game starts, its Adrenaline plugin initializes client information to the runtime, including game ID and FPS threshold (tFPS). QP is obtained from the streaming module; Adrenaline uses compression parameters, making it agnostic to streaming methods. The plugin sets initial RQ to the lowest level to reduce initial lag and ensure higher FPS than the threshold. It also sets an FPS upper bound to prevent FPS from exceeding the user’s display capability and wasting server resources.
The Adrenaline plugin monitors frame rendering latencies and reports current FPS to the runtime. The RQ optimizer periodically adjusts RQ based on client information. In each adjustment round, the optimizer changes the RQ of a user with the highest priority. The optimizer prioritizes keeping all users’ FPS above their thresholds. Then, it starts promoting RQs to improve visual quality. This is because there is a threshold (24 FPS) for the human vision system to recognize motion portrayal [19], and the game responsiveness can be hugely reduced with infrequent frame updates.
When the RQ optimizer finds the highest-priority user, it uses a pretrained regression model which predicts the user-side visual quality with the given RQ and QP (§4.2). The optimizer calculates users’ efficiency scores (§4.3.1) based on the current FPS, FPS threshold, and the predicted user-side visual quality gain/loss by the RQ adjustment. When the RQ optimizer makes a decision for the RQ change, it is forwarded to the Adrenaline plugin of the corresponding game application. Then, the plugin’s controller changes RQ.


4.2 User-side Visual Quality Prediction
Adrenaline’s design is based on the premise that server-side prediction of user-side visual quality is achievable using given RQs and QPs. To realize effective prediction, we address two key questions: the design of the prediction method and the feasibility of accurate server-side prediction of user-side visual quality. We approach quality prediction as a regression problem utilizing RQs and QPs as inputs. Through training and testing regression models with quality data from different game scenes, we demonstrate that user-side visual quality is indeed predictable, validating the core concept underlying Adrenaline’s design.
Training and Testing Data. A prediction model takes RQ and QP as input and outputs the value of the estimated VMAF score in the range of . It is a function of RQ and QP (Eq. 1) resulting in the predicted user-side visual quality (). This can be formulated as a regression problem.
| (1) |
We collect recorded frame sequences from different 3D scenes with different RQs and QPs to train and test the regression models. The scenes are Town, Forest, Desert, Office, and Sky Field in Figure 6. In each scene, we set 5 different locations without overlapping field of views for preventing the test data from being leaked to the training data. From each location, we capture 5-second clips with 30 FPS for each RQ: Low, Medium, High, and Very High. The recorded clips are encoded and decoded with the QP settings of good, fair, and poor network conditions described in Table 1.
Since the ideal case is the original clip of Very High RQ without compression, we use the non-compressed clip of Very High as the reference for VMAF calculation. The VMAF result data is generated by comparing the clips of different RQs and QPs to the reference clip. The training and test data are split by the capturing locations in the scenes; among the 5 locations, 4 of them are for the training data and the remaining location is for the testing data.
Prediction Models and Errors. With the training data, we train the regression models to predict the metric score based on given RQs and QPs. To find the regression model that can effectively estimate the score, we benchmark different linear and non-linear regression models including support vector (SVR), linear, K-nearest neighbor (KNN), decision tree, AdaBoost, and Bagging regressors.
| SVR | Linear | KNN | DecisionTree | AdaBoost | Bagging | |
| RMSE | 18.36 | 11.88 | 10.7 | 9.05 | 12.26 | 9.05 |
Table 2 shows the prediction errors of the regressors. The prediction errors are calculated as the root-mean-square error (RMSE) of the prediction values and the ground truth values in the test data. The decision tree regressor shows the lowest error and is therefore selected for quality prediction in Adrenaline; Bagging shows the same error as it uses multiple decision trees internally. The RMSE of the decision tree is 9.05, which is reasonably low considering the VMAF scale. This result demonstrates that user-side visual quality can be estimated with reasonable accuracy using the given RQ and QP of a user’s network condition.
4.3 Rendering Quality Optimization
Objectives and Approach. Adrenaline aims to increase the number of users that can be served by a server while maintaining their gaming service quality via RQ optimization. This optimization process dynamically adjusts users’ rendering workloads to achieve three key objectives: (O1) ensuring their FPS above the playable threshold despite resource limitations, (O2) minimizing the gaming quality compromises while accommodating more users, (O3) prioritizing efficient RQ assignment based on varying network conditions to maximize overall service quality and resource efficiency across users. To accomplish these goals, Adrenaline employs a round-based RQ optimization process incorporating a scoring mechanism that quantifies resource-usage efficiency by considering both FPS and estimated user-side visual quality.
4.3.1 Scoring Mechanism for Multi-user Prioritization
Each user’s efficiency score, (Eq. 2), is calculated as a weighted sum of the rendering cost score and the visual quality score: (Eq. 3) and (Eq. 4). These scores are in the range of . As incorporates both cost and quality terms in a single score, Adrenaline can prioritize the RQ adjustments maximizing the resource efficiency by comparing the users’ scores (O3).
| (2) | ||||
is logarithmically scaled based on the current FPS () and upper bound (). As FPS increases closer to the upper bound (lower cost), the score approaches 1. The motivation of the logarithmic scaling is the human perception characteristics [25, 22]. For instance, an FPS increment is more effective at lower FPS ranges, with its impact diminishing as FPS increases; the same 30 increment from 10 to 40 FPS is more noticeable than from 90 to 120 FPS.
| (3) |
indicates the magnitude of the relative change in the predicted visual quality by the RQ adjustment. Under a user’s QP, the difference in the predicted visual quality () is calculated from the current RQ and the to-change RQ in Eq. 4. The difference is normalized by the range of the prediction values: of the highest RQ and lowest QP, and and of the lowest RQ and highest QP.
| (4) | ||||
| Variable | Description | |
| A user’s current FPS | ||
| FPS upper bound | ||
| FPS threshold (lower bound) | ||
| A user’s current RQ setting | ||
| The highest possible RQ setting | ||
| The lowest possible RQ setting | ||
|
||
| Regression model for predicting user-side visual quality in VMAF | ||
| A user’s predicted visual quality under the given RQ and QP | ||
| The highest possible predicted visual quality | ||
| The lowest possible predicted visual quality | ||
| A user’s efficiency score |
4.3.2 RQ Optimization Process
The RQ optimization process aims to maximize the aggregate service quality, which is determined by both FPS and visual quality, while simultaneously increasing server capacity and ensuring users’ FPS above the playable threshold (O1 and O2). This optimization process can be formulated with an objective function and our scoring mechanism (Eq. 5). Within this framework, users’ RQs are constrained between and , and their FPS should be between the threshold and the upper bound.
The optimization process of Adrenaline adjusts the most-prioritized user’s RQ in each round by one level (promotion or demotion) to prevent sudden and negative impacts on user experiences. The RQ promotion should be done for a user of low rendering cost (high FPS) and high estimated visual quality gain. Conversely, the RQ demotion should be done for a user of high rendering cost and low estimated visual quality loss. Therefore, a user with a higher has more priority for RQ promotion, and a user with a lower has more priority for RQ demotion.
| (5) | ||||
Algorithm 1 describes the RQ optimization process, which is invoked by the RQ optimizer in Figure 5. It identifies the demote and promote candidates based on the users’ current RQs (Line 5-6). The process prioritizes the RQ demotion phase to maintain the users’ FPS above the threshold. When there are under-FPS users, it calculates of candidates and selects the lowest-score user for demotion (Line 7-14).
When all users are served with the above-threshold FPS, the process starts to promote their RQs to improve the visual quality (Line 16-25). In the promotion phase, it firstly checks if there is a user with FPS close to the threshold (Line 17). As such users’ FPS can be easily dropped below the threshold when the workloads increase by the RQ promotion, the promotion is skipped if such users exist. Otherwise, the highest-score user is selected for the RQ promotion.
4.4 RQ Stabilization Mechanism
4.4.1 RQ Oscillation Issue
As the optimization process adjusts a user’s RQ by one level every round, it is possible the user’s RQ oscillates between two levels, resulting in unnecessary RQ adjustments. For instance, the user’s FPS is above the threshold with the current RQ but can become lower with the one-level-higher RQ.
Such frequent and oscillatory RQ changes can hugely degrade the user’s gaming experience. Changing RQ presents overhead because the rendering contents on GPU should be reloaded and reconfigured for the new RQ; the FPS drops (downward spikes) in Figure 7 are observed due to the RQ change overhead. When a user RQ starts to oscillate and the RQ optimization process is frequently invoked with a short interval, the user experiences the FPS drop and game lag every round, having a poor gaming experience.
4.4.2 RQ Stabilization Mechanism with Backoff
A naive solution is to set a long round interval, but this prevents the RQ optimization process from adapting to the user states quickly. To address this issue, Adrenaline has a stabilization mechanism based on exponential backoff. By keeping track of users’ RQ updates in the past rounds, Adrenaline can detect the RQ oscillation. After adjusting a user’s RQ, the process checks if the user’s RQ is oscillating in Line 27-29 of Alg. 1. If the oscillation is detected, it sets the backoff round. Until the current round reaches the backoff round, the optimization process is skipped without any RQ adjustment.
The backoff round is set by Get_backoff_round function, which increases the user’s backoff count and sets the backoff round to ; N is the current round number. backoff_base and backoff_count are adjustable parameters of the Adrenaline runtime. Additionally, to prevent too long suppression, Adrenaline allows setting the maximum backoff count. When users’ RQs stop oscillating, the backoff count is collapsed, and the optimization process is resumed.
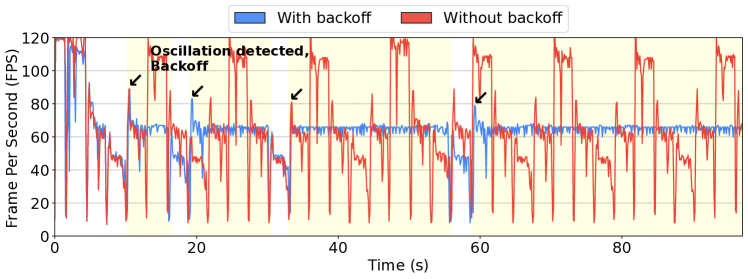
We run an experiment to demonstrate the effectiveness of our stabilization mechanism. Figure 7 shows the FPS traces of the users with and without the backoff playing a sample game (Mountain Hiker in Figure 8). The optimization interval is 3 seconds, the backoff base is set to 2, the maximum backoff count is 5, and the FPS threshold is set to 60.
The trace without the backoff shows that the RQ oscillation occurs frequently, causing frequent FPS drops every round. Moreover, when the overhead of the RQ change affects the next round with low FPS, the user RQ is demoted again, which causes another FPS drop with poor visual quality. This is observed in the trace of the user without the backoff in Figure 7; this user’s RQ periodically oscillates between two levels. On the other hand, the user with the backoff experiences the RQ oscillation initially, but the backoff relieves it after a few rounds, and the user’s RQ gets stabilized.
5 Implementation
Adrenaline, currently implemented and tested on Ubuntu 22.04, uses Python for its runtime and scikit-learn [23] for regression models. While it primarily supports Unreal Engine (UE) games through its plugin for UE, it can be adapted for other game engines like Unity [32] and Godot [6]. The evaluation games are C++ implementations on UE, and ZeroMQ [17] is used inter-process communication between the Adrenaline runtime and plugin.
6 Evaluation
As the objective of Adrenaline is to address the scalability challenge of cloud gaming services by adapting the rendering workloads with RQ optimization, the evaluation answers the following questions: (EQ1) As the number of users increases, does Adrenaline effectively adapt their RQ to maintain their FPS for playable gaming experience? (EQ2) Compared to the case of the existing cloud gaming services where assigning a GPU to each user with the highest RQ, how much can Adrenaline improve the server scalability? (EQ3) Compared to other baselines with compromised RQ settings, how well does Adrenaline maintain gaming service quality in terms of user-received visual quality and FPS?
To answer these questions, we conduct experiments by setting up three scenarios with two sample games of different resource demands. We evaluate Adrenaline’s impact on scalability in terms of the number of users that can be served on a server with playable FPS, comparing the case where the existing cloud gaming services face when they naively accommodate more users with their current approach (EQ1 and EQ2). Then, we assess the gaming service quality of Adrenaline against other baselines with reduced RQ settings, using a score metric based on FPS and user-side visual quality. We complement the evaluation on gaming service quality with a user study that compares the serving state of Adrenaline and the baselines, reporting Adrenaline’s winning rate (EQ3).
6.1 Experiment Methodology
Testbed. Adrenaline runs on a machine with AMD Ryzen 9 7950X processor with 16 cores and 32 threads, 64 GB main memory, and Nvidia RTX 4090 with 24 GB VRAM.
Sample Games. Adrenaline’s effectiveness is evaluated using two open UE game samples [30, 7] shown in Figure 8. Village Shooter features relatively simple, cartoonish graphics, while Mountain Hiker has more complex, realistic graphics, resulting in higher rendering costs.


Experiment Scenarios. We designed three experimental scenarios for evaluation, each involving a server accommodating up to 6 users divided into two groups (A and B) of 3 users each. Within each group, users have different network conditions: Good (G), Fair (F), and Poor (P) with corresponding QPs as outlined in Table 1. The primary distinction between the groups lies in their arrival patterns: Group A users join the server sequentially at 20-second intervals (G at 0 seconds, F at 20 seconds, P at 40 seconds), whereas all Group B users (G, F, P) join simultaneously at 60 seconds.
In Scenario 1 and 2, all users play the same game, Village Shooter and Mountain Hiker, respectively. In Scenario 3 (Mixed-game Case), Group A plays Village Shooter and Group B plays Mountain Hiker.
These user-arrival patterns allow us to evaluate Adrenaline’s adaptability to both gradual and sudden increases in user load. Furthermore, the varying gameplay scenarios test Adrenaline’s effectiveness under diverse rendering workloads. In our experiments, the RQ optimization interval is set to 5 seconds, with an FPS threshold of 30 and an upper bound of 120 FPS. The cost and quality terms in (Eq. 2) are equally weighted (=0.5). For the backoff, we use a base of 2 with a maximum backoff count of 5.
6.2 Impact on Scalability
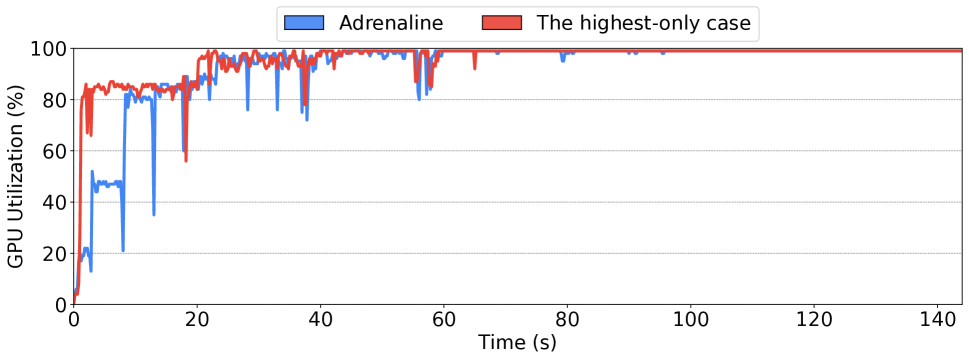
We run the experiments in Scenario 1 and 2, and compare the FPS traces and GPU usage of Adrenaline and the existing cloud services’ approach of assigning Very High RQ. While the existing services do not make a GPU shared by multiple users, this highest-only case represents the situation where they naively accommodate more users with their approach.
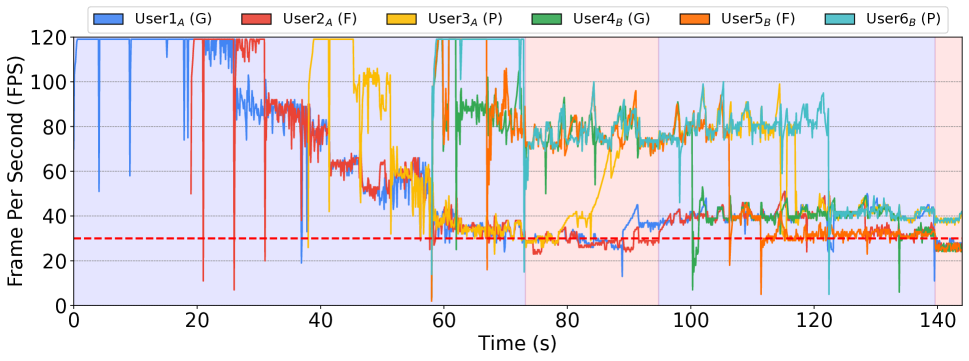
6.2.1 Village Shooter: FPS Trace
Figure 9 shows the FPS trace graphs of Village Shooter.
Highest-only Case. For the initial 3 users in Group A, User1A (G) is served with 120 FPS and Very High RQ in Figure 9(a). When User2A (F) appears to the server, both users are served with 93 FPS as the server is more loaded (described with Figure 3). The FPS becomes 60 FPS when User3A (P) comes. When Group B joins the server at once, all users’ FPS drops to 28 FPS below the threshold.
Adrenaline. User1A (G) begins with a Low RQ setting, as Adrenaline initially assigns the lowest rendering quality to users. Due to the high FPS achieved, Adrenaline progressively promotes User1A’s RQ. As shown in Figure 9(b), User1A (G) eventually reaches the same state as in the highest-only case, achieving Very High RQ and 120 FPS after RQ promotions at 18 seconds. When User2A (F) and User3A (P) join the server, they also start with Low RQ and maintain higher FPS compared to the highest-only case. As all three users consistently achieve above-threshold FPS, Adrenaline continues to promote their RQs, enabling them to reach the same state as the highest-only case by around 50 seconds.
At the 60-second mark, Group B joins the server with Low RQ, and Group A still maintain above-threshold FPS. Adrenaline then begins promoting the RQs of Group B. After promoting User4B (G) and User5B (F) from Low to Medium, Group A with Very High presents 35 FPS, while User4B and User5B with Medium reach 80 FPS. When User6B (P) is promoted at 70 seconds, FPS for Very High RQ users drop below the threshold, as indicated by the red background color in Figure 9(b).
To address these under-threshold FPS users, Adrenaline initiates a demotion phase. During this phase, User3A (P) is initially demoted to High, followed by further demotions of remaining Very High RQ users. By 95 seconds, these adjustments make all users’ FPS above the threshold. Adrenaline then continues to optimize users’ RQs based on their , balancing FPS and user-side visual quality according to their network conditions. In the later part of the trace in Figure 9(b), Adrenaline converges users’ RQs to optimized levels while maintaining above-threshold FPS, as summarized in Table 4.
6.2.2 Mountain Hiker: FPS Trace
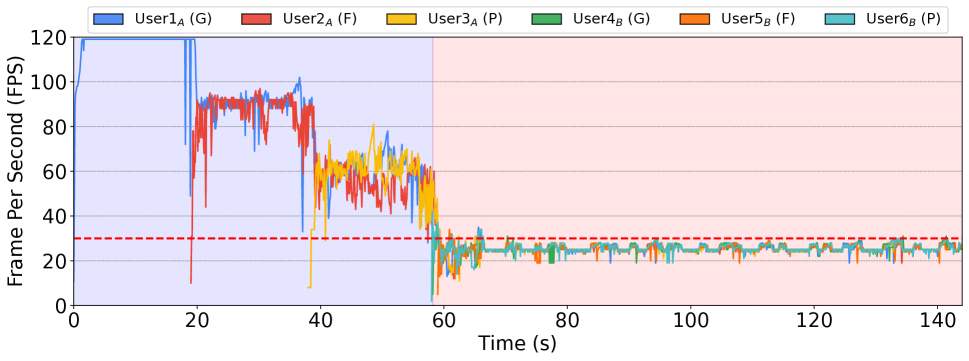
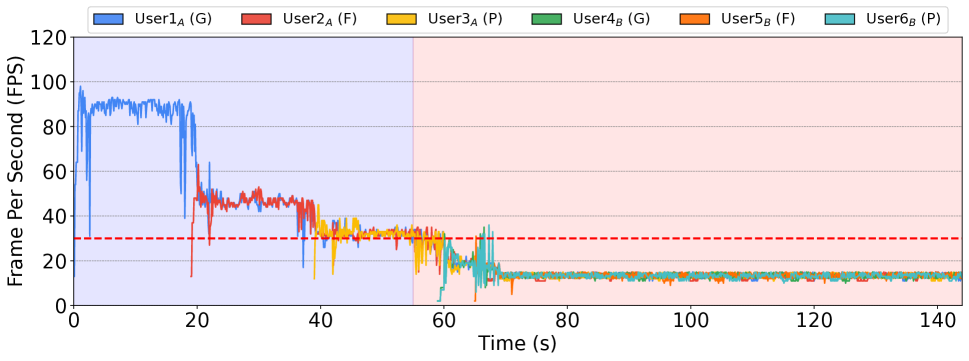
Figure 10 illustrates the FPS traces of Mountain Hiker, a game with higher rendering resource demands.
Highest-only case. In the highest-only case (Figure 10(a)), User1A (G) initially experiences 94 FPS. As User2A and User3A join the server, FPS of Group A decreases to 32. When Group B appears, the server is overloaded, and all users’ FPS becomes 13 FPS, which is too low to provide playable gaming experiences.
Adrenaline. The effectiveness of Adrenaline is more significant with Mountain Hiker’s intensive workload. Initially, User1A (G) and User2A (F) start with Low RQ and are subsequently promoted to Very High, reaching the same state as the highest-only case. However, when User3A (P) joins and is promoted to High RQ at around 50 seconds, FPS of User1A and User2A falls below the threshold. This drop is attributed to the overhead of RQ adjustment, as demonstrated in §4.4; the highest-only case serves Group A with near-threshold FPS without this overhead.
The situation further deteriorates when Group B joins at 60 seconds. Despite starting with Low RQ, the server is already heavily loaded and struggles to maintain above-threshold FPS. Adrenaline responds by keeping Group B at Low and demoting the other users’ RQs. User3A (P) is demoted continuously to Medium because the efficiency loss is expected to be less than demoting users with better network conditions. However, User1A and User2A are further demoted to Medium as their FPS remains below the threshold. Then, the under-threshold FPS issue is resolved at 80 seconds.
After ensuring all users are with above-threshold FPS, Adrenaline begins promoting users’ RQs in subsequent optimization rounds. Group B users are promoted from Low to Medium RQ, resulting in 37 FPS for all users at Medium. Adrenaline then attempts to promote User1A (G) at 110 seconds, but this causes User1A’s FPS to drop below the threshold, leading to a demotion at 115 seconds. Detecting this oscillation, Adrenaline’s backoff mechanism is activated to prevent further oscillatory RQ adjustments. As the trace progresses, the backoff duration increases, and users’ RQs stabilize with above-threshold FPS, as summarized in Table 4.
| Village Shooter (Scenario 1) | Mountain Hiker (Scenario 2) | Mixed-game Case (Scenario 3) ( for Village Shooter, for Mountain Hiker) | ||||||||
| RQ | FPS | Visual Quality | RQ | FPS | Visual Quality | RQ | FPS | Visual Quality | ||
| Adrenaline | User1A (G) | Very High | 30.88 | 81.71 | Medium | 37.91 | 51.01 | Very High | 30.17 | 81.71 |
| User2A (F) | High | 37.91 | 59.64 | Medium | 37.74 | 47.31 | High | 38.64 | 59.64 | |
| User3A (P) | Medium | 72.05 | 38.1 | Medium | 35.4 | 38.1 | Medium | 61.05 | 38.1 | |
| User4B (G) | Very High | 30.41 | 81.71 | Medium | 37.81 | 51.01 | Medium | 38.64 | 51.01 | |
| User5B (F) | High | 39.22 | 59.64 | Medium | 36.85 | 47.31 | Medium | 38.33 | 47.31 | |
| User6B (P) | Medium | 69.54 | 38.1 | Medium | 35.87 | 38.1 | Medium | 37.7 | 38.1 | |
| Highest-only | User1A (G) | Very High | 27.69 | 81.71 | Very High | 13.4 | 81.71 | Very High | 25.32 | 81.71 |
| User2A (F) | 28.57 | 77.42 | 13.51 | 77.42 | 25.64 | 77.42 | ||||
| User3A (P) | 27.87 | 44.84 | 13.09 | 44.84 | 26.06 | 44.84 | ||||
| User4B (G) | 28.07 | 81.71 | 13.25 | 81.71 | 14.36 | 81.71 | ||||
| User5B (F) | 28.78 | 77.42 | 13.75 | 77.42 | 13.87 | 77.42 | ||||
| User6B (P) | 28.47 | 44.84 | 13.46 | 44.84 | 14.01 | 44.84 | ||||
| Lowest-only | User1A (G) | Low | 120 | 24.43 | Low | 120 | 24.43 | Low | 120 | 24.43 |
| User2A (F) | 22.76 | 22.76 | 22.76 | |||||||
| User3A (P) | 16.98 | 16.98 | 16.98 | |||||||
| User4B (G) | 24.43 | 24.43 | 24.43 | |||||||
| User5B (F) | 22.76 | 22.76 | 22.76 | |||||||
| User6B (P) | 16.98 | 16.98 | 16.98 | |||||||
| dJay [12] | User1A (G) | 39.35 (25.81) | 65.42 (81.71) | 34.56 (19.9) | 51.01 (65.42) | 37.9 (23.44) | 65.42 (81.71) | |||
| User2A (F) | 40.61 (26.1) | 59.64 (77.42) | 34.41 (19.5) | 47.31 (59.64) | High (Very High) | 37.38 (23.7) | 59.64 (77.42) | |||
| User3A (P) | High | 40.48 (26.2) | 42.57 (44.84) | Medium | 36.44 (19.78) | 38.1 (42.57) | 37.4 (23.81) | 42.57 (44.84) | ||
| User4B (G) | (Very High) | 39.63 (26.41) | 65.42 (81.71) | (High) | 37.11 (19.34) | 51.01 (65.42) | 36.59 (13.4) | 51.01 (65.42) | ||
| User5B (F) | 40.01 (25.9) | 59.64 (77.42) | 36.8 (19.48) | 47.31 (59.64) | Medium (High) | 37.08 (13.21) | 47.31 (59.64) | |||
| User6B (P) | 39.93 (26.21) | 42.57 (44.84) | 37.2 (19.14) | 38.1 (42.57) | 36.9 (12.97) | 38.1 (42.57) | ||||
6.2.3 Summary
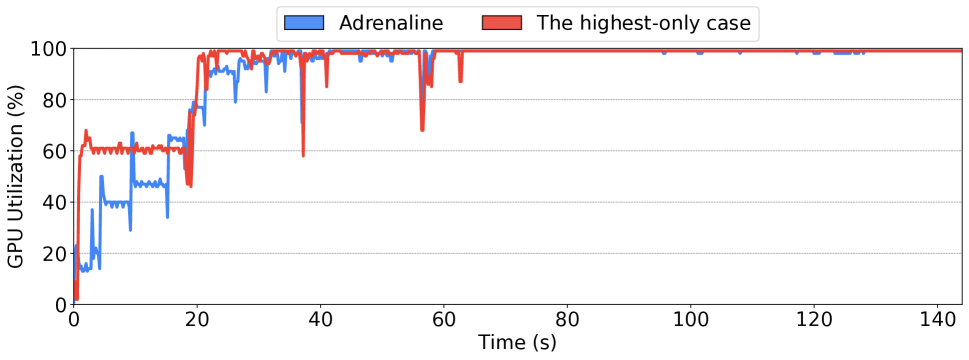
In the highest-only case, the number of users that can be served with above-threshold FPS is 5 for Village Shooter and 3 for Mountain Hiker, as shown in Figures 9(a) and 10(a). Adrenaline allows the server with the same resource footprint (Figure 11) to accommodate more users and maintain playable gaming experiences under varying workloads. As all users are served with above-threshold FPS, Adrenaline improves the number of users that can be served on the server by 1.2 for Village Shooter and 2 for Mountain Hiker (EQ1 and EQ2).
6.3 Impact on Gaming Service Quality
For scalability, Adrenaline adjusts the users’ RQs, which may compromise the visual quality. As a user’s RQ is an adjustable knob, there can be other cases that use this knob to reduce the server load and accommodate more users. We evaluate and compare the gaming service quality of Adrenaline against such baselines, demonstrating the effectiveness of Adrenaline in maintaining the gaming service quality (EQ3).
6.3.1 Baselines
Along with the highest-only case, we consider other baselines: the lowest-only case and dJay [12]. The lowest-only case represents a naive scenario where all users are assigned the lowest RQ. While the highest-only case maximizes visual quality, the lowest-only case prioritizes user accommodation, offering contrasting perspectives on resource allocation strategies.
dJay is a previous work that adjusts users’ RQs to reduce server load. Although it shares similarities with Adrenaline in terms of RQ adjustment, there are significant differences in approach. Firstly, dJay adapts RQs to maintain FPS but does not consider the user-side visual quality affected by compression settings under varying network conditions. Secondly, while dJay is also round-based, it simultaneously adjusts all users’ RQs every round without a stabilization mechanism.
In contrast, Adrenaline selects the most efficient RQ adjustment among users based on server load and estimated user-side visual quality, considering the QPs of their network conditions. This prioritization is enabled by as described in §4.3.1. Additionally, Adrenaline has a stabilization mechanism to mitigate the negative effects from RQ oscillation overheads (§4.4). The extreme cases (highest-only and lowest-only) and dJay serve as reference points for evaluating Adrenaline’s performance in maintaining service quality.
6.3.2 Gaming Service Quality
Gaming Service Quality Metric. Gaming service quality assessment requires consideration of both FPS and visual quality. However, to our best knowledge, no established single metric comprehensively encompasses both factors. While FPS and visual quality have traditionally been measured separately to estimate gaming experience, we introduce a systematic metric - the service quality score (Eq. 6) - to facilitate a holistic comparison between Adrenaline and other baselines. The service quality score is calculated as the product of the FPS score (Eq. 3) and the user-side visual quality.
| (6) |
Service Quality Comparison. Table 4 summarizes the user serving states of Adrenaline and the other baselines across three experimental scenarios: Scenario 1 (Village Shooter), Scenario 2 (Mountain Hiker), and Scenario 3 (Mixed-game Case). In Scenario 3, Group A plays Village Shooter, and Group B plays Mountain Hiker. For dJay, as it faces RQ oscillation overheads without stabilization mechanisms, we report FPS and visual quality metrics for RQ levels (shown in parentheses) between meeting and not meeting FPS thresholds. Adrenaline’s results are the final stabilized serving states.
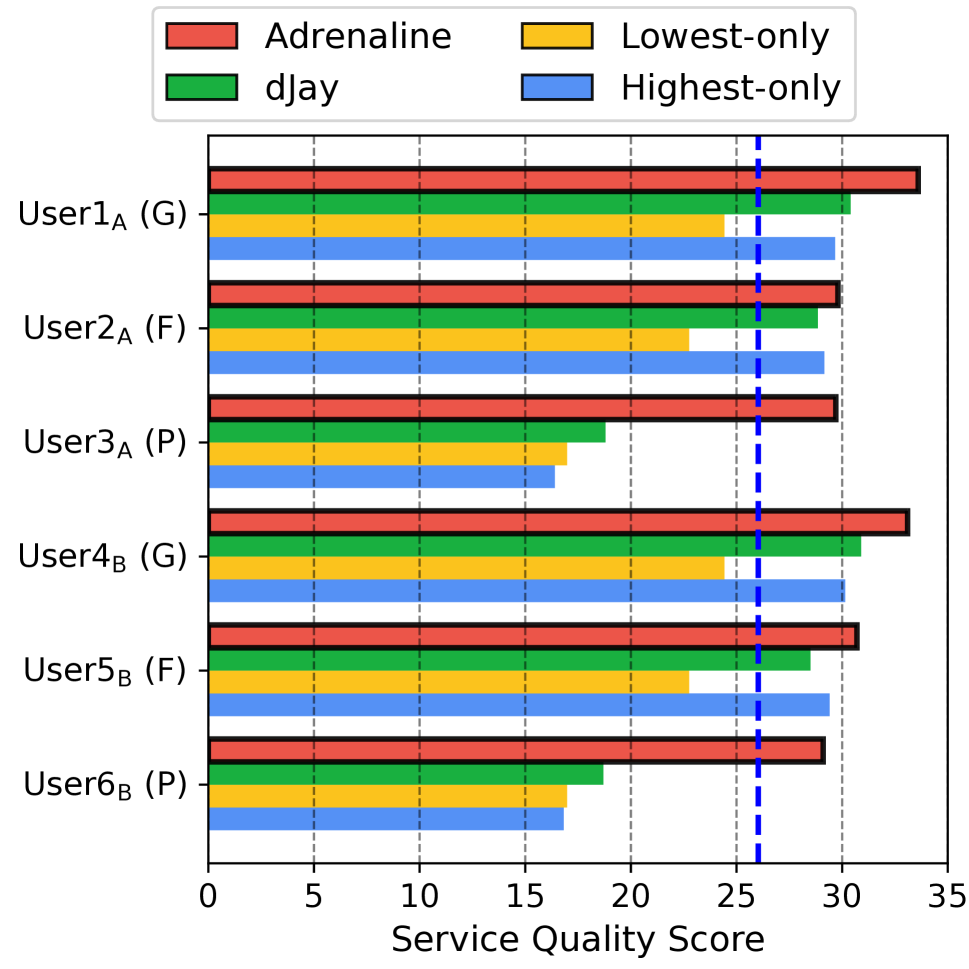
Figure 12 shows the comparative results of the service quality scores based on the serving states in Table 4. dJay’s score is the average of the two oscillating RQ levels.
Scenario 1. In Figure 12(a), Adrenaline (red) shows the better service quality scores across all users. For users with (G) and (F) network conditions, the highest-only case (blue) achieves comparable results to Adrenaline, as their FPS remains close to, though slightly below, the threshold (Table 4). However, the highest-only case shows quality degradation for User3A and User6B (P), as it fails to improve user-side visual quality while unnecessarily consuming resources.
dJay’s performance (green) falls short of Adrenaline due to RQ oscillation overheads for users with (G) and (F) network conditions. Similar to the highest-only case, dJay’s inability to account for varying network conditions leads to inefficient resource usage for User3A and User6B (P). At the other extreme, the lowest-only case (yellow), despite high FPS, delivers consistently poor service quality due to its minimal RQ that results in low visual quality.
Adrenaline achieves better service quality through optimized resource allocation, enhancing visual quality for users with (G) and (F) network conditions while reducing RQs for users with (P) to prevent resource waste. In this scenario, the most competitive baseline is dJay. Adrenaline outperforms dJay by 19% in the averaged score across all users: 31.2 for Adrenaline and 26.2 for dJay.
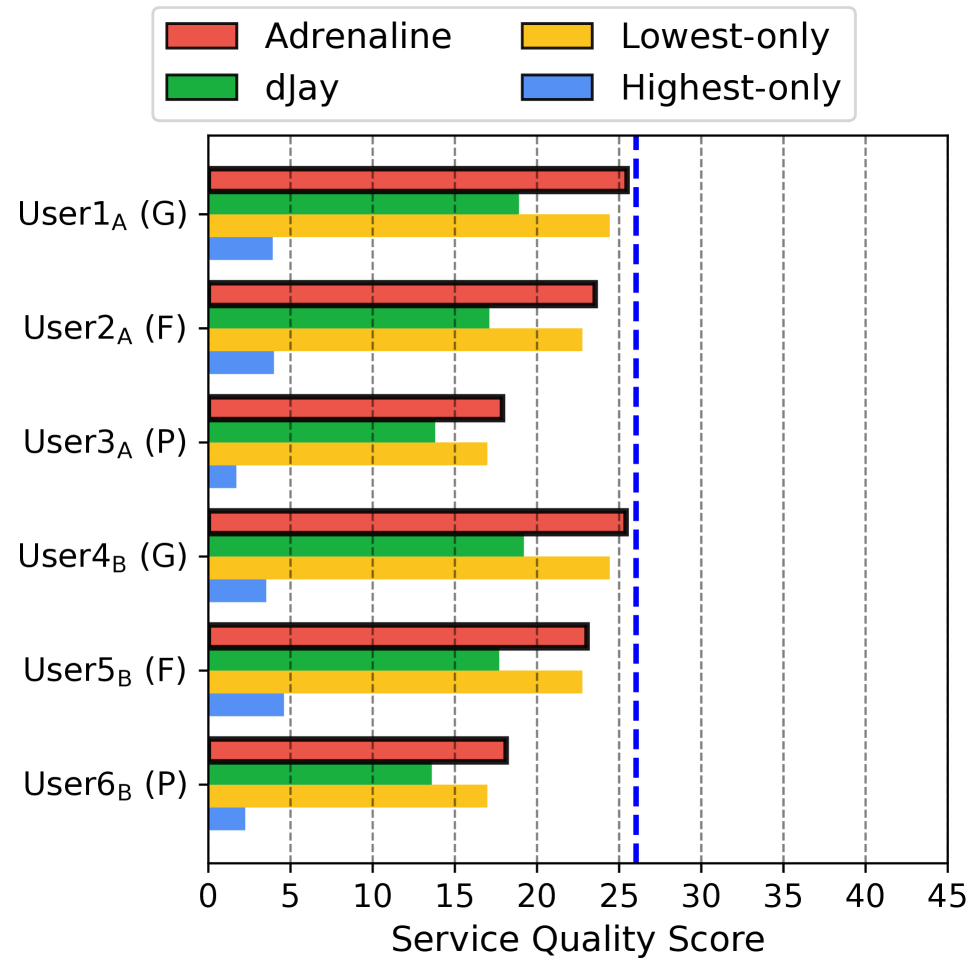
Scenario 2. In Figure 12(b), the service quality results differ notably by Mountain Hiker’s higher resource demands, resulting in lower service quality scores across all cases. The highest-only case shows particularly poor results due to FPS dropping far below the playable threshold (13 FPS).
For dJay, the performance difference to Adrenaline becomes less pronounced for User3A and User6B (P). This is because the heavy server load limits both systems’ ability to increase RQ, thereby reducing dJay’s tendency to waste resources through network-condition-agnostic RQ adjustments.
In Scenario 2, the lowest-only case is the most competitive baseline, as it maintains smooth gameplay. Adrenaline outperforms it by small margin, 5% in the averaged score across all users: 22.4 for Adrenaline and 21.3 for the lowest-only case. As summarized in Table 4, Adrenaline optimizes performance by stabilizing all users’ RQ at Medium, striking a balance between FPS and visual quality.
The serving states of Adrenaline (Medium, 38 FPS) present the better results with the systematic metric than those of the lowest-only case (Low, 120 FPS). However, users may prefer the lowest-only case for its higher FPS, and we further investigate this in the user study.
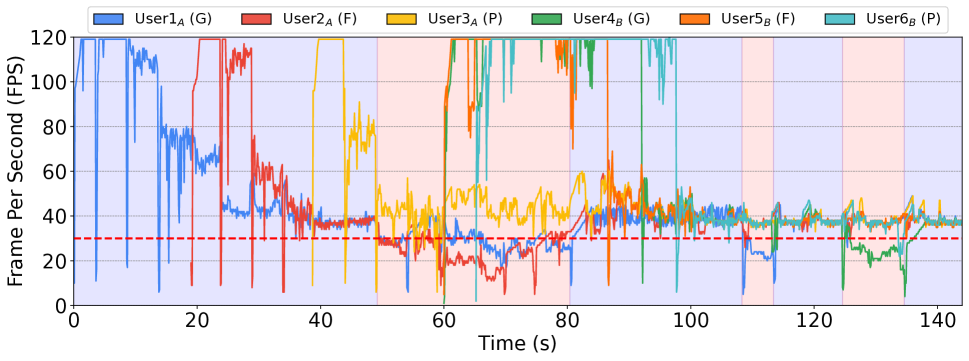
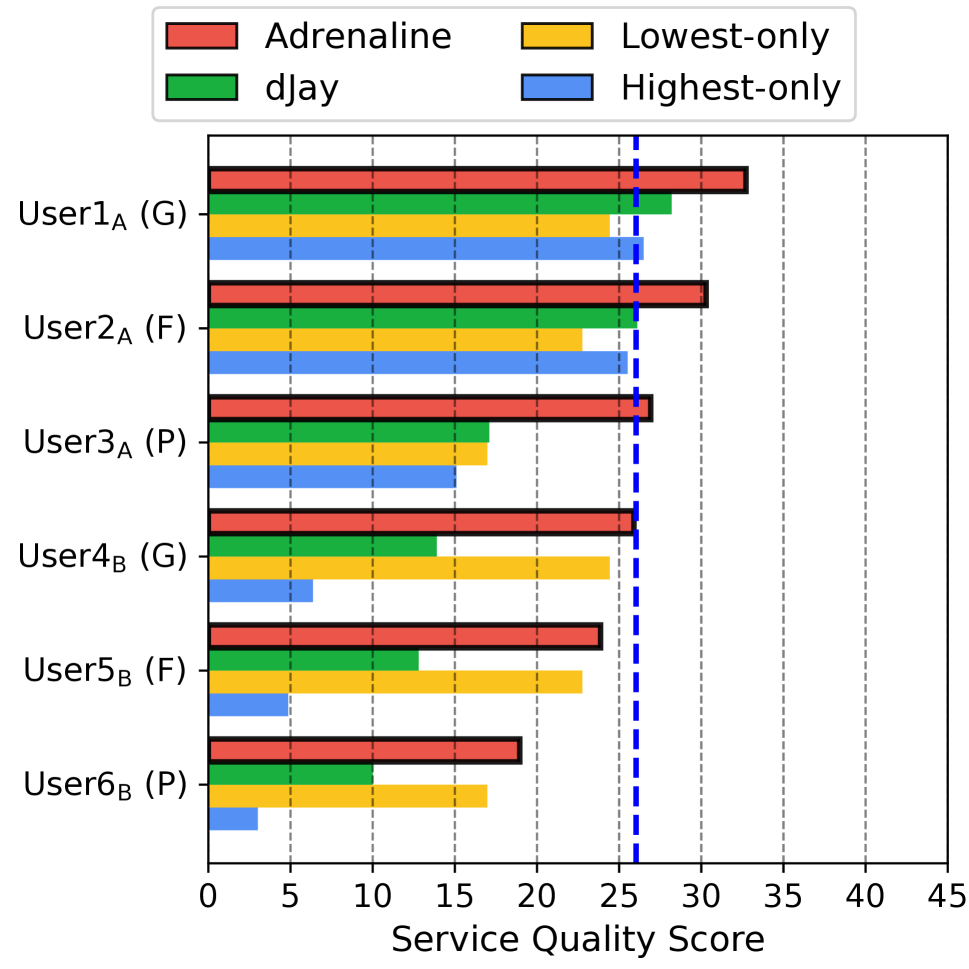
Scenario 3. In Figure 12(c), the mixed-game scenario shows Adrenaline’s versatility in handling heterogeneous workloads. For Group A playing Village Shooter (moderate resource demands), Adrenaline maintains higher RQs for User1A (G) and User2A (F) similar to the highest-only case. Unlike the highest-only case, Adrenaline adjusts the RQ of User3A (P) to an efficient level, balancing visual quality and FPS. For Group B playing Mountain Hiker, the efficient RQ levels are close to the lowest-only case. In this scenario, Adrenaline achieves 24% higher service quality than the lowest-only case: 26.5 for Adrenaline and 21.3 for the lowest-only case.
The results demonstrate Adrenaline’s adaptability in finding efficient operating states between the two extremes. When a game’s resource demand is high and a server is heavily loaded, Adrenaline may converge to the lowest RQ settings to maintain above-threshold FPS, similar to the lowest-only case. When resources are sufficient and a game’s resource demand is low, Adrenaline matches the highest RQ settings to improve visual quality with playable FPS as shown in Figure 9(b) and 10(b). Through its network-condition-aware RQ optimization, Adrenaline sets efficient RQ settings for users of different network conditions based on game workloads and server resources, maximizing aggregate service quality.
6.3.3 User Study
Methodology. To validate Adrenaline’s performance, we conduct a user study based on the mixed-game case (Scenario 3). The study involves 30 participants aged 20-58, with varying levels of video game familiarity: 11 very familiar, 15 somewhat familiar, and 4 not really familiar.
Participants compare pairs of gaming clips anonymized as A and B, where one is served by Adrenaline and the other by one of the baselines. They are asked to choose which clip they preferred in terms of smoothness and visual quality, or indicate a draw. After the initial survey, we ask participants to provide feedback on the results which are not aligned with the results of the systematic metrics. The winning rate is calculated using the formula in Eq. 7.
| (7) |
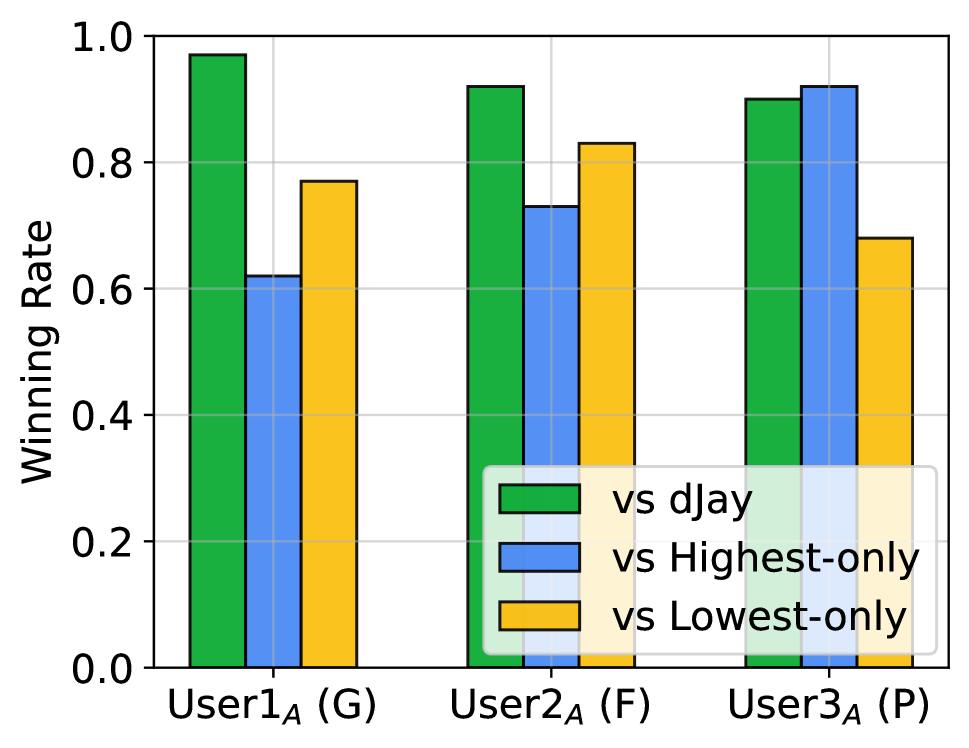
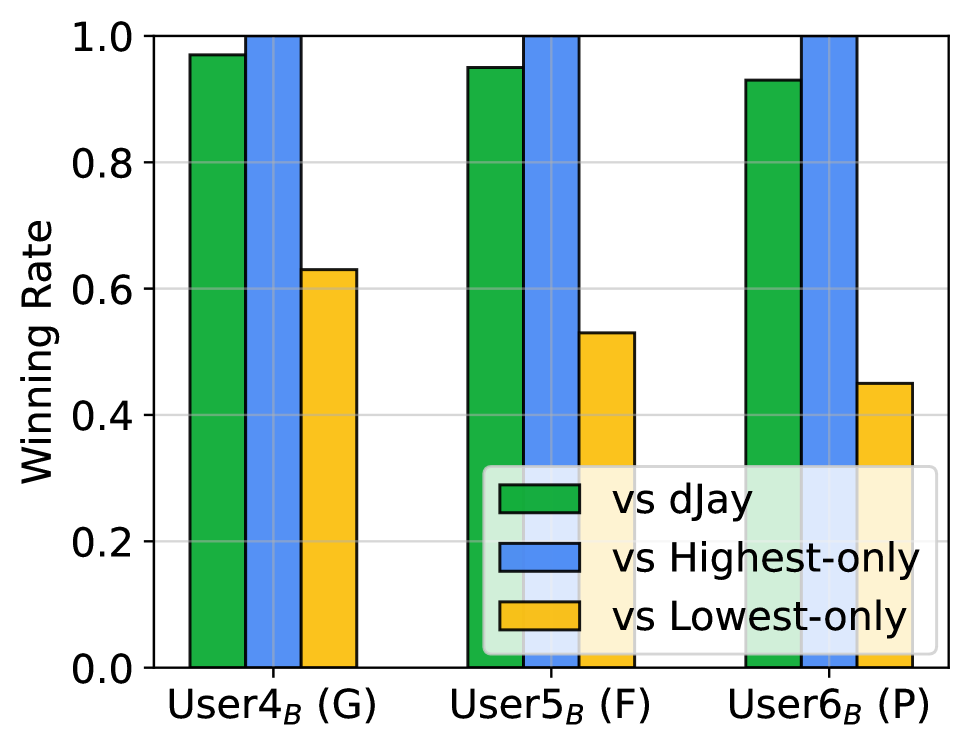
Adrenaline vs dJay. Figure 13 presents the winning rate of Adrenaline against the other baselines. Adrenaline consistently outperforms dJay across all users, demonstrating the effectiveness of its network-condition-aware RQ adaptation and stabilization mechanism.
Adrenaline vs Highest-only. For Mountain Hiker, Adrenaline significantly outperforms, as the highest-only case struggles to maintain above-threshold FPS. For Village Shooter, Adrenaline’s winning rate decreases as network conditions get better: 92% for User3A (P), 73% for User2A (F), and 62% for User1A (G). These results align with the service quality findings in §6.3.2, where the highest-only case becomes competitive with FPS slightly below the threshold in better network conditions.
Adrenaline vs Lowest-only. For Village Shooter, Adrenaline presents higher winning rates with Group A. Interestingly, the winning rate for User2A (F) is higher than that of User1A (G): 83% and 73% respectively. Participants’ feedback indicates better visual quality with Adrenaline for both users than the lowest-only case, but their preferences on FPS and visual quality differ; User1A (G) is with (Very High, 30 FPS), and User2A (F) is with (High, 39 FPS).
For Mountain Hiker, Adrenaline’s winning rate is lower than the lowest-only case except in good network condition: 56% for User4B (G), 47% for User5B (F), and 35% for User6B (P). Participants choosing the lowest-only case note smoother clips, while those selecting Adrenaline mention better visual quality with acceptable smoothness.
Subjective Preferences and Future Direction. The study reveals varying user preferences regarding visual quality and smoothness. While Adrenaline offers flexibility in weighing these factors through in Eq. 2, providing tailored gaming service requires further investigation on how to incorporate user preferences into the system design.
6.3.4 Summary
Adrenaline adapts users’ RQs via network-condition-aware RQ optimization, maintaining above-threshold FPS while balancing visual quality and server load. The results with the systematic metrics show that Adrenaline achieves up to 24% higher service quality compared to the most competitive baseline in each scenario. Although user satisfaction can vary based on preferences in some cases, the user study results demonstrate Adrenaline’s effectiveness in most scenarios.
6.4 Adrenaline Overhead
The overhead of Adrenaline comes from its runtime and plugin. The plugin monitors the frame rendering latency of the game and reports FPS to the runtime via IPC, and this plugin overhead is negligible. The monitoring overhead can be piggybacked on the game engine’s timer mechanism; the game engine sets an internal timer in a game to measure the elapsed time for each frame, and the plugin utilizes the existing timer to determine the frame rendering latency and calculate FPS from the elapsed time.
The runtime overhead mainly comes from the optimization process in Alg. 1. The process requires per-user visual quality prediction, and it involves the inference of the regression model that predicts the user-side quality with the given QP and RQ. We evaluate the overhead of the visual quality prediction with different numbers of users.
Table 5 shows the latency and energy usage of the visual quality prediction with different numbers of users in our scenario. As shown in the result, the prediction latency is less than 2.06 ms and the energy usage is less than 0.109 J even with 5 users. Moreover, this overhead is incurred once every RQ optimization interval. Even with other prediction methods which can pose higher overhead, the runtime overhead can still be managed by adjusting the optimization interval. This result shows that the scalability benefit of Adrenaline is achieved with negligible runtime overheads, and it is reasonable for the edge game server to adopt Adrenaline.
| 1 | 2 | 3 | 4 | 5 | |
| Prediction Latency (ms) | 0.41 | 0.84 | 1.25 | 1.66 | 2.06 |
| Energy Usage (J) | 0.041 | 0.062 | 0.077 | 0.094 | 0.109 |
7 Related Work
Previous research has focused on improving cloud gaming service quality and efficiency through various approaches. One popular method involves optimizing server provisioning and allocation based on user demand and geographical distribution to minimize network latency and service operational costs [5, 4, 1, 9, 28, 35, 18].
Another line of research has explored enhancing server resource efficiency through GPU scheduling and resource allocation, utilizing virtual machines (VMs) and virtualized GPUs [14, 24, 13, 36, 39, 38]. From the perspective that Adrenaline utilizes an application-level knob to adapt user workloads and improve per-GPU scalability, it is orthogonal to those previous works focused on server allocation and GPU scheduling. This suggests potential opportunities for joint optimizations with previously proposed techniques to reduce the operational cost of cloud gaming services while maintaining service quality and availability.
Some researchers have leveraged RQ adjustments for scalability [33, 12]. Wang et al. presented a system that reduces bandwidth usage by lowering streamed frame resolution, while Grizan et al. proposed dJay, which adjusts RQ to reduce GPU resource usage when serving multiple users. While dJay shares similarity with Adrenaline in using RQ, Adrenaline has more advanced approaches with its network-condition-aware RQ optimization, efficiency-based prioritization, and RQ stabilization mechanisms. In our evaluation, we demonstrate the effectiveness of Adrenaline’s features for service quality compared to existing approaches including dJay.
8 Conclusion
This paper presents Adrenaline, an adaptive rendering optimization system designed to improve scalability of cloud gaming services. By optimizing RQs based on user network conditions and server load, Adrenaline efficiently balances visual qualities and rendering costs. In our evaluation, Adrenaline improves server scalability in terms of the number of users served with playable FPS compared to the existing cloud gaming services’ approach and maintains higher service quality than the other reduced-RQ baselines in diverse experimental scenarios. The user study further validates its effectiveness in most scenarios, though it also reveals the need for future work in incorporating user preferences. As its integration with modern game engines is straightforward, Adrenaline provides opportunities for widespread adoption and further research in scalable cloud gaming.
References
- [1] Mohaddeseh Basiri and Abbas Rasoolzadegan. Delay-aware resource provisioning for cost-efficient cloud gaming. IEEE Transactions on Circuits and Systems for Video Technology, 28(4):972–983, 2016.
- [2] Hao Chen, Xu Zhang, Yiling Xu, Ju Ren, Jingtao Fan, Zhan Ma, and Wenjun Zhang. T-gaming: A cost-efficient cloud gaming system at scale. IEEE Transactions on Parallel and Distributed Systems, 30(12):2849–2865, 2019.
- [3] Sharon Choy, Bernard Wong, Gwendal Simon, and Catherine Rosenberg. The brewing storm in cloud gaming: A measurement study on cloud to end-user latency. In 2012 11th Annual Workshop on Network and Systems Support for Games (NetGames), pages 1–6. IEEE, 2012.
- [4] Yunhua Deng, Yusen Li, Ronald Seet, Xueyan Tang, and Wentong Cai. The server allocation problem for session-based multiplayer cloud gaming. IEEE Transactions on Multimedia, 20(5):1233–1245, 2017.
- [5] Yunhua Deng, Yusen Li, Xueyan Tang, and Wentong Cai. Server allocation for multiplayer cloud gaming. In Proceedings of the 24th ACM international conference on Multimedia, pages 918–927, 2016.
- [6] Godot Foundation. Godot engine - free and open source 2d and 3d game engine. https://godotengine.org/, 2024.
- [7] Game Asset Factory. Medieval houses modular vol 2. https://www.unrealengine.com/marketplace/en-US/item/96a5ab5b99ef4c1ab36a1bbc5a36074a, 2024.
- [8] Epic Games. Unreal engine: The most powerful real-time 3d creation platform. https://www.unrealengine.com, 2024.
- [9] Yongqiang Gao, Lin Wang, and Jiantao Zhou. Cost-efficient and quality of experience-aware provisioning of virtual machines for multiplayer cloud gaming in geographically distributed data centers. IEEE Access, 7:142574–142585, 2019.
- [10] Google. Webrtc, real-time communication for the web. https://webrtc.org/, 2024.
- [11] Philippe Graff, Xavier Marchal, Thibault Cholez, Stéphane Tuffin, Bertrand Mathieu, and Olivier Festor. An analysis of cloud gaming platforms behavior under different network constraints. In 2021 17th International Conference on Network and Service Management (CNSM), pages 551–557. IEEE, 2021.
- [12] Sergey Grizan, David Chu, Alec Wolman, and Roger Wattenhofer. djay: Enabling high-density multi-tenancy for cloud gaming servers with dynamic cost-benefit gpu load balancing. In Proceedings of the sixth ACM symposium on cloud computing, pages 58–70, 2015.
- [13] Haibing Guan, Jianguo Yao, Zhengwei Qi, and Runze Wang. Energy-efficient sla guarantees for virtualized gpu in cloud gaming. IEEE Transactions on Parallel and Distributed Systems, 26(9):2434–2443, 2014.
- [14] Alex Herrera. Nvidia grid: Graphics accelerated vdi with the visual performance of a workstation. Nvidia Corp, pages 1–18, 2014.
- [15] Stefan Holmer, H Lundin, G Carlucci, L De Cicco, and S Mascolo. A google congestion control algorithm for real-time communication on the world wide web. IETF Draft, June, 2015.
- [16] Hua-Jun Hong, Chih-Fan Hsu, Tsung-Han Tsai, Chun-Ying Huang, Kuan-Ta Chen, and Cheng-Hsin Hsu. Enabling adaptive cloud gaming in an open-source cloud gaming platform. IEEE Transactions on Circuits and Systems for Video Technology, 25(12):2078–2091, 2015.
- [17] iMatix. Zeromq, an open-source universal messaging library. https://zeromq.org/, 2024.
- [18] Yusen Li, Changjian Zhao, Xueyan Tang, Wentong Cai, Xiaoguang Liu, Gang Wang, and Xiaoli Gong. Towards minimizing resource usage with qos guarantee in cloud gaming. IEEE Transactions on Parallel and Distributed Systems, 32(2):426–440, 2020.
- [19] Margaret Kurniawan, Hiroshi Hara. What is frame rate? https://www.adobe.com/creativecloud/video/discover/frame-rate.html, 2024.
- [20] Microsoft. Xbox cloud gaming. https://www.xbox.com/en-us/play, 2024.
- [21] Nvidia Corporation. Geforce now - the next generation in cloud gaming. https://www.nvidia.com/en-us/geforce-now/, 2024.
- [22] Yen-Fu Ou, Zhan Ma, Tao Liu, and Yao Wang. Perceptual quality assessment of video considering both frame rate and quantization artifacts. IEEE Transactions on Circuits and Systems for Video Technology, 21(3):286–298, 2010.
- [23] Fabian Pedregosa, Gaël Varoquaux, Alexandre Gramfort, Vincent Michel, Bertrand Thirion, Olivier Grisel, Mathieu Blondel, Peter Prettenhofer, Ron Weiss, Vincent Dubourg, et al. Scikit-learn: Machine learning in python. the Journal of machine Learning research, 12:2825–2830, 2011.
- [24] Zhengwei Qi, Jianguo Yao, Chao Zhang, Miao Yu, Zhizhou Yang, and Haibing Guan. Vgris: Virtualized gpu resource isolation and scheduling in cloud gaming. ACM Transactions on Architecture and Code Optimization (TACO), 11(2):1–25, 2014.
- [25] Peter Reichl, Sebastian Egger, Raimund Schatz, and Alessandro D’Alconzo. The logarithmic nature of qoe and the role of the weber-fechner law in qoe assessment. In 2010 IEEE International Conference on Communications, pages 1–5. IEEE, 2010.
- [26] Saeed Shafiee Sabet, Steven Schmidt, Saman Zadtootaghaj, Babak Naderi, Carsten Griwodz, and Sebastian Möller. A latency compensation technique based on game characteristics to mitigate the influence of delay on cloud gaming quality of experience. In Proceedings of the 11th ACM Multimedia Systems Conference, pages 15–25, 2020.
- [27] Ryan Shea, Jiangchuan Liu, Edith C-H Ngai, and Yong Cui. Cloud gaming: architecture and performance. IEEE network, 27(4):16–21, 2013.
- [28] Ivan Slivar, Lea Skorin-Kapov, and Mirko Suznjevic. Qoe-aware resource allocation for multiple cloud gaming users sharing a bottleneck link. In 2019 22nd conference on innovation in clouds, internet and networks and workshops (ICIN), pages 118–123. IEEE, 2019.
- [29] Omar Soliman, Abdelmounaam Rezgui, Hamdy Soliman, and Najib Manea. Mobile cloud gaming: Issues and challenges. In International Conference on Mobile Web and Information Systems, pages 121–128. Springer, 2013.
- [30] StylArts. Stylized fantasy provencal. https://www.unrealengine.com/marketplace/en-US/item/f0f978cdc78348b5b5d0b1c5a11e6d53, 2024.
- [31] Gary J Sullivan, Jens-Rainer Ohm, Woo-Jin Han, and Thomas Wiegand. Overview of the high efficiency video coding (hevc) standard. IEEE Transactions on circuits and systems for video technology, 22(12):1649–1668, 2012.
- [32] Unity Technologies. Unity real-time development platform. https://unity.com, 2024.
- [33] Shaoxuan Wang and Sujit Dey. Adaptive mobile cloud computing to enable rich mobile multimedia applications. IEEE Transactions on Multimedia, 15(4):870–883, 2013.
- [34] Thomas Wiegand, Gary J Sullivan, Gisle Bjontegaard, and Ajay Luthra. Overview of the h. 264/avc video coding standard. IEEE Transactions on circuits and systems for video technology, 13(7):560–576, 2003.
- [35] Mehrdad Hosseinnejad Yami, Farhad Pakdaman, and Mahmoud Reza Hashemi. Sara-sdn: state aware resource allocation in sdn to improve qoe in cloud gaming. In Proceedings of the 25th ACM Workshop on Packet Video, pages 8–14, 2020.
- [36] Chao Zhang, Jianguo Yao, Zhengwei Qi, Miao Yu, and Haibing Guan. vgasa: Adaptive scheduling algorithm of virtualized gpu resource in cloud gaming. IEEE Transactions on Parallel and Distributed Systems, 25(11):3036–3045, 2013.
- [37] Qunshu Zhang and Xiaoxing Zhu. Under the hood: Meta’s cloud gaming infrastructure. https://engineering.fb.com/2022/06/09/web/cloud-gaming-infrastructure/, 2022.
- [38] Wei Zhang, Xiaofei Liao, Peng Li, Hai Jin, Li Lin, and Bing Bing Zhou. Fine-grained scheduling in cloud gaming on heterogeneous cpu-gpu clusters. IEEE Network, 32(1):172–178, 2017.
- [39] Youhui Zhang, Peng Qu, Jiang Cihang, and Weimin Zheng. A cloud gaming system based on user-level virtualization and its resource scheduling. IEEE Transactions on Parallel and Distributed Systems, 27(5):1239–1252, 2015.
- [40] Ioannis Katsavounidis Anush Moorthy Zhi Li, Anne Aaron and Megha Manohara. Toward a practical perceptual video quality metric. The Netflix Tech Blog, 6, 2016.