Stochastic Model of siRNA Endosomal Escape Mediated by Fusogenic Peptides in OVCAR-3
Abstract
Gene silencing via small interfering RNA (siRNA) represents a transformative tool in cancer therapy, offering specificity and reduced off-target effects compared to conventional treatments. A crucial step in siRNA-based therapies is endosomal escape, the release of siRNA from endosomes into the cytoplasm. Quantifying endosomal escape is challenging due to the dynamic nature of the process and limitations in imaging and analytical techniques. Traditional methods often rely on fluorescence intensity measurements or manual image processing, which are time-intensive and fail to capture continuous dynamics. This paper presents a novel computational framework that integrates automated image processing to analyze time-lapse fluorescent microscopy data of endosomal escape, hierarchical Bayesian inference, and stochastic simulations. Our method employs image segmentation techniques such as binary masks, Gaussian filters, and multichannel color quantification to extract precise spatial and temporal data from microscopy images. Using a hierarchical Bayesian approach, we estimate the parameters of a compartmental model that describes endosomal escape dynamics, accounting for variability over time. These parameters inform a Gillespie stochastic simulation algorithm, ensuring realistic simulations of siRNA release events over time. By combining these techniques, our framework provides a scalable and reproducible method for quantifying endosomal escape. The model captures uncertainty and variability in parameter estimation, and endosomal escape dynamics. Additionally, synthetic data generation allows researchers to validate experimental findings and explore alternative conditions without extensive laboratory work. This integrated approach not only improves the accuracy of endosomal escape quantification but also provides predictive insights for optimizing siRNA delivery systems and advancing gene therapy research.
I Introduction
Among the many gene therapy tools developed for RNA interference [1, 2, 3], small interfering RNA (siRNA) is a powerful tool for gene silencing of target messenger RNA in cancer cells [4, 5, 6, 7, 8, 9, 10, 11, 12, 13]; oral cancer, brain cancer, ovarian cancer, breast cancer, and more. siRNA therapies can be designed to target specific cells, reducing unintended impacts on healthy cells and tissues [7, 14, 15, 16]. In cancer studies where drug resistance prevents the efficacy of cancer treatments, siRNA can target and silence genes responsible for this resistance, making existing treatments more effective. Effective gene silencing relies on endosomal escape, the release of siRNA from the endosome to the cytosol. Consequently, successful delivery of siRNA allows for the targeting and silencing of specific genes that are causing or contributing to a disease [17, 18, 10, 19, 20, 21, 22]. siRNA cancer therapies open up new possibilities for treating various conditions that were previously difficult to manage with conventional drugs.
Nanotechnology-based approaches have shown promise in the targeted delivery of siRNA for cancer treatment. However, siRNA delivery faces challenges such as poor intracellular trafficking, degradation, off-target effects, and toxicity. Many types of nanocarriers, including liposomes, dendrimers, and micelle-based nanovectors, have been explored for siRNA delivery. With a focus on improving permeation into cells and reducing off-target effects, the developed nanocarriers overcome such limitations and enhance siRNA delivery to tumor sites [16, 23, 24, 3, 25, 15, 17, 18]. Additionally, combining siRNA with anti-cancer drugs can have synergistic effects, making them a significant tool in cancer therapy [13]. Overall, nanotechnology-based siRNA delivery holds prospects for improving cancer treatment, but challenges such as delivery optimization and overcoming resistance need to be addressed.
Peptides are utilized as nanocarriers for siRNA delivery due to their cytocompatibility, affordability, and tunability for specific applications [26]. These peptides offer functional advantages, enabling them to overcome various barriers associated with delivery, including a significant delivery barrier within gene therapy treatment: endosomal entrapment [27]. Typically, nanocarriers and their cargo are internalized into the cell through endocytosis, enclosed in an endosome vesicle. If the cargo remains trapped within the endosome, it will be cycled out of the cell, preventing effective delivery. Therefore, delivery systems must promote endosomal escape to release their cargo into the cytoplasm, where it can be bioactive [28]. Fusogenic peptides, a class of stimuli-responsive sequences, are pH-dependent and can facilitate endosomal escape in response to the acidic pH within the endosome [29, 30]. After endocytosis, these peptides undergo a conformational change, typically to a helical secondary structure, allowing them to insert into the endosomal membrane to enable and promote cargo release [29, 30]. Previous research has characterized the DIV3W peptide as an established fusogenic peptide that promotes endosomal escape of siRNA in ovarian cancer cells, facilitating oncogene silencing both in vitro and in vivo [31]. Fluorescent microscopy confirmed that DIV3W internalization occurs through endocytosis, and it enables escape, demonstrated through the investigation of colocalization of tagged siRNA and endosomes. However, this data was collected at a 4-hour endpoint time frame and lacked quantification analysis.
In many studies of endosomal escape, the verification and quantification of successful escape relies on the fluorescence intensities of labeled nanoparticles or organelles [32, 20, 33, 34, 35, 36, 37, 38, 39, 40, 41], in vivo and in vitro. There has been a focus on improving these techniques by improving the fluorescent methods, assays, agents, and quantities used for fluorescent labeling [42, 43, 44]. In [45], fluorescence intensities of single vesicles were measured over 24 hours to quantify drug-indiced endosomal escape of siRNA, as well as the associated knockdown of genes expressed in tumor cells. In [44], in vitro experiments measured the fluorescence intensity of the uptake process, endosomal escape, and delivery of siRNA over 4 hour time periods. Notably, the authors in [46], use cytosol masks, cell masks, and signal-to-noise decreasing image filters to quantify the siRNA fluorescence intensities measured in individual tracked cells over 700 minutes, where one image was captured every 5 minutes. Based on the siRNA release properties, constant release, and sequential release, CellProfiler [47] was used to quantify the fluorescence in each cell over time. The model for fluorescence intensity increase over time was determined by fitting a curve through the acquired quantities over time. The authors in [48] use a variety of assays to measure nanoparticle uptake (occurring after 15-30 minutes), endosomal escape (occurring after about 1 hour), and delivery expression up to 4 hours using fluorescence intensities, where images were captured every 15 minutes.
Instead of relying on the fluorescent intensity level of labeled siRNA and endosomes, we aim to quantify the pixels of the color channel for each labeled object present in fluorescent multichannel cellular images that are captured over multiple hours. In previous studies, the authors show that each object can be identified by an image color channel. In some cases, only two color channels are used to differentiate between the nucleus and fluorescent organelles or particles, for which a spot count is used to quantify the amount of endosomal escape in an image [49, 50, 25, 51]. In other work, colocalization, the step at which particles or siRNA are not yet released from the endosomes or lysosomes, is shown as the overlap of multiple color channels when there exist three or more color channels [38, 52, 53]. In either case, the authors rely on images taken at time steps, 0 hours, 1 hour, 2 hours, and 4 hours which do not capture the continuous release from the endosomes between those time steps. In [54], the authors quantify endosomal escape by fluorescence intensity over a time-lapse. We follow the concept of three color channels in our categorization of the stages of endosomal escape over a continuous time-lapse of fluorescent images.
Image segmentation techniques are used to partition images into categories based on the characteristics of their pixels. These techniques can be used to track the movement of clusters of cells [55], track cell division of a group of neighboring cells [56], study the shape or type of cell [57], locate cell nuclei [58], and count the number of cells present in a single, two or three dimensional microscopy image [59]. Thresholding is an important feature of image segmentation, which focuses on separating the foreground objects from the background of an image and separating the foreground objects by their pixel characteristics. The OTSU method [60] is a widely used technique for automatic image thresholding. It maximizes the variance between the foreground and background classes. Specifically, the OTSU method calculates the optimal threshold value by minimizing the variance within the class (the variance of each class) or equivalently maximizing the variance between classes. This is achieved through an exhaustive search over all possible threshold values to find the one that best separates the two classes.
Our approach significantly advances the study of endosomal escape by providing a comprehensive framework for data acquisition, image analysis, and time-lapse visualization. Unlike the [61], which relies on discrete fluorescence intensity measurements prone to noise, we utilize high-resolution time-lapse imaging over 4 hours, offering continuous tracking of endosomal escape dynamics. Our automated image analysis pipeline efficiently processes raw fluorescent microscopy data, removing background noise and floating siRNA to ensure accurate, reproducible, and reliable quantification. This streamlined approach not only reduces labor-intensive manual processing time but also enhances reproducibility. We incorporate stochastic modeling to reflect the probabilistic nature of events. Additionally, synthetic data generation addresses data scarcity, ensuring robust validation of experimental results. This combination of advanced techniques ensures a more detailed, scalable, and predictive analysis compared to traditional fluorescence-based methods.
In this paper, we introduce a novel model designed for efficient image analysis and synthetic data generation to address the scarcity of experimental data in studying endosomal escape dynamics over time. The raw data comprised of fluorescent microscopy images, which are inherently noisy because of background fluorescence and floating siRNA outside cells (as this is live-cell imaging). Our model executes the following steps:
-
1.
Background Noise Removal: Eliminate unwanted fluorescence signals that obscure cellular information.
-
2.
Floating siRNA Removal: Remove siRNA signals outside of cells, isolating intracellular activity.
-
3.
Information Extraction: Utilize pixel intensity data from red, green, and blue channels to quantify key metrics related to endosomal escape.
-
4.
Synthetic Data Generation: Generate synthetic data that mimic experimental data, enabling robust studies even with limited lab-generated data.
The first two steps, background noise removal and floating siRNA removal are the most labor-intensive when performed manually in a lab setting. For example:
-
•
Step 1: Manually editing background noise in 40 images requires approximately 4 to 4.5 hours.
-
•
Step 2: Manually removing floating siRNA requires an additional 5 to 6 hours.
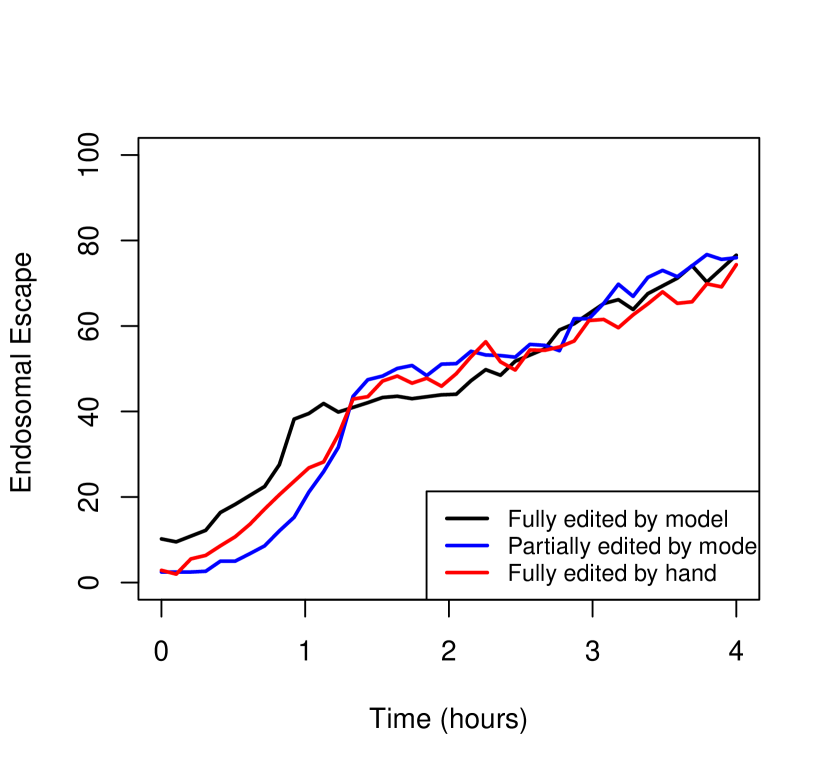
In contrast, our model significantly reduces this time burden, as illustrated in Figure 1:
-
•
The red curve represents experiments where both steps are performed manually, requiring 9 – 11 hours.
-
•
The blue curve shows experiments where step 1 is performed manually and step 2 is automated, reducing the time to 4–4.5 hours.
-
•
The black curve represents experiments where both steps are fully automated by the model, completing the entire process in just 50–55 seconds.
This efficiency allows experimentalists to save significant time in image analysis while maintaining data quality. Additionally, the ability to generate synthetic data further addresses the challenges of data scarcity in experimental studies, enabling a more comprehensive analysis of endosomal escape dynamics.
Compartmental models have been used in many applications, such as epidemiology, pharmacokinetics, systems biology, and neuroscience [62, 63, 64]. In this work, we focus on representing the three main stages of endosomal escape; 1) endocytosis (uptake), 2) endosomal entrapment, and 3) endosomal escape [25] as a compartmental model, a parameterized system of equations used to model interactions between compartments over time. We use the compartmental model to generate synthetic data of endosomal escape over time by way of the stochastic simulation algorithm [65, 66], allowing us to capture the stochastic nature of fluorescent siRNA release over a 4-hour period. Additionally, we provide a method to validate the accuracy of the synthetic data by using error optimization and sensitivity analysis for measuring the plausibility of the rate parameters associated with the population fluctuations for each model compartment.
II Experimental Methods

II.1 Cell Culture
Ovarian cancer, OVCAR-3, cells were obtained from American Type Culture Collection (ATCC, Manassas, VA, USA) and cultured in RPMI Media supplemented with 20% fetal bovine serum, 1% penicillin/streptomycin antibiotic solution, and 0.1% insulin (Corning, Corning, NY, USA). All cultures were incubated at C and 5% CO2.
II.2 Peptide Synthesis
DIV3W peptide (WEADIVADIVWDIVADIVAGGG-(d)RRRRRRRRR) was synthesized, purified (% purity), and analyzed via high-performance liquid chromatography by Lifetein (Lifetein LLC, Somerset, NJ, USA). Lyophilized peptide was resuspended in ultrapure to a 10 mg/mL stock solution. Working solutions were made at 1 mg/mL with a dilution of stock peptide and RNase-free water. All peptide solutions were stored at C.
II.3 Peptide-siRNA Complex Formation
All peptides were complexed with 10 siGENOME non-targeting siRNA#5 (siNT#5)-Cy5 fluorescently tagged (GE Healthcare Dharmacon, Lafayette, CO, USA) through electrostatic complexation in RNase-free water for 20 minutes at room temperature. Peptide complexes were made at an N:P (peptide:siRNA) ratio to perform in vitro experiments to investigate the dynamics of endosomal escape. For each experiment, siRNA was added with peptide to prepare the samples. All results and analyses presented in this paper are based on this specific ratio.
III Live Cell Imaging
OVCAR-3 cells were seeded at 10,000 cells/well and cultured in a 96-well plate overnight. The next day, fresh media was added to the cells, along with 15 of CellLight Early Endosome-GFP-BacMam 2.0, to label the endosomes fluorescently (Thermo Fisher, Waltham, MA, USA). After overnight incubation, the media was changed and BacMam 2.0 enhancer was added for 90 minutes, media was changed, and cells were left to incubate overnight. All incubation steps were done at C and in 5% . The next day, DIV3W peptide was complexed with siNT#5-Cy5 at ratio and Hoescht 33342 stain was added to the cells to stain the nuclei. Complexes and nuclei stain were added in 10% transfection media, and live cells were imaged for 4 hours using the Stage Incubator of the BZ X800 at 40X magnification (Keyence, Itasca, IL, USA). We began capturing Images 30 minutes after complexes were added and at every 5 minutes within this time frame.
IV Methods
IV.1 Image Analysis
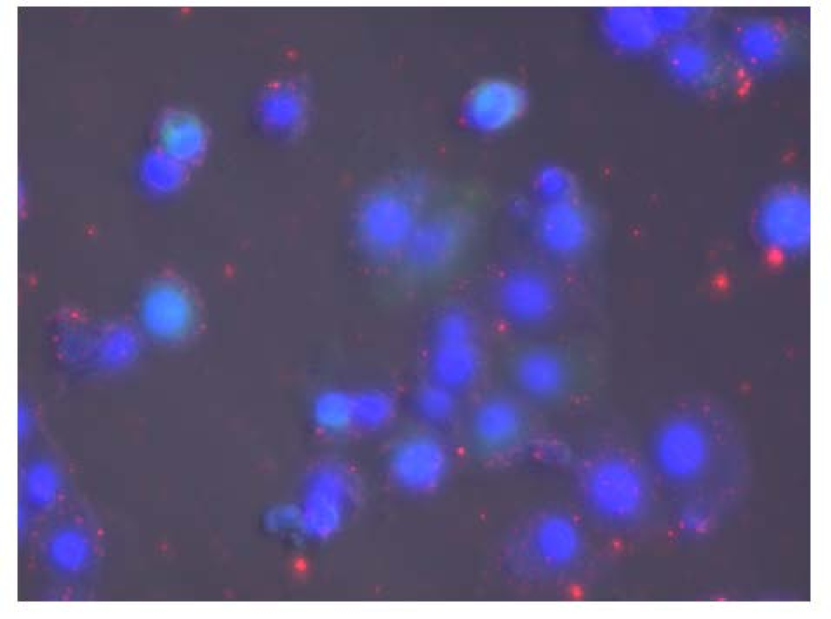
In this paper, we implemented a computational image analysis approach to quantify the endosomal escape of siRNA using fusogenic peptides. This method involves the processing of high-resolution TIF files of fluorescent microscopy images obtained during experiments detailed in Section II. The cell images contain pixel color channels: red (corresponding to siRNA), green (corresponding to endosomes), and blue (corresponding to cell nuclei).
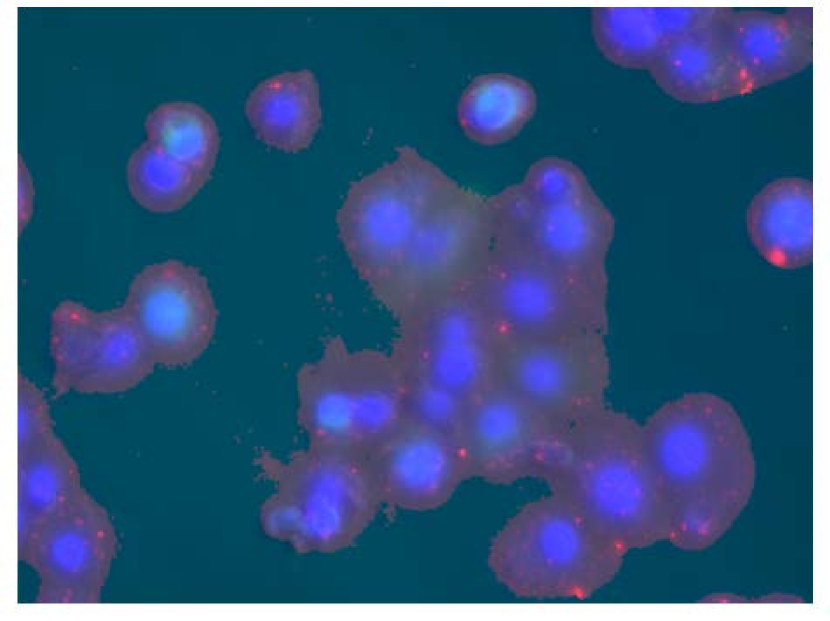
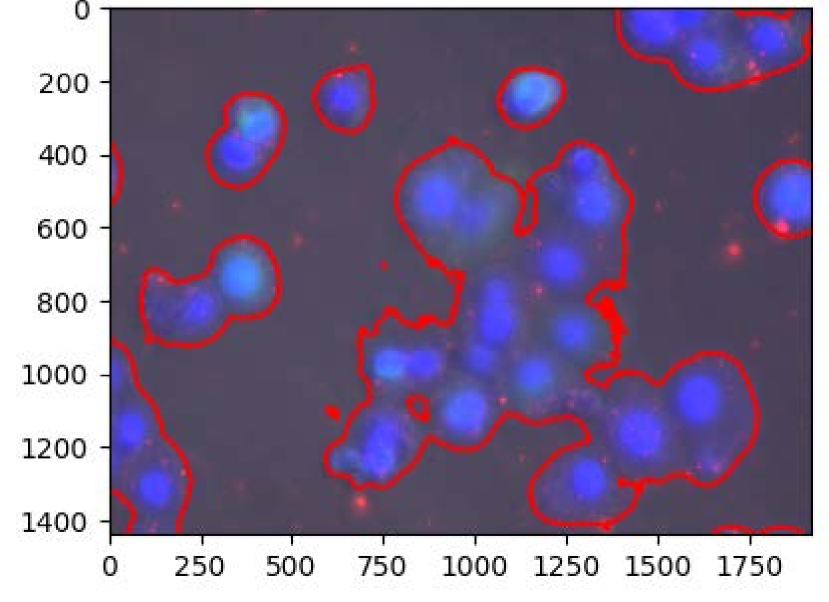
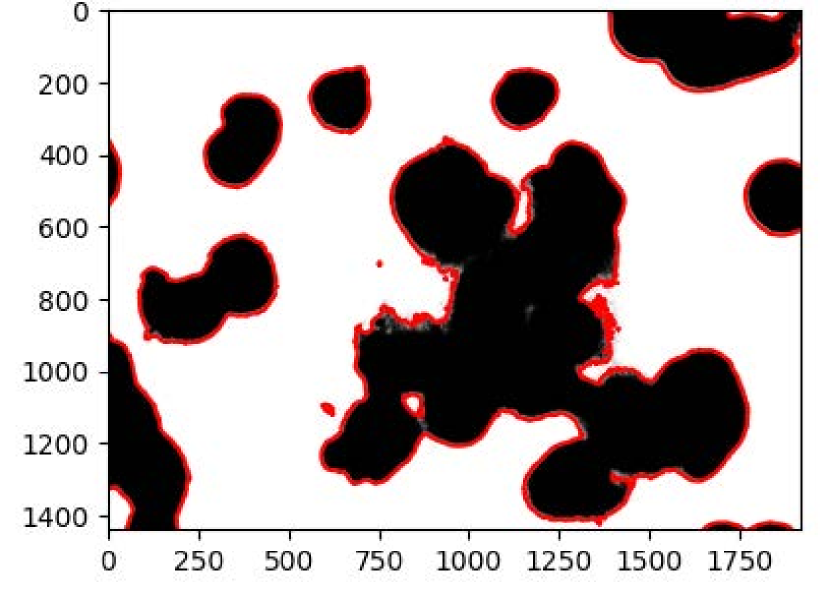
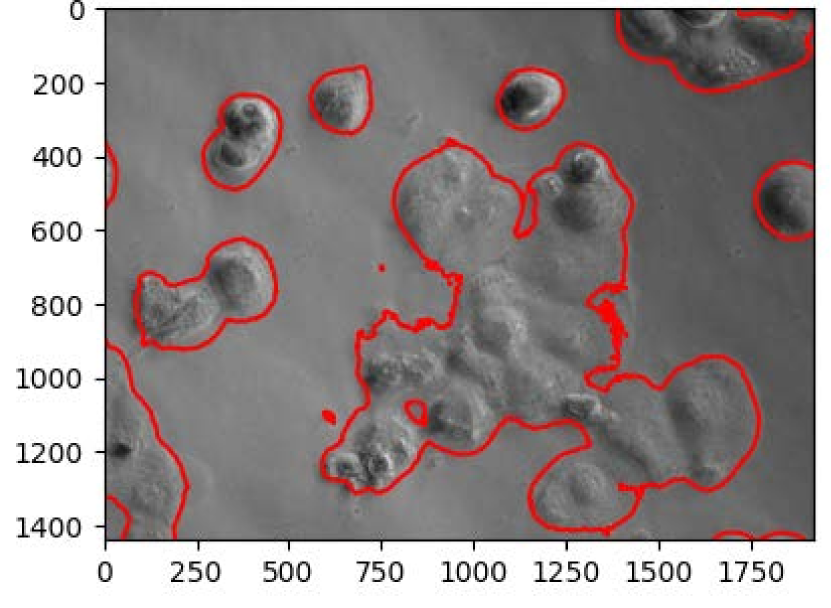
Each petri dish contains multiple cells. To locate the general locations of the individual cells, a user-defined threshold is applied to create a binary mask to capture the blue channel (nuclei) in the image in Figure 2(b). The binary mask is generated where the pixel intensities in the blue channel exceed the threshold. This mask overlaps with the cellular structure present in the fluorescent microscopy images in Figure 3(a). The mask boundaries are outlined in red in Figure 3(b) which is used to segment the original image in Figure 2(c). The interactive tool, ipywidgets [67], is then used to allow fine-tuning of the threshold and Gaussian smoothing parameters. Users can visually adjust the quality of the mask to ensure that it accurately represents the desired regions. The generated mask is used to filter the cellular region of the image. Only pixels corresponding to the inside of the regions defined by the mask are retained, while other regions are set to zero, which implies the removal of floating siRNA as shown in Figure 2(c). Additionally, we overlay the mask on the original image to verify that we are masking the petri dish’s regions containing cells and their perceived cell membrane. We verify the mask accuracy using the phase image in Figure 3(c).
The resulting masked image contains the cells, their nuclei, and siRNA only within the cell membrane, i.e. removing all floating siRNA. We use the masked images to quantify endosomal escape over a period of 4 hours and treat these values as our experimental data. Using OTSU’s method [60], we differentiate between each color channel by creating binary masks to count the red, green, and blue pixels. These masks enable the identification of areas where only the red pixel is present in the cell membrane or where the red and green pixels overlap. The latter case implies that siRNA are contained in the endosome.
In Figure 2(a), the blue color denotes nuclei, the red color outside of the green color denotes endosomal escape of siRNA, green denotes the endosome, and overlapping red and green denotes the co-localization of siRNA and endosome (i.e. endosomal escape has not occurred). The primary outcome measure is the percentage of pixels representing endosomal escape, computed by dividing the number of red pixels outside endosome(green pixels) by the total number of red pixels within the cells. This metric provides a quantitative measure of endosomal escape based on the pixel counts of fluorescent microscopy images.
IV.2 Data Analysis
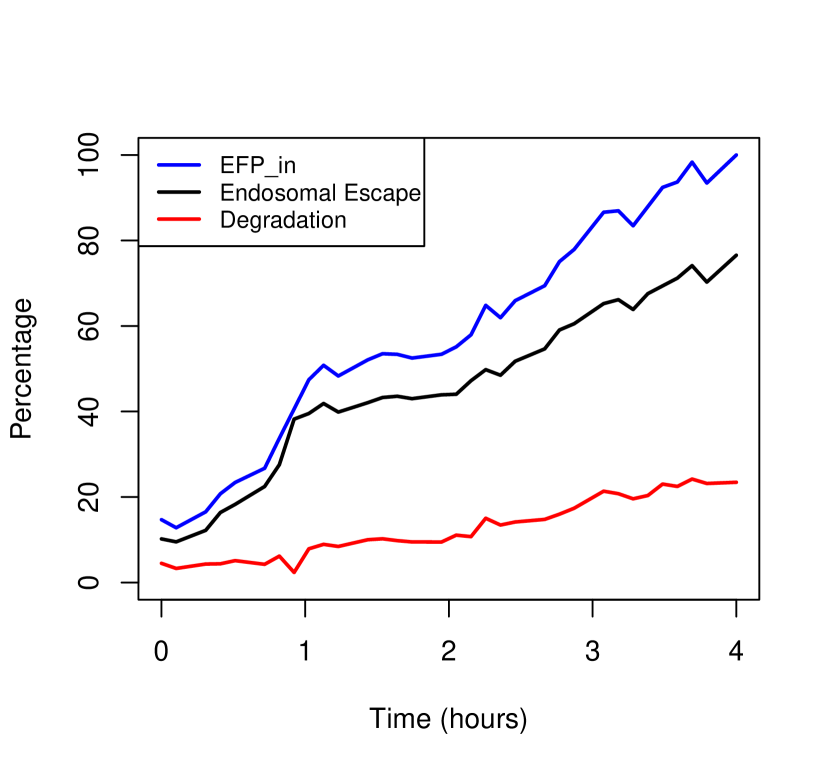
We implement the method proposed in Section IV.1 to compute the percentage of pixels in a series of 40 frames, where one frame is captured every 5 minutes. Figure 4 shows the extracted experimental data describing the endosomal escape percentage in each image from time to hours. We define cellular uptake (), siRNA entering the cell, as the total number of red pixels (siRNA) at time . Over time, this is denoted by the blue curve. Endosomal escape () is denoted by the black curve. Degradation is represented by the difference between and , indicating the amount of siRNA that is unable to escape from the endosome at a given time t, as shown by the red curve. The time series data indicates a positive correlation between the ratio of peptides used and the percentage of endosomal escape, suggesting that prolonged exposure to peptides enhances the efficiency of siRNA delivery.
Endosomal escape is an inherently random biological process. Following cellular uptake, endosomes move dynamically within the cell, internalizing nearby particles, including our peptide-siRNA complexes. However, it remains unclear how long each endosome takes to internalize all incoming particles or which endosomes will encapsulate specific peptide-siRNA complexes. This randomness influences the process of endosomal escape, which depends on the duration of particles remaining within the endosome. Consequently, siRNA release occurs unpredictably across cells and over varying time intervals.
To account for this inherent randomness, we employ stochastic compartmental models, which capture the variability in endosomal escape across the numerous endosomes present in the many cells within the petri dish. The use of stochastic simulation algorithms is particularly advantageous, as they model the random interactions between compartments and their effects on the changes in compartment populations.
IV.3 Simulation Methods
The stochastic simulation algorithm (SSA) is traditionally used to model chemical reaction systems in cellular and molecular biology [66, 65, 68, 69, 70, 71, 72]. More specifically, these systems model the time evolution of populations of molecules with respect to their interactions at infinitesimal time intervals. In this work, we use the SSA framework developed by Daniel T. Gillespie in the 1970s [73] to model the percentage of endosomal escape over a 4-hour time period. The SSA is particularly useful for this system because of the discrete behavior of the individual intracellular organelles and particles. The SSA allows us to take into account the intrinsic unpredictability of these interactions. The algorithm simulates each reaction event on a probabilistic basis by first determining when the next reaction will occur (exponentially distributed) and then deciding which reaction will take place. These are determined by the relative propensity of each reaction in our system, i.e. the propensity function represents the likelihood of each reaction occurring at a given moment, given the current state of the system.
For this work, we treat the pixels as molecules and the reactions to be compartment-location-based transitions of the pixels over time. Let the compartments be defined as (fusogenic peptides), (siRNA), (siRNA and fusogenic peptides encapsulated inside the endosome), (endosome degradation), and (endosomal escape). Note that the compartment represents the initial state of the small interfering RNA molecules involved in the reaction, represents the early stage of uptake of by endosome using the fusogenic peptides, represents the that escape the endosome, and represents the amount of trapped inside the endosome and eventually degrades. The reaction system is defined by the following reactions:
| (1) | ||||
| (2) | ||||
| (3) | ||||
| (4) |
It is important to understand that reaction (1) represents the interaction of fusogenic peptides with and is the rate at which the combination is taken up by the endosome. Reaction (2) refers to the scenario when no fusogenic peptides are present, hence the uptake is bare minimum. This reaction relies on , which is set to zero in our simulations because we know that peptides are present in our experiments. This reaction can be used to generate a base simulation. Reaction (3) models the release of from , denoted by EE, where is the rate of release. Reaction (4) models the rate at which degrades.
Experimentally, as detailed in Section II, the ovarian cancer cells are incubated with a ratio of fusogenic peptides and siRNA; i.e. each well in a 96 well plate contains of siRNA and of fusogenic peptides (FP). Equation (5) denotes the ratio of peptides to ,
| (5) |
hence the numerical ratio for this work is 6.891.
Let the initial conditions for each compartment be defined by the vector,
| FP | siRNA | EFPin | EE | EFPout |
|---|---|---|---|---|
where Ratio is defined based on Equation (5). Since and denote the cellular uptake and endosomal escape percentages, we let the initial conditions be determined by the experimental data at time . Let the initial quantity of be ; thus each initial compartment amount will be multiplied by . Let the initial condition for . In this work, we assume that the rate parameter for reaction (2) is . That is, does not degrade on its own since they are within a peptide-siRNA complex. In Section V, we detail the process for inferring the distribution of the rate parameters , and in reactions (1), (3) and (4), respectively.
V Inference Methods and Simulations
V.1 Parameter Inference
The reaction rates of a biochemical reaction network are of utmost importance. In this work, the experimental data shows that the population of each compartment is not constant over time. Due to the natural random release of siRNA into the cytosol of each cell, we assume that the rates fluctuate at each time point. To account for variable reaction rates over time, we must estimate the rate of change with respect to the associated propensity function that is computed at each time step in the SSA. In [74], the authors describe estimating varying reaction rates using Bayesian computation, where they solve the inverse problem of choosing the best-fit reaction rates for the system.
Let be the experimental observations at time points , where . (Recall that the fluorescent images are captured every minutes from time to hours.) X denotes the vector containing components
and . That is, , and are rates of change for each time step of the experimental data.
PyMC [75] is a Python library for probabilistic programming that enables users to construct and analyze Bayesian statistical models. It provides a suite of modern Bayesian tools for model specification, fitting, and diagnostics. PyMC implements advanced Markov Chain Monte Carlo (MCMC) algorithms for sampling from a posterior distributions.
We use a hierarchical Bayesian approach that estimates the reaction rate for the selected reaction at each time step. This approach builds a statistical model of the experimental endosomal escape data by splitting the inference into steps based on conditional distributions. First, we define the global hyperpriors ( and ) for each of the reaction rates, representing the overall trend for each rate over all time steps. Let the global hyperpriors for and be Cauchy distributed, each fit using fitdistr in the R package MASS used for fitting probability distributions. That is and . Let be fit using a normal distribution. That is . Then we define the local priors for each time step to be normally distributed with a small standard deviation () = () around the sampled global hyperpriors; , , and . The likelihood functions for each parameter are defined as
where = () are small standard deviations about the mean.
Thus the joint likelihood function is then defined as
PyMC then uses a Markov Chain Monte Carlo (MCMC) sampling algorithm to estimate the posterior distributions of all the parameters. We implement 2000 samples with an additional 1000 to tuning iterations to adjust the sampling algorithm and run 5 independent sampling chains to validate the posterior estimates. Algorithm V.1 lists the steps in a concise manner.
PyMC Posterior Model
We compute the posterior distributions for each of the parameters , , and at each time step and let the posterior mean at each time step be the estimate for the rate. To generate sample paths using the SSA, we use the estimated rate at each time step of the associated reaction. The posterior distributions for the inferred parameters at each time step are shown in Figure 9 in the Appendix.
V.2 Simulating Realizations of the SSA
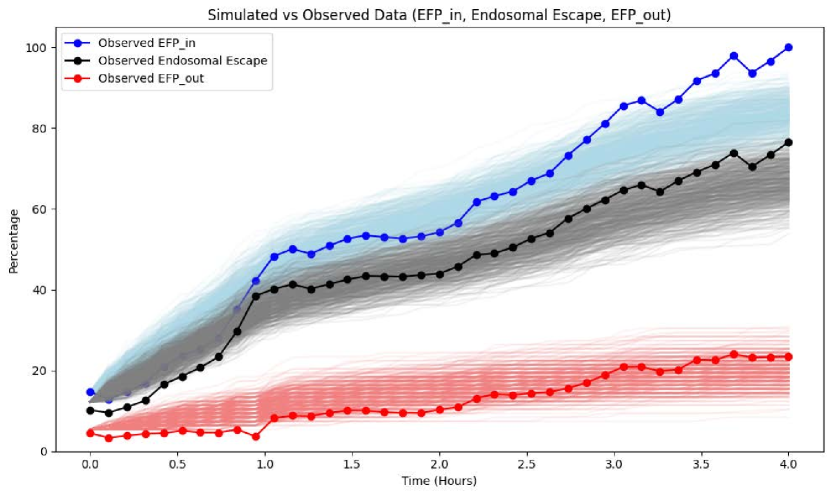
We use the posterior means for each time step as the reaction rates , , and , along with the initial conditions in Section IV.3 to simulate realizations of each component using the SSA [66]. Figure 5 displays 1000 realizations of the SSA for (light blue curves), (gray curves), and (light red curves) compared to the experimental data for each component, blue, black, and red, respectively.
V.3 Error Optimization
We apply an error optimization technique to minimize the error between experimental and simulated data, seeking to represent the experimental data as closely as possible. This is achieved by optimizing the model parameters , and which are sampled from the posteriors as detailed in Section V.1. After running 1000 SSA simulations using the inferred parameter distributions for , , and , as well as the initial conditions, the error optimization process averages these simulations to generate a representative trajectory for the endosomal escape percentage.
Error Optimization Algorithm for Parameter Selection
| Error Metric | Value |
|---|---|
| Mean Absolute Percentage Error (MAPE) | 7.5613 |
| Symmetric Mean Absolute Percentage Error (sMAPE) | 6.0491 |
| Mean Absolute Error (MAE) | 2.917 |
| Mean-Squared Error (MSE) | 13.3665 |
| Root Mean-Squared Error (RMSE) | 3.6552 |
The pseudocode for the parameter optimization process is detailed in Algorithm V.3. We systematically explore different combinations of the parameters , , and from their respective parameter grids, denoted as . Each parameter grid contains 250 random samples from the posterior distribution of each of the parameters. We select one value from each of the parameter grids and use the SSA model to simulate endosomal escape. The resulting simulation data is compared to the experimental data using five error metrics: Mean Absolute Percentage Error (MAPE), Symmetric Mean Absolute Percentage Error (sMAPE), Mean Absolute Error (MAE), Mean-Squared Error (MSE), Root Mean-Squared Error (RMSE). The algorithm tracks the best set of parameters by identifying the combination that minimizes the error. The error metrics used in the parameter optimization process (Algorithm V.3) are summarized in Table 2. These metrics are crucial for assessing the accuracy of simulated data compared to experimental results. They quantify the variances between the two datasets, enabling the identification of optimal parameters that minimize error in the SSA simulations.
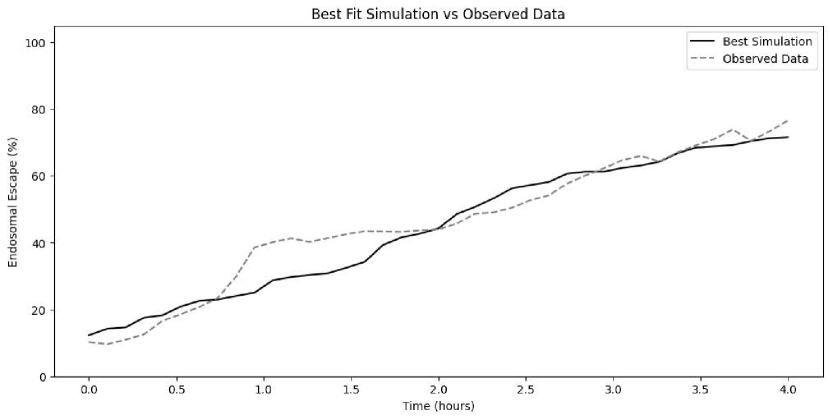
Once the optimal parameters are found, they are used to run a final simulation in Figure 6, to show the accuracy of the model simulations compared to the experimental data. This approach ensures that the model closely aligns with the experimental data by identifying the optimal parameters for simulating endosomal escape. This leads to a more accurate modeling of the experimental system.
VI Sensitivity Analysis
Given the variability in the model’s estimated rate parameters, we perform a sensitivity analysis to assess how selecting different parameters influences the results in each system compartment. It is also important to note that the parameters are estimated per time step. Thus, the sensitivity analysis should follow suit, measuring the effects of making small and large changes to the estimated parameters at each time step.
We conduct the sensitivity analysis of the model parameters (, , ) using the Sobol [76] and Fourier Amplitude Sensitivity Test (FAST) methods applied to the simulated data [77]. These tests are employed to determine which parameters most substantially affect the model’s output, with a particular emphasis on the predicted endosomal escape percentage. The visual results of the sensitivity analysis methods are presented in Figure 7 and 8.
VI.1 Time-Dependent Sensitivity Analysis
The time-dependent sensitivity analysis provides valuable insights into the relative importance of the model parameters and how their influence evolves over time. Such an analysis is crucial for guiding experimental design and model refinement, particularly in optimizing parameters to improve the accuracy and robustness of simulations for endosomal escape.
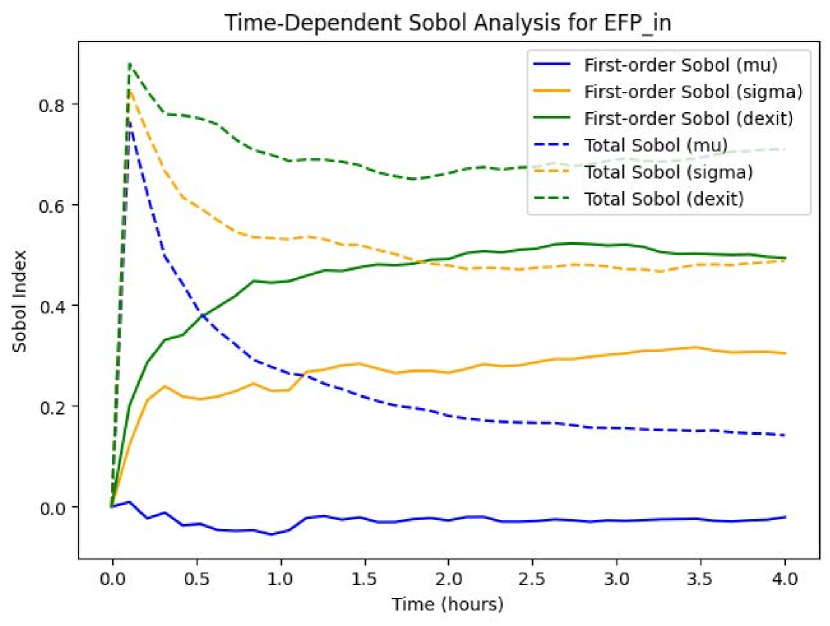
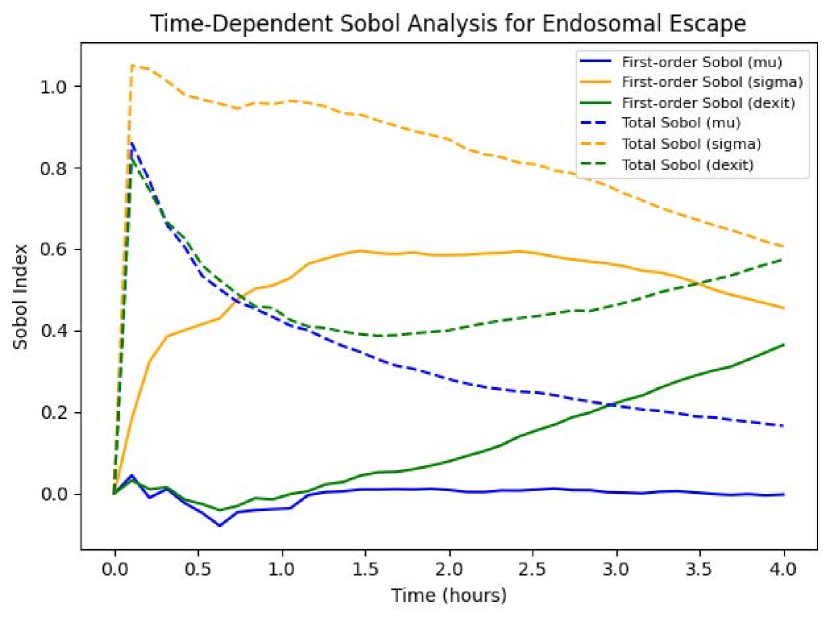
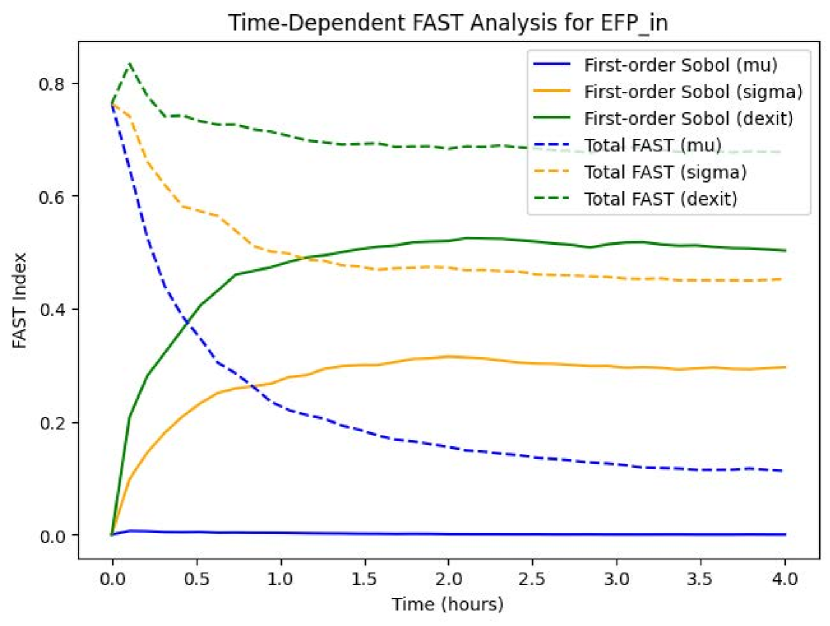
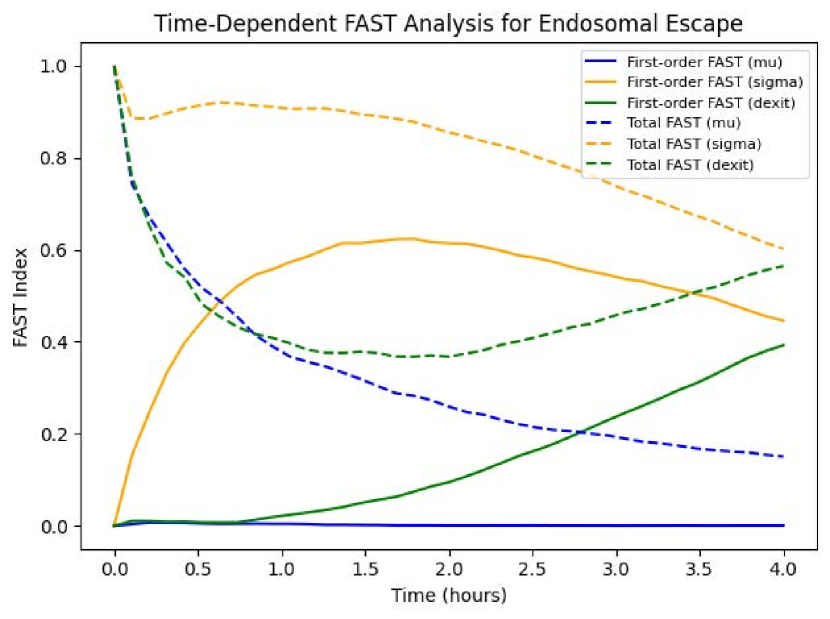
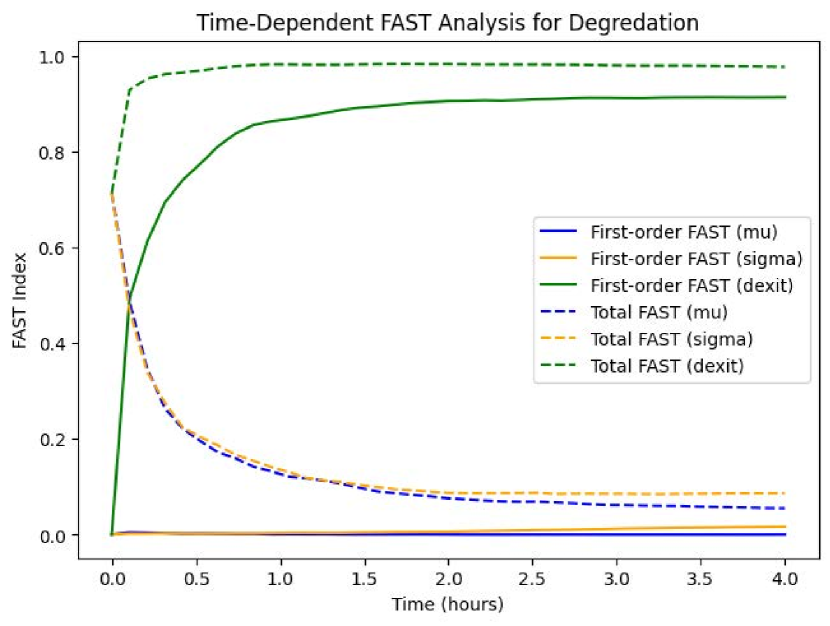
Figure 7 and 8 illustrate the results of Sobol [76] and FAST sensitivity analysis [77], respectively, applied to the time evolution of the system’s behavior. Each focuses on the dynamics of , , and over a simulation period of 4 hours. This analysis was performed to identify the influence of three key model parameters , , and on the variance of the system’s output. The Sobol and FAST index values are plotted over time to hours. It is important to note that the Sobol and FAST sensitivity indices fall within the range of 0 to 1, where values near 0 indicate minimal influence on the system’s output and values near 1 signify a significant influence on the system’s output. If any of the curves surpasses 1 it means it is affected by interactions with other parameters. These indices quantify the contributions that each parameter has on the variance of the output. First-order Sobol/FAST indices (S1) measure the independent contribution of a parameter. Total Sobol/FAST indices (ST) account for the combined effects of a parameter, including interactions with other parameters. Parameters and are distinguished using separate colors, blue, orange, and green, respectively. The solid lines represent first-order indices (S1) and the dashed lines represent total indices (ST).
The time-dependent Sobol and FAST sensitivity analysis reveals distinct dynamics for the three outputs: , Endosomal Escape, and Degradation. We observed that the Sobol and FAST sensitivity analysis graphs exhibit very similar patterns, which strongly supports the conclusion of a significant relationship between the parameters and the output. For in Figures 7(a) and 8(a), the parameter is the dominant contributor during the entire 4 hours time period, with a total Sobol index () between 0.6 and 0.8, highlighting its critical role in the system’s dynamics as a whole. In contrast, for Endosomal Escape in Figures 7(b) and 8(b), the parameter is the dominant contributor during the entire 4 hours time period, with a total Sobol index () between 1 and 0.6, highlighting its critical role in the system’s Endosomal Escape dynamics as a whole. Interestingly, both the First-order and Total Sobol indices for and are about the same until after hour 1.5 suggests that these parameters contribute primarily as independent (non-interacting) effects on the model output within this timeframe. For Degradation in Figures 7(c) and 8(c), the parameter exhibits consistently high sensitivity across all time phases, particularly dominating the early and late phases, with and having moderate influence in the initial 0.5 hour.
The parameter , while crucial for Endosomal Escape, has a lesser impact on and even lesser impact on Degradation, emphasizing the distinct roles these parameters play in different outputs. This comparison underscores the importance of in the first 2 hours, while drives the key dynamics of and Degradation. These insights provide valuable guidance for parameter tuning and optimization in cellular system modeling.
VII Discussion
Endosomal escape remains a major barrier to nanotechnology delivery of nucleic acid cargo, and therefore, it is extensively studied in research. This mathematical framework can be used to support these investigations and quantify the endosomal escape of siRNA through peptide-based delivery. Current methods for analyzing endosomal escape typically rely on qualitative analysis of fluorescent images and end-point assays. We build off these limitations to design a reproducible model that tracks endosomal escape dynamics and predicts the endosomal escape efficiency of peptide-based carriers, streamlining the design and experimental process. Therefore, this model will provide a better indication of the escape capability of carriers in vitro, which will improve the translation of these nanotechnologies into in vivo studies and clinically, helping to further the gene therapy delivery field.
In this work, we developed a comprehensive framework that 1) utilizes image processing techniques to automate the extraction of pixel data related to endosomal escape from time-series fluorescent microscopy images, 2) estimates the rate of endosomal escape over time using Bayesian approaches, and 3) simulates synthetic data that replicates the experimentally collected endosomal escape data. Note that previous computational endosomal escape methods relied on only the fluorescence intensity of the labeled particle over time. Our method improves on this methodology by incorporating experimental factors into the model and instead counting the fluorescent pixels that are associated with each particle.
This model allows users to generate synthetic data by inputting experimental parameters. By validating the synthetic data against experimental results, researchers can ensure the model accurately reflects observed behavior. Once validated, the model enables experimentalists to predict endosomal escape outcomes under different conditions without conducting additional experiments. For example, users can explore how the percentage of endosomal escape changes over extended periods (e.g., 8 or 10 hours) or evaluate the effects of altering initial siRNA and peptide ratios. By simply adjusting the simulation parameters, the model provides insights into how varying experimental conditions influence endosomal escape, reducing the need for additional costly and time-consuming experiments.
VII.1 Model Limitations
The Bayesian inference component of our framework is adaptable, allowing users to adjust it based on their collected experimental data. Because the model employs a hierarchical structure, the global hyperpriors must be fitted to the experimental data; however, this process needs to be performed only once. After validation, rate estimates are drawn from the posterior distributions, which naturally account for fluctuations in rate parameters. These fluctuations are further refined during the error optimization step, ensuring that the simulations closely align with the experimental data.
VII.2 Implications for Future Work
When dealing with multiple experiments, it is beneficial to apply Bayesian methods to all time-series datasets, estimating a unique set of parameters for each experimental condition. This approach enhances the model’s robustness, enabling it to accommodate varying siRNA-to-peptide ratios effectively. Incorporating machine learning methods can further extend the model’s capabilities by predicting endosomal escape percentages over time under different experimental conditions. While this adds an additional layer of complexity, it provides valuable insights for experimentalists, enabling more precise predictions and reducing the need for additional experiments.
There are a myriad of different image processing tools that can be employed to analyze fluorescent microscopy images of endosomal escape data. In this work, we utilized binary masks and Gaussian filters, but these methods can be updated or expanded upon based on the latest advancements in the literature.

For instance, other types of masks such as adaptive thresholding masks, edge-detection masks (e.g., Sobel or Canny), or region-growing masks can be applied to segment and analyze specific regions of interest within the images. These masks can help isolate distinct features like endosomes or fluorescently labeled siRNA more accurately, depending on the complexity and variability of the data.
Additionally, various image filters can be employed to enhance specific aspects of the microscopy images. Median filters are effective for reducing noise while preserving edges, whereas Laplacian filters can enhance edge detection to better delineate boundaries. High-pass filters can amplify small details, and band-pass filters can isolate features within a specific size range, allowing researchers to focus on relevant structures like endosomal vesicles. By tailoring the choice of masks and filters to the experimental requirements, the image processing pipeline can be fine-tuned to capture the critical elements of endosomal escape with greater precision.
VIII Acknowledgments
This research was supported by the Clemson University CU-Fellows faculty research support grant and
National Science Foundation Faculty Early Career Award Development Program Under NSF Award #204669.
IX Appendix
IX.1 Posterior Estimates for Reaction Rates: PyMC
The PyMC Python package V.1 generates a trace plot for each of the posterior distributions in the hierarchical Bayesian model detailed in Section V. The package allows the user to visualize the distribution of the posterior samples for each variable individually. The package also plots the sampled values for each variable across the iterations of the background Markov Chain Monte Carlo (MCMC) sampling algorithm. For the hierarchical model in this work, estimates the reaction rate for each each time step. Hence, the posterior distributions are denoted by each individual color. The posterior means of each distribution is used as the reaction rate at time step .
References
- Rossi [2 28] J. J. J. Rossi, Nature Reviews Genetics 8 (2007-02-28).
- Alexander-Bryant et al. [2013] A. A. Alexander-Bryant, W. S. Vanden Berg-Foels, and X. Wen, Advances in Cancer Research 118, 1 – 59 (2013), cited by: 81; All Open Access, Green Open Access.
- Deng et al. [2022] K. Deng, D. Yang, and Y. Zhou, Pharmaceutics 14, 10.3390/pharmaceutics14071344 (2022).
- Qin et al. [2013] B. Qin, Z. Chen, W. Jin, and K. Cheng, Journal of Controlled Release 172, 159 (2013).
- Karagiannis et al. [2012] E. D. Karagiannis, C. A. Alabi, and D. G. Anderson, ACS Nano 6, 8484 (2012), pMID: 23088785, https://doi.org/10.1021/nn304707b .
- Kim et al. [2010] S. W. Kim, N. Y. Kim, Y. B. Choi, S. H. Park, J. M. Yang, and S. Shin, Journal of Controlled Release 143, 335 (2010).
- Ozcan et al. [2015] G. Ozcan, B. Ozpolat, R. L. Coleman, A. K. Sood, and G. Lopez-Berestein, Advanced drug delivery reviews 87, 108 (2015).
- Goldberg [2013] M. S. Goldberg, Methods 63, 95 (2013), non-coding RNA Methods.
- Leng et al. [2009] Q. Leng, M. C. Woodle, P. Y. Lu, and A. J. Mixson, Drugs of the future 34, 721 (2009).
- Alexander-Bryant et al. [2017] A. A. Alexander-Bryant, H. Zhang, C. C. Attaway, W. Pugh, L. Eggart, R. M. Sansevere, L. M. Andino, L. Dinh, L. P. Cantini, and A. Jakymiw, Oral Oncology 72, 123 (2017).
- Teng et al. [2022] X.-Q. Teng, J. Qu, G.-H. Li, H.-H. Zhuang, and Q. Qu, Frontiers in Cell and Developmental Biology 10, 10.3389/fcell.2022.824299 (2022).
- Kalogeros et al. [2023] J. W. Kalogeros, A. Miserendino, A. Alexander-Bryant, and B. Booth, Cancer Research 83 (2023).
- Zou et al. [2023] Y. Zou, X. Sun, Y. Wang, C. Yan, Y. Liu, J. Li, D. Zhang, M. Zheng, R. S. Chung, and B. Shi, Advanced Materials 10.1002/adma.202300777 (2023).
- Gavrilov and Saltzman [2012] K. Gavrilov and W. M. Saltzman, Yale Journal of Biology and Medicine (2012).
- Goyal et al. [2022] R. Goyal, H. Chopra, I. Singh, K. Dua, and R. K. Gautam, Frontiers in Pharmacology 10.3389/fphar.2022.985670 (2022).
- He [2023] Y. He, Nanotechnology-based approaches for targeted delivery of siRNA or chemotherapeutics, Ph.D. thesis, University of Groningen (2023).
- Samec et al. [2022a] T. Samec, J. Boulos, S. Gilmore, A. Hazelton, and A. Alexander-Bryant, Materials Today Bio 14 (2022a).
- Timothy et al. [2022] S. Timothy, L. A. Kharimat, B. Jessica, G. Serena, H. Anthony, C. Carleigh, and A.-B. Angela, Molecular Therapy-Nucleic Acids 14, 95 (2022).
- Tai and Gao [2017] W. Tai and X. Gao, Advanced Drug Delivery Reviews 110-111, 157 (2017), peptides and Peptide Conjugates in Medicine.
- Oliveira et al. [2007a] S. Oliveira, I. van Rooy, O. Kranenburg, G. Storm, and R. M. Schiffelers, International Journal of Pharmaceutics 331, 211 (2007a), selected contributions from the 6th European Workshop on Particulate Systems.
- Cummings et al. [2019] J. C. Cummings, H. Zhang, and A. Jakymiw, Translational Research 214, 92 (2019).
- Cantini et al. [2013a] L. Cantini, C. C. Attaway, B. Butler, L. M. Andino, M. L. Sokolosky, and A. Jakymiw, PLOS ONE 8, 1 (2013a).
- Yadav et al. [2022] D. N. Yadav, M. S. Ali, A. M. Thanekar, S. V. Pogu, and A. K. Rengan, Molecular Pharmaceutics 19, 4506 (2022).
- Martens et al. [2014] T. F. Martens, K. Remaut, J. Demeester, S. C. De Smedt, and K. Braeckmans, Nano Today 9, 344 (2014).
- Smith et al. [2019] S. A. Smith, L. I. Selby, A. P. R. Johnston, and G. K. Such, Bioconjugate Chemistry 30, 263 (2019), https://doi.org/10.1021/acs.bioconjchem.8b00732 .
- Samec et al. [2022b] T. Samec, J. Boulos, S. Gilmore, A. Hazelton, and A. Alexander-Bryant, Materials Today Bio 14, 100248 (2022b).
- Pei and Buyanova [2018] D. Pei and M. Buyanova, Bioconjugate chemistry 30, 273 (2018).
- Degors et al. [2019] I. M. Degors, C. Wang, Z. U. Rehman, and I. S. Zuhorn, Accounts of chemical research 52, 1750 (2019).
- Oliveira et al. [2007b] S. Oliveira, I. van Rooy, O. Kranenburg, G. Storm, and R. M. Schiffelers, International journal of pharmaceutics 331, 211 (2007b).
- Cantini et al. [2013b] L. Cantini, C. C. Attaway, B. Butler, L. M. Andino, M. L. Sokolosky, and A. Jakymiw, PloS one 8, e73348 (2013b).
- Samec et al. [2022c] T. Samec, K. L. Alatise, J. Boulos, S. Gilmore, A. Hazelton, C. Coffin, and A. Alexander-Bryant, Molecular Therapy-Nucleic Acids 30, 95 (2022c).
- Erazo-Oliveras et al. [2012] A. Erazo-Oliveras, N. Muthukrishnan, R. Baker, T.-Y. Wang, and J.-P. Pellois, Pharmaceuticals 5, 1177 (2012).
- Nishimura et al. [2014] Y. Nishimura, K. Takeda, R. Ezawa, J. Ishii, C. Ogino, and A. Kondo, Journal of Nanobiotechnology 12, 10.1186/1477-3155-12-11 (2014), cited by: 51; All Open Access, Gold Open Access, Green Open Access.
- Hou et al. [2015] K. K. Hou, H. Pan, P. H. Schlesinger, and S. A. Wickline, Biotechnology Advances 33, 931 (2015).
- Pei and Buyanova [2019] D. Pei and M. Buyanova, Bioconjugate Chemistry 30, 273 (2019).
- Meng et al. [2017] Z. Meng, L. Luan, Z. Kang, S. Feng, Q. Meng, and K. Liu, Journal of Materials Chemistry B 5, 74 – 84 (2017), cited by: 74.
- Lonn et al. [2016] P. Lonn, A. D. Kacsinta, X.-S. Cui, A. S. Hamil, M. Kaulich, K. Gogoi, and S. F. Dowdy, Scientific Reports 6 (2016).
- Kongkatigumjorn et al. [2018] N. Kongkatigumjorn, S. A. Smith, M. Chen, K. Fang, S. Yang, E. R. Gillies, A. P. R. Johnston, and G. K. Such, ACS Applied Nano Materials 1, 3164 (2018), https://doi.org/10.1021/acsanm.8b00338 .
- Klipp et al. [2023] A. Klipp, M. Burger, and J.-C. Leroux, Advanced Drug Delivery Reviews , 115047 (2023).
- Andrian et al. [2021] T. Andrian, R. Riera, S. Pujals, and L. Albertazzi, Nanoscale Adv. 3, 10 (2021).
- Hausig-Punke et al. [2022] F. Hausig-Punke, F. Richter, M. Hoernke, J. C. Brendel, and A. Traeger, Macromolecular Bioscience 22, 2200167 (2022), https://onlinelibrary.wiley.com/doi/pdf/10.1002/mabi.202200167 .
- Peier et al. [2021] A. Peier, L. Ge, N. Boyer, J. Frost, R. Duggal, K. Biswas, S. Edmondson, J. D. Hermes, L. Yan, C. Zimprich, A. Sadruddin, H. Y. Kristal Kaan, A. Chandramohan, C. J. Brown, D. Thean, X. E. Lee, T. Y. Yuen, F. J. Ferrer-Gago, C. W. Johannes, D. P. Lane, B. Sherborne, C. Corona, M. B. Robers, T. K. Sawyer, and A. W. Partridge, ACS Chemical Biology 16, 293 (2021), pMID: 33539064, https://doi.org/10.1021/acschembio.0c00804 .
- Dixon et al. [2016] A. S. Dixon, M. K. Schwinn, M. P. Hall, K. Zimmerman, P. Otto, T. H. Lubben, B. L. Butler, B. F. Binkowski, T. Machleidt, T. A. Kirkland, M. G. Wood, C. T. Eggers, L. P. Encell, and K. V. Wood, ACS Chemical Biology 11, 400 (2016), pMID: 26569370, https://doi.org/10.1021/acschembio.5b00753 .
- J et al. [2013] G. J, Q. W, Z. A, B. A, M. G, S. U, M. K, S. S, A. C, S. M, E.-B. H, Z. L, K. V, F. K, F. E, B. M, K. Y, A. A, M. M, and Z. M, Nature Biotechnology 31, 638 (2013).
- Du Rietz et al. [2020] H. Du Rietz, H. Hedlund, S. Wilhelmson, P. Nordenfelt, and A. Wittrup, Nature Communications 11, 10.1038/s41467-020-15300-1 (2020).
- Hedlund et al. [2023] H. Hedlund, H. Du Rietz, J. M. Johansson, H. C. Eriksson, W. Zedan, L. Huang, J. Wallin, and A. Wittrup, Nature Communication 14 (2023).
- Kamentsky et al. [2011] L. Kamentsky, T. R. Jones, A. Fraser, M.-A. Bray, D. J. Logan, K. L. Madden, V. Ljosa, C. Rueden, K. W. Eliceiri, and A. E. Carpenter, Bioinformatics 27, 1179 (2011), https://academic.oup.com/bioinformatics/article-pdf/27/8/1179/50580443/bioinformatics_27_8_1179.pdf .
- MJ et al. [2021] M. MJ, O. G, S. AM, L.-I. E, G. A, W. JT, C. A, E. EK, and S. A., Communications Biology 4 (2021).
- Grau and Wagner [2024] M. Grau and E. Wagner, Current Opinion in Chemical Biology 81, 102506 (2024).
- Beach et al. [2022] M. A. Beach, S. L. Y. Teo, M. Z. Chen, S. A. Smith, C. W. Pouton, A. P. R. Johnston, and G. K. Such, ACS Applied Materials & Interfaces 14, 3653 (2022), pMID: 34964593, https://doi.org/10.1021/acsami.1c18359 .
- Teo et al. [2021] S. Teo, J. Rennick, D. Yuen, H. Al-Wassiti, A. Johnston, and C. Pouton, Nature Communications 12, 10.1038/s41467-021-23997-x (2021), funding Information: MALDI was performed at the Melbourne Centre for Nanofabrication (MCN) in the Victorian Node of the Australian National Fabrication Facility (ANFF). We thank Dr David Rudd for providing his MALDI expertise. S. L. Y. T. was supported by Monash Graduate Scholarship (MGS). J. J. R. was supported by an Australian Government Research Training Program (RTP) Scholarship. Publisher Copyright: © 2021, The Author(s). Copyright: Copyright 2021 Elsevier B.V., All rights reserved.
- Paramasivam et al. [2021] P. Paramasivam, C. Franke, M. Stöter, A. Höijer, S. Bartesaghi, A. Sabirsh, L. Lindfors, M. Y. Arteta, A. Dahlén, A. Bak, et al., Journal of Cell Biology 221, e202110137 (2021).
- Yazdi et al. [2024] M. Yazdi, J. Pöhmerer, M. Hasanzadeh Kafshgari, J. Seidl, M. Grau, M. Höhn, V. Vetter, C. C. Hoch, B. Wollenberg, G. Multhoff, A. Bashiri Dezfouli, and E. Wagner, Small 20, 2400643 (2024), https://onlinelibrary.wiley.com/doi/pdf/10.1002/smll.202400643 .
- Wittrup et al. [2015a] A. Wittrup, A. Ai, X. Liu, P. Hamar, R. Trifonova, K. Charisse, M. Manoharan, T. Kirchhausen, and J. Lieberman, Nature Biotechnology 33, 870 – 876 (2015a), cited by: 445; All Open Access, Green Open Access.
- Scherr et al. [2020] T. Scherr, K. Löffler, M. Böhland, and R. Mikut, PLOS ONE 15, 1 (2020).
- Padovani et al. [2022] F. Padovani, B. Mairhörmann, P. Falter-Braun, and et al., BMC Biol 20 (2022).
- Hirling and Horvath [2023] D. Hirling and P. Horvath, Computational and Structural Biotechnology Journal 21, 742 (2023).
- Long [2020] F. Long, BMC Bioinformatics. 21 (2020).
- Dimopoulos et al. [2014] S. Dimopoulos, C. E. Mayer, F. Rudolf, and J. Stelling, Bioinformatics 30, 2644 (2014), https://academic.oup.com/bioinformatics/article-pdf/30/18/2644/48929266/bioinformatics_30_18_2644.pdf .
- Otsu [1979] N. Otsu, IEEE Trans. Syst. Man Cybern. 9, 62 (1979).
- Wittrup et al. [2015b] A. Wittrup, A. Ai, X. Liu, P. Hamar, R. Trifonova, K. Charisse, M. Manoharan, T. Kirchhausen, and J. Lieberman, Nature biotechnology 33, 870 (2015b).
- Enderle [2012] J. D. Enderle, in Introduction to Biomedical Engineering (Third Edition), Biomedical Engineering, edited by J. D. Enderle and J. D. Bronzino (Academic Press, Boston, 2012) third edition ed., pp. 359–445.
- Bassingthwaighte et al. [2012] J. B. Bassingthwaighte, E. Butterworth, B. Jardine, and G. M. Raymond, Compartmental modeling in the analysis of biological systems, in Computational Toxicology: Volume I, edited by B. Reisfeld and A. N. Mayeno (Humana Press, Totowa, NJ, 2012) pp. 391–438.
- Brauer [2008] F. Brauer, Compartmental models in epidemiology, in Mathematical Epidemiology, edited by F. Brauer, P. van den Driessche, and J. Wu (Springer Berlin Heidelberg, Berlin, Heidelberg, 2008) pp. 19–79.
- Gillespie [1977a] D. T. Gillespie, The Journal of Physical Chemistry 81, 2340 (1977a).
- Gillespie [1976] D. T. Gillespie, Journal of Computational Physics 22, 403 (1976).
- Mease [2018] J. Mease, in SciPy (2018) pp. 69–76.
- Erban and Chapman [2009] R. Erban and S. J. Chapman, Physical Biology 6, 046001 (2009).
- Erban et al. [2007] R. Erban et al., BMC Systems Biology 1, 36 (2007).
- Qian and Ge [2012] H. Qian and H. Ge, Stochastic Chemical Reaction Systems in Biology (Springer, 2012).
- Andrews and Bray [2004] S. S. Andrews and D. Bray, Physical Biology 1, 137 (2004).
- Hattne et al. [2005] J. Hattne, D. Fange, and J. Elf, TBioinformatics 21, 2923 (2005).
- Gillespie [1977b] D. T. Gillespie, The journal of physical chemistry 81, 2340 (1977b).
- Warne et al. [2019] D. J. Warne, R. E. Baker, and M. J. Simpson, Journal of The Royal Society Interface 16, 20180943 (2019), https://royalsocietypublishing.org/doi/pdf/10.1098/rsif.2018.0943 .
- Patil et al. [2010] A. Patil, D. Huard, and C. J. Fonnesbeck, Journal of statistical software 35, 1 (2010).
- Zhang et al. [2015] X.-Y. Zhang, M. N. Trame, L. J. Lesko, and S. Schmidt, CPT: pharmacometrics & systems pharmacology 4, 69 (2015).
- Christopher Frey and Patil [2002] H. Christopher Frey and S. R. Patil, Risk analysis 22, 553 (2002).