Observation of distorted tilted conical phase at the surface of a bulk chiral magnet with resonant elastic x-ray scattering
Abstract
We report on various magnetic configurations including spirals and skyrmions at the surface of the magnetic insulator Cu2OSeO3 at low temperatures with a magnetic field applied along ⟨100⟩ using resonant elastic X-ray scattering (REXS). We observe a well-ordered surface state referred to as a distorted tilted conical spiral (TC) phase over a wide range of magnetic fields. The distorted TC phase shows characteristic higher harmonic magnetic satellites in the REXS reciprocal space maps. Skyrmions emerge following static magnetic field cycling and appear to coexist with the distorted TC phase. Our results indicate that this phase represents a distinct and stable surface state that does not disappear with field cycling and persists until the field strength is increased sufficiently to create the field-polarized state.
I Introduction
In recent years, cubic chiral magnets have gained significant interest for their ability to host unique chiral magnetic spin configurations like helical spirals, chiral soliton lattices [1, 2], skyrmions [3, 4, 5], and screw dislocations [6]. These noncollinear spin configurations are largely driven by the antisymmetric Dzyaloshinskii-Moriya interaction intrinsic in these chiral magnets, offering new avenues for emerging computing technologies [7, 8, 9]. The topologically nontrivial skyrmion textures were initially observed in the cubic chiral magnet MnSi using neutron scattering techniques [3] and subsequently in Cu2OSeO3 [5]. The latter is a unique member of the cubic chiral magnet family because it is an insulator with a wide band gap of 2.4 eV [10] providing the opportunity to control the skyrmion lattice phase by electric fields [11, 12]. In addition, the low Gilbert damping [13, 14] observed in Cu2OSeO3 makes it promising for potential applications in magnonic devices [15]. Cu2OSeO3 hosts two independent skyrmion pockets at different magnetic field-temperature regions of the phase diagram [16, 17, 18]. It has been proposed, that the competition between cubic magneto-crystalline and exchange anisotropies in Cu2OSeO3 at low temperatures [19] leads to the stabilization of novel noncollinear magnetic phases, such as the tilted conical state and the low-temperature skyrmion lattice phase. Notably, these phases are only observed when the magnetic field is applied along the crystallographic directions [20, 21, 16, 17].
In chiral magnets, the spin configurations at the surface can significantly differ from those in the bulk due to the lack of translational symmetry, anisotropy, and surface Dzyaloshinskii-Moriya interaction [22]. These factors may cause surface twists that change the helicity angle of the spin configurations at the surface compared to the bulk [23, 24, 25, 26, 27, 28]. Recent investigations highlight the surface twists of spirals and skyrmion phases in Cu2OSeO3 [23, 24]. Here, we focus on the spiral and skyrmion phases at the surface of the cubic chiral magnet Cu2OSeO3 that exist at low temperatures by applying a magnetic field along the crystallographic directions. We investigate these magnetic phases by using resonant elastic X-ray scattering. REXS enables the identification of various magnetic phases through reciprocal phase mapping using element-specific X-ray energies[29]. In the case of the B20-type cubic chiral helimagnets, the crystal’s small lattice constant relative to the X-ray wavelength leads to the exclusion of structural peaks in diffraction according to Bragg’s law. Conversely, in the Cu2OSeO3 crystal with a comparatively large lattice constant [30] among the B20 members, a forbidden peak emerges in soft X-ray measurements at the Cu -edge. By employing REXS and characterizing the modulated magnetic orders with the presence of magnetic satellites surrounding the Bragg peaks, one can effectively map magnetic phases in reciprocal space. This comprehensive approach enables a detailed investigation of the magnetic phases of Cu2OSeO3.
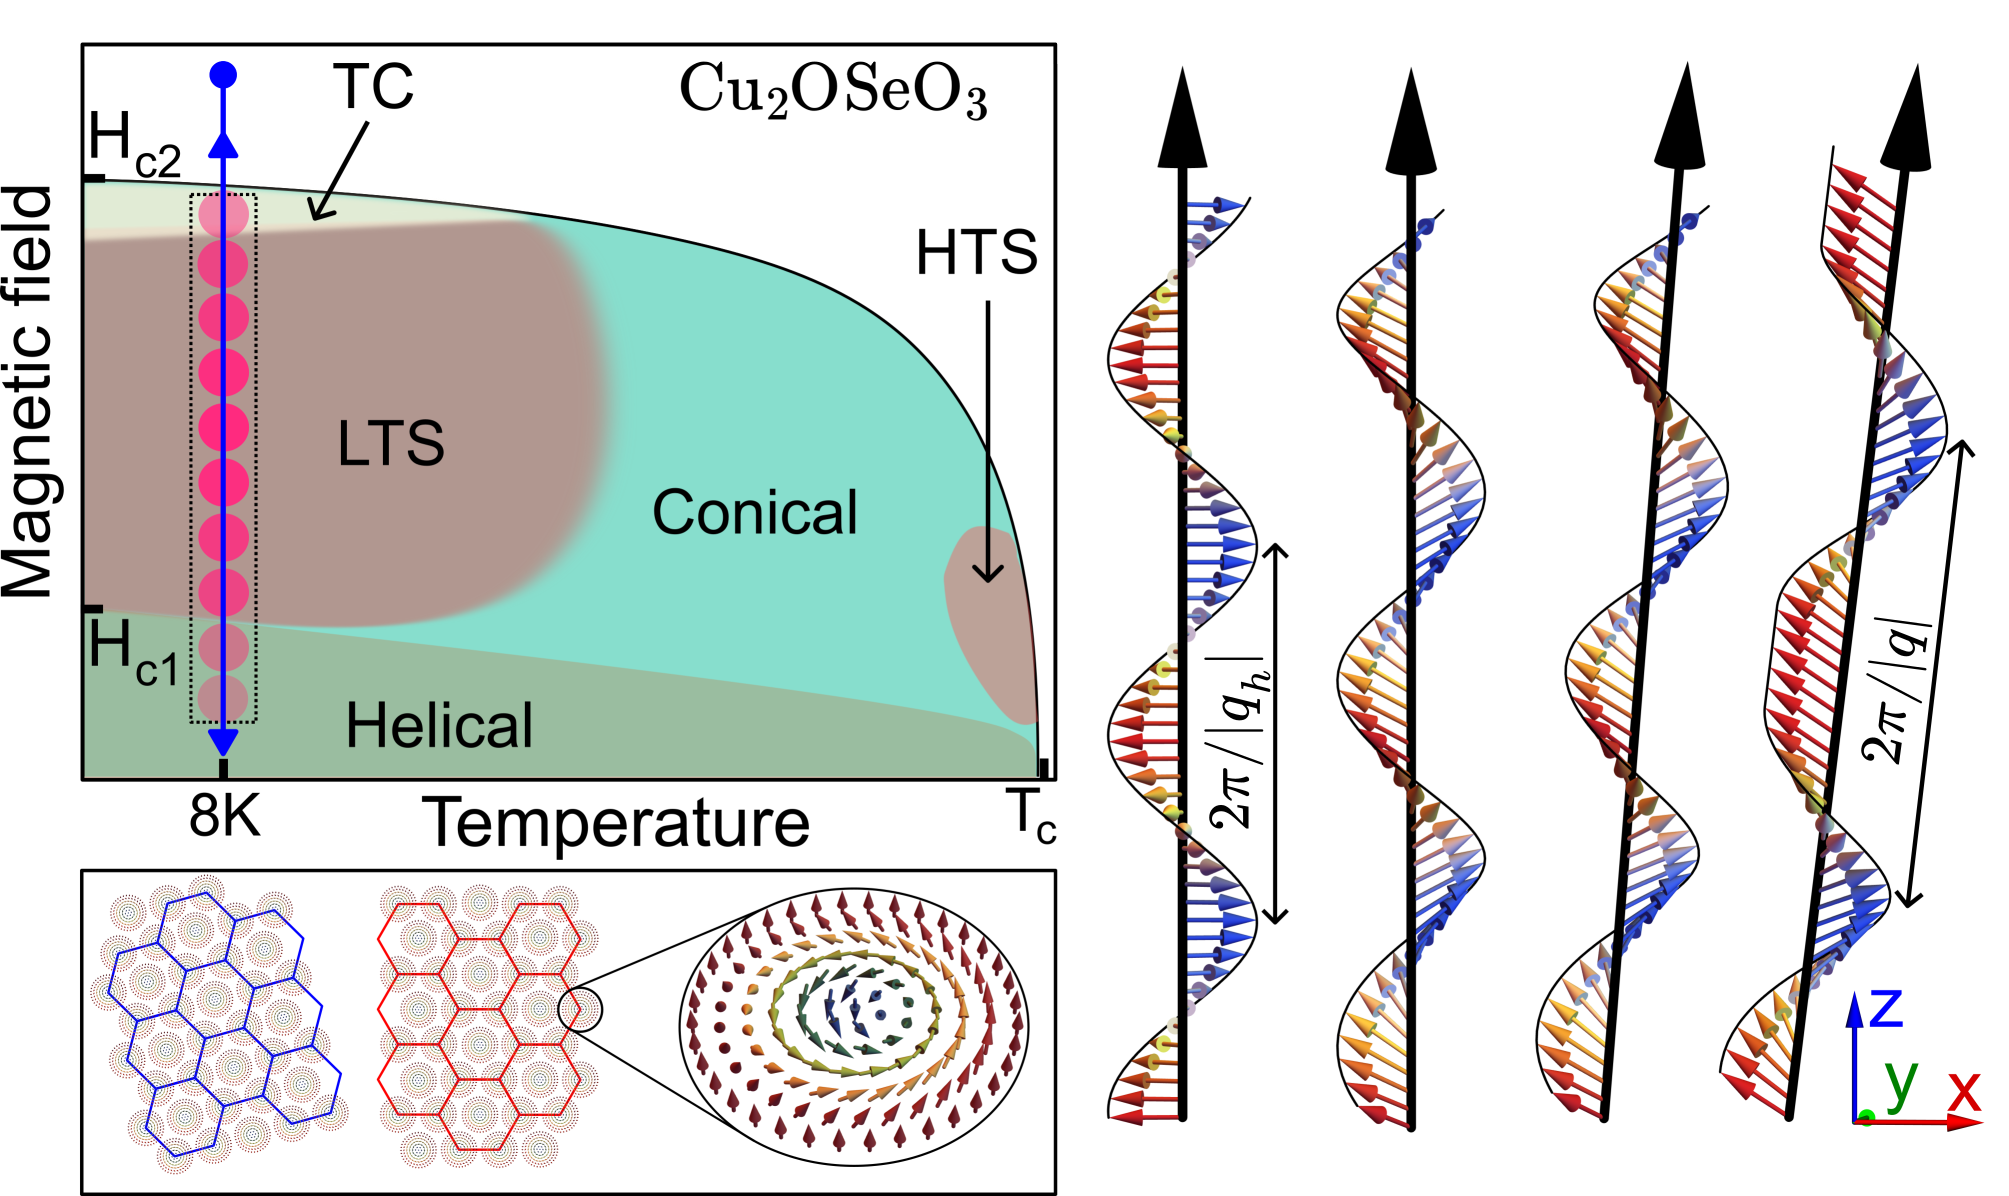
Figure 1 highlights the main magnetic phases of a bulk Cu2OSeO3 single crystal when a magnetic field is applied along the crystallographic direction. Below the critical temperature , Cu2OSeO3 favors helimagnetic long-range order in a large region of the phase diagram [31, 5], characterized by a helical pitch, , and wave vector (Fig. 1(c))[32]. The balance between magneto-crystalline cubic anisotropy and the anisotropic exchange terms determine the helical spiral orientation along the easy anisotropy direction [5] which are and for Cu2OSeO3 and MnSi, respectively. When a finite magnetic field is applied, it aligns the helix axis and tilts the magnetic moments towards the field direction giving rise to a conical magnetic phase retaining the same pitch (see Fig. 1(c),(d)).
At large applied magnetic fields , all magnetic moments fully align along the applied magnetic field direction, resulting in the establishment of a field-polarized state. Close to , a skyrmion lattice is observed in a narrow field-temperature region, referred to here as the HTS phase. The HTS is not only observed in Cu2OSeO3 but is also inherent in other cubic helimagnets like Fe1-xCoxSi [33], MnSi [3] and FeGe [34]. It is stabilized by thermal fluctuations and as a result observed at elevated temperatures near . Recently, a tilted conical spiral (TC) [20] and another skyrmion lattice phase (referred to here as low-temperature skyrmion phase - LTS) [16] were observed to be stabilized due to cubic crystalline and exchange anisotropy contributions at low temperatures when the external magnetic field is applied along the crystallographic direction. Note that the LTS is an independent skyrmion lattice phase and compared to thermodynamically stabilized HTS [21, 16] it is nearly isotropic for magnetic fields applied along different crystallographic directions. Furthermore, at relatively high magnetic fields, the spiral orientation deviates from alignment with the magnetic field direction, characterized as a TC phase originating from the competition between cubic anisotropy with easy axis and exchange anisotropy with easy axis, specifically when the field is close to (Fig. 1(e)) [20]. The transition from a field-polarized state to a topologically non-trivial LTS phase is rather complicated and the system goes through a TC phase before settling in a LTS phase. The LTS and TC phases are strongly hysteretic and depend on the field sweep directions.
In this work, we experimentally detect an orientationally ordered skyrmion phase by applying a magnetic field along the direction by following the cycling field protocol at low temperatures. Most interestingly, surface effects lead to the unexpected formation of a robust distorted tilted conical spiral phase (Fig. 1(f)) that persists throughout the field cycling process used to populate skyrmions in the LTS phase.
II Experimental
REXS experiments are performed using the ALICE \Romannum2 endstation, at the PM3 beamline at BESSY \Romannum2 synchrotron, Berlin. Cu2OSeO3 single crystals were grown by chemical vapor transport [35] and then oriented with a Laue diffractometer. One Cu2OSeO3 crystal was precisely cut into a cuboid with 32 mm2 lateral dimensions and 1 mm thickness. The crystal was oriented with a surface normal along and edges along crystallographic directions and then the top surface was polished mechanically [36]. The sample was mounted on a copper sample holder, with the polished surface facing upward. The sample holder includes a cylindrical temperature shield with a 210 cut open arc of 2 mm width that enables a free path for incoming and outgoing X-ray beams. All REXS results presented in this paper were acquired at the L3 edge using a photon energy of 931.8 eV ( 1.33 nm) and circularly polarized X-rays, which probe the magnetization component parallel to the incident beam. The forbidden structural Bragg peak at approximately is observed exclusively in resonant X-ray scattering[37, 32]. Resonant X-ray scattering is sensitive to the local point group symmetry, and thus the symmetry of the measurement can sometimes break the general symmetry of the crystal, including features like glide planes or screw axes that usually cause certain reflections to extinct. In the case of Cu2OSeO3, the (001) reflections are typically forbidden by the screw-axis symmetry. Their appearance in REXS measurements can be explained by the anisotropy of the tensor of X-ray susceptibility, which can allow these reflections and their magnetic satellites to become visible. Fortunately, due to the large lattice constant of the crystal (ca. 0.8925 nm [30]) the (001) reflection is accessible at the Cu L-edge.
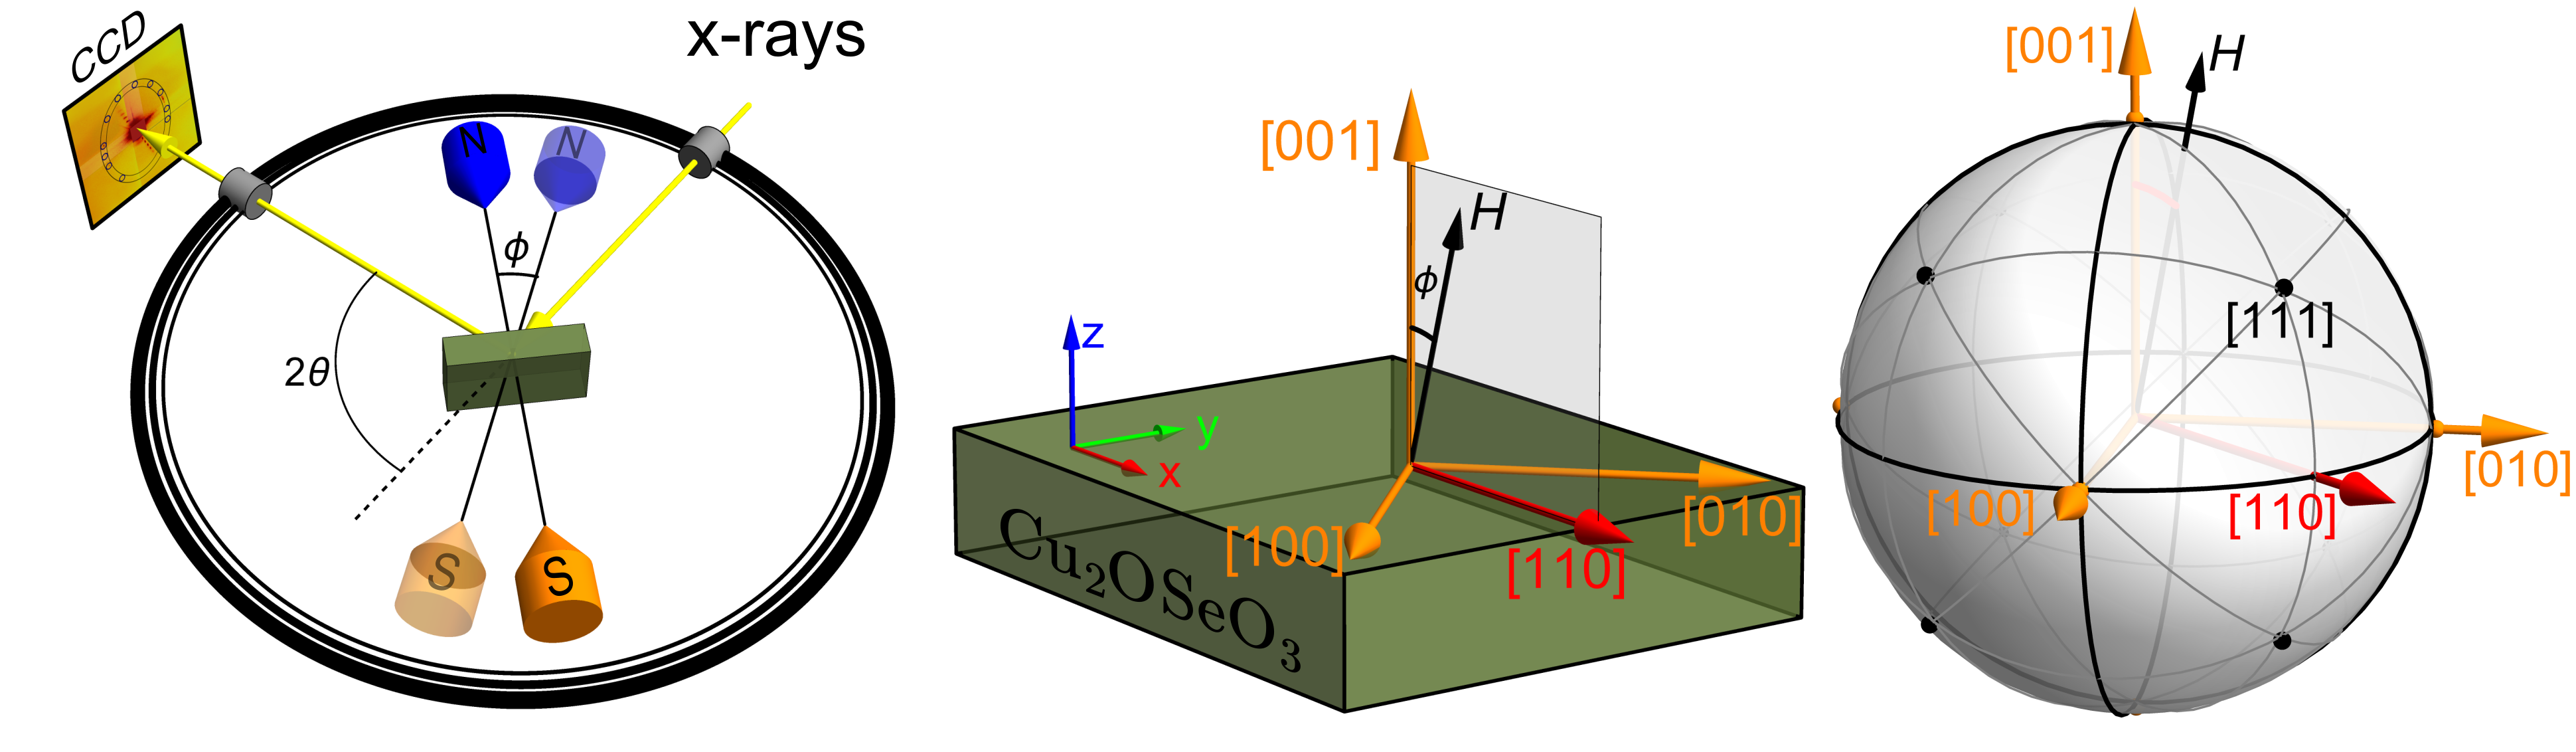
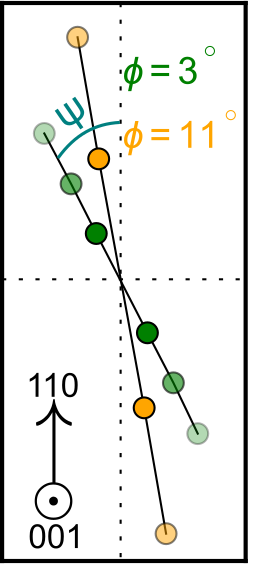
The REXS intensity was collected by the 4k CCD detector (GreatEyes GmbH, Germany) located at a distance of 73 cm from the sample [38]. The intense (001) Bragg peak was blocked by a beamstop, allowing to observe the magnetic satellites. In this manuscript, all results are obtained at a base temperature of approximately 8 K, utilizing the closed-cycle cryostat (Stinger, ColdEdge Technologies, USA). To improve the signal-to-noise ratio, we averaged ten images, each measured at 20 seconds exposure time, and then subtracted the background at =150 mT (field polarized state). We conducted our measurements by tilting the magnetic field from the crystallographic direction towards the direction, denoted as angle (figure 2), with a maximum tilt angle of 11 degrees. This adjustment was performed to enable a detailed study of the distorted tilted conical phases and their behavior under varying magnetic field strengths.
III Results
REXS revealed the existence of a periodic anharmonic magnetic order, identified as a distorted tilted conical spiral phase (see Fig. 1(f)), in addition to the proper screw characteristic of the helical spirals in the chiral helimagnetic material Cu2OSeO3. As shown in Fig. 1(f), the spin texture exhibits a periodic, nonlinear pattern, which deviates from the simple sinusoidal form typically observed in helical structures (Fig. 1(c)). This anharmonic behavior of the spin configuration leads to the appearance of additional higher-order peaks.
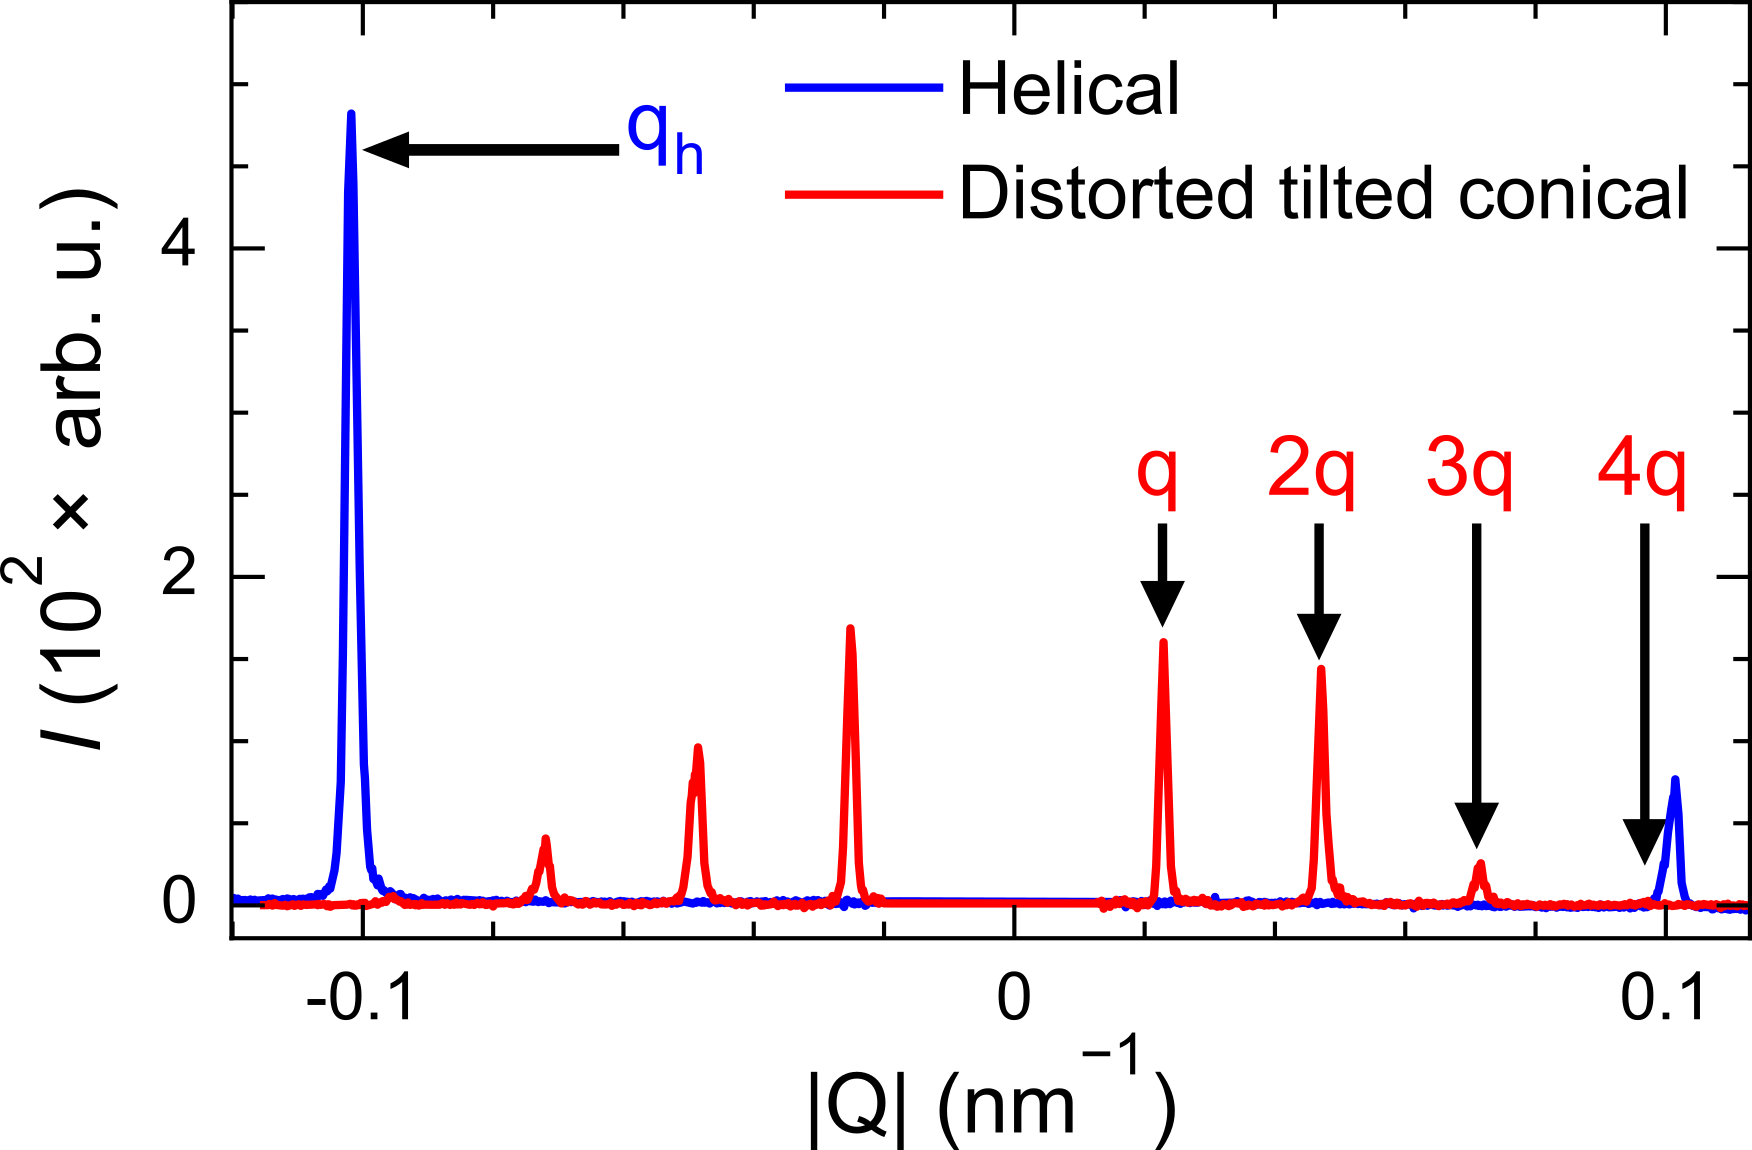
Figure 3 shows an exemplary intensity line profile of a CCD image containing the magnetic satellites from REXS in the hk plane of the reciprocal space. The intensity profile shows a single Friedel pair () for the helical spiral at zero applied magnetic fields that are governed by a weak cubic anisotropy [31]. For the distorted tilted conical phase having a spiral modulation with non-linear spin rotation angles, four Friedel pairs (q, 2q, 3q, 4q) are identified at 8 K with =45 mT (see Fig. 3).The propagation vector of the helical spiral, defined as , is estimated to be around 0.1 nm-1 [5, 31], yielding a helical spiral wavelength 60 nm. However, q suggests that the distorted tilted conical spiral phase has a significantly longer wavelength in real space, estimated to be around 240 nm at .
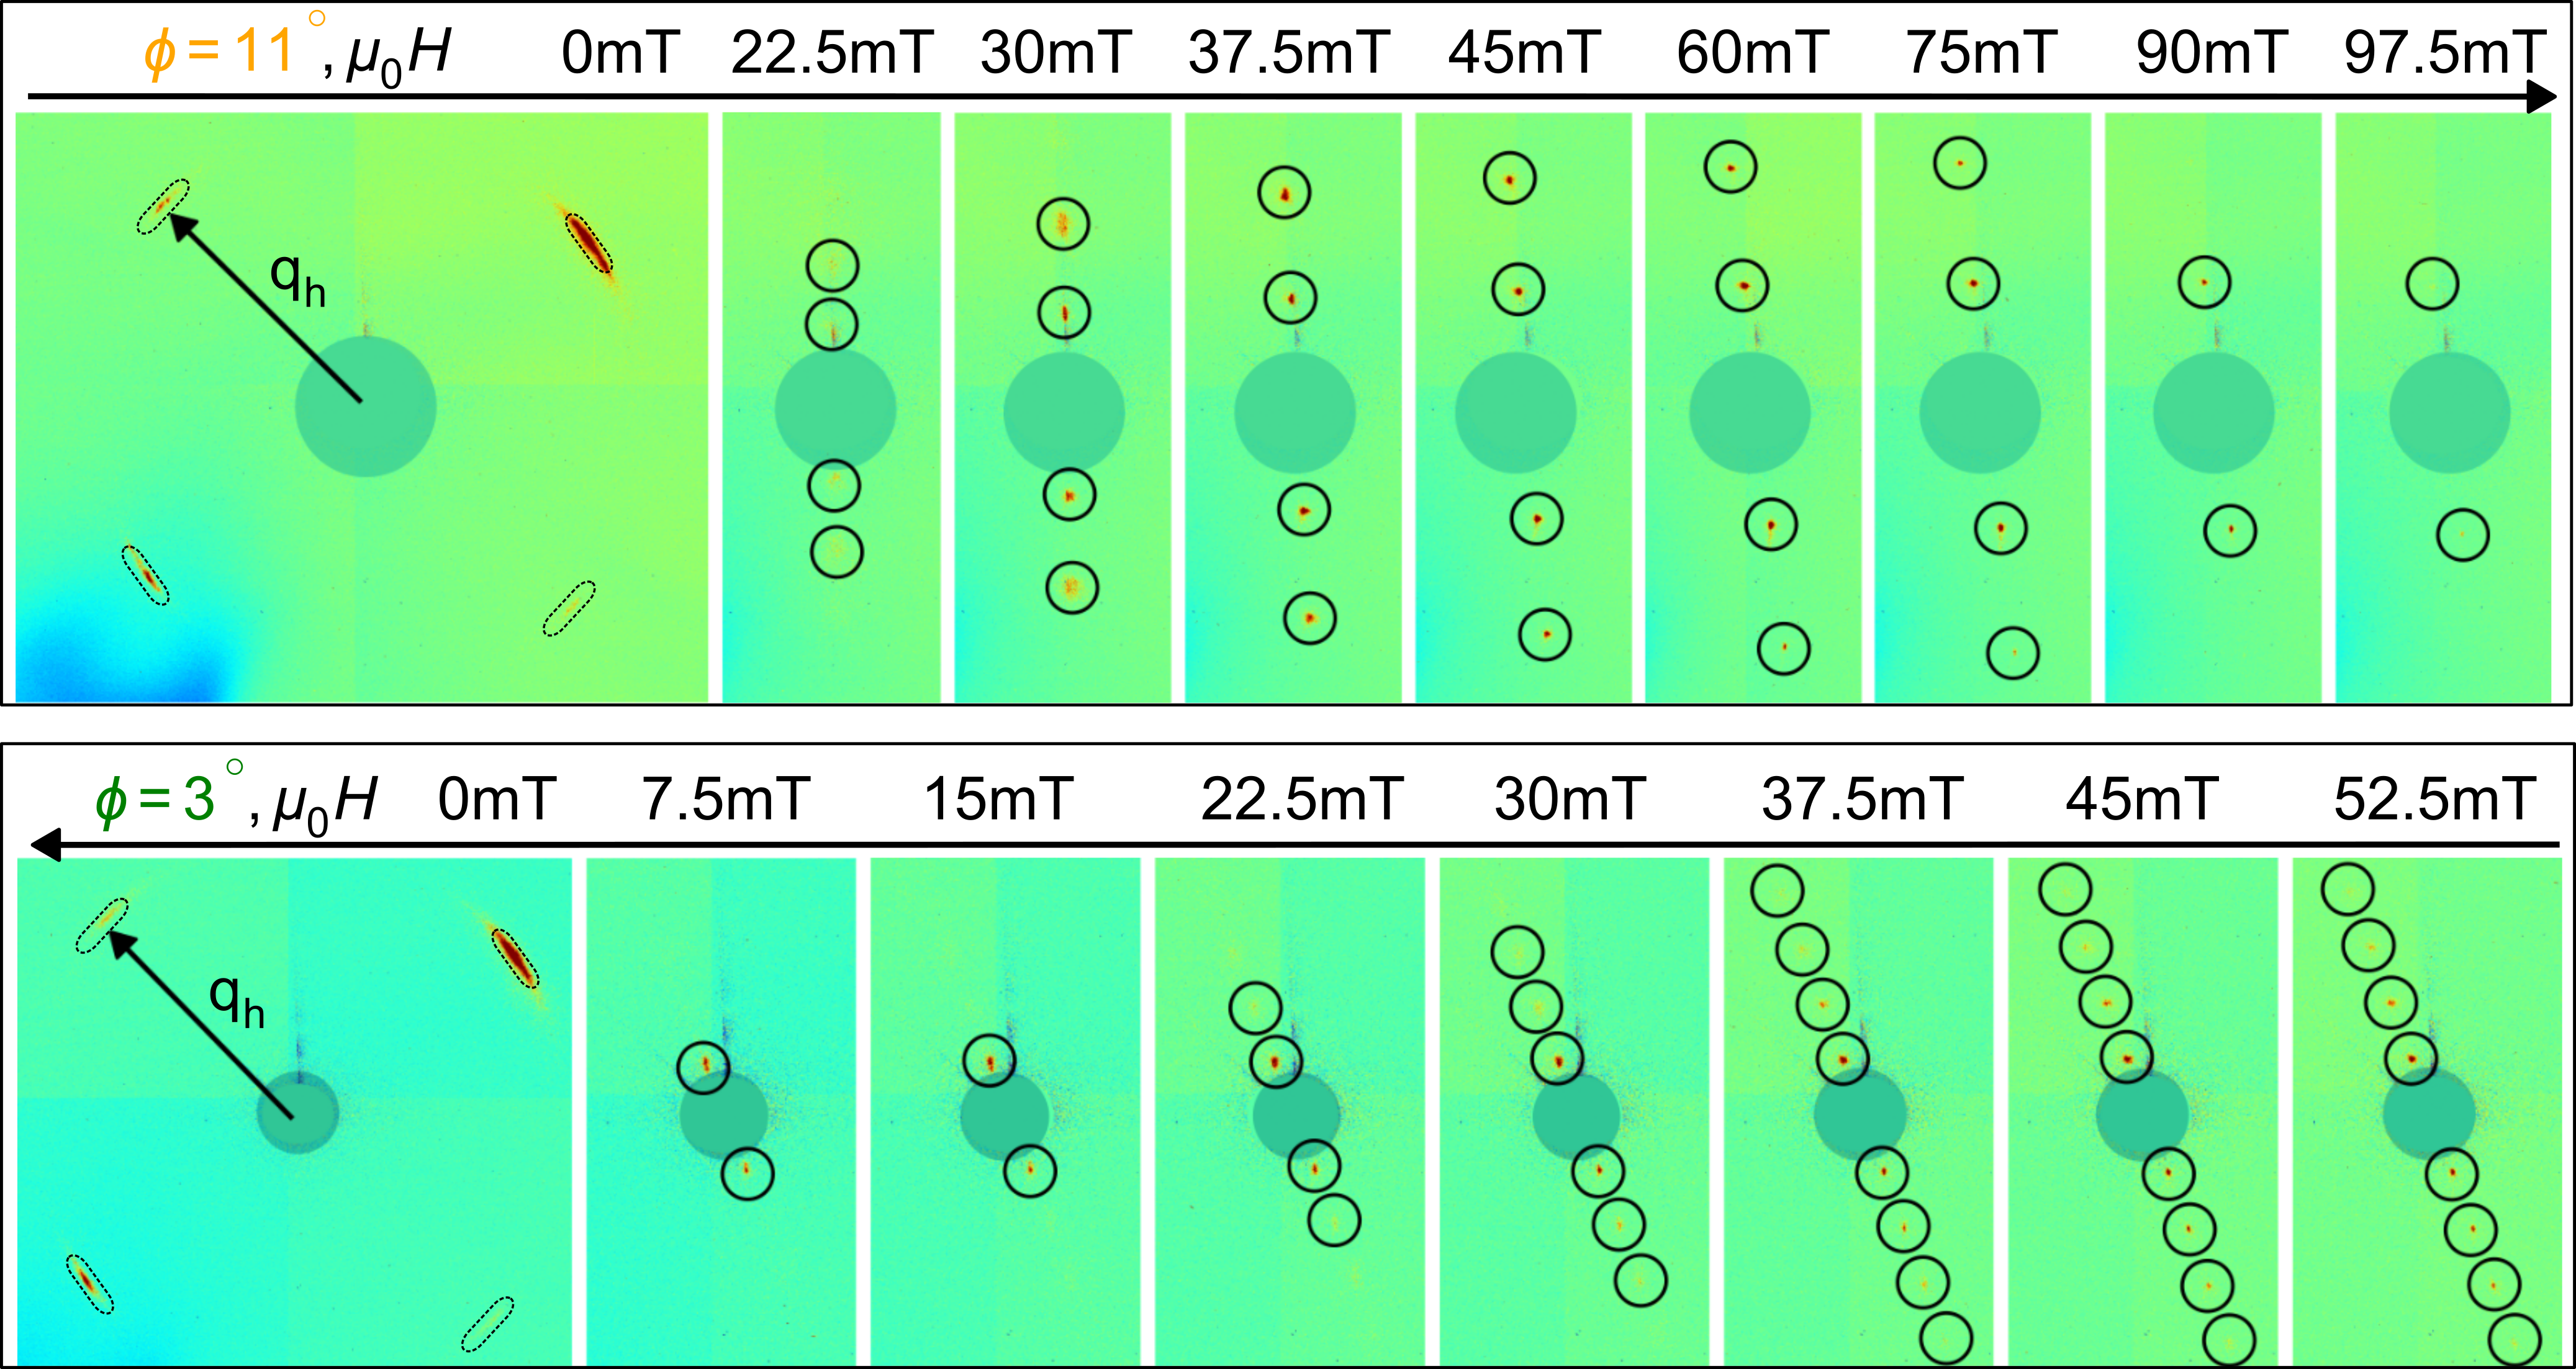
Figures 4 (a) and 4 (b) show the color maps of the REXS intensity in reciprocal space, captured in the hk plane under various applied magnetic fields using a CCD detector for different magnetic field sweep directions. At zero applied magnetic field, we observe four peaks corresponding to two helical domains, as illustrated in Fig.4 (a). With an increase of the magnetic field, the intensity of these helical peaks diminishes, while the distorted TC peaks start to appear at a relatively low magnetic field strength (), as detailed in the supplementary scan [supplementary information]. As the magnetic field is increased further, the wave vector and peak intensity of the distorted TC phase progressively increase until 60 mT, after which a steady decline in peak intensity and saturation of the relative change in wave vector leads to their complete disappearance at about 100 mT, indicating the transition to a field-polarized state, as depicted in Fig. 5 (a,b). Note that at smaller magnetic fields close to applied at an angle 11∘, the distorted TC peaks are fully aligned along the [110] crystallographic direction, as depicted in Fig.4 (a). When increasing the applied magnetic field, the distorted TC phase tilts away from the [110] axis with an angle . A tilt angle = 4.5 ∘ is observed at 60 mT, as shown in Fig. 6, indicating the deviation of the spiral propagation vector towards the easy axis due to the prevailing cubic anisotropy. A similar trend is observed for an opposite-field sweep direction at , with no change in the spiral wave vector, as the magnetic field is decreased from the field-polarized state to 0T (cf. Figs. 5(a) and 5(b)). Importantly, both helical and distorted tilted conical phases were simultaneously observed from 15 mT to 7.5 mT while sweeping the magnetic field to zero (see supplementary information). At zero magnetic field, only four helical peaks are observed.
Recently, higher-order peaks have been observed in a strained Cu2OSeO3 characterized by a chiral soliton lattice with the modulation vector along the strain direction [1]. The chiral soliton lattice (CSL) typically forms in uniaxial (strained) chiral magnets, with a significant reduction in the q vector [1, 39] when a magnetic field is applied perpendicular to the propagation vector. In contrast, our study reveals distinct behavior: no significant change in the q vector was observed when the field decreased from 50 mT to the helical phase, while an increase in the q vector was noted as the field increased from 0 T to 60 mT. This was accompanied by a consistent rotation in q space, suggesting the stabilization of a distorted tilted conical state. These findings indicate that the observed phase does not correspond to a CSL but rather defines a unique distorted spiral state. Recently, a distinct surface state resembling the distorted TC phase was reported using SQUID-on-tip microscopy on the surface of a bulk Cu2OSeO3 crystal. This study identified a stripe surface state and a tilted spiral state in real space, with the stripe state exhibiting higher-order magnetic satellites through FFT analysis of the real-space images [40].
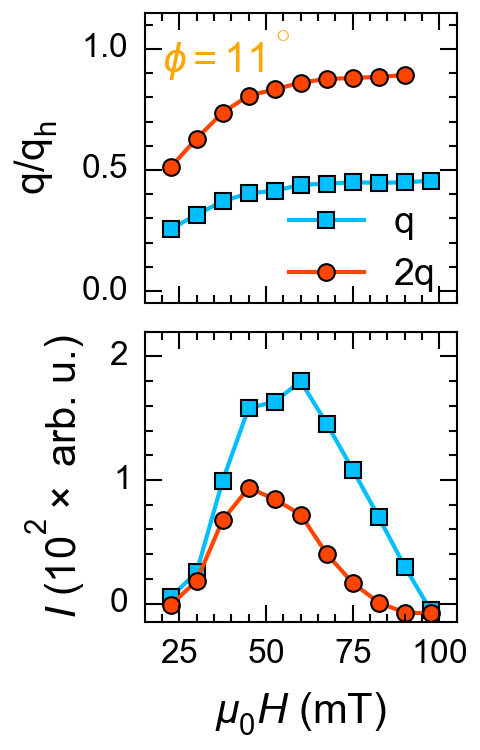
By tilting the magnetic field, the distorted TC phase reorients, and the number of observed higher-order peaks decreases in the reciprocal map space, as illustrated schematically in Fig. 6(a). At , the distorted TC phase is oriented along the [010] crystallographic direction, parallel to one of the observed helical domains at 0 T, resulting in as shown in Fig. 6(b1). As the tilt angle of the magnetic field, , increases the distorted TC phase starts to reorient towards the [110] axis (along the vertical line drawn in the schematics of the CCD image in Fig. 6(a)), resulting in an increase of the normalized pitch wave vector (q/qh) and spiral reorientation angle (see Fig. 6(c)). Importantly, a substantial increase in the wave vector of the distorted TC phase is observed as a function of applied magnetic field tilt angle , which shifts the higher-order peaks outwards compared to the center of the CCD image and reduces the number of observable higher harmonic peaks in the reciprocal space image (cf. Figs. 6(b1) to (b5)). The linear increase in the wave vector (q/qh) with increasing tilt angle is due to the projection of the distorted TC phase onto the (110) plane. As the spiral tilts away from the magnetic field, it projects more clearly onto this plane at an angle less than 90 degrees.
A hexagonal single-domain skyrmion lattice is formed by three coplanar propagation vectors aligned 60∘ with respect to each other [32]. Whereas, within a multi-domain skyrmion lattice, the six-fold symmetric peaks divide into multiple six-fold subsets that are simultaneously sampled by the wide X-ray beam [37, 41].
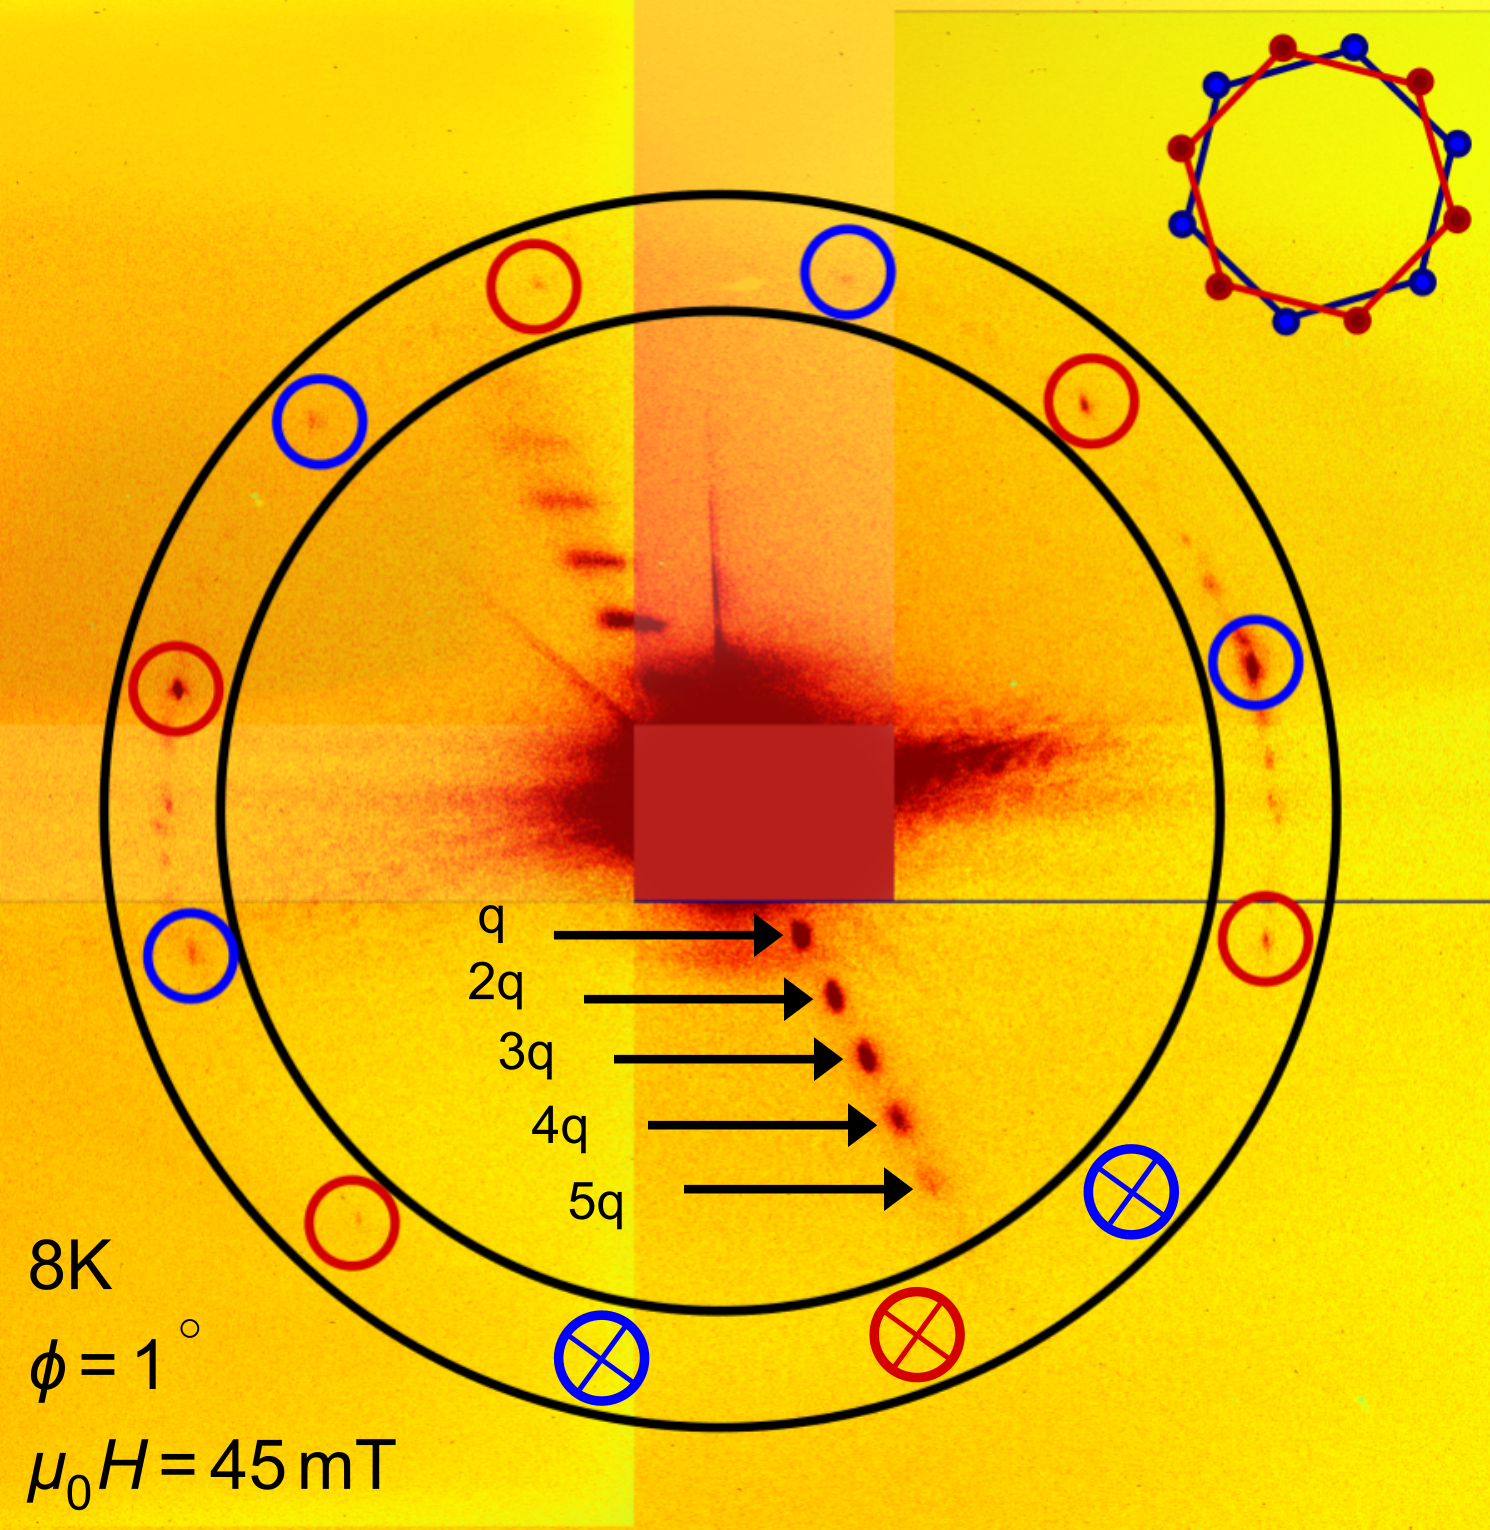
Figure 7 reveals the reciprocal map of the skyrmion lattice state with six magnetic satellites linked to the structural Bragg peak. It demonstrates the coexistence of both distorted tilted conical spiral and multidomain skyrmion lattice phases at 45 mT. The intensity pattern shown in Fig. 7 is recorded in four instances with an exposure time of 1200 seconds for each around the Bragg peak to avoid intensity saturation within the CCD and later stitched together to show a full pattern for the skyrmion lattice. The area bounded by two concentric circles in Fig. 7 marks the region where we anticipate observing a hexagonal scattering pattern of a skyrmion lattice [16]. The blue and red circles highlight the peaks with higher intensity and are considered as two hexagonal skyrmion lattices which are oriented differently (depicted in the inset) and appear as a multi-domain skyrmion phase. Moreover, in contrast to the representation in Figure 6 (b) with , prolonging the exposure time on the CCD leads to improved visibility of higher harmonic TC phase peaks up to the fifth order, as demonstrated in Figure 7 with arrows. When utilizing the REXS technique, its high sensitivity to the sample’s surface allows us to precisely identify the magnetic textures present near the surface. This capability highlights unique surface magnetic textures, which may differ from the bulk configuration due to surface anisotropy and surface Dzyaloshinskii-Moriya interaction [22], leading to the observation of distinctive distorted spin textures that are not present in bulk chiral systems[27, 6].
IV Summary
We experimentally identified an ordered surface texture referred to here as distorted titled conical spiral (TC) phase in an extended field region of the magnetic phase diagram at low temperatures. The distorted TC phase points towards the presence of additional magnetic interactions playing an important role at the surface.
The distorted TC phase does not disappear with field cycling; instead, it coexists with the multidomain skyrmion phase populated by the field cycling protocol. The distorted TC and skyrmion phases show a strongly hysteretic behavior depending on the direction of the applied magnetic field sweep. Additionally, we examined the reorientation of the distorted TC phase by tilting the static magnetic field relative to the crystallographic direction of Cu2OSeO3. Notably, the distorted TC phase propagation vector follows the magnetic field in the (-) plane with a deviation angle . We observed a nonlinear change in angle for magnetic field angle () from almost zero degrees (at ) to about 40 degrees (at ) in the hk plane. Furthermore, we recognized a linear increase of the normalized modulation vector by tilting the magnetic field with angle .
Our findings provide valuable insights into the periodicity and orientation of the rarely studied distorted TC phase at the surface of Cu2OSeO3 crystals with a remarkably long period of approximately 240 nm. Resolving the distorted TC phase and other magnetic textures at the surface highlights the importance of REXS for identifying and engineering chiral surface twists. This research opens new avenues for investigating the behavior of these intricate spin textures under various conditions, contributing to the broader knowledge of chiral magnetic materials.
V Acknowledgements
The authors express their gratitude to C. Pfleiderer, D. Mettus, A. Bauer, K. Everschor-Sitte, and M. Azhar for their valuable discussions. The REXS experiment was conducted at the BESSY II synchrotron (Helmholtz-Zentrum Berlin) as part of proposal 231-11958. This work has been funded by the excellence cluster MCQST under Germany’s Excellence Strategy EXC-2111 (Project No. 390814868). We acknowledge financial support for the VEKMAG project by the German Federal Ministry for Education and Research (BMBF 05K2010, 05K2013, 05K2016, 05K2019) and by HZB. F.R. acknowledges funding by the Deutsche Forschungsgemeinschaft (DFG; German Research Foundation) under SPP2137 Skyrmionics/RA 3570 and A.A. was supported by the DFG grant - 528001743.
References
- Okamura et al. [2017] Y. Okamura, Y. Yamasaki, D. Morikawa, T. Honda, V. Ukleev, H. Nakao, Y. Murakami, K. Shibata, F. Kagawa, S. Seki, et al., Physical Review B 96, 174417 (2017).
- Brearton et al. [2023] R. Brearton, S. Moody, L. Turnbull, P. Hatton, A. Štefančič, G. Balakrishnan, G. van der Laan, and T. Hesjedal, Advanced Physics Research 2, 2200116 (2023).
- Mühlbauer et al. [2009] S. Mühlbauer, B. Binz, F. Jonietz, C. Pfleiderer, A. Rosch, A. Neubauer, R. Georgii, and P. Böni, Science 323, 915 (2009).
- Tonomura et al. [2012] A. Tonomura, X. Yu, K. Yanagisawa, T. Matsuda, Y. Onose, N. Kanazawa, H. S. Park, and Y. Tokura, Nano letters 12, 1673 (2012).
- Seki et al. [2012] S. Seki, X. Yu, S. Ishiwata, and Y. Tokura, Science 336, 198 (2012).
- Azhar et al. [2022] M. Azhar, V. P. Kravchuk, and M. Garst, Physical Review Letters 128, 157204 (2022).
- Song et al. [2020] K. M. Song, J.-S. Jeong, B. Pan, X. Zhang, J. Xia, S. Cha, T.-E. Park, K. Kim, S. Finizio, J. Raabe, et al., Nature Electronics 3, 148 (2020).
- Li et al. [2023] S. Li, X. Wang, and T. Rasing, Interdisciplinary Materials 2, 260 (2023).
- Lee et al. [2024] O. Lee, T. Wei, K. D. Stenning, J. C. Gartside, D. Prestwood, S. Seki, A. Aqeel, K. Karube, N. Kanazawa, Y. Taguchi, et al., Nature Materials 23, 79 (2024).
- Versteeg et al. [2016] R. Versteeg, I. Vergara, S. Schäfer, D. Bischoff, A. Aqeel, T. Palstra, M. Grüninger, and P. van Loosdrecht, Physical Review B 94, 094409 (2016).
- Huang et al. [2018] P. Huang, M. Cantoni, A. Kruchkov, J. Rajeswari, A. Magrez, F. Carbone, and H. M. Rønnow, Nano letters 18, 5167 (2018).
- White et al. [2014] J. White, K. Prša, P. Huang, A. Omrani, I. Živković, M. Bartkowiak, H. Berger, A. Magrez, J. Gavilano, G. Nagy, et al., Physical review letters 113, 107203 (2014).
- Stasinopoulos et al. [2017] I. Stasinopoulos, S. Weichselbaumer, A. Bauer, J. Waizner, H. Berger, S. Maendl, M. Garst, C. Pfleiderer, and D. Grundler, Applied Physics Letters 111 (2017).
- Weiler et al. [2017] M. Weiler, A. Aqeel, M. Mostovoy, A. Leonov, S. Geprägs, R. Gross, H. Huebl, T. T. Palstra, and S. T. Goennenwein, Physical review letters 119, 237204 (2017).
- Barman et al. [2021] A. Barman, G. Gubbiotti, S. Ladak, A. O. Adeyeye, M. Krawczyk, J. Gräfe, C. Adelmann, S. Cotofana, A. Naeemi, V. I. Vasyuchka, et al., Journal of Physics: Condensed Matter 33, 413001 (2021).
- Chacon et al. [2018] A. Chacon, L. Heinen, M. Halder, A. Bauer, W. Simeth, S. Mühlbauer, H. Berger, M. Garst, A. Rosch, and C. Pfleiderer, Nature Physics 14, 936 (2018).
- Bannenberg et al. [2019] L. J. Bannenberg, H. Wilhelm, R. Cubitt, A. Labh, M. P. Schmidt, E. Lelièvre-Berna, C. Pappas, M. Mostovoy, and A. O. Leonov, npj Quantum Materials 4, 11 (2019).
- Aqeel et al. [2021a] A. Aqeel, J. Sahliger, T. Taniguchi, S. Mändl, D. Mettus, H. Berger, A. Bauer, M. Garst, C. Pfleiderer, and C. H. Back, Physical Review Letters 126, 017202 (2021a).
- Baral et al. [2023] P. R. Baral, O. I. Utesov, C. Luo, F. Radu, A. Magrez, J. S. White, and V. Ukleev, Physical Review Research 5, L032019 (2023).
- Qian et al. [2018] F. Qian, L. J. Bannenberg, H. Wilhelm, G. Chaboussant, L. M. Debeer-Schmitt, M. P. Schmidt, A. Aqeel, T. T. Palstra, E. Brück, A. J. Lefering, et al., Science Advances 4, eaat7323 (2018).
- Halder et al. [2018] M. Halder, A. Chacon, A. Bauer, W. Simeth, S. Mühlbauer, H. Berger, L. Heinen, M. Garst, A. Rosch, and C. Pfleiderer, Physical Review B 98, 144429 (2018).
- Tan et al. [2024] W. Tan, H. Jin, R. Fan, K. Ran, and S. Zhang, Physical Review B 109, L220402 (2024).
- Zhang et al. [2018a] S. Zhang, G. Van Der Laan, W. Wang, A. Haghighirad, and T. Hesjedal, Physical Review Letters 120, 227202 (2018a).
- Zhang et al. [2018b] S. Zhang, G. van der Laan, J. Müller, L. Heinen, M. Garst, A. Bauer, H. Berger, C. Pfleiderer, and T. Hesjedal, Proceedings of the National Academy of Sciences 115, 6386 (2018b).
- Jin et al. [2023] H. Jin, W. Tan, Y. Liu, K. Ran, R. Fan, Y. Shangguan, Y. Guang, G. van der Laan, T. Hesjedal, J. Wen, et al., Nano letters 23, 5164 (2023).
- Leonov et al. [2016] A. Leonov, Y. Togawa, T. Monchesky, A. Bogdanov, J. Kishine, Y. Kousaka, M. Miyagawa, T. Koyama, J. Akimitsu, T. Koyama, et al., Physical review letters 117, 087202 (2016).
- Aqeel et al. [2021b] A. Aqeel, M. Azhar, N. Vlietstra, A. Pozzi, J. Sahliger, H. Huebl, T. Palstra, C. Back, and M. Mostovoy, Physical Review B 103, L100410 (2021b).
- Milde et al. [2020] P. Milde, L. Köhler, E. Neuber, P. Ritzinger, M. Garst, A. Bauer, C. Pfleiderer, H. Berger, and L. M. Eng, Physical Review B 102, 024426 (2020).
- Pöllath et al. [2019] S. Pöllath, A. Aqeel, A. Bauer, C. Luo, H. Ryll, F. Radu, C. Pfleiderer, G. Woltersdorf, and C. H. Back, Physical review letters 123, 167201 (2019).
- Bos et al. [2008] J.-W. G. Bos, C. V. Colin, and T. T. Palstra, Physical Review B 78, 094416 (2008).
- Adams et al. [2012] T. Adams, A. Chacon, M. Wagner, A. Bauer, G. Brandl, B. Pedersen, H. Berger, P. Lemmens, and C. Pfleiderer, Physical review letters 108, 237204 (2012).
- Zhang et al. [2016a] S. Zhang, A. Bauer, H. Berger, C. Pfleiderer, G. Van Der Laan, and T. Hesjedal, Physical Review B 93, 214420 (2016a).
- Yu et al. [2010] X. Yu, Y. Onose, N. Kanazawa, J. H. Park, J. Han, Y. Matsui, N. Nagaosa, and Y. Tokura, Nature 465, 901 (2010).
- Yu et al. [2011] X. Yu, N. Kanazawa, Y. Onose, K. Kimoto, W. Zhang, S. Ishiwata, Y. Matsui, and Y. Tokura, Nature materials 10, 106 (2011).
- Aqeel et al. [2022] A. Aqeel, J. Sahliger, G. Li, J. Baas, G. R. Blake, T. T. Palstra, and C. H. Back, physica status solidi (b) 259, 2100152 (2022).
- Aqeel et al. [2014] A. Aqeel, I. J. Vera-Marun, B. J. van Wees, and T. Palstra, Journal of Applied Physics 116 (2014).
- Zhang et al. [2016b] S. Zhang, A. Bauer, D. Burn, P. Milde, E. Neuber, L. Eng, H. Berger, C. Pfleiderer, G. Van Der Laan, and T. Hesjedal, Nano letters 16, 3285 (2016b).
- Ukleev et al. [2022] V. Ukleev, C. Luo, R. Abrudan, A. Aqeel, C. Back, and F. Radu, Science and Technology of Advanced Materials 23, 682 (2022).
- Honda et al. [2020] T. Honda, Y. Yamasaki, H. Nakao, Y. Murakami, T. Ogura, Y. Kousaka, and J. Akimitsu, Scientific reports 10, 18596 (2020).
- Marchiori et al. [2024] E. Marchiori, G. Romagnoli, L. Schneider, B. Gross, P. Sahafi, A. Jordan, R. Budakian, P. R. Baral, A. Magrez, J. S. White, et al., Communications Materials 5, 202 (2024).
- Langner et al. [2014] M. Langner, S. Roy, S. Mishra, J. Lee, X. Shi, M. Hossain, Y.-D. Chuang, S. Seki, Y. Tokura, S. Kevan, et al., Physical review letters 112, 167202 (2014).
*
Appendix A Appendix
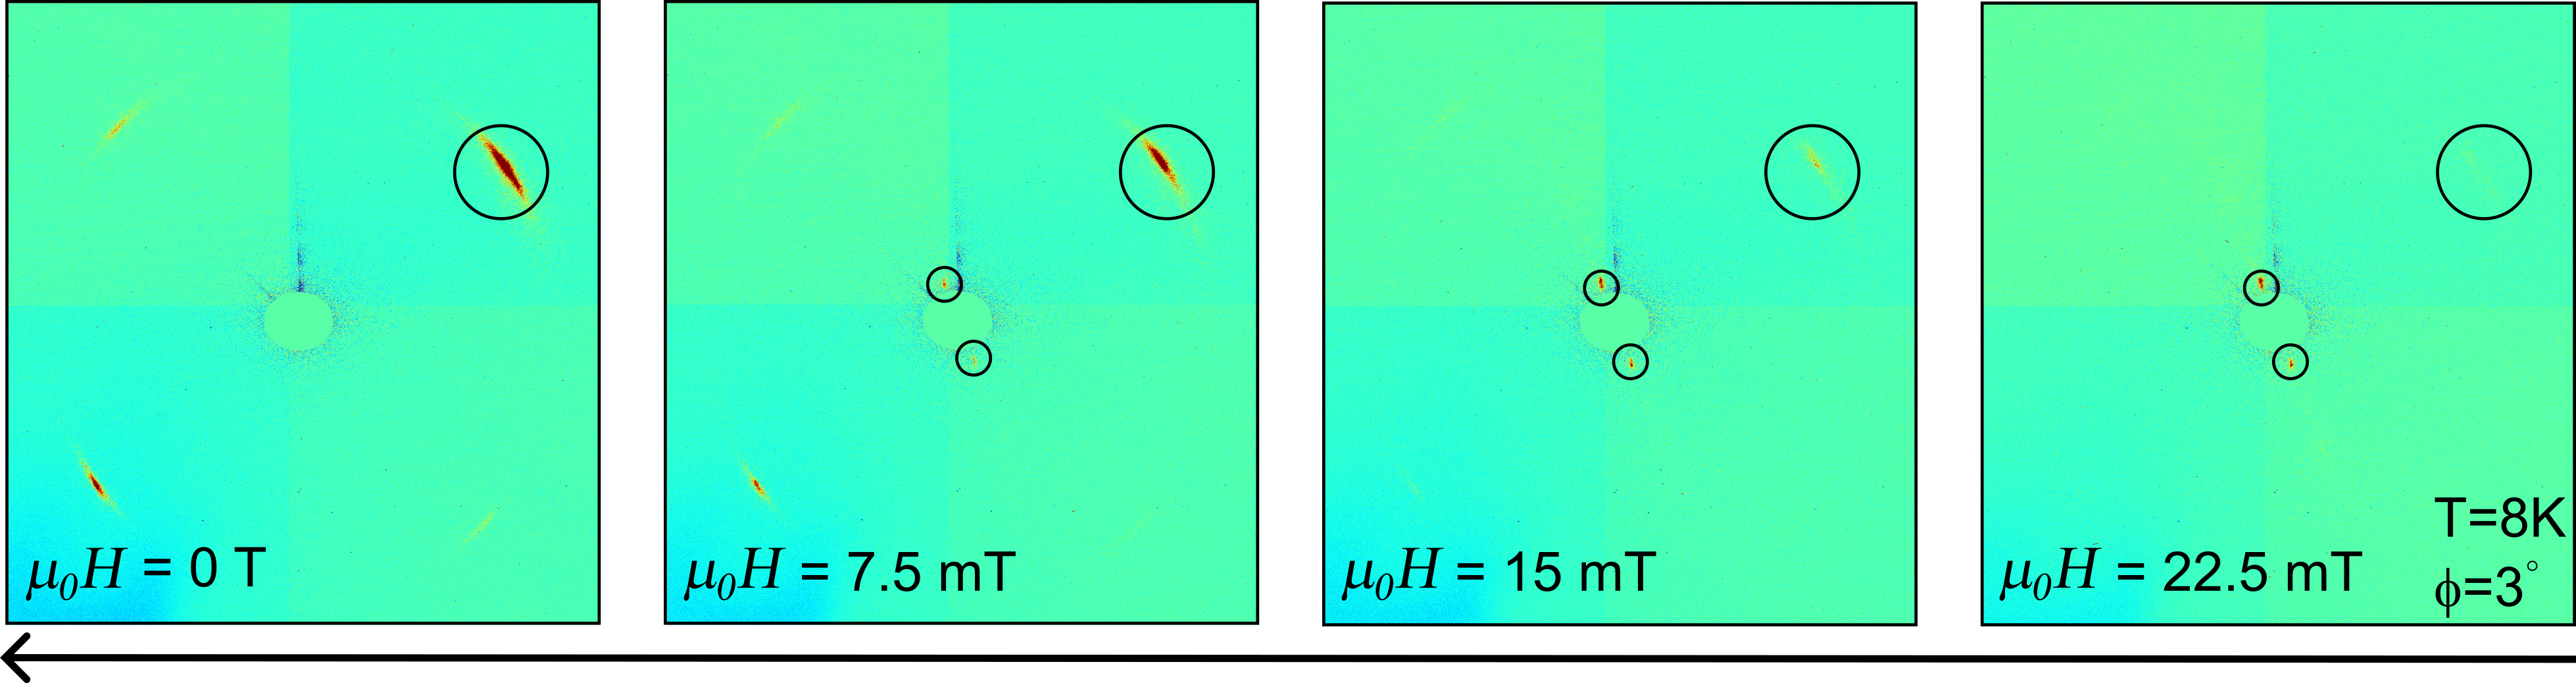
Figure 8 shows the REXS intensity pattern while the magnetic field is swept to zero at an angle of at 8K. We expect four magnetic satellites in the hk plane corresponding to the helical phase at low magnetic fields. When the magnetic field reaches 22.5 mT, these four peaks start to appear with low intensities, becoming more prominent as the magnetic field decreases to zero (see the large circle in figure 8). In our study, we observed these helical satellites along with the coexistence of distorted tilted conical (highlighted by small circles) within a narrow magnetic field range from 22.5 mT to 7.5 mT, but only when the magnetic field is swept from field-polarized to zero.
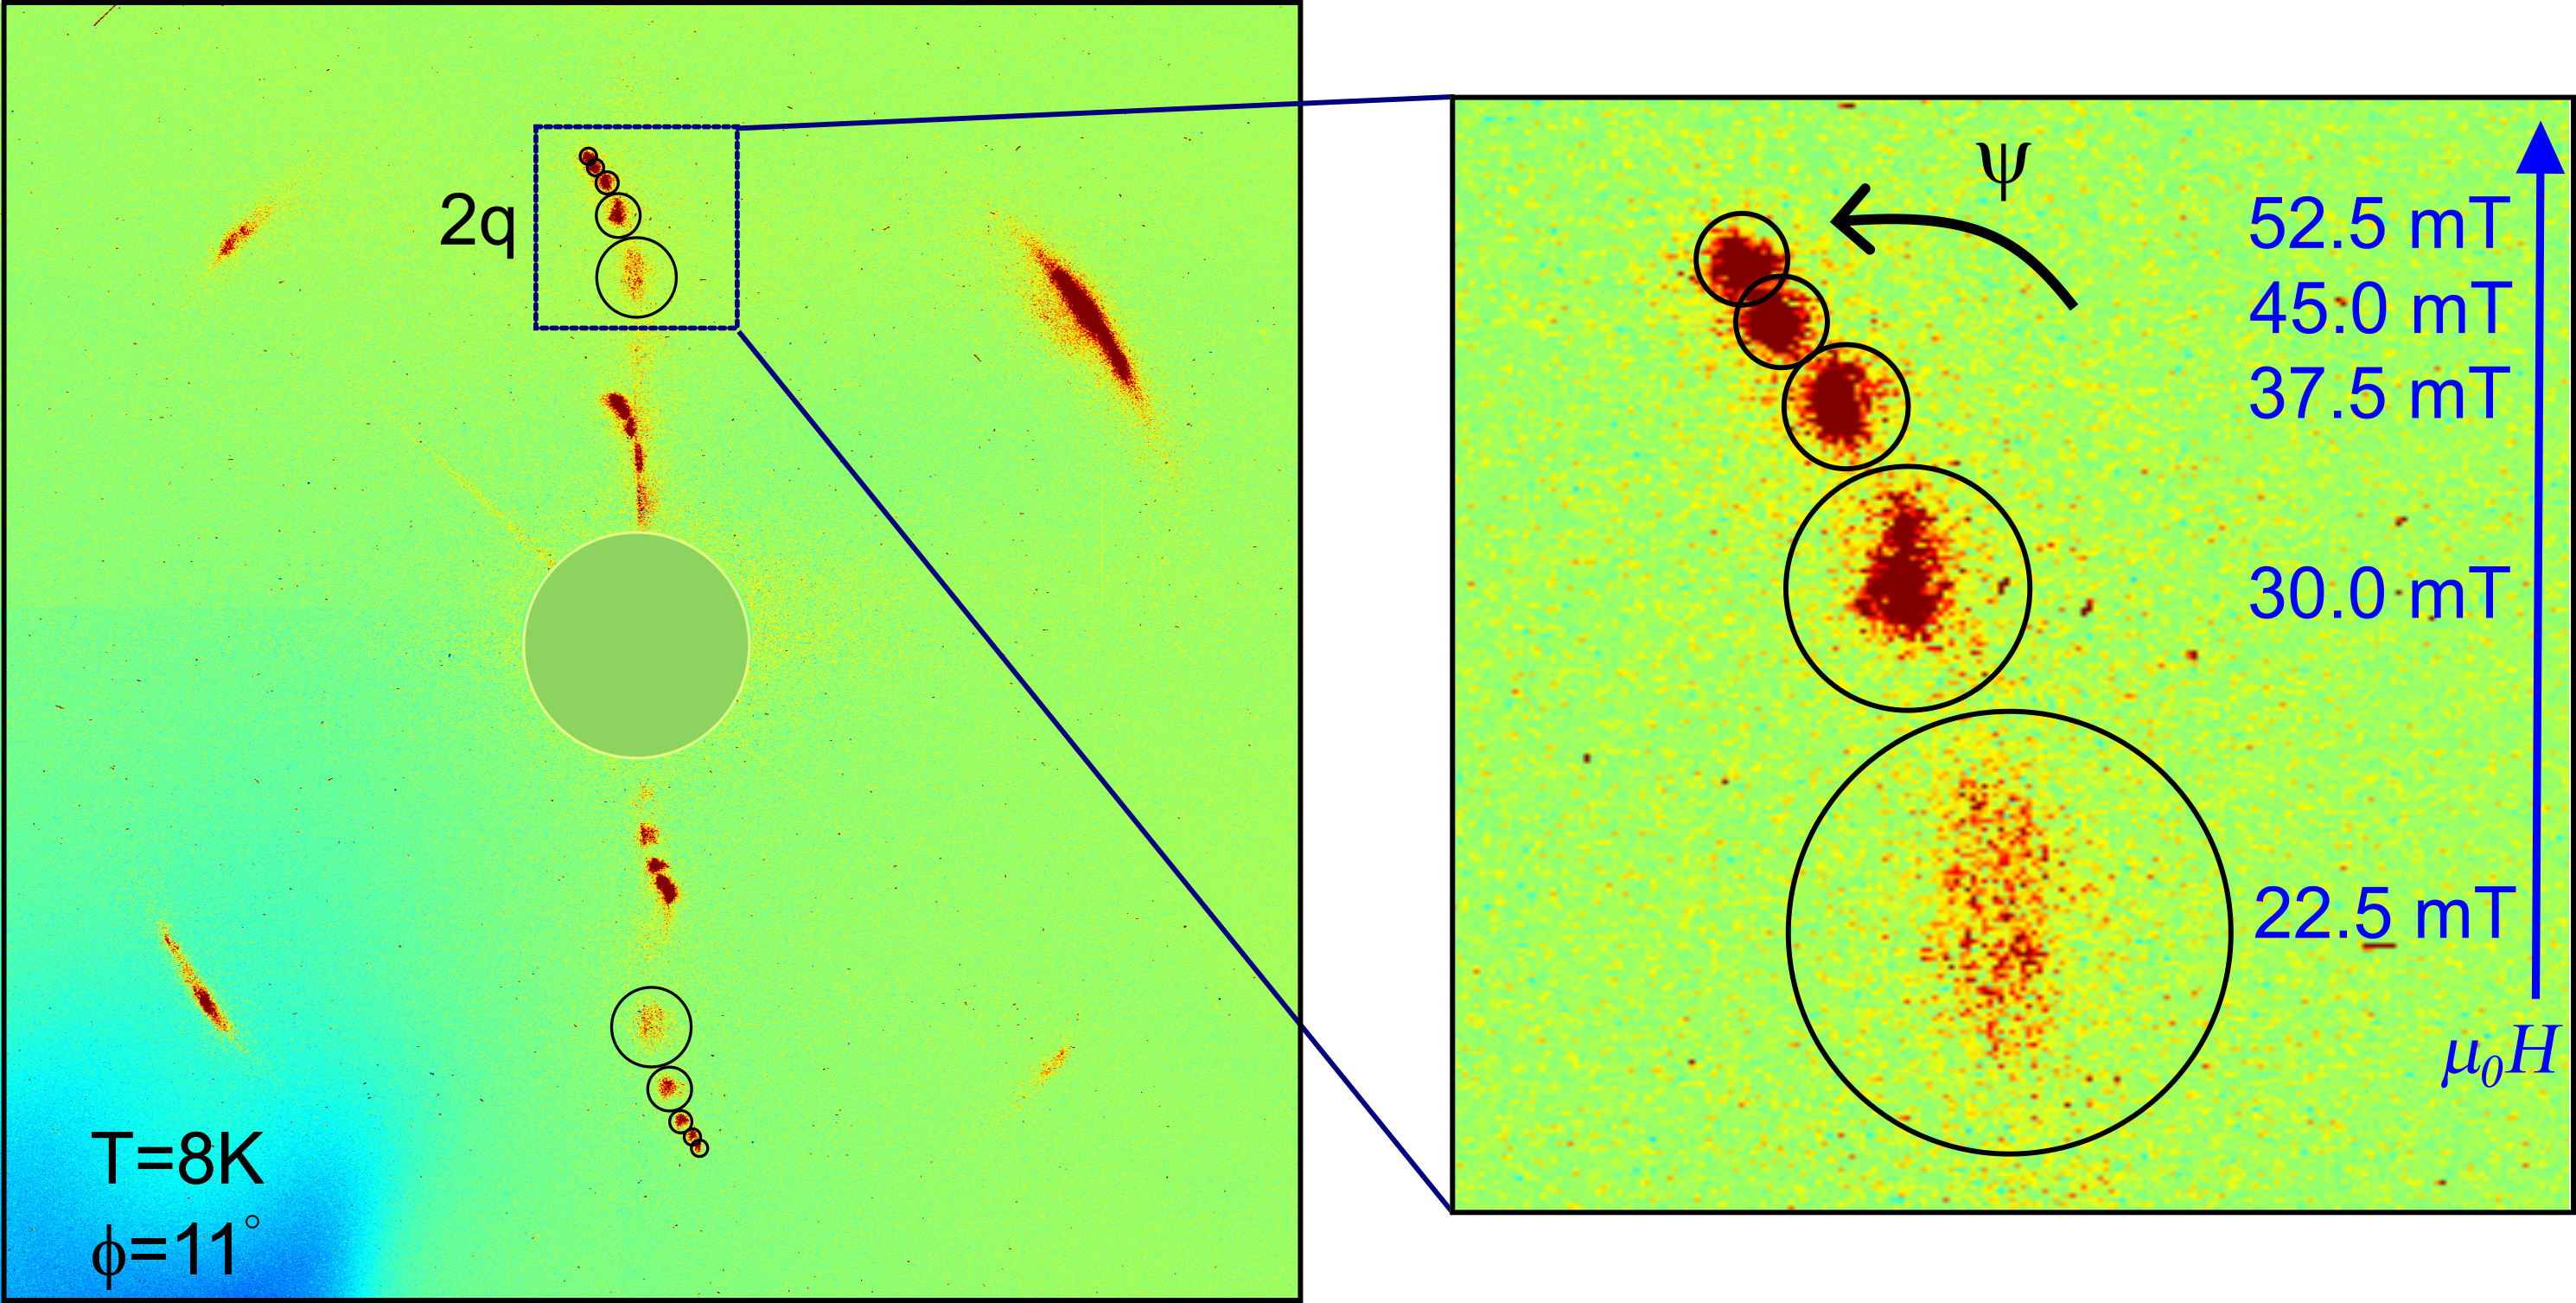
To study the evolution of the distorted tilted conical phase under varying magnetic field strengths, we compiled REXS intensity patterns from 0 T to 52.5 mT (9 instances), as shown in Figure 4 of the main manuscript. These patterns allow us to observe how the spiral structures respond to different magnetic field strengths. Initially, from zero magnetic field up to 15 mT, we observed only the four magnetic satellites associated with the helical state. This indicates that at lower magnetic fields, the system maintains a helical configuration without any noticeable transition to other states. As the magnetic field increases beyond 22.5 mT, the peak intensities of the distorted tilted conical phase become apparent. This marks a significant transition point where the magnetic field strength is sufficient to change the configuration of the spiral structures. At 22.5 mT, the q and 2q peaks align with the direction, forming a broad intensity spot highlighted by a large circle in figure 9. With further increases in the magnetic field, the propagation vector of the distorted tilted conical continues to gradually tilt away from the direction (). This tilting is accompanied by changes in the modulation q vector, as illustrated in Figure 5 of the main manuscript. For magnetic fields above 22.5 mT, the peak intensities become narrower, as indicated by the smaller circle in Figure 9. This narrowing suggests that the spiral structures are becoming more defined and possibly more stable under higher magnetic field strengths. This specific behavior has been observed only when sweeping the magnetic field from zero to a field-polarized state. The process of gradually increasing the magnetic field allows us to capture the transitions and reorientations of the spiral structures in detail. Moreover, from 52.5 mT to 100 mT, no changes were observed in the modulation vector or the propagation vector of the distorted tilted conical. This plateau indicates that the spiral structures have reached a stable configuration that does not further evolve with increasing magnetic field strength within this range.
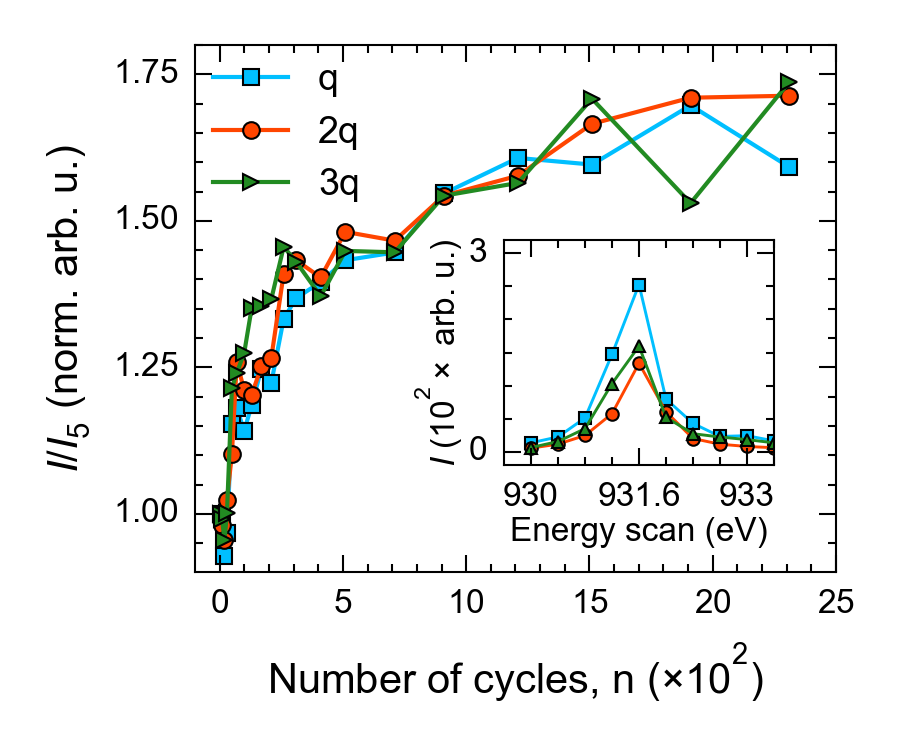
Figure 10 indicates an increase in the intensity of the peaks observed in the distorted tilted conical phase with magnetic field cycling in the range of 45 mT to 52 mT within the spiral magnetic phase. The field cycling impact on peak intensities of |q|,|2q|, and |3q| (first, second, and third harmonic, respectively) are shown after normalizing the corresponding intensities with the intensity observed after 5 cycles. The inset in figure 10 shows the intensity amplitude of the peaks as a function of X-ray beam energy that confirms the highest intensity occurs for the energy around L3 edge. Notably, the intensity starts at a baseline normalized value of 1 and demonstrates an initial rapid increase, reaching almost 1.5 after 500 cycles. Thereafter, the intensity exhibits a gradual rise, ultimately approaching a saturation point after 1500 cycles. Note that the intensities shown in figure 10 do not represent integrated intensity. Therefore, the observed increase in the peak intensity with field cycling can be just a relative increase at the measured spot.