Understanding the Structure and Resilience of the Brazilian Federal Road Network Through Network Science
University of Pernambuco,
Recife, Brazil
Federal Highway Police University
Florianópolis, Brazil
jcft@ecomp.poli.br
&
University of Pernambuco,
Recife, Brazil
fbln@ecomp.poli.br
&
Department of Computer Science
University of Exeter
Exeter, UK
r.menezes@exeter.ac.uk
Abstract
Understanding how transportation networks work is important for improving connectivity, efficiency, and safety. In Brazil, where road transport is a significant portion of freight and passenger movement, network science can provide valuable insights into the structural properties of the infrastructure, thus helping decision makers responsible for proposing improvements to the system. This paper models the federal road network as weighted networks, with the intent to unveil its topological characteristics and identify key locations (cities) that play important roles for the country through 75,000 kilometres of roads. We start with a simple network to examine basic connectivity and topology, where weights are the distance of the road segment. We then incorporate other weights representing number of incidents, population, and number of cities in-between each segment. We then focus on community detection as a way to identify clusters of cities that form cohesive groups within a network. Our findings aim to bring clarity to the overall structure of federal roads in Brazil, thus providing actionable insights for improving infrastructure planning and prioritising resources to enhance network resilience.
Keywords Complex Networks Road Network Network Science Resilience Brazil
1 Introduction
In the global economy, road infrastructures are a fundamental component because they are key in facilitating the movement of goods and people. Many countries rely heavily on road networks for the transport of commodities, with some nations being more dependent than others. For instance, in geographically vast countries with dispersed urban centres, road transport becomes essential for economic activities and regional connectivity.111Five of the six largest countries in area also rank among the top five in road network size. Source: https://en.wikipedia.org/wiki/List_of_countries_by_road_network_size (accessed: 25 October 2024).
Brazil’s dependence on roads is particularly significant, serving as the primary mode of transportation for freight (and passengers) across its extensive, and often difficult access, territory. The federal highways (henceforth called “roads”, given that they are not always highways, i.e., multiple lanes) play a crucial role in the development and integration of smaller cities. It has been shown that the efficiency and reliability of roads directly impact economic growth, social cohesion, and access to services [24, 17].
Brazil’s has a specific police force responsible for federal roads: the Federal Highway Police (Polícia Rodoviária Federal, PRF). They are responsible for about 75,000 kilometres of roads out of the nearly 2 million km total [14]. While this sounds small compared to the total, they are the main arteries of road transportation in Brazil; 60% of goods are transported using the federal road structure making its connectivity [8] crucial to the country.
According to the Brazilian constitution [16], the PRF is responsible for patrolling federal roads, enforcing traffic laws, and ensuring the road safety. Their duties include accident prevention, combating criminal activities, and providing assistance to motorists, which are vital for maintaining the operational integrity of the nation’s road network, among others. While the PRF is very knowledgeable about the road infrastructure, this knowledge is often distributed, not providing a holistic view of the infrastructure. By analysing network structures, authorities can identify critical nodes and links that require investment, improvement, or even more policing.
While the construction of new federal roads is relatively infrequent in Brazil (the country continues to depend heavily on infrastructure investments made in the 1960s and 1970s [8], see Section 3), understanding the structure of the existing network is paramount. The network’s structural properties are influenced by factors such as human mobility patterns [4], population in neighbouring cities, and various events including festivals, religious activities, holidays, and freight logistic decisions. These factors can lead to changes in the significance and utilisation of specific roads, highlighting the importance of a comprehensive structural analysis. In this study, we model the Brazilian federal road network using the 546 largest cities as nodes; medium and large cities as per the Brazilian Geography and Statistics Institute (IBGE)[11].
2 Transportation Networks
Transportation networks are a critical aspect of modern society, and intrinsically linked to economic growth and social development. They facilitate the movement of goods, services, and people, thereby connecting markets and fostering globalisation [29]. The structure and dynamics of these networks is an essential part of the process of improving efficiency, resilience, and sustainability around the world.
Over the past few decades, the world has effectively become smaller due to advancements in transportation and communication technologies. This phenomenon, often referred to as the “time-space convergence,” implies that the relative distance between places decreases as connectivity improves [20]. For example, the average transatlantic travel time for freight shipments in the 1800s was about 30 days, while today is about 8 hours. While increased connectivity offers benefits, it also presents concerns. Faster transportation networks can facilitate the rapid spread of diseases, as evidenced by the global transmission of pandemics like COVID-19 [13]. Similarly, invasive species (e.g., plants, animals) can spread more easily through connected pathways, disrupting ecosystems and sometimes even local economies [21].
Network Science has been instrumental in modelling transportation networks, offering tools and methods to analyse their complex structures and dynamics [27]. Numerous studies have employed network theory to investigate various modes of transportation and spatial networks [6], providing insights into their topology, robustness, and vulnerability. For instance, air transportation networks have been extensively studied due to their global importance [19, 23]. Rail networks have also been a subject of interest with indications that these networks have small-world properties, identifying its structural characteristics and the implications for efficiency and robustness [30, 25]. In maritime transport, Kaluza et al. [22] studied the global cargo ship network, highlighting patterns in maritime traffic and their environmental impact.
In addition to air, rail and maritime studies, there has been significant work in urban road networks [1, 3, 12] but comparatively fewer investigations into country-wide road networks [34, 33], especially in the context of the Global South and large-scale countries. Road networks are particularly crucial in such regions due to their role in regional connectivity and economic development, where other forms of transport may be less developed or accessible.
In this paper, we focus on the Brazilian Federal Road Network (BFRN) using Network Science methodologies. By describing its structural properties, we aim to provide insights that can inform data-driven decisions for infrastructure development, policymaking, and strategic planning.
3 Data and Methods
Brazil is the largest country in South America and the fifth largest in the world, covering an area of approximately 8.5 million square kilometres. Due to its vast size and diverse geography, efficient transportation infrastructure is essential for economic development and national integration. However, Brazil lacks connectivity via rail and often many locations are not connected via airports, which make the road network crucial to many of the country’s regions.
The federal roads in Brazil are under the jurisdiction of the federal government and serve as the main arteries linking major cities, ports, airports, strategic areas, and even to neighbouring countries. The primary purpose of these roads is to promote national connectivity, support economic activities, and ensure access to all areas of the country.
The development of the Brazilian road network happened mostly in mid-20th century, particularly during the 1950s and 1960s [31]. Brazil investment can be supported by economic theories which suggest that improved transportation infrastructure leads to reduced product costs, increased trade, and regional development [2].
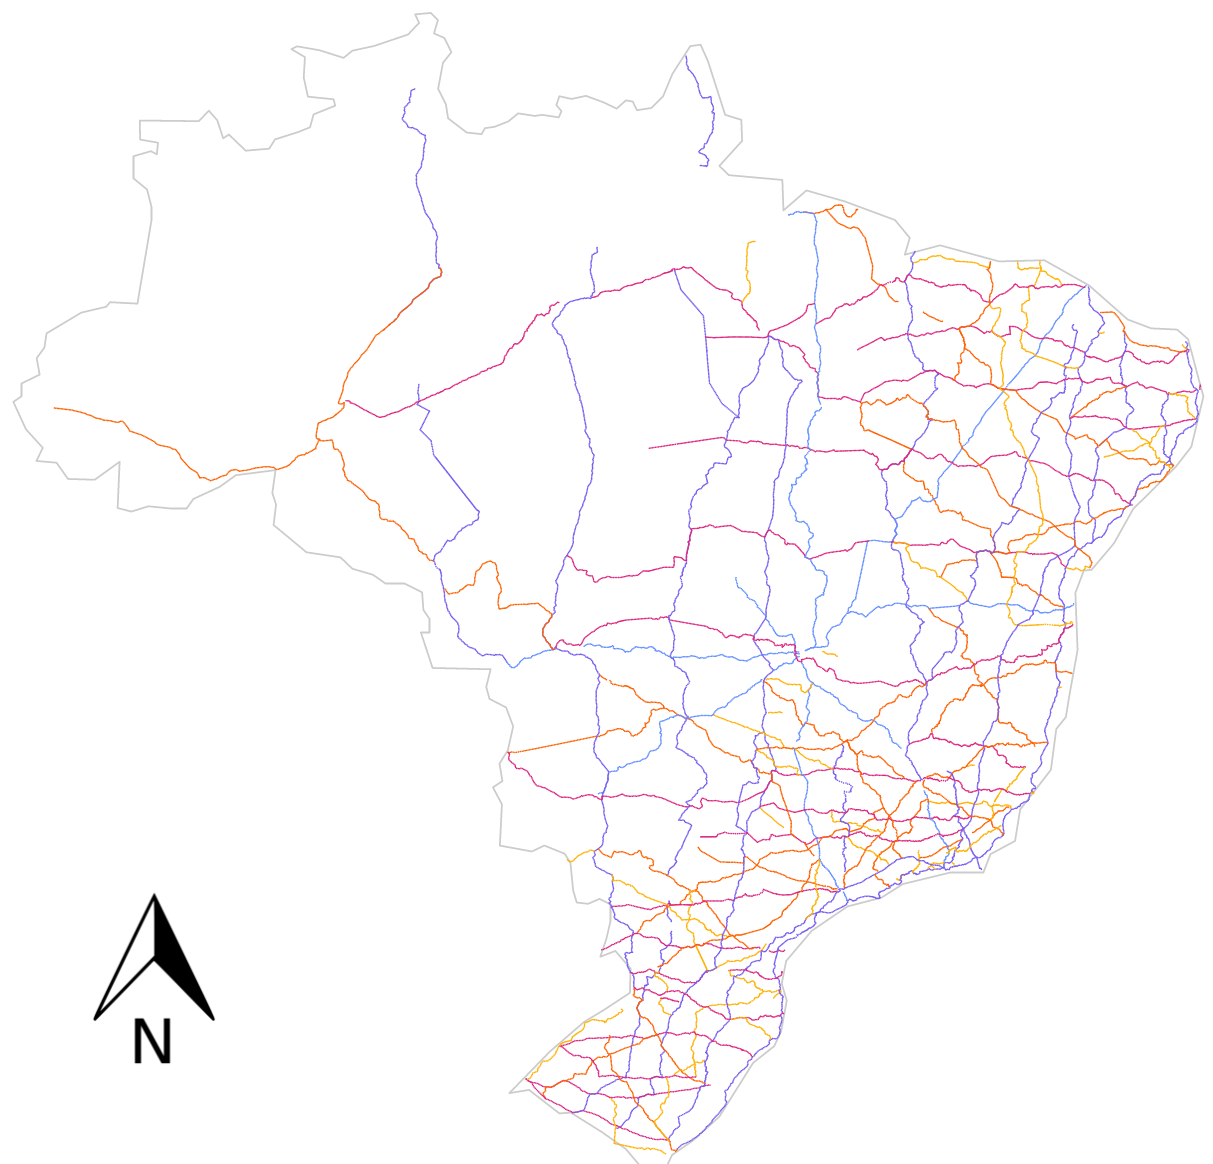
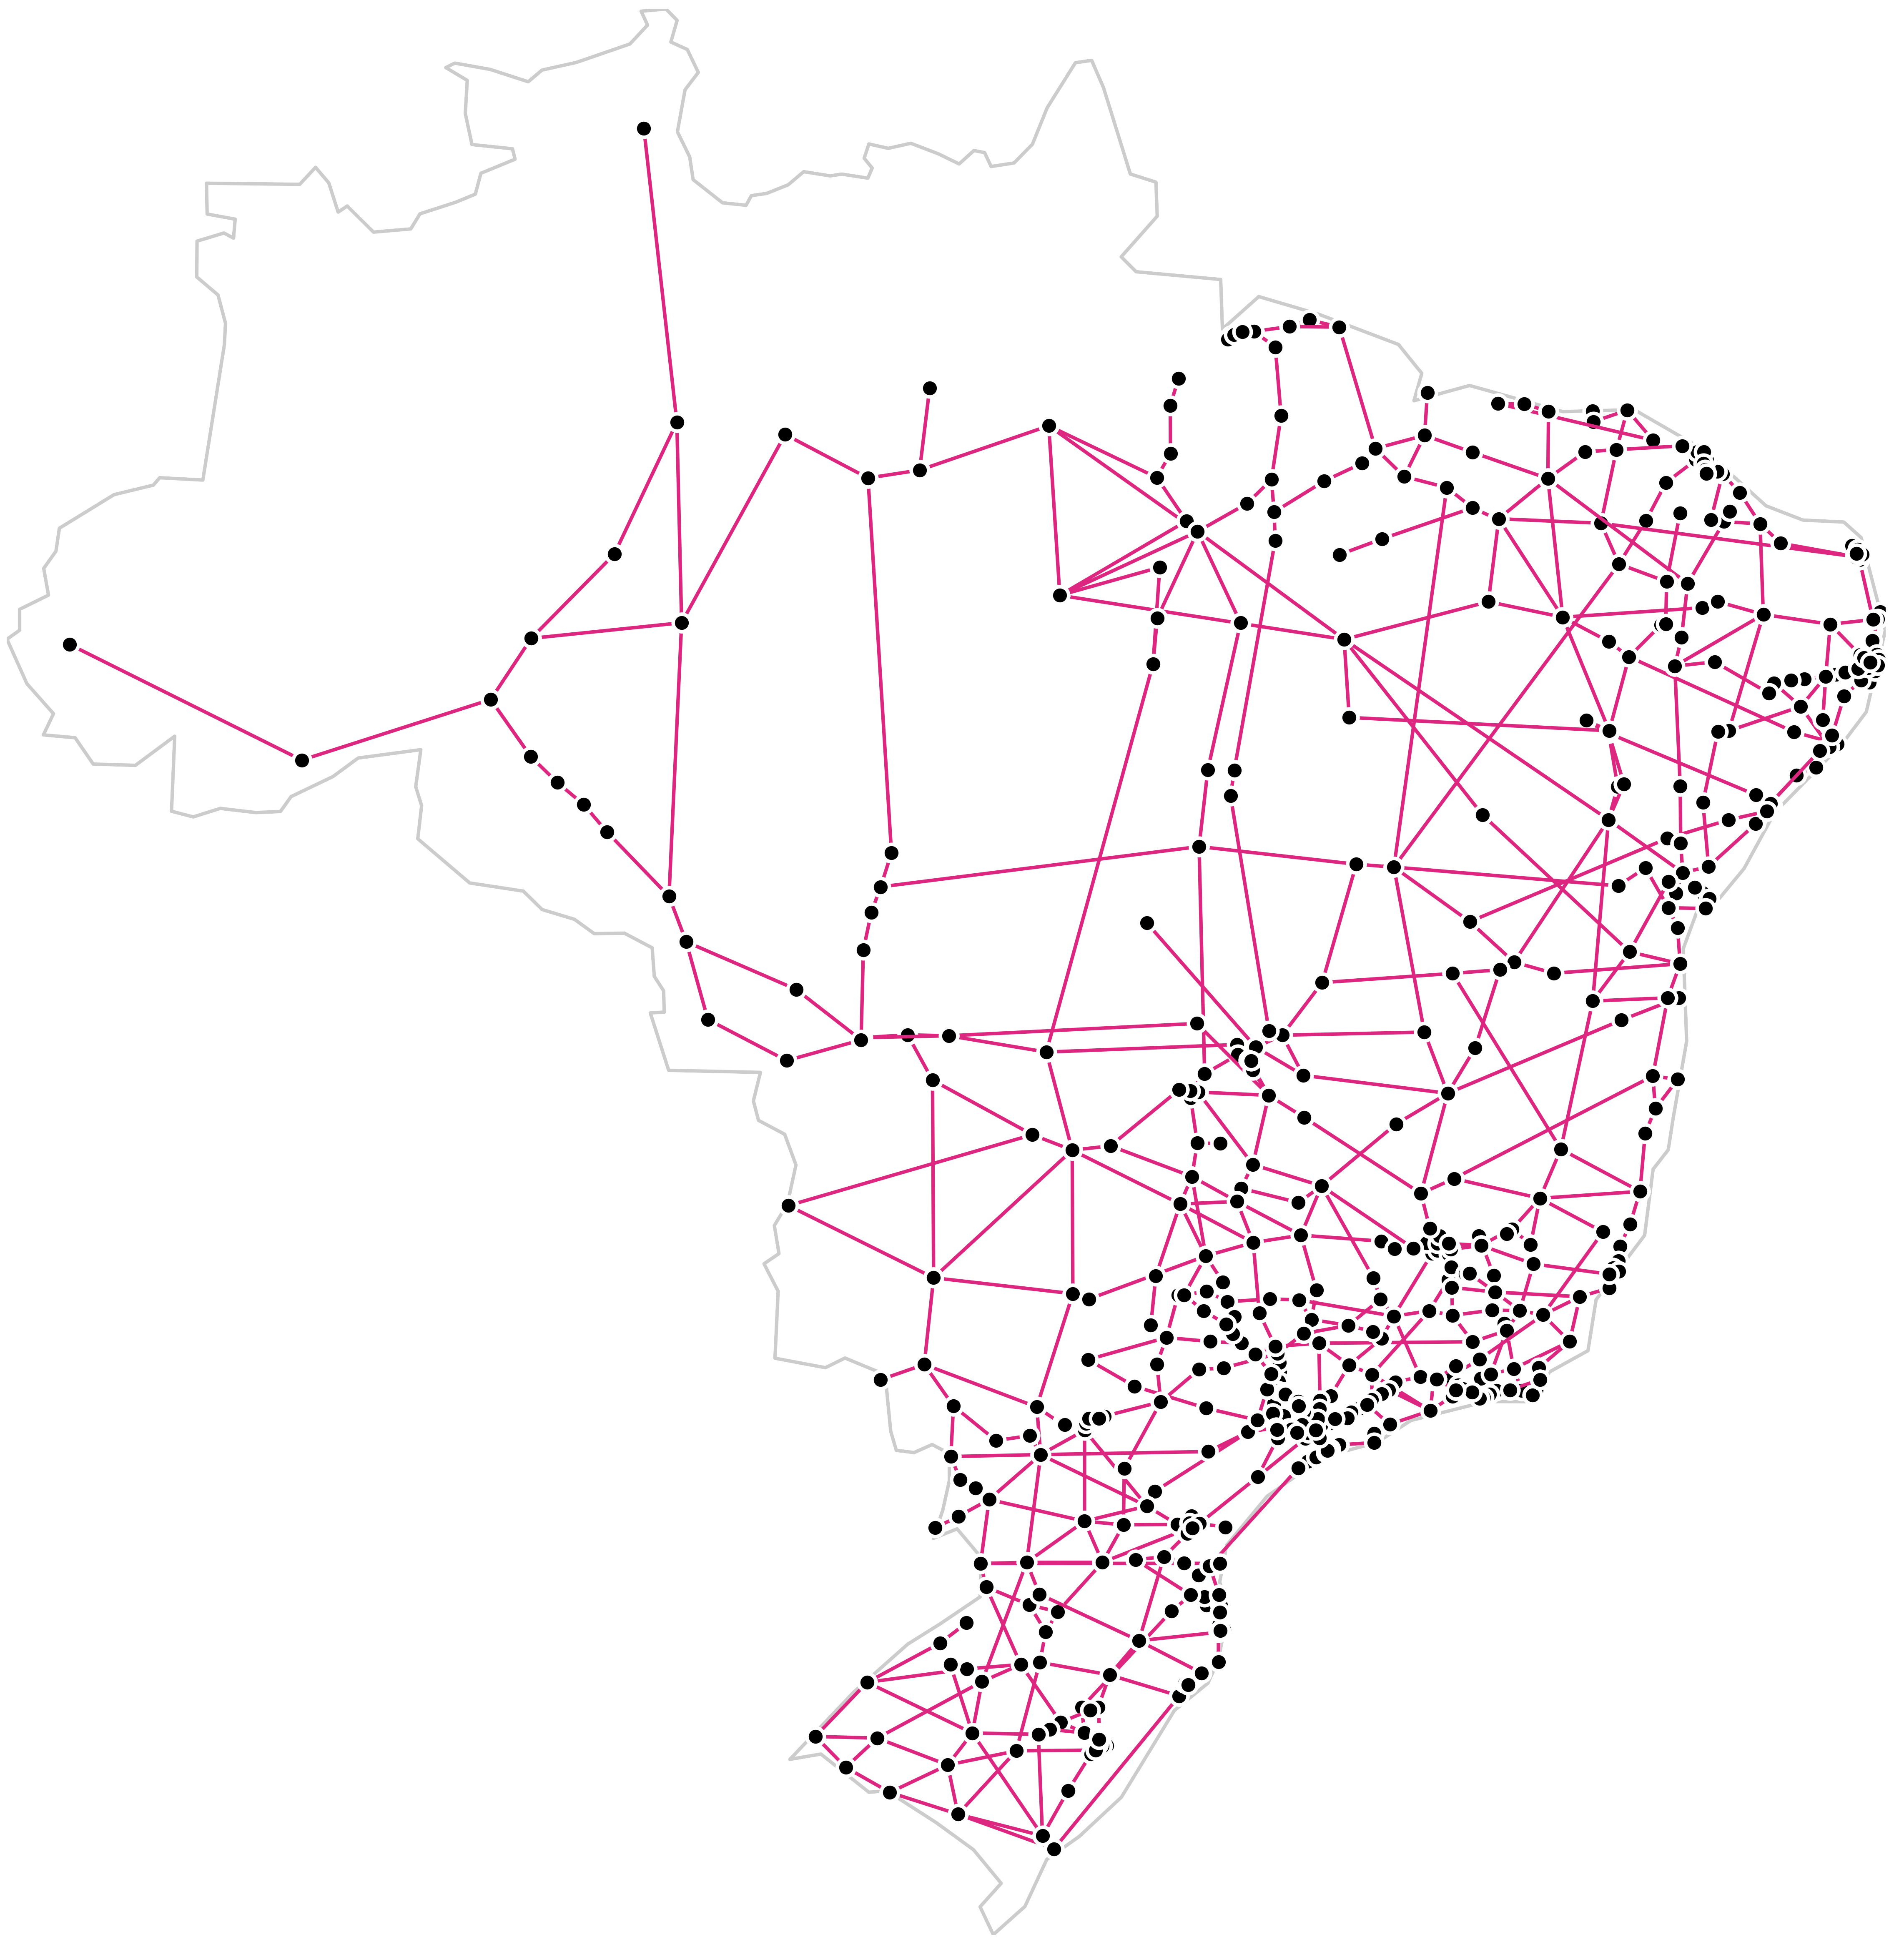
The Brazilian federal road infrastructure comprises approximately 75,000 kilometres of roads [9]. These are named according to a system that reflects their general direction and geographic location, as shown in Table 1. The roads are depicted in Figure 1 (left), and the colours represent the different types of roads.
| Road Type | General Format | Colour | Example | Description |
|---|---|---|---|---|
| Radial | BR-0XX | BR-010, BR-020 | Roads from Brasília to country’s edges | |
| Longitudinal | BR-1XX | BR-101, BR-116 | Roads oriented N-S | |
| Transversal | BR-2XX | BR-222, BR262 | Roads oriented E-W roads | |
| Diagonal | BR-3XX | BR-365, BR-319 | Roads oriented NW-SE or NE-SW | |
| Connecting | BR-4XX | BR-407, BR488 | Generally connect federal roads |
For modelling the proposed networks, we used several datasets. The road structure was obtained from the National Road System (NRS) [26], which provides georeferenced data for each kilometre of all Brazilian federal roads. From this dataset, we extracted information such latitude, longitude, and cities along the way. This dataset includes more than 130,000 geographic positions and was collected in 2022.
We also incorporated information about all 5,570 cities in Brazil, including their populations as collected in 2022 by the Brazilian Institute of Geography and Statistics (IBGE) [11]. We utilised traffic incident data collected by the PRF, available through their open data portal [10]. This database contains over 485,000 incident records between 2017 and 2023, providing details such as date, time, number of people involved, injuries, location, to name a few.
For modelling the nodes, we selected cities classified by the IBGE as medium or large, with populations of at least 50,000 people [11]. Brazil has a total of 5,570 cities, of which 3,126 are intersected by a federal road. The 544 selected cities have approximately 125 million residents, representing 76% of the 164 million people residing in all cities traversed by federal road. In order to generate a consistent, we included an additional 30 small cities that are important for connecting roads (e.g., crossing points), resulting in a total of 574 cities. The nature of the Brazilian road network system, is that some of these cities are isolated and not part of the connected network of cities. Hence, we are left 546 cities which form the basis of the BFRN (and variations); the network giant component.
The edges in our network represent the roads linking the 546 selected cities. We utilised the NRS data, which contains information for each kilometre of road, to calculate the distances, number of cities, population, and incidents between pairs of cities. This calculation includes the end point as part of the weight; for instance, the population of people living between city A and city B, includes the population of A and B. Figure 1 (centre) illustrates the road network, more specifically the giant component of the network which we call BFRN.
We consider different weights in the structural analysis in this paper, giving rise to four weighted networks:
-
•
BFRN: The road network using the distance as weight of the edges. This is essentially the network show in Figure 1 (centre).
-
•
cBFRN: The same nodes as BFRN but using the number of cities between the nodes as weight of the edges. For example, if between cities and we have cities, the weight of the edge because the end points count for the weight.
-
•
pBFRN: Weights here represent the total population in the cities in the cBFRN for that particular segment.
-
•
iBFRN: Weights here represent the number of incidents that happened in-between the cities for the entire period of the study.
Table 2 shows some basic measurements on the four networks. The number of nodes (), edges (), and average degree () do not change, and hence it is only shown for the BFRN. All the other measures are specific for each network.
| Metric | BFRN | cBFRN | pBFRN | iBFRN |
| Number of Nodes () | 546 | |||
| Number of Edges () | 761 | |||
| Average Degree () | 2.78 | |||
| Weighted Distribution Exponent () | 1.78 | 1.76 | 1.73 | 1.45 |
| Average Shortest Path () | 1,784 | 75 | 4,324,144 | 130 |
| Diameter () | 5,768 | 213 | 22,902,144 | 45,659 |
| Modularity () | 0.852 | 0.842 | 0.867 | 0.887 |
4 Characterisation and Results
The goal in this paper is to characterise the Brazilian road network, leading to a better clarity of the infrastructure. Yet, there are contextual information that need to be mentioned because of the four weight variations used. In the BFRN the network can be used to understand hubs, effective paths, and more importantly how changes to this can lead to better efficiency in transportation times and fuel consumption; distance is highly correlated to travel time. In the cBFRN, one can concentrate on the identification of urban corridors as a function of the settlements, emergency planning, and planning of road maintenance making sure most cities remain connected at all times. A variation of this is the pBFRN where population of the cities are considered instead. In the pBFRN the analysis of paths (shortest) can demonstrate areas that are less populated and hence routes that may be maintained less often. Last, and relatively different from the others, is the iBFRN where the weights represent the number of incidents (i.e., deaths, injuries, driving under the influence). However, the specific applications described above fall outside the scope of this paper. Here we focus on identifying structural properties of these networks.
4.1 Weighted Degree Distributions
In spatial networks, nodes are embedded in physical space, and connections between them are constrained by geographical proximity. This spatial embedding imposes limitations on the number of connections a node can have, leading to degree distributions that are generally more homogeneous and do not follow a power-law distribution typically seen in other types of complex networks [6, 18].
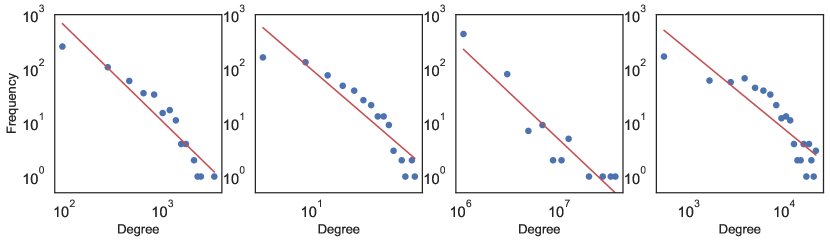
When weights are assigned to the edges of spatial networks; representing attributes such as distances, the distribution of weighted degrees (also known as node strengths) can provide additional insights into the network’s structure and functionality. With weighted edges, the degree distributions in spatial networks like road networks may follow power laws [5] defined as , where represents the weighted degree of a node. For our networks, the power law fitting leads to values of which shows that the networks are extremely hub-dominated, which is generally a sign of vulnerability.
In the context of the BFRN, examining the weighted degree distribution is essential for several reasons. When weights represent distances between cities, the distribution can highlight central nodes that are geographically significant due to their numerous or lengthy connections and perhaps some level of isolation given the other cities considered (with significant population) are far away. If weights represent the number of intermediate cities (cBFRN), the distribution uncovers nodes that are endpoints of urban corridors, indicating potential areas of high socio-economic activity or congestion. When considering weights as the total population served by each segment (pBFRN), the weighted degree distribution helps identify cities that are crucial for connecting large populations, or cities for which a large fraction of the population depend on the road as an economic drive. Lastly, with weights representing the number of incidents (iBFRN), the distribution can pinpoint nodes that are hotspots for accidents, guiding targeted safety interventions and resource allocation to ensure the police can quickly respond to these incidents.
Table 3 shows the 5 cities with the maximum and minimum weights. It is worth noting the 2 largest cities in Brazil are on the highly ranked in the pBFRN, which happens because of the artifact that their population counts for the weight of the edges they have. In fact, we see two other cities are part of the great São Paulo: Osasco and Guarulhos. Other points to observe is the correlation between the BFRN and cBFRN. We found that cities that have long distance roads attached to them are also the ones with several intermediate cities. Last, we see that the cities featuring in high ranks in the iBFRN are not the ones with high population weight, leading to the idea that incidents may be related to other issues such as road quality and geographical accidents.
| Rank | BFRN | cBFRN | pBFRN | iBFRN | ||||
|---|---|---|---|---|---|---|---|---|
| Max | Min | Max | Min | Max | Min | Max | Min | |
| 1 | Barreiras | Belém | Barreiras | Vitória | Osasco | Camocim | Registro | Rio Claro |
| 2 | Balsas | Vitória | Campo Mourão | Jandira | São Paulo | Três Passos | Piraquara | Brusque |
| 3 | Jacobina | Jandira | Jacobina | Aracaju | Rio de Janeiro | Caldas Novas | Betim | Valença |
| 4 | Gurupi | Itapevi | Balsas | Florianópolis | Guarulhos | Cametá | Brasília | Cabo Frio |
| 5 | Barra do Garças | Aracaju | Picos | Brusque | Brasília | Grajaú | Lages | Cametá |
Overall, understanding the weighted degree distribution allows for a holistic analysis of the network’s topology and its implications. It helps in identifying critical nodes whose failure or inefficiency could disproportionately affect the network’s functionality. This knowledge is vital for enhancing network robustness, optimizing traffic flow, improving safety measures, and supporting strategic planning and policymaking aimed at improving the transportation infrastructure. Figure 2 shows the degree distribution for each of the four networks considered.
While individual cases for cities are important in decision-making, understanding the distribution of these degrees is also fundamental to a holistic view of the vulnerability. Table 3 shows that the networks appear to be super-hub dominated. The distributions are depicted in Figure 2
4.2 Diameter and Paths
The diameter of a weighted network, is defined as the longest shortest path between any pair of nodes, taking into account the weights assigned to the edges, as below:
where is the weighted shortest path length between cities and .
It represents the maximum cumulative weight that must be traversed to connect the most distant nodes in terms of the chosen weighting scheme. The diameter provides insights into the extent of the network’s reach, potential bottlenecks, and areas where connectivity may be limited or require improvement. The values for all the networks are shown in Table 2.
In the context of the BFRN, where the weights represent the distances between cities, the diameter signifies the greatest cumulative distance that must be covered to travel between the two most distant cities along the shortest possible route. This metric reflects the maximum physical separation in the network and can be used to assess the efficiency of national connectivity. Brazil, being a continental country with complex geographical features such as vast rivers, mountain ranges, and dense rainforests, inherently imposes lower bounds on these measures. For instance, the calculated diameter of the BFRN is 5,768 kilometres, which exceeds the actual maximum straight-line distances across Brazil: 4,394 kilometres from the northernmost point at the Monte Caburaí in Roraima to the southernmost point at Arroio Chuí in Rio Grande do Sul.
For the cBFRN, with weights representing the number of cities between each pair of connected cities, the diameter indicates the maximum number of cities that must be traversed along the shortest path between any two cities. This interpretation sheds light on the longest sequence of urban centres encountered on the most direct route, providing insights into urban density and regional development patterns. It can help identify corridors that connect numerous communities, potentially highlighting areas which could benefit from economic activity around transportation. For Brazil, there this diameter is 213 cities. This could be seen in conjunction to the actual population seen in the pBFRN, where weights denote the total population benefited by each segment, the diameter reflects the largest cumulative population connected along the shortest path between any two cities which for Brazil is about 22.9 million people which says that the diameter involves around 10% of the entire Brazilian population (214 million people).
Last, in the iBFRN, the diameter represents the highest cumulative number of incidents encountered along the safest (least incident-prone) path between any two cities. This metric identifies the pair of cities for which even the safest route involves traversing segments with a high total number of incidents, highlighting potential areas of concern for road safety. The cumulative value for this diameter is more than 45 thousand incidents; indicating that some of the roads are quite dangerous, with about 18 incidents per day for the 7-year period studied.
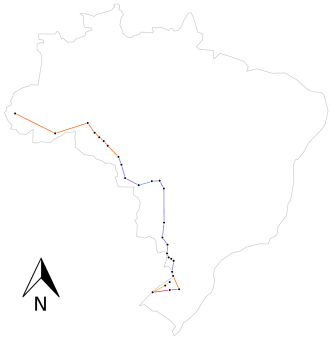
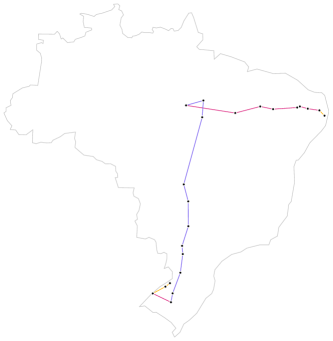
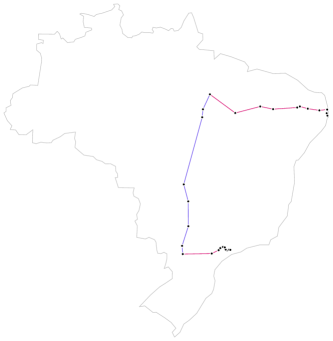
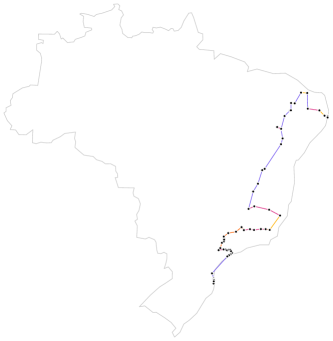
Figure 3 shows the diameters for the four networks studied using the colours defined in Table 1. Two things are worth noting, the significant difference between the BFRN and the iBFRN, with the latter being concentrated on the more populated area of the country. The second is that there is a strong correlation between the cBFRN and the pBFRN with the main difference being that the pBFRN naturally gravitates to the city of São Paulo given its large population.
4.3 Community Detection
Community detection is a fundamental aspect of network analysis, aiming to uncover the underlying structure of a network by identifying groups (communities) of nodes that are more densely connected internally than with the rest of the network. This process is essential for understanding the modular organisation of complex systems, revealing how entities interact within and across different subgroups.
Here we use the Louvain method [7] which is a widely used algorithm for community detection due to its efficiency and ability to handle large and weighted networks. It operates by maximising the modularity of the network, in our case the weighted modularity, , a measure that quantifies the quality of a particular division of the network into communities [28]. By considering edge weights, the Louvain method can detect communities that reflect not only the topology of the network but also the intensity of interactions between nodes (from weights).
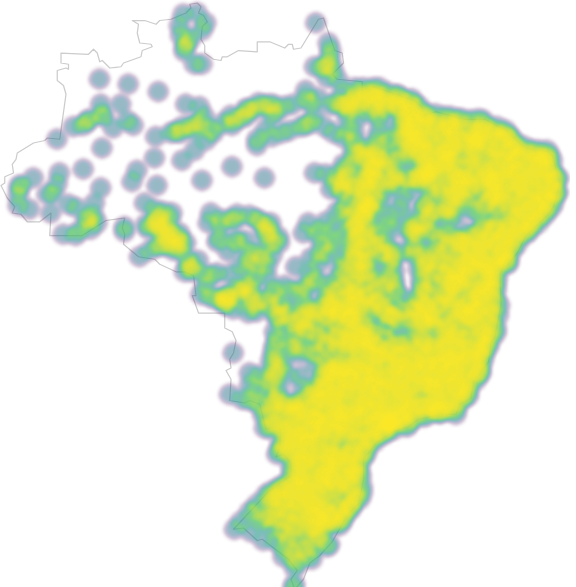
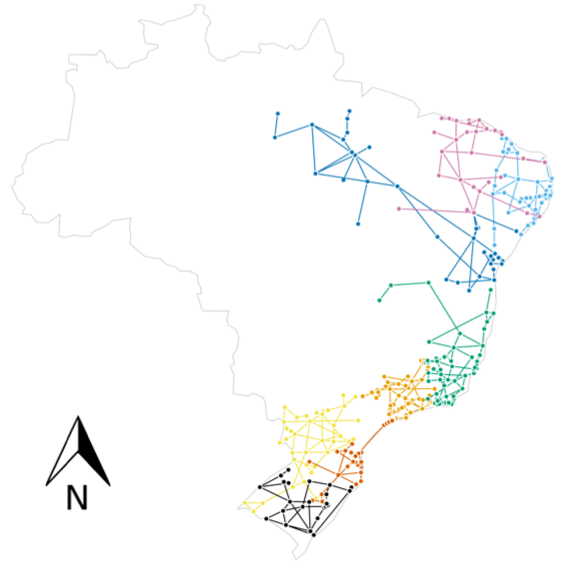
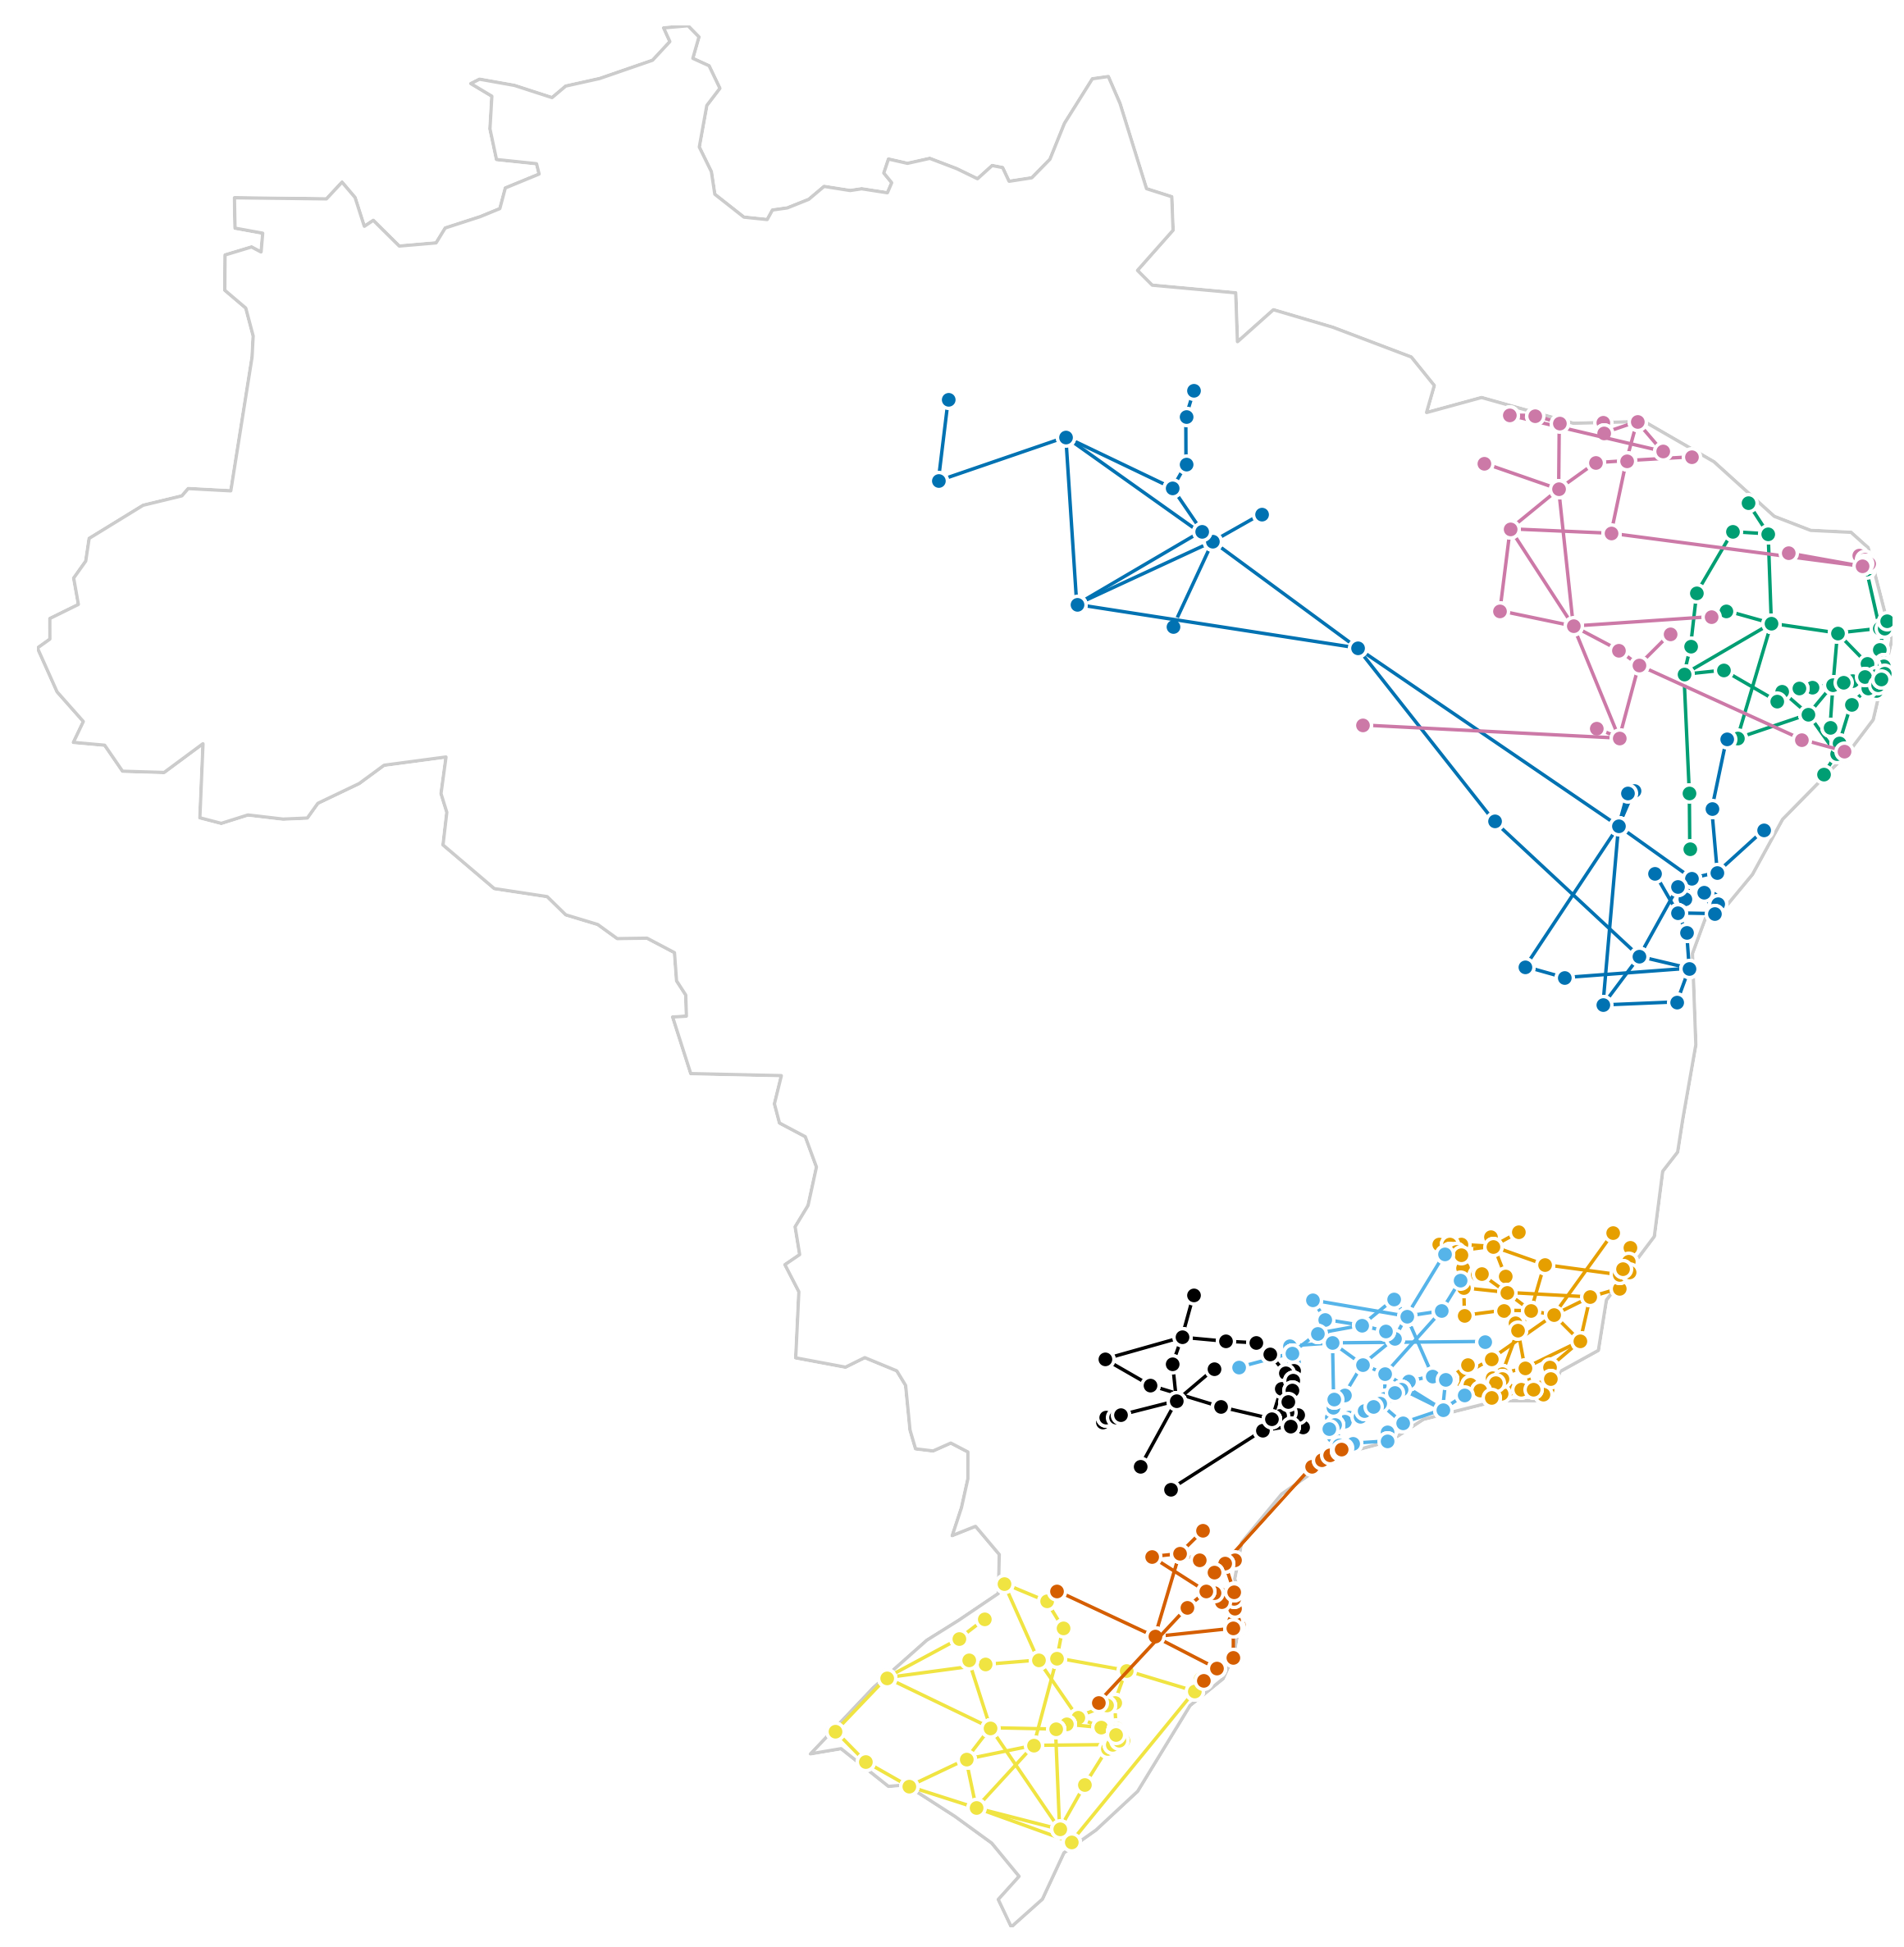
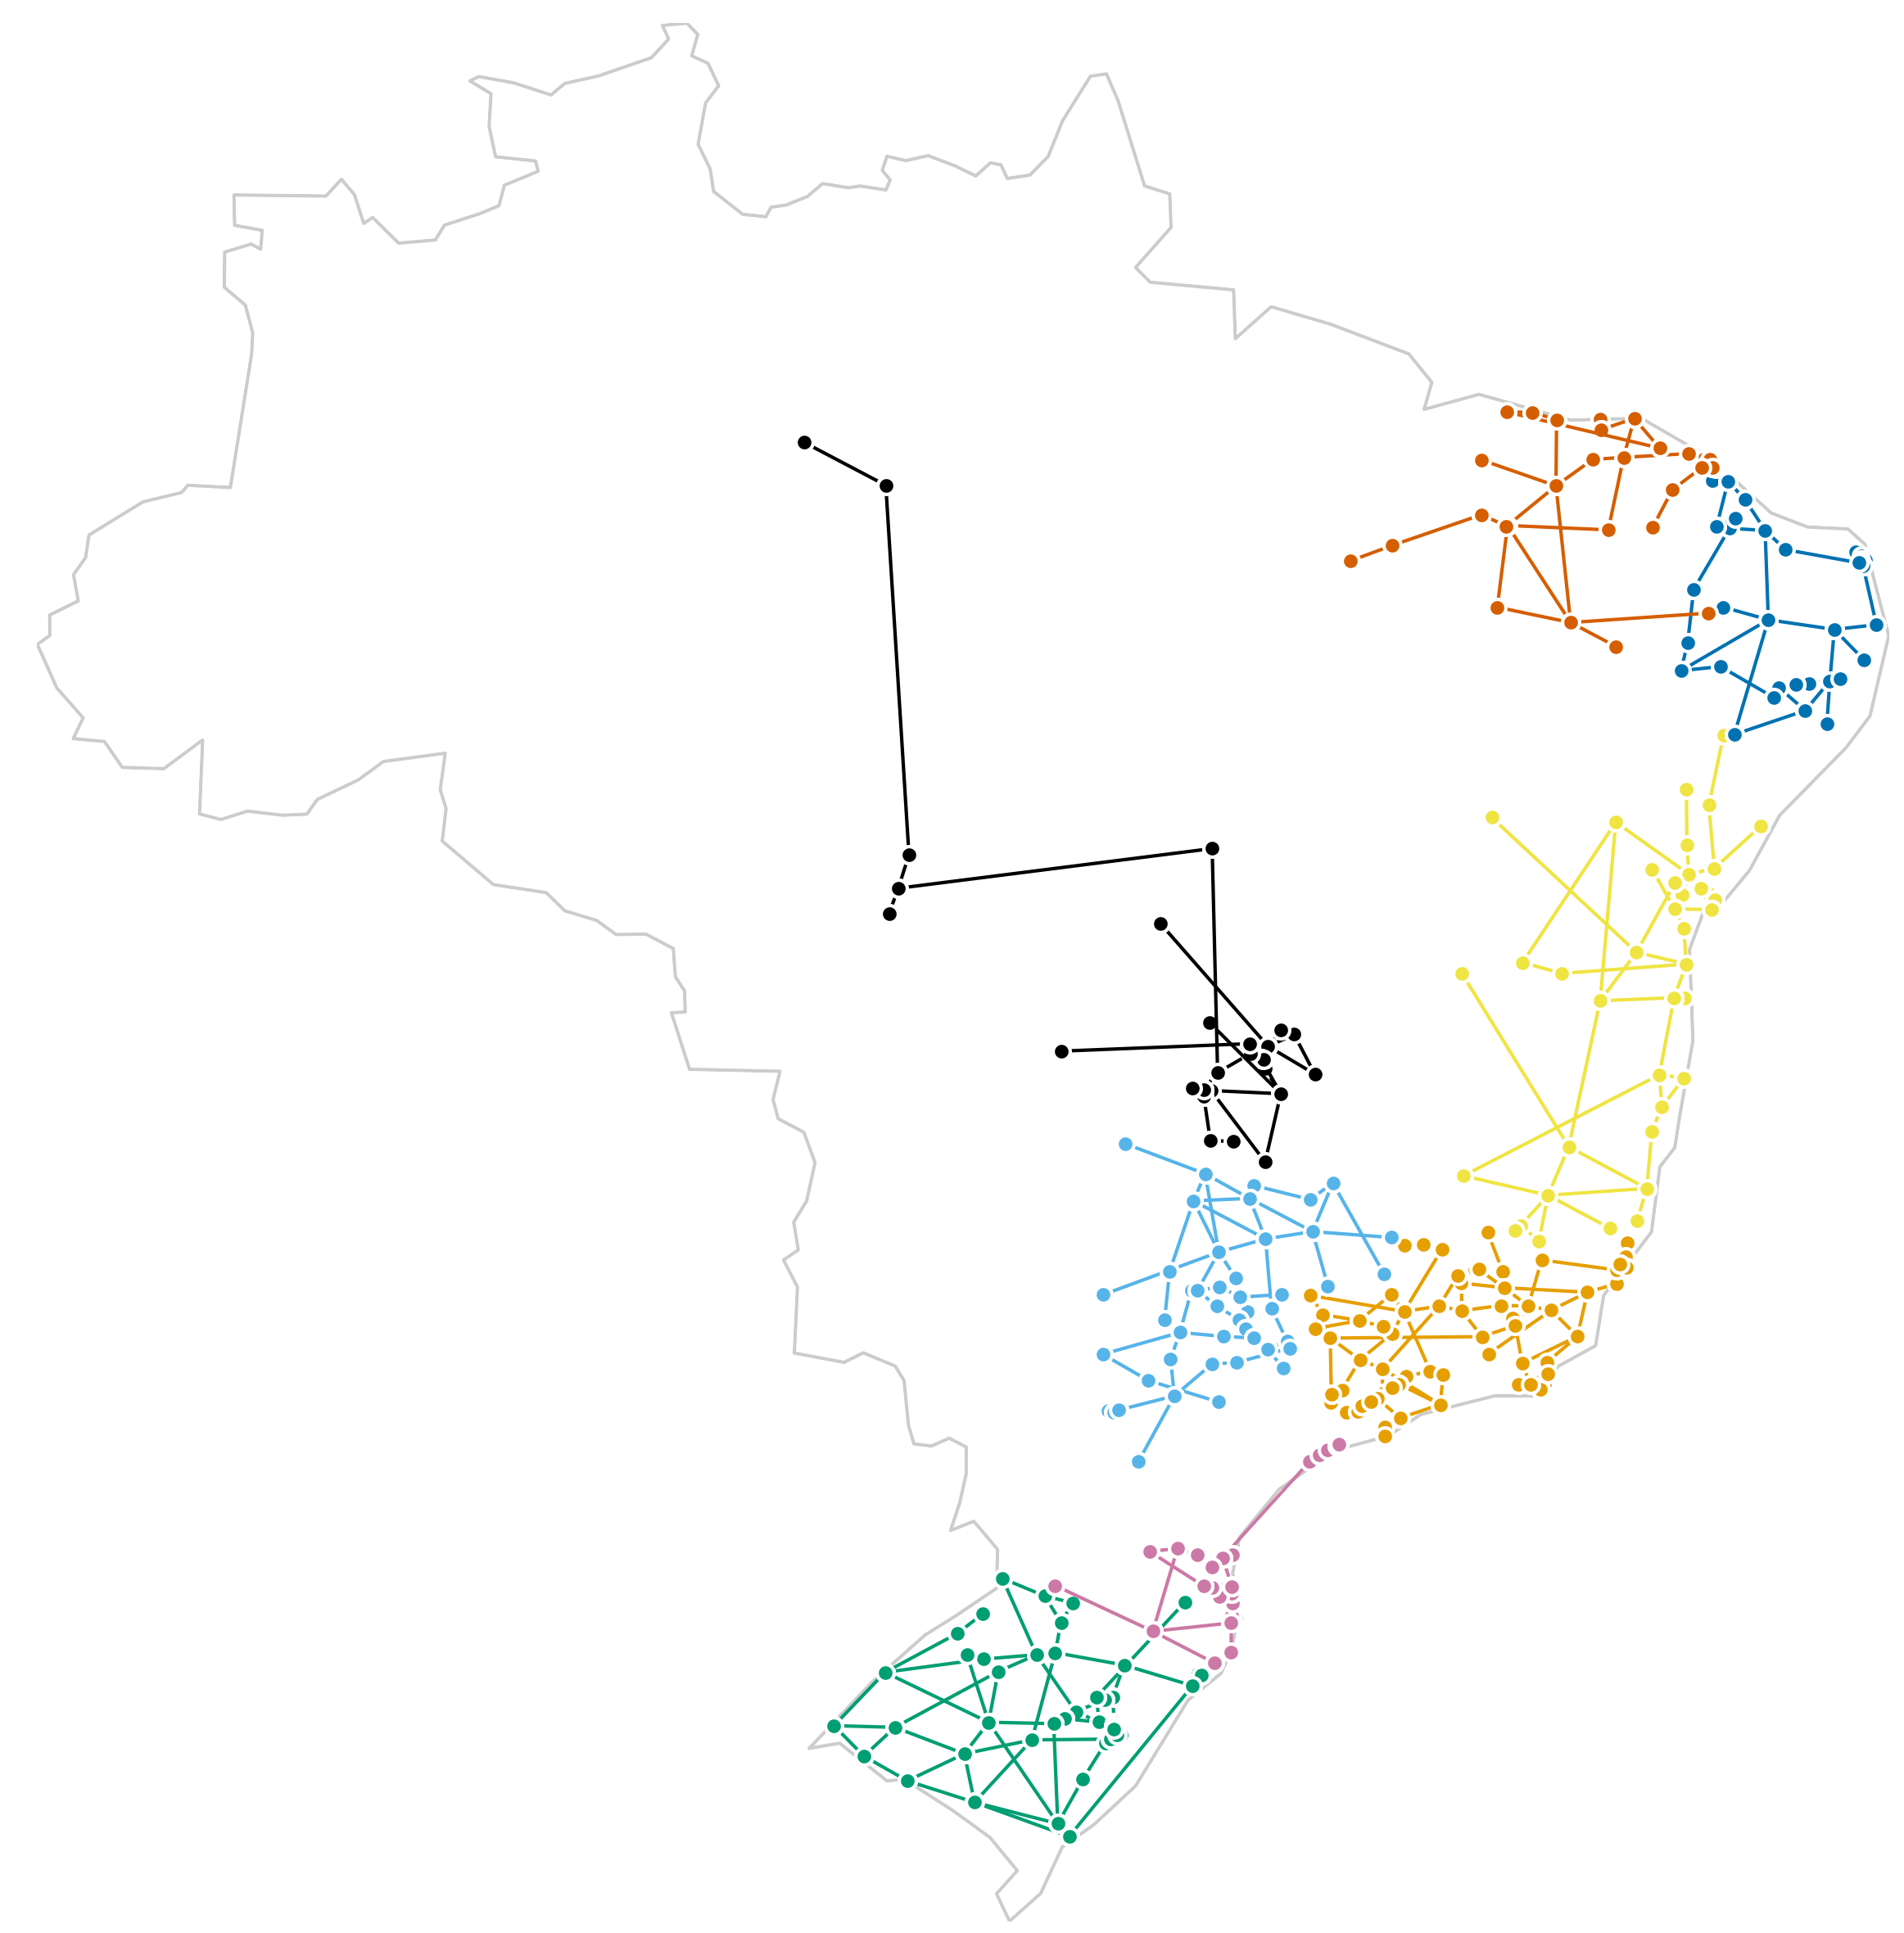
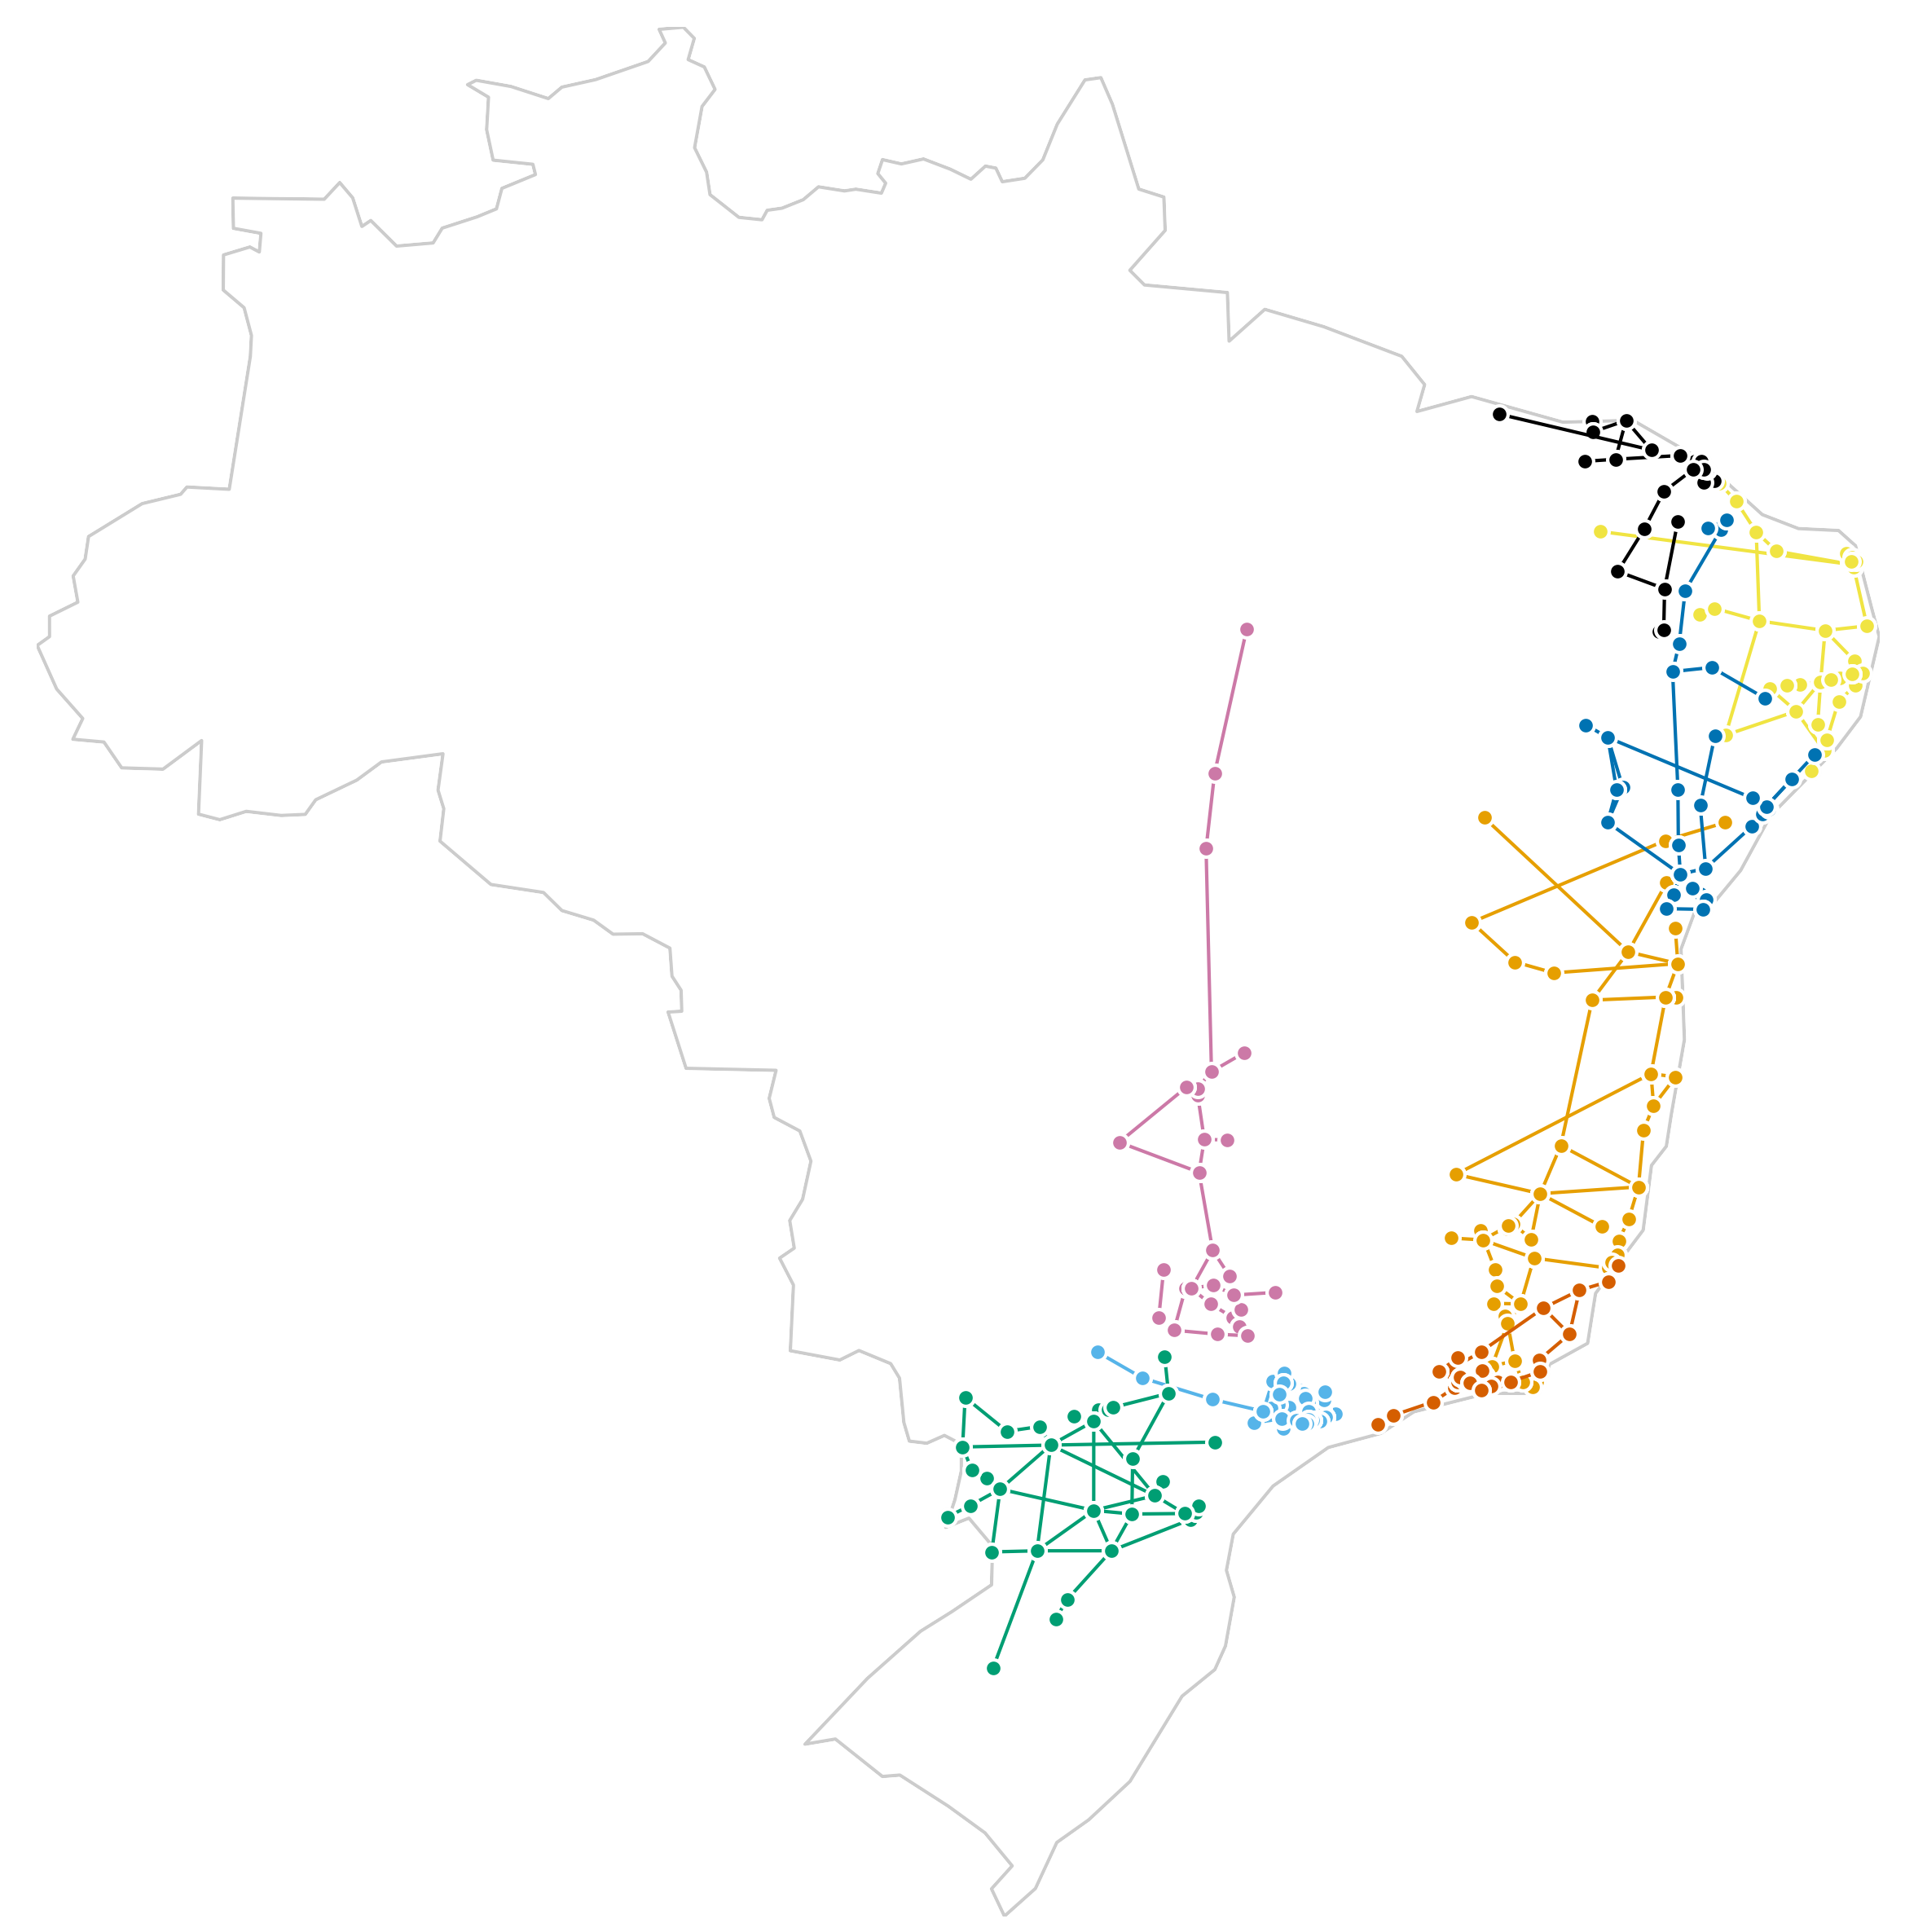
In the case of the BFRN and variations, the communities may correspond to regions where there is a high volume of traffic, densely connected urban areas, or zones with significant safety concerns due to a high number of incidents. Figure 4 shows the 8 largest communities for the four networks, respectively from left to right: BFRN (19), iBFRN (26), cBFRN (20), pBFRN (20); the community analysis leads to more communities shown between parenthesis. One immediate aspect to observe is how the largest communities seem to be located in the coastal area of Brazil, where 55% of the population lives (within 150km of the coast and 10% of total territory) [11].
5 On Network Resilience
Resilience analysis, especially in the BFRN, is critical due to its vital role in connecting cities across Brazil’s vast and diverse geography. The BFRN as the backbone of Brazil’s transportation system, needs to show resilience to disconnections. Studying resilience allows for the identification of critical nodes (cities) whose removal, whether due to natural disasters, infrastructure failure, or other disruptions, could disproportionately impact the network. Natural and unnatural disasters, such as the devastating floods that recently impacted the southern region of Brazil, including the city of Porto Alegre, are likely to become more frequent and severe due to the growing effects of climate change. These events can lead to significant disruptions in critical infrastructure such as the BFRN highlighting the need for proactive resilience planning.
Here, we compare node removals based on degree, weighted degree, and betweenness to random removal for it brings clarity to the structural importance of different nodes in the BFRN. Degree, as a measure of the number of direct connections a node has, helps evaluate the impact of losing cities that are end points of several federal roads on the network’s overall connectivity. Weighted degree extends this analysis by incorporating the significance of these connections, using weights such as distance, population, or the number of intermediate cities. Betweenness centrality, on the other hand, assesses the role of cities as intermediaries or bridges, measuring how often a node lies on the shortest paths between other cities. This highlights nodes that are critical for maintaining the global flow within the network. Random removal serves as a null model to compare how the network responds when disruptions occur without targeting specific structural properties.
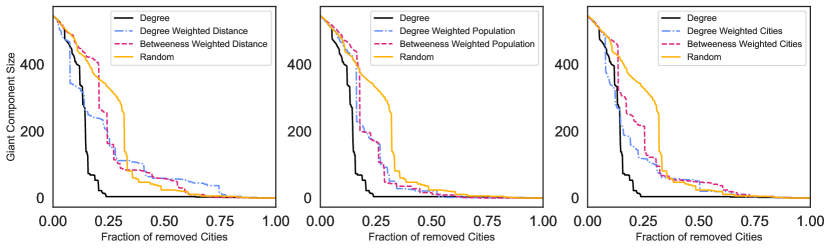
The results shown in Figure 5 (left) reveal that removing approximately 25% of the nodes based on degree leads to the complete destruction of the giant component, with faster destruction observed in the pBFRN. This outcome suggests that cities with a high number of connections are crucial for maintaining large-scale connectivity, especially when these connections serve densely populated areas. The earlier impact of weighted degree removal in the BFRN highlights that removing cities associated with large distances can disrupt connectivity also, but degree-based removals ultimately have a stronger and more widespread effect, possibly because we are dealing with spatial networks. Interestingly, the faster disintegration caused by degree removals in the BFRN compared to betweenness suggests that, in spatial networks like the BFRN, direct connections may be more critical than the intermediary roles captured by betweenness. This is due to the physical constraints and cost associated with forming long-distance connections, which make high-degree nodes less likely but disproportionately important.
6 Discussion
This paper presented a comprehensive analysis of the BFRN by leveraging network science to evaluate its structure, connectivity, and vulnerabilities. Four distinct network models were considered, with weights based on distance, population, number of intermediate cities, and incidents. These models provided a multifaceted perspective on the BFRN, allowing for a holistic understanding of how different aspects of it contribute to its overall functionality. By analysing the structural properties of these weighted networks, we gained valuable insights into the key features that define the network’s robustness and the critical nodes that play a pivotal role in maintaining connectivity.
The analysis highlights the importance of adopting a holistic approach to evaluate the BFRN, particularly in the context of decision-making by the Federal Highway Police (PRF). Limited resources require strategic priorities, and a comprehensive view of the network enables the identification of areas where interventions can have the greatest impact. For example, the pBFRN can guide decisions on resource allocation to highly populated regions, while the iBFRN informs strategies monitoring the segments and maybe making sure the incidents are not due to poor road maintenance. Similarly, cBFRN sheds light on the role of smaller urban areas in maintaining regional cohesion, offering opportunities to strengthen economic incentives to critical corridors that may otherwise be overlooked.
While resilience analysis demonstrated weaknesses associated with targeted node removals, the overarching value lies in understanding the broader structure of the BFRN. In the future, we could work to build on the foundation of this paper by integrating multilayer networks that include additional transportation modes, such as waterways, railways, and airports. Furthermore, the use of dynamic data, such as traffic flow patterns and natural disaster simulations, would enhance the ability to anticipate and mitigate potential disruptions.
References
- [1] Meisam Akbarzadeh, Soroush Memarmontazerin, and Sheida Soleimani. Where to look for power laws in urban road networks? Applied Network Science, 3:1–11, 2018.
- [2] David Alan Aschauer. Is public expenditure productive? Journal of monetary economics, 23(2):177–200, 1989.
- [3] Mohamed Badhrudeen, Sybil Derrible, Trivik Verma, Amirhassan Kermanshah, and Angelo Furno. A geometric classification of world urban road networks. Urban Science, 6(1):11, 2022.
- [4] Hugo Barbosa, Marc Barthelemy, Gourab Ghoshal, Charlotte R James, Maxime Lenormand, Thomas Louail, Ronaldo Menezes, José J Ramasco, Filippo Simini, and Marcello Tomasini. Human mobility: Models and applications. Physics Reports, 734:1–74, 2018.
- [5] Alain Barrat, Marc Barthelemy, Romualdo Pastor-Satorras, and Alessandro Vespignani. The architecture of complex weighted networks. Proceedings of the national academy of sciences, 101(11):3747–3752, 2004.
- [6] Marc Barthélemy. Spatial networks. Physics reports, 499(1-3):1–101, 2011.
- [7] Vincent D Blondel, Jean-Loup Guillaume, Renaud Lambiotte, and Etienne Lefebvre. Fast unfolding of communities in large networks. Journal of statistical mechanics: theory and experiment, 2008(10):P10008, 2008.
- [8] Anna Bottasso, Maurizio Conti, Paulo Costacurta de Sa Porto, Claudio Ferrari, and Alessio Tei. Roads to growth: The brazilian way. Research in Transportation Economics, 90:101086, 2021.
- [9] Brazilian Federal Highway Police (PRF). Annual report 2023. Technical report, Ministério da Justiça e Segurança Pública, Brasília, DF, 2023. Accessed: 2024-10-29.
- [10] Brazilian Federal Highway Police (PRF). Open data on traffic accidents from brazilian federal highway police, 2024. Ministry of Justice and Public Safety.
- [11] Brazilian Institute of Geography and Statistics (IBGE). Brazilian population census, 2022.
- [12] Charis Chalkiadakis, Andreas Perdikouris, and Eleni I Vlahogianni. Urban road network resilience metrics and their relationship: Some experimental findings. Case Studies on Transport Policy, 10(4):2377–2392, 2022.
- [13] Matteo Chinazzi, Jessica T Davis, Marco Ajelli, Corrado Gioannini, Maria Litvinova, Stefano Merler, Ana Pastore y Piontti, Kunpeng Mu, Luca Rossi, Kaiyuan Sun, et al. The effect of travel restrictions on the spread of the 2019 novel coronavirus (covid-19) outbreak. Science, 368(6489):395–400, 2020.
- [14] Confederação Nacional do Transporte (CNT). Anuário CNT do Transporte 2022 (in Portuguese), 2022. Available at: https://anuariodotransporte.cnt.org.br/2022/Inicial (accessed: 25 October 2024).
- [15] Departamento Nacional de Infraestrutura de Transportes. Nomenclatura das rodovias federais, 2020. Accessed: 2024-10-29.
- [16] Federal Republic of Brazil. Constituição da República Federativa do Brasil de 1988, 1988. Available at: https://www25.senado.leg.br/web/atividade/legislacao/constituicao-federal (accessed: 25 October 2024).
- [17] Claudio Ferrari, Anna Bottasso, Maurizio Conti, and Alessio Tei. Economic role of transport infrastructure: Theory and models. Elsevier, 2018.
- [18] Michael T Gastner and Mark EJ Newman. The spatial structure of networks. The European Physical Journal B-Condensed Matter and Complex Systems, 49:247–252, 2006.
- [19] Roger Guimera, Stefano Mossa, Adrian Turtschi, and LA Nunes Amaral. The worldwide air transportation network: Anomalous centrality, community structure, and cities’ global roles. Proceedings of the National Academy of Sciences, 102(22):7794–7799, 2005.
- [20] David Harvey. The condition of postmodernity. In The New social theory reader, pages 235–242. Routledge, 2020.
- [21] Philip E Hulme. Trade, transport and trouble: managing invasive species pathways in an era of globalization. Journal of applied ecology, 46(1):10–18, 2009.
- [22] Pablo Kaluza, Andrea Kölzsch, Michael T Gastner, and Bernd Blasius. The complex network of global cargo ship movements. Journal of the Royal Society Interface, 7(48):1093–1103, 2010.
- [23] Zeyun Li and Sharifah Rohayah Sheikh Dawood. World city network in china: a network analysis of air transportation network. Modern Applied Science, 10(10):213, 2016.
- [24] Zhigang Li, Mingqin Wu, and Bin R Chen. Is road infrastructure investment in china excessive? evidence from productivity of firms. Regional Science and Urban Economics, 65:116–126, 2017.
- [25] Cui-mei Liu and Jun-wei Li. Small-world and the growing properties of the chinese railway network. Frontiers of Physics in China, 2:364–367, 2007.
- [26] National Department of Transport Infrastructure (DNIT). National road system database (snv), 2024. Ministry of Transport.
- [27] Mark EJ Newman. The structure and function of complex networks. SIAM review, 45(2):167–256, 2003.
- [28] Mark EJ Newman. Analysis of weighted networks. Physical Review E—Statistical, Nonlinear, and Soft Matter Physics, 70(5):056131, 2004.
- [29] Jean-Paul Rodrigue. The geography of transport systems. Routledge, 2020.
- [30] Parongama Sen, Subinay Dasgupta, Arnab Chatterjee, PA Sreeram, G Mukherjee, and SS Manna. Small-world properties of the indian railway network. Physical Review E, 67(3):036106, 2003.
- [31] Thomas E Skidmore. Brazil: Five centuries of change. OUP Catalogue, 2009.
- [32] Kwok Tong Soo. Zipf’s law for cities: a cross-country investigation. Regional science and urban Economics, 35(3):239–263, 2005.
- [33] Sehyun Tak, Sunghoon Kim, Young-Ji Byon, Donghoun Lee, and Hwasoo Yeo. Measuring health of highway network configuration against dynamic origin-destination demand network using weighted complex network analysis. PLoS one, 13(11):e0206538, 2018.
- [34] Joe Weber. The evolving interstate highway system and the changing geography of the united states. Journal of Transport Geography, 25:70–86, 2012.