Bi-directional Mapping of Morphology Metrics and 3D City Blocks for Enhanced Characterization and Generation of Urban Form
Abstract
Urban morphology, examining city spatial configurations, links urban design to sustainability. Morphology metrics play a fundamental role in performance-driven computational urban design (CUD) which integrates urban form generation, performance evaluation and optimization. However, a critical gap remains between performance evaluation and complex urban form generation, caused by the disconnection between morphology metrics and urban form, particularly in metric-to-form workflows. It prevents the application of optimized metrics to generate improved urban form with enhanced urban performance. Formulating morphology metrics that not only effectively characterize complex urban forms but also enable the reconstruction of diverse forms is of significant importance. This paper highlights the importance of establishing a bi-directional mapping between morphology metrics and complex urban form to enable the integration of urban form generation with performance evaluation. We present an approach that can 1) formulate morphology metrics to both characterize urban forms and in reverse, retrieve diverse similar 3D urban forms, and 2) evaluate the effectiveness of morphology metrics in representing 3D urban form characteristics of blocks by comparison. We demonstrate the methodology with 3D urban models of New York City, covering 14,248 blocks. We use neural networks and information retrieval for morphology metric encoding, urban form clustering and morphology metric evaluation. We identified an effective set of morphology metrics for characterizing block-scale urban forms through comparison. The proposed methodology tightly couples complex urban forms with morphology metrics, hence it can enable a seamless and bidirectional relationship between urban form generation and optimization in performance-driven urban design towards sustainable urban design and planning.
keywords:
3D urban morphology , digital urban design , urban form representation , 3D model clustering , self-organizing map[sec]organization=Singapore-ETH Centre, Future Cities Lab Global Programme,addressline=CREATE campus, 1 Create Way, #06-01 CREATE Tower, postcode=138602, country=Singapore
[seu]organization=School of Architecture, Southeast University,addressline=2 Sipailou, city=Nanjing, postcode=210096, country=China
[ethz]organization=Department of Architecture, Swiss Federal Institute of Technology Zurich,addressline=Stefano-Franscini-Platz 1, city=Zürich, postcode=8093, country=Switzerland
[nus]organization=Department of Architecture, National University of Singapore,addressline=4 Architecture Drive, city=Singapore, postcode=117566, country=Singapore \affiliation[dre]organization=Department of Real Estate, National University of Singapore,addressline=15 Kent Ridge Drive, city=Singapore, postcode=119245, country=Singapore
![[Uncaptioned image]](/html/2412.15801/assets/images/Overview.jpg)
Linking morphology metrics and urban form generation bi-directionally.
Enhanced 3D morphology metrics to characterize 3D block-scale of complex urban form.
Innovative formulation and evaluation of morphology metrics by comparisons.
Applying machine learning, data clustering and case retrieval techniques.
Driving the coupling of urban form generation and performance optimization in CUD.
1 Introduction
Urban form, or the spatial structure of cities, is typically examined as the physical spatial configuration within urban spaces (Lynch and Rodwin, 1958; Kropf, 2009; Chiaradia, 2019). Urban morphology — the study of urban form — focuses on how the physical form and structure of cities are shaped and organized. It examines the patterns and layouts of buildings, open spaces, streets and other elements that make up the built environment (Moudon, 1997; Scheer, 2016; Kropf, 2018). The morphological approach seeks to understand the relationship between physical urban form patterns and a range of issues regarding urban social, economic, and environmental sustainability (Jabareen, 2006; Ratti et al., 2003). Urban morphology exhibits strong relationships with urban performance evaluations such as micro-climate, heat and energy, mobility resilience, and the entire social-economic-technological fabric of urban systems (Zhou et al., 2022; Mashhoodi and Unceta, 2024; Rode et al., 2014; Lee et al., 2016; Bramley and Power, 2009). Therefore, effectively representing the characteristics of urban form is crucial for linking urban design with performance evaluations.
Morphology metrics, the representations of urban form characteristics, are fundamental to understanding the urban morphology of the built environment and to generating urban forms for sustainable development (Dibble et al., 2019; Zhang et al., 2023). Effective morphology metrics facilitate both the analysis of existing forms and the generation of future designs, enabling a holistic approach to urban planning and design. They provide quantifiable measures of urban form that can be linked to various urban performance evaluations. For instance, solar and energy efficiency can be assessed by morphology metrics such as surface-to-volume ratio, sky view factor and others (Chatzipoulka et al., 2018). Researchers use different sets of morphology metrics to investigate the relationship between urban form and sustainability outcomes, such as urban ventilation, air pollution, urban heat island (UHI), transportation mode and more (Galster et al., 2001; Li et al., 2022; Liu et al., 2017; Yin et al., 2018; Rybarczyk and Wu, 2014; Zhang et al., 2023). Morphology metrics measure urban form and support the interpretation of shape complexity with characterizations such as footprints, orientations and surface ratios (Basaraner and Cetinkaya, 2017). Consequently, performance-driven urban form generation has garnered significant attention and investigations to support computational urban design (CUD) and optimization, pursuing more comfortable indoor and outdoor environments. The workflow consists of three steps - urban form generation, performance evaluation, and performance-driven optimization (Shi et al., 2017; Koenig et al., 2020; Zhang et al., 2024). However, performance-driven CUD is hindered by disconnected workflows, particularly the gap between urban form generation and performance evaluation.
The fundamental cause of the gap mentioned above is the disruption in the linkages between morphology metrics and urban form, which are mostly one-directional from form to metric. The absence of operations in the metric-to-form direction hinders the generation of the improved urban form based on the morphology metrics within the optimized solution space of the performance evaluation(Figure 1). The performance-driven CUD process should ideally operate as multiple iterations of complete loops. One iteration of the loop begins with the generation of the initial urban form, followed by performance evaluation based on its morphology metrics. Optimization engines are then employed to enhance performance, identifying optimized values of morphology metrics. These optimized metrics are subsequently used to generate improved urban forms, enabling iterative refinement and continuous integration between performance evaluation, optimization, and form generation. However, when the metric-to-form workflow is disrupted, optimized morphology metrics cannot be applied to generate corresponding 3D urban form models, leading to the inability to produce urban form models from these optimized metrics.
The gap is generally approached in two main ways. Firstly, design variables of parametric design act as alternative representations of urban form, facilitating urban form generation. Extensive works involve manipulating urban forms through the use of design variables of simplified geometries or predefined prototypes to generate synthetic urban forms (Panão et al., 2008; Vermeulen et al., 2013; Kämpf and Robinson, 2010; Gagne and Andersen, 2012; Yi and Kim, 2015; Zhang et al., 2019). The corresponding morphology metrics are subsequently calculated from these generated forms and used for performance evaluation. Through iterative adjustments of design variables and the repeated execution of this process, optimized urban forms are identified (Panão et al., 2008; Vermeulen et al., 2013; Gagne and Andersen, 2012; Yi and Kim, 2015; Choi et al., 2021). However, while this method produces performance-driven optimized urban forms, these forms are limited to simplified prototypes, insufficient to capture the complexity of real-world urban environments. Secondly, the other approach addresses the complexity of urban forms by utilizing cases from the built environment or urban design proposals. In this method, morphology metrics related to urban performance are calculated from the provided models, thereby enabling performance evaluation of the studied urban form (Yu et al., 2015; Kämpf and Robinson, 2009; Rode et al., 2014). However, while this approach can deliver optimized metrics with better urban performance, it fails to generate optimized urban forms based on these metrics, thereby hindering the automation of the urban form optimization process.
The significant gap hinders performance-driven urban form generation: it can achieve either automated optimization or complexity in urban forms, but not both simultaneously. We argue that this gap fundamentally stems from the absence of a bi-directional mapping between morphology metrics and urban forms that seamlessly integrates form-to-metric and metric-to-form processes. The issue arises from the fact that, in performance-driven CUD, while morphology metrics are used for performance evaluation and optimization, the optimized metrics cannot be effectively applied to generate corresponding optimized urban form models.
It is essential to formulate morphology metrics that not only effectively characterize complex urban forms but also enable the reconstruction of diverse forms. Approaches are needed to formulate these metrics and evaluate their effectiveness in representing block-scale urban morphology, particularly for 3D urban models. Most importantly, the approaches should enable urban form generation aligned with the desired urban form types based on input morphology metrics. They should also address the complexity of urban form by generating 3D models that are consistent with the intended types and exhibit sufficient richness. Calculating morphology metrics from 3D models is applicable, hence by establishing a robust metric-to-form connection, it becomes feasible to enable a true bidirectional mapping between morphology metrics and the generation of complex urban forms. This integration ultimately bridges the gap between performance evaluation and urban form generation, advancing computational urban design.
The complexity of urban form characteristics cannot be encapsulated in a single indicator, nor in the sheer number and diversity of indicators. Hence, urban morphology metrics, which is a combination of multiple urban morphology indicators (UMI), should be a meaningful measurement for urban form elements, depicting shape complexity, measuring relative richness and diversity, and quantifying aggregation and contagion (Dibble et al., 2019; O’Neill et al., 1988). There are urban morphology-related indicators describing various urban units including streets, plots, buildings and open spaces (Elzeni et al., 2022). They vary in scales including landscape, surface, urban canopy, and buildings (Li and Zeng, 2024; Biljecki and Chow, 2022).
Block is an important unit in understanding and interpreting urban design. City blocks are the space for buildings within the street pattern of a city, and form the basic unit of a city’s urban fabric. Block-scale urban morphology contains a group of buildings rather than a single architectural element (Berghauser Pont and Haupt, 2021) and block environment characteristics have significant effects on energy efficiency (Wan et al., 2024). However, the evaluation methods of morphology metrics in representing such block-scale building combinations have not been fully discovered. The characterization of 2D urban morphology has been extensively investigated (Labetski et al., 2023; Biljecki and Chow, 2022), and applied in topics such as urban pattern changes (Herold et al., 2002) and regionalization (Yang et al., 2022), morphological feature extraction (Cai et al., 2021), and urban form-energy relations (Mashhoodi and Unceta, 2024). However, the consistency of representing urban morphology is significantly influenced by the vertical dimensions and characteristics (Yang et al., 2022). In addition, we need approaches to evaluate the effectiveness of morphology metrics in representing block-scale building patterns. These approaches need to be flexible and adaptive to minor changes in UMIs when it applied to urban blocks from different regions.
We propose approaches that tackle the challenging task of generating diverse yet analogous 3D urban form based on morphology metrics derived from specific urban form models, establishing a bidirectional connection between morphology metrics and the corresponding urban form. Meanwhile, our approaches can evaluate the effectiveness of morphology metrics in representing urban form characteristics through comparisons. As a result, the morphology metrics not only effectively represent the complexity of block-scale 3D urban forms, but also support the generation of 3D models that align with intended urban form types while addressing urban form diversity. Additionally, the methodology is adaptable to urban blocks from other regions, allowing the identification of suitable morphology metrics across varied contexts. The establishment of the metric-to-form link is critical for advancing the automation of performance-driven computational urban design workflows. The approaches can further enable the generation of improved urban form models through optimized morphology metrics linked to enhanced performance evaluation.
Using machine learning and information retrieval techniques, we establish a systematic workflow that can derive city block morphology metrics from 3D models to simultaneously improve the characterisation, generation, and performance evaluation of urban form. We demonstrate it with 3D urban data of New York City, including 14 248 blocks. The Self-organizing map (SOM) is used to cluster and encode the block-scale 3D models. Associating morphology metrics and 3D urban form models allows the flexible retrieval of diverse 3D models according to the input morphology metrics of the target urban form. Additionally, we identified effective morphology metrics for characterising block-scale 3D urban forms for our dataset by comparing multiple sets. The methodology and outcomes can be applied to further support timely adjustments and reflections between urban design outcomes and performance evaluation in computational models. Using the approach, the built urban form, designer-readable 3D models and computable metrics can be tightly associated and interlinked.
The remainder of the paper is structured as follows. Section 2 provides a literature overview of existing urban morphology metrics, their applications in urban form generation and design impact analysis, and inherent challenges. Section 3 presents our methodology for constructing morphology metrics of 3D block-scale urban forms and clustering based on the morphology metrics. Section 4 demonstrates how our methodology can be applied for digitally bridging morphology metrics and 3D urban forms, as well as evaluating the capacity of morphology metrics in representing 3D urban forms. Finally, in section 5 and 6, we summarize key contributions, acknowledge remaining limitations and outline directions for future work.
2 Background
2.1 Performance-driven urban form generation
Urban form, or the spatial structure of cities, is typically examined as the physical configuration of various elements within urban spaces (Batty, 1976; Kropf, 2018; Lynch and Rodwin, 1958). Urban form demonstrates significant correlations with urban performance, for instance, it impacts micro-climates, thermal and energy dynamics, mobility resilience, and the broader socio-economic-technological structure of urban systems (Anderson et al., 1996; Chiaradia, 2019; Zhou et al., 2022; Lee et al., 2016; Bramley and Power, 2009). Urban form generation, one of the main topics in computational urban design, provides systematic approaches to produce design solutions and accelerate urban design decisions and processes by using computational tools (Batty, 1991; Jiang et al., 2024; Wilson et al., 2019). The urban form generation process involves modelling methods of representing and quantifying urban forms to be machine-readable and computable, and optimization methods to evolve the urban forms to meet pre-defined goals (Miao et al., 2018; Jiang et al., 2024).
Quantified measurements of urban forms, which are associated with urban form characteristics, are essential for performance-driven urban form generation, especially for urban environmental performance evaluation and optimization. One of the advantages of performance-driven computational urban design workflow is to enable the automatic generation of sustainable urban spatial configurations by optimizing design solutions based on environmental metrics (Koenig et al., 2020; Canuto et al., 2024). Researchers have developed various computational and parametric computer-aided design tools for urban form generation, performance evaluation, and performance-driven optimization (Shi et al., 2017; Zhang et al., 2024). During the process, researchers use a variety of urban morphology metrics to measure the characteristics of urban form in different aspects and contexts (Zhang et al., 2023). The relationships between urban form and environmental performance have been investigated from various perspectives. Morphological metrics have proven effective in analyzing sustainable outcomes. A broad spectrum of research has leveraged urban morphology metrics, such as site coverage (Li et al., 2024), sky view factor (Ratti et al., 2003; Li et al., 2022), built volume (Rode et al., 2014), building height (Yi and Kim, 2015; Li et al., 2024), height-to-width ratio (Elzeni et al., 2022), and others to analyze, predict, and optimize environmental performance metrics such as walkability (Rakha and Reinhart, 2012), thermal comfort (Yu et al., 2015), solar efficiency (Rode et al., 2014; Li et al., 2024), urban ventilation (Li et al., 2022) and so on. Urban morphology metrics are central to performance-driven urban design as they serve as a crucial link between urban forms and performance evaluation and optimization.
In performance-driven computational urban design, the connections between urban form to urban morphology metrics are mostly form-to-metric one-way links, hindering the fully automated process of performance-driven urban form generation, as illustrated in Figure 1. The gap is typically addressed through two main approaches. Firstly, researchers incorporate parametric approaches for manipulating urban forms. Design variables are identified according to predefined prototypes which are simplified geometries to generate synthetic urban forms. An example of replicating a specific urban form is to simulate morphology, and building structure form using shape grammar, translating the properties and their interrelationships to geometric rules (Wang et al., 2020; Mandić and Tepavčević, 2015). Li et al. (2024) generated simplified block-scale urban forms based on grids and linked solar performance with urban form metrics such as floor area ratio (FAR) and site coverage (SC). It enables the integration of form generation, solar simulation, and optimization for multi-objective solar performance. Shen and Ye (2024) utilized cellular automata for synthesizing simplified layouts that compiled 3D grids, enabling a form generation process that can be integrated with daylight performance simulation and generic optimization to produce optimized housing layouts. Zhang et al. (2019) focused on generating blocks based on six typology categories (e.g. blocks with towers, courtyards), and then morphological metrics (e.g. Open Space Ratio (OSR), Roof-to-envelope area ratio) derived from these synthesized blocks are used to identify the impacts of design factors on solar potential and energy performance (Zhang et al., 2019). The process incorporates optimization methods whereby iterative adjustments of design variables and repeated execution yield a solution space that aligns with predefined performance objectives, thereby contributing to the generation of optimized urban forms (Koenig et al., 2020; Stouffs and Rafiq, 2015). However, while this method produces performance-driven optimized urban forms, these forms are limited to simplified prototypes, insufficient to capture the complexity of real-world urban environments.
Secondly, the other approach addresses the complexity of urban forms by utilizing cases from the built environment, where urban forms are more realistic and complex with diverse variants in morphology. Zhou et al. (2022) extracted morphological metrics such as sky view factor (SVF) and building surface fraction (BSF), from the built environment. Research shows that morphological metrics significantly affect land surface temperature (LST) at the local scale. Li et al. (2022) assessed the outdoor ventilation conditions that can be tightly correlated with the sky view factor (SVF). Utilizing morphology parameters derived from building layouts, Yu et al. (2015) applied a multi-objective optimization model in green building design. They identified optimal variables of a building design (e.g. floor area, window–wall ratio), predicted improved energy consumption and indoor thermal comfort. Using the 3D model of the city of Adelaide, Zhao and Gou (2023) extracted morphological parameters from existing 3D city models, including building density, plot ratio, variation of building height, wall-to-roof ratio, and so on. They performed solar radiation simulations for selected urban blocks from varied clusters, offering an essential benchmark for optimizing solar deployment in mixed-use urban neighbourhoods. The authors aimed to offer valuable references for early-stage design decisions; however, despite conducting comprehensive clustering of all the 3D models, they had to reduce diverse urban forms to five prototypes. Similar challenges have been encountered in other studies attempting to link morphological parameters to the studied 3D urban forms, despite the availability of various optimization methods (e.g. Rode et al. (2014); Kämpf and Robinson (2009); Zhang et al. (2024)). Consequently, investigations using complex real-world urban forms can yield insights into optimized morphological parameters with enhanced performance outcomes, but lack providing improved urban forms that can directly inform design decisions. Therefore, to support the automated performance-driven urban form generation, it is essential to formulate morphology metrics that can both effectively characterize urban forms and enable the metrics-to-form generations.
2.2 Urban morphology metrics
·
Urban morphology is the multidisciplinary and multi-scale method of investigating the physical form of settlements, which is an important task in multiple domains such as urban planning, landscape and geography (Kropf, 2009; Moudon, 1997). In digital urban planning and design, multiple representations, quantifications and parameters are utilized towards computational design for modelling and simulating (Batty, 1976; Jiang et al., 2024). As the main components of the 3D urban morphology, buildings are arranged in various configurations throughout cities, creating diverse morphologies (Liu et al., 2014, 2020). Each building possesses distinct physical attributes, such as height, area, volume, and outline. These unique characteristics collectively influence the overall 3D urban morphology of a region. Hence many efforts have been made to develop morphology metrics for characterizing, analyzing and understanding spatiotemporal patterns of the built environments.
Urban forms can be quantified and represented by urban morphology metrics using measurements from various aspects (e.g. density, shape), and distribution of buildings, streets, and open spaces. Multi-disciplinary investigations for quantitatively analysing and representing urban form characteristics vary in methods and scales (Li and Zeng, 2024; Zhang et al., 2023). With the explosive growth of information technology and available multi-source data, researchers from multiple disciplines have developed various approaches for quantifying morphology, including shape grammar approaches, spatial analytical approaches, ML-based approaches and urban morphological metrics (Kropf, 2018; Biljecki and Chow, 2022; Li and Zeng, 2024). Researchers have investigated comprehensive lists of UMIs with multi-scale measures through systematic literature reviews (Biljecki and Chow, 2022; Li and Zeng, 2024). Morphology metrics can represent the complexity, relative richness and diversity of urban forms. By employing a variety of spatial metrics, researchers can assess the compactness, connectivity, and complexity of urban environments, which in turn inform planning and policy decisions (Lowry and Lowry, 2014).
Traditional urban morphology metrics were widely used to quantify two-dimensional spatiotemporal patterns based on land use/cover data and are extensively applied to optimize land use, improve and guide urban developments (Jabareen, 2006; Yu et al., 2020). For example, indicators like floor area ratio (FAR), building density (BD), and street network density provide insights into land use efficiency and urban sprawl (Tsai, 2005). Berghauser Pont and Haupt (2021) developed Spacemate with a focus on various types of density on the urban block such as compactness (FAR), the coverage (BD), spaciousness: open space ratio (OSR), network density and the average number of stores (Berghauser Pont and Haupt, 2005). Shape indicators can be used to identify block footprint characteristics, then developing case-based methods for urban design generation (Xu and Li, 2019). Additionally, advanced metrics derived from spatial analysis techniques, such as fractal factors and space syntax, allow for a deeper examination of the spatial organization and accessibility of urban areas (Hillier et al., 1976; Batty and Longley, 1994).
Vertical information in urban morphology has been underscored to advance three-dimensional spatial pattern analysis based on new data sources and techniques (Liu et al., 2020). For instance, OpenStreetMap (OSM) is an open digital mapping database created through crowdsourced and volunteer-contributed geographic information, including buildings and infrastructure worldwide (Herfort et al., 2023; Biljecki et al., 2023). Anyone can edit all features of buildings and infrastructure. Researchers have advanced numerous 3D indicator systems based on established theories and practices (Li and Zeng, 2024; Labetski et al., 2023). Volumetric approaches have been used as a means of better capturing the 3D morphological characteristics of cities (Bruyns et al., 2021). Morphology metrics used are also defined and delineated in city planning regulations, and it has been demonstrated that one can generate 3D urban form from regulations (Chadzynski et al., 2022; Grisiute et al., 2023). Studies have extended three-dimensional landscape metrics derived from 2D metrics using various statistical methods in the scope of the patch-mosaic model (PMM) (Wu et al., 2017). Other scholars have developed 3D spatial metrics based on gradient surface models, focusing on metric development on buildings to quantify urban morphology (Kedron et al., 2019). At the local scale, researchers have examined 3D building metrics to represent the distinct characteristics of complex 3D building shapes (Labetski et al., 2023). Indicator sets are valuable for better understanding urban forms and for spatial analysis. However, the indicator sets remain empirical in their ability to describe complex urban forms, and it has yet to be validated whether they are sufficient for computers to effectively represent urban form characteristics.
Based on the existing literature, we first observe a disconnection in the fully automated process of performance-driven urban form generation and optimization, caused by the lack of bi-directional mapping between morphology metrics and urban form, particularly in the metric-to-form direction. However, there is a lack of approaches that couple metrics and form. The disconnection is the key issue in generating improved 3D urban models based on optimized morphology metrics with optimized performance. Secondly, the complexity of urban form characteristics cannot be adequately represented by a single indicator or soley by quantity and variety of indicators. Consequently, identifying the urban morphology metrics that can capture aspects such as shape complexity, relative richness and diversity, for 3D urban models is important. It requires approaches that can evaluate the effectiveness of morphology metrics in representing block-scale urban morphology. The following sections propose several contributions to achieve the goal of bridging morphology metrics and complex urban forms bi-directionally to enhance performance-driven CUD.
3 Methodology
This section introduces our methodology for improving urban form generation based on morphology metrics derived from targeted 3D block-scale models, bridging morphology metrics and 3D urban form bi-directionally. It is a systematic pipeline that includes data collection and pre-processing, morphology metrics formulation, clustering, encoding and case retrieval techniques. For urban forms, we first calculated their morphology metrics and used them to train self-organizing maps (SOM) for clustering the urban forms. Then a context-based encoding method based on the trained SOMs was developed for more effective representations for urban forms: SOMEncoding vectors. Using the trained SOMs and SOMEncoding vectors, we can retrieve more 3D models from the dataset. Consequently, we can retrieve 3D urban form models on the corresponding morphology metrics. Diverse urban forms can be associated with the target urban form types and the deriving morphology metrics, hence it can bridge morphology metrics and urban form in digital models.
We set out the implementations based on the following scopes and aims:
-
1.
In preference of open-source geoinformation, 3D urban form data were collected from readily accessible platforms. We used data from OpenStreetMap. Although plots are often representative study units in urban design, we take blocks as our study units because we can only slice blocks based on the used dataset. In our work, the effectiveness of morphology metrics is evaluated solely with block-scale urban form characteristics from New York City, as it is our chosen study area.
-
2.
To develop effective morphology metrics, the selected UMIs are unambiguous, can be universally present in all cities and have geometric significance in representing block-scale 3D urban form characteristics of shape complexity. The morphology metric sets we selected for comparison are primarily drawn from existing literature, so they are not exhaustive. However, they cover the four main urban form characteristic types: height, surface, content, and shape.
-
3.
The effectiveness of morphology metrics is assessed through observational analysis and comparative evaluation. In the experiments comparing different sets of morphology metrics, a guiding principle is that the morphology metrics can represent the constituent elements of urban form such that their homologous characteristics can be rigorously defined and measured (Dibble et al., 2019). In our study, urban forms retrieved based on similarity in morphology metrics are expected to display analogous morphological characteristics while maintaining diverse form variations.
-
4.
The approaches for formulating morphology metrics and establishing the bi-directional mapping between these metrics and 3D urban forms are designed to be generalizable to other cities with varying organizational structures and urban forms. We provide a flexible and context-based methodology that can be adaptively applied to other datasets which can be plot-wise or from other regions, rather than attempting to create a universal set of morphology metrics for all regions. When our proposed approaches are applied to other urban form datasets, additional specific UMIs can be incorporated and further examined according to the characteristics of those urban forms.
3.1 Data collection and pre-processing
An area of New York City was downloaded from OpenStreetMap, including building footprints and road networks classified as Primary, Secondary, and Residential(Figure 2). In the figure, buildings are coloured based on their height information. Roads categorized as Residential primarily define block-scale units; therefore, the urban blocks used for further studies were delineated based on the boundaries set by these three road types.
When building footprints in the dataset did not have corresponding height information (e.g. building footprints marked red in Figure 3a ), we assigned the average height of the surrounding buildings. While this average value likely does not correspond to the actual height, we argue this fuzzy estimation is sufficiently accurate to demonstrate our general methodology. This resulted in a dataset of 14,248 3D city blocks. Figure 3b shows that the height information is completed as no building or block is coloured red. Some of the selected 3D city blocks can be visualized in Figure 3c.
3.2 Urban morphology indicator selection
For the selection of morphological indicators, we identified 15 morphological indicators that are globally used for urban planning practice and urban performance research. They represent 4 types of block characteristics: height, surface ratio, block content and block 2D shape. Table LABEL:table:UMIs provides definitions for each indicator, detailing their relevance in representing the urban form characteristics of a block. The building coverage ratio (BCR), also referred to as site coverage and the ground space index (GSI), and the floor area ratio (FAR), also known as the floor space index (FSI), is among the most widely recognized metrics. Along with maximum height (MaxH), these metrics are extensively utilized by urban planners and researchers to assess and manage urban density and sprawl (Berghauser Pont and Haupt, 2005; Pan et al., 2008; Soliman et al., 2018). Various height-related metrics are considered, including minimum height (MinH), average height (AveH), standard deviation of height (SDH), and weighted average height (WAH), to comprehensively capture the vertical characteristics of a group of buildings. To represent 2D block shape features, indicators such as Block shape factor (BSF) and block shape squareness (BSS) are utilized. Additionally, average stories (AS) and open space ratio (OSR) were introduced by (Berghauser Pont and Haupt, 2005). Additionally, we incorporate morphological indicators used in urban mesoscale meteorological models and diffusion models (Burian et al., 2002), such as complete aspect ratio (CAR) and global height-width ratio (GHWR). For idealized building arrangements, GHWR can be approximated by dividing the average building height by the average distance between buildings. CAR and GHWR are selected for their geometric significance in capturing building distributions within blocks and in representing the degree of aggregation or dispersion of building volumes.
| Characteristic type | UMI | Definition | Example |
|---|---|---|---|
![[Uncaptioned image]](/html/2412.15801/assets/images/MetricExample1.png)
|
|||
| Height |
MaxHeight
(MaxH) /m |
Maximum building height within a block. | 50.4 |
| Height |
MinHeight
(MinH) /m |
Minimum building height within a block. | 18.1 |
| Height |
AverageHeight
(AveH) /m |
Average building height within a block. | 23 |
| Height |
Standard-
DeviationHeight (SDH) |
The standard deviation of building heights within a block.
is the average height of buildings within the block. is the height of building . |
9.18 |
| Height |
Weighted-
AverageHeight (WAH) /m |
Building height is weighted by the building footprint area.
is the height of building . |
26.15 |
| Height | AverageStoreys (AS) | Average buildings stories within a block. | 7.88 |
| SurfaceRatio |
Building-
CoverageRatio (BCR) |
The ratio of the total building footprint area to the gross block area.
is footprint area of building . is gross block area. is number of buildings in the block. |
0.41 |
| SurfaceRatio | FloorAreaRatio (FAR) |
The ratio of a building’s total floor area to the gross area of its block.
is the area of floor of building . is the number of stories of building . |
2.67 |
| SurfaceRatio | CompleteAspectRatio (CAR) |
Quantifies building envelope exposure per block using the formula
is the total area of building vertical surfaces. is the rooftop area. represents exposed ground area within the block. |
3.68 |
| SurfaceRatio | OpenSpaceRatio (OSR) |
Measures the proportion of a block’s area open to the sky, calculated as
, where is the block footprint area. is the ground floor area of building . is the number of storeys. |
0.22 |
| BlockContent |
GlobalHeight-
WidthRatio (GHWR) |
Estimates the building height-to-width ratio within a block, calculated as
is the average distance between buildings according to Delaunay algrithm. is the total length of the Delaunay network. is the number of buildings in the block. |
0.68 |
| BlockContent | NumberOfBuildings (NOB) | Total number of buildings within a block. | 16 |
| Block2DShape | BlockArea (BA) /m2 | Gross area of a block footprint. | 15,718 |
| Block2DShape | BlockShapeFactor (BSF) | Gross area of block footprint divided by the corresponding bounding box aligned with the coordinate axes. | 0.47 |
| Block2DShape | BlockSquareness (BSS) | Gross area of block footprint divided by the corresponding minimum bounding box. | 0.89 |
Using the selected 15 UMIs, we identified six distinct morphology metric sets, each comprising a unique combination of indicators that represent various urban form characteristic types. The morphology metrics compositions are shown in Table LABEL:table:morphosets. The first basic set, BFH, is composed of three basic indicators: BCR, FAR and MaxH, and it is the most commonly used by architects and urban planners. The indicators describe building height and surface ratios. The basic set is commonly used for trained urban design expertise but it lacks comprehensiveness for computational models. Therefore, we identified ExtendedBFH, developing based on BFH by adding UMIs that describe the other two characteristic types: block content and block shape. The Spacemate (Berghauser Pont and Haupt, 2005) and Blockshape (Xu and Li, 2019) sets are referred from the literature. We observe that the UMIs in Spacemate primarily represent surface ratio characteristics, while those in Blockshape mainly describe 2D block shape features. Therefore, we believe that they are good comparisons. The last two sets, BriefBlockMetric and HybridBlockMetric, are the most comprehensive, with UMIs spanning all characteristic types. The difference is that BriefBlockMetric includes only one UMI to describe surface ratio characteristics, and it omits two UMI describing height information. We will compare these morphology metric sets in their ability to represent 3D urban forms.
| Morphology metric sets | Height | SurfaceRatio | BlockContent | Block2DShape | Resource |
|---|---|---|---|---|---|
| BFH | MaxH |
BCR;
FAR |
|||
| ExtendedBFH | MaxH |
BCR;
FAR |
NOB | BA | |
| Spacemate | AveS |
BCR;
FAR; OSR |
Berghauser Pont and Haupt (2021) | ||
| BlockShape | FAR |
BA;
BSF; BSS |
Xu and Li (2019) | ||
| BriefBlockMetric |
AveH; SDH;
WAH |
CAR | GHWR; NOB | BA | |
| HybridBlockMetric |
MaxH; MinH;
AveH; SDH; WAH |
BCR;
FAR; CAR |
GHWR; NOB | BA |
3.3 Urban form clustering based on morphology metrics
We deployed clustering techniques using self-organizing maps (SOMs), to evaluate the effectiveness of morphology metrics in representing urban form characteristics. By comparing the clustering results based on different morphology metric sets, we can validate their performance. We used six self-organizing maps (SOMs) for clusterings. The samples’ morphology metrics values after normalization are used as urban form feature vectors for the input to SOMs. Hence six SOMs were trained based on the six sets of morphology metrics respectively. After training, the 3D urban form models were clustered and indexed according to the clusters they fall within. SOM is a general-purpose nonlinear data transformation method that offers solutions for data clustering and 2D visualization by creating continuous visual patterns on top of high-dimensional data. The node weight value is a high-dimensional vector with the same dimension as the input feature vectors and is updated by reducing the distance between the node and the input data. To calculate the distance between the node and the sample, we used Euclidean distance, which is the most commonly used metric for this purpose. After several iterations, each node becomes associated with a set of input objects that are closer to this node than to the other nodes.
Two simultaneous processes explain the SOM algorithm (formula 1, 2). The training data set can be considered as = , , , as a set of N points in an n-dimensional space. A SOM can be considered as a grid with nodes, with a set of indices , each attached with a high-dimensional weight vector, . During the training process, an index can be assigned for each data . The index is also called the best-matching unit (BMU). is a similarity function which is calculated by the inverse of the distance between the input sample feature vectors and the weight vectors of the SOM node , .
| (1) |
| (2) |
In our experiments, the six SOMs all had a 10 × 10 grid. The node weights of SOMs were updated in the same dimensions as the number of UMIs included in the training morphology metric sets. After the SOM training, each sample is indexed with the best-matching unit (BMU) based on the Euclidean distance between the sample and the node weight (Cai et al., 2022). A common way of visualizing the final output of a SOM is to visualize one of the input data that is associated with the nodes since a set of input data is assigned to each node. Figure 4 is the visualization of two SOMs that are trained with the ExtendedBFH set and HybridBlockMetrics set, respectively. From these two SOMs, we can observe the gradient of 3D urban models. For instance, in the HybridBlockMetrics SOM map, moving from top to bottom, we see a transition from blocks with single buildings to those enclosed with multiple buildings. From the top left to the bottom right, we observe a shift from low-density blocks with dispersed buildings to higher-density blocks where buildings are more compact. When observing the general clustering results, HybridBlockMetrics showed more potential in representing urban form characteristics, because its SOM displays a greater variety of urban forms compared to ExtendedBFH SOM, where urban forms showed on the map have lower diversity. More detailed comparisons and similarity analysis based on the clustering results will be introduced in the later sections.
In order to have a closer look at the relevance of each UMI’s impact on clustering urban forms, we take slices of each dimension of the SOM trained by the HybridBlockMetric set (Figure 5). As shown in the figure, BCR and FAR exhibit very similar heat maps, indicating that they have comparable influence in representing the dataset of urban forms. Similarly, AveH and WAH also show a high degree of relevance to each other. It is noteworthy that height-related Urban Morphology Indicators (UMIs), such as MaxHeight, MinHeight, AverageHeight, WeightedAverageHeight, and StandardDeviationHeight, generate distinct heat map patterns. This observation underscores that various height-related metrics capture different aspects of urban morphology. Consequently, incorporating diverse height characteristics is essential for a comprehensive representation of the vertical dimensions of urban forms. NOB and BA exhibit overlaps in representing urban form, potentially due to the correlation that blocks with a greater number of buildings are more likely to have larger areas and this correlation is not always applicable. In general, the indicator heatmaps show critical differences from each other, indicating that each indicator has its own unique role in representing the urban forms.
3.4 Embedding 3D urban morphology characteristics by SOMEncoding
Each 3D model sample’s characteristic is encoded by feature vectors which are normalized morphology metrics. Each sample has six sets of feature vectors with different dimensions, including BFH feature vectors with 3 dimensions, ExtendedBFH feature vectors with 5 dimensions, Spacemate and Blockshape feature vectors both with 4 dimensions, BriefBlockMetric feature vectors with 7 dimensions and HybridBlockMetric feature vectors with 11 dimensions. Figure 6, shows three kinds of feature vectors based on BFH, Spacemate, and HybridBlockMetric, taking one sample as an example. The similarity of the urban models is determined by the distance between their feature vectors. One of the common ways is to calculate the Euclidean distance based on those feature vectors. Hence similar and diverse cases can be retrieved and ranked based on their similarity.
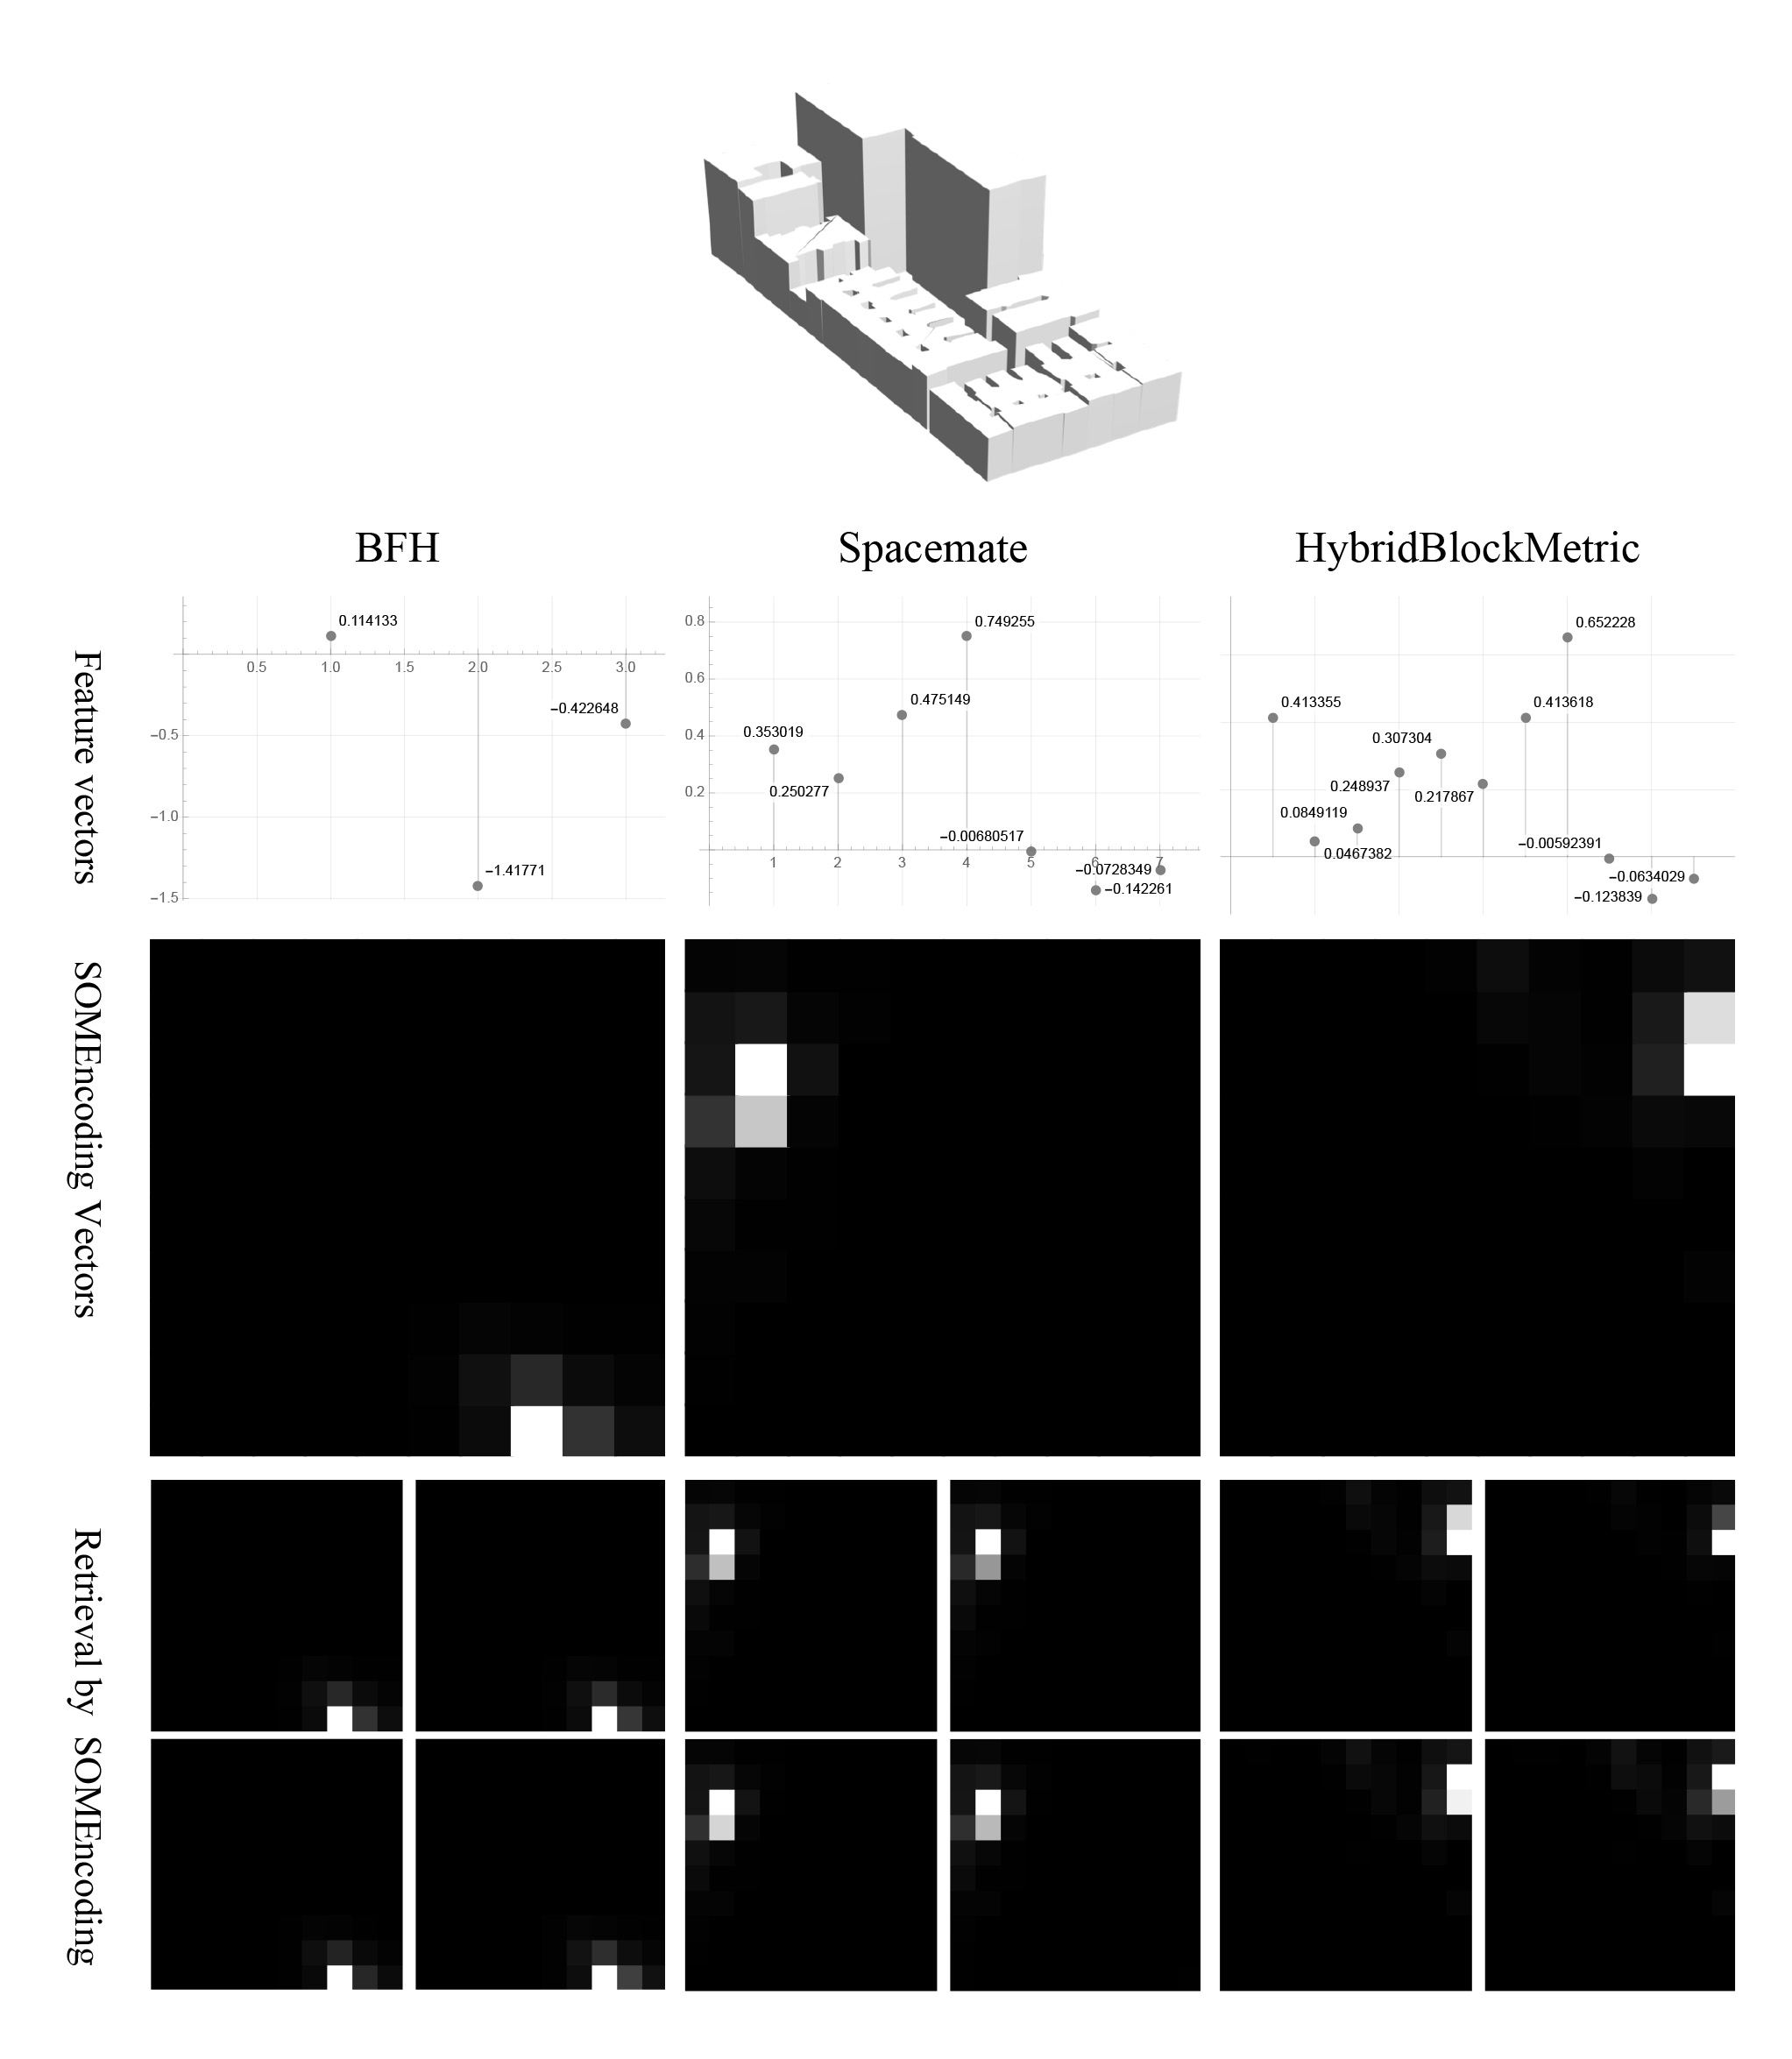
During the case retrieval process, the calculated distance based on feature presentation significantly influences the retrieval results. Context-based encoding can improve the feature representation (Zhang et al., 2018). Hence, encoding the morphology metrics within the trained data space ensures better representation and enhances retrieval outcomes. In this study, we developed SOMEncoding vectors to use in further case retrieval, instead of using BMU or original feature vectors. In our SOMEncoding method, vectors are calculated by applying a context-based encoding method that captures the unique characteristics of a sample relative to the entire data space. In addition to normalization, this method encodes urban form morphology metrics based on the corresponding trained SOM’s BMUs. The feature vectors computed based on SOMEncoding will be referred to as SOMEncoding vectors. The SOMEncoding process can be described as follows. For example, for a sample whose feature vector is in a SOM map with nodes, the SOMEncoding vector is a set of distances between and all the SOM node weight vectors, , . Hence has dimensions (in our case, 100 dimensions).
The morphology metrics were re-encoded into 100-dimensional SOMEncoding vectors. We visualized the SOMEncoding vectors by grayscale images in a 10x10 map, taking a randomly selected block sample as an example (Figure 6), showcasing BFH, Spacemate and HybridBlockMetric. Figure 6 also showcases the four grey-scale colour maps which are the top four cases similar in SOMEncoding vectors. The retrieved four grey-scale colour maps show a high degree of consistency with the target.
SOMEncoding vector offers the advantage of making case retrieval across different morphology metric sets more comparable. By reducing the heterogeneity between the morphology metrics, all samples can be represented as vectors in the same dimensions after encoding. In this way, we mapped a 3D urban form to its corresponding morphology metrics, then standardised the morphology metrics into feature vectors based on which we trained SOMs, and then encoded the feature vectors based on the context of trained SOMs. Finally, we can use the morphology metrics to link more similar and diverse urban forms through case retrieval.
4 Results
4.1 Mapping between morphology metrics and 3D urban forms
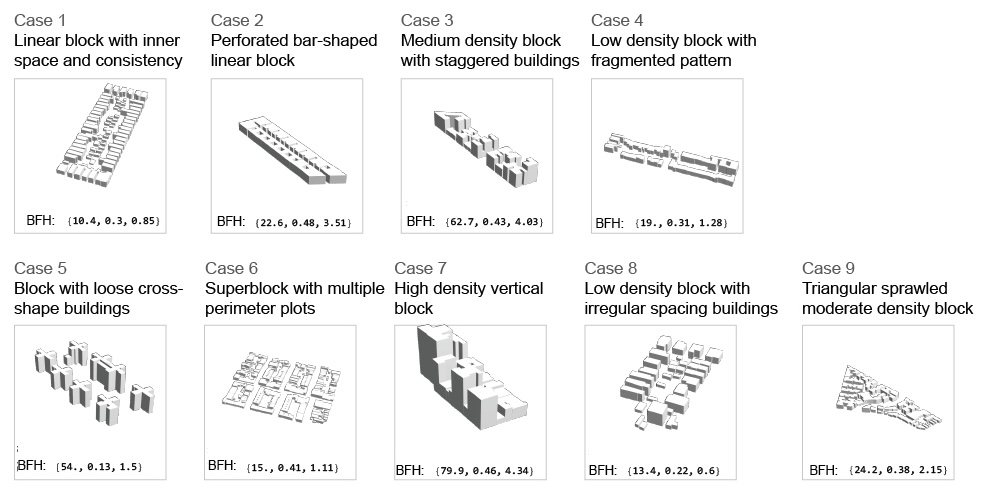
To assess the effectiveness of the six morphology metric sets in capturing urban form characteristics, we compare the similarities between the retrieved 3D models and the target. Each 3D model is generated based on the target’s morphology metrics using one of the six metric sets. In this paper, we select nine cases that vary in morphological prototypes (Figure 7). Case 1 - Linear block with inner space and consistency - exhibits long and linear arrangement of low buildings organized in consistent spacing around an inner block public space. Case 2 - Perforated bar-shaped linear block - exhibits long structure and bar-like layout. The structure contains rhythmic rectangular voids or cutouts along its length, which may suggest open courtyards or shared spaces. Case 3 - Medium density block with staggered buildings - includes buildings in moderate density and vary in size and height, creating a dynamic rhythm along the linear alignment. Case 4 - Low-density block with fragmented pattern - is characterized by a linear arrangement of structures, but the buildings are fragmented and irregularly spaced. The buildings appear to have a relatively consistent height. Case 5 - Block with loose cross-shape buildings - consists of cross-grid buildings arranged in a loosely spaced grid pattern, allowing for significant open spaces between structures. Case 6 - Superblock with multiple perimeter plots - consists of a collection of plots featuring intricate internal subdivisions, resembling a courtyard or perimeter block configuration. Case 7 - High-density vertical block - features a dense arrangement of tall buildings with consistent massing and limited spacing between them, emphasizing verticality and compactness. Case 8 - Low-density block with irregularly scattered buildings - consists of a scattered arrangement of buildings with varying orientations and openness between them, formulating an irregular and fragmented pattern. Case 9 - Triangular sprawled moderate density block - features a triangular site boundary, with moderate density, irregular spacing and varying building sizes. By selecting blocks with different prototypes as the test cases of our experiment, we can enhance the reliability of validation for the morphology metrics in representing diverse urban forms.
4.2 Evaluating morphology metrics by comparison
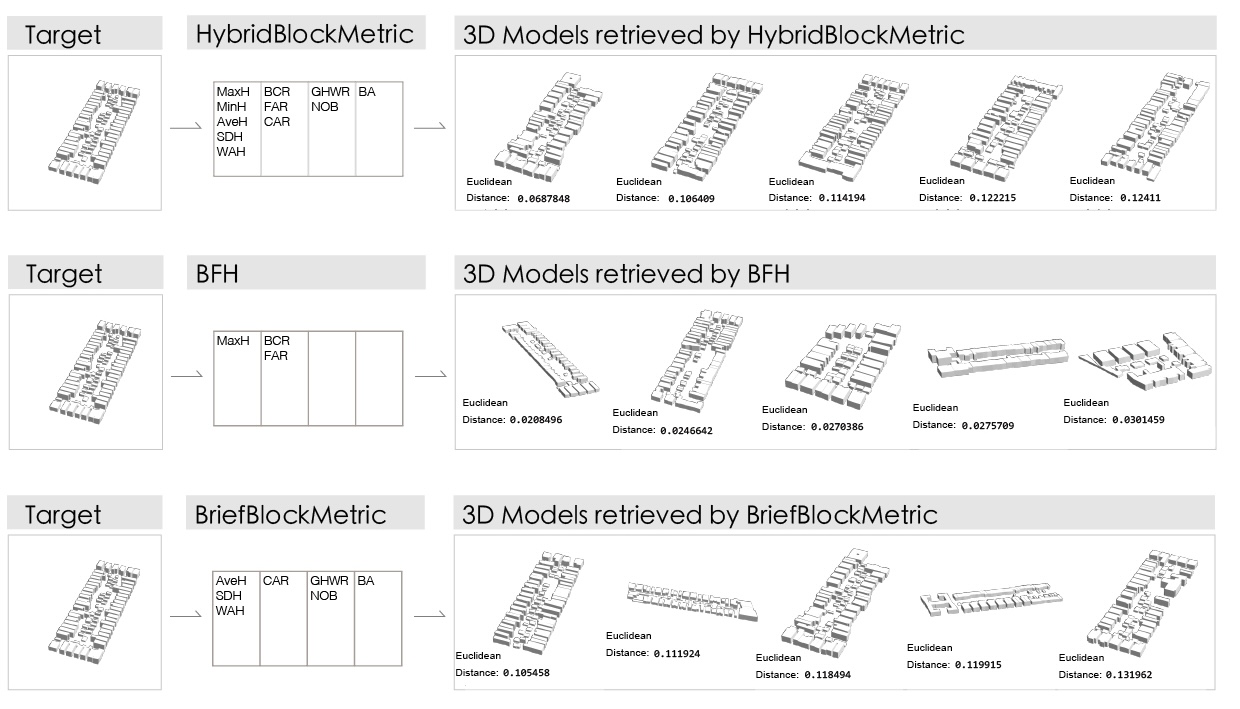
We evaluate the performance of morphology metrics in representing urban form characteristics by retrieving and comparing the 3D models that are retrieved according to our six morphology metrics. The more similar the retrieved 3D models are, the more effective the morphology metric is. Each of the nine selected cases has six types of morphology metrics and corresponding SOMEncoding vectors, based on which six lists of 3D models are retrieved. We showcase 3D models with the highest similarities to the target for further validation. For instance, in Figure 8, after setting an urban form target - case 1, its morphology metrics - HybridBlockMetric, BFH and BriefBlockMetric - are calculated. Then 3D models with the top similarities are generated according to the target’s morphology metric sets, respectively. The similarities are calculated based on the Euclidean distance to the target, with retrieved models ranked by their distances. In this demonstration using Case 1, 3D models retrieved via the HybridBlockMetric generally exhibit very high similarities to the target case. The BriefBlockMetric shows comparable performance to the HybridBlockMetric, though the second and fourth cases demonstrate lower similarity. Models retrieved using BFH, however, include dissimilar examples, such as the third, fourth, and fifth models.
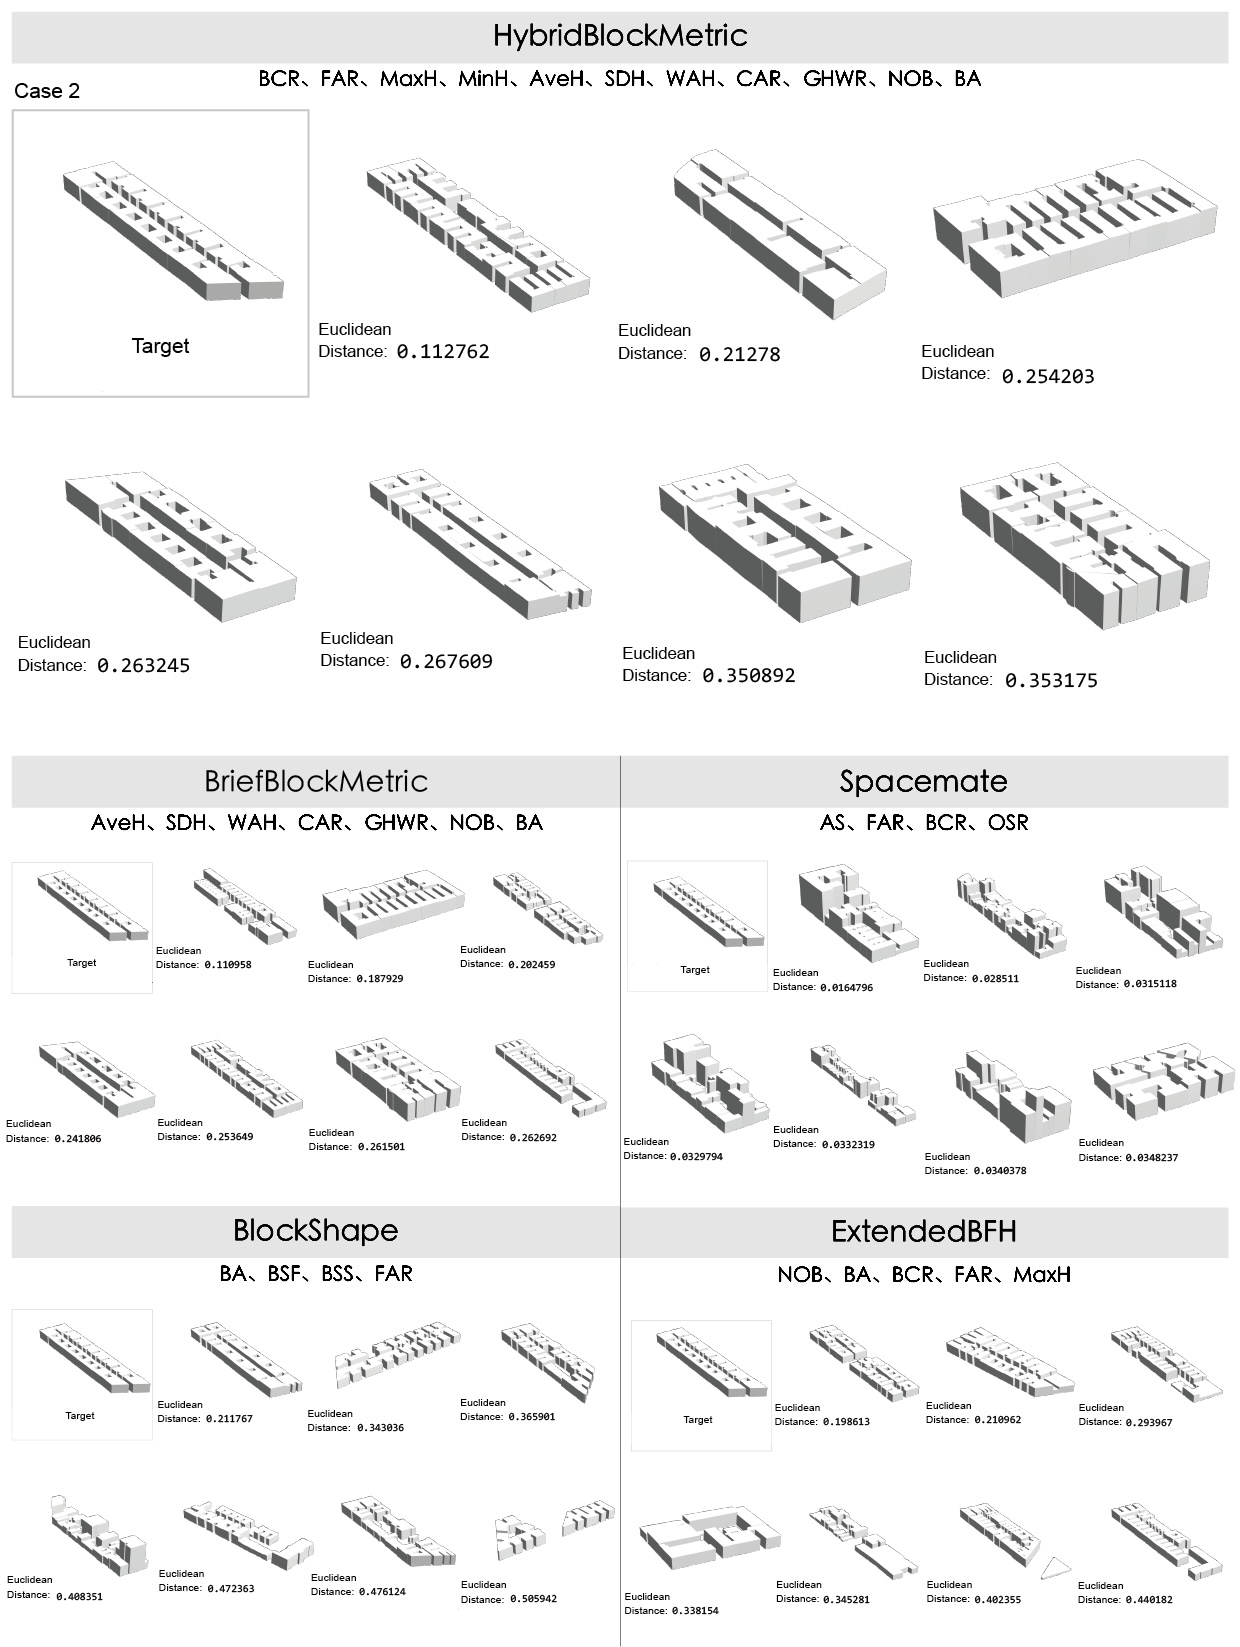
In Figure 9, case 2 is set as the target. The 3D models retrieved using the HybridBlockMetric exhibit a high degree of similarity to the target, all displaying structures with rhythmic rectangular voids or cutouts along their long sides. In contrast, models retrieved using Spacemate demonstrate significantly different patterns. Models retrieved via the BlockShape metric retain the elongated and linear block shape but exhibit varied building layouts. The BriefBlockMetric achieves a level of performance comparable to the HybridBlockMetric but remains slightly lower; for example, the second and fourth models in the first row appear less similar to the target.
In Figure 10, case 8 is set as the target. Retrieving similar urban forms to case 8 is more challenging due to the relatively irregular pattern, characterized by scattered arrangements, varying orientations, and open spaces between buildings. The BlockShape and ExtendedBFH metrics largely fail to capture this complexity, as most of the retrieved 3D models display significantly different urban forms. Among the models retrieved using Spacemate, only two or three exhibit some resemblance to the target. In contrast, the 3D models retrieved via the HybridBlockMetric once again demonstrate a high degree of similarity to the target, despite the challenges posed by the irregular urban form. HybridBlockMetric demonstrates superior performance in effectively capturing and comprehensively describing the characteristics of 3D blocks, as evidenced by these two examples, in comparison to other morphology metric sets.
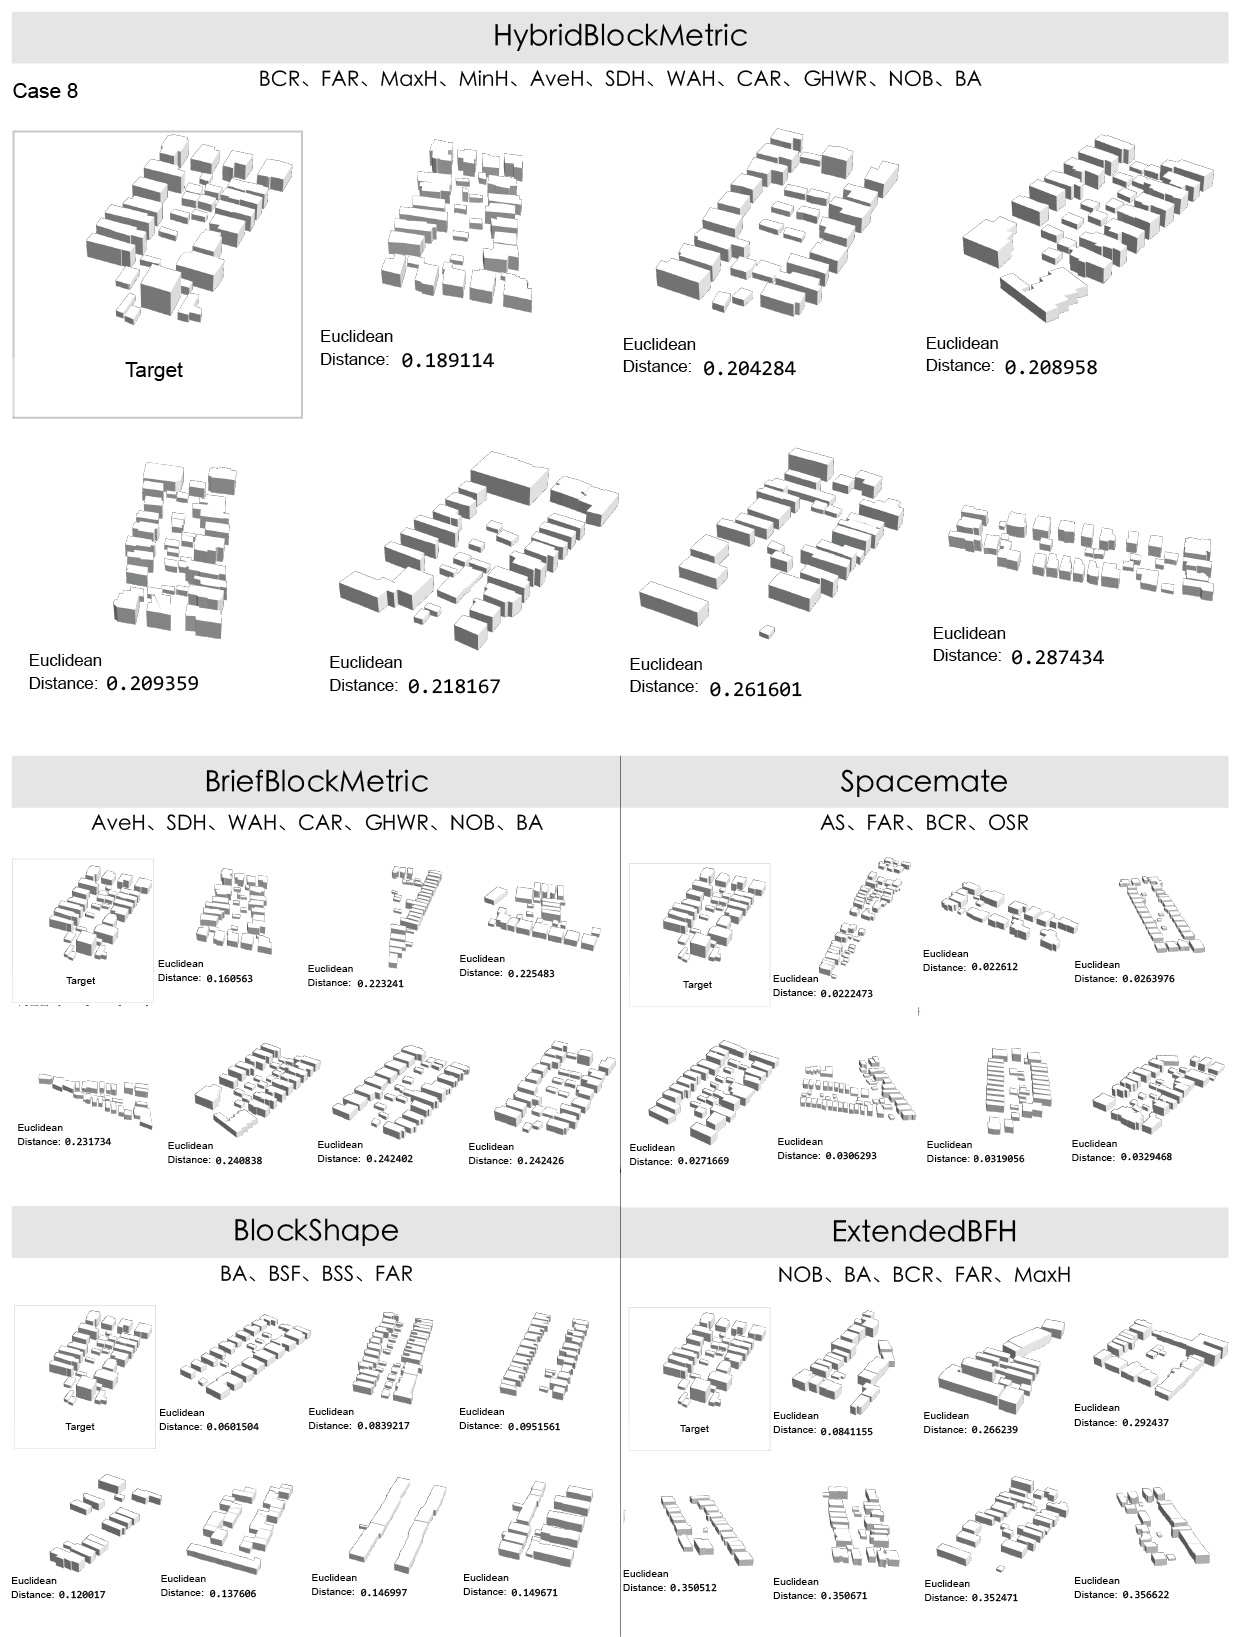
Figure 11 presents the 3D models retrieved using the HybridBlockMetric for our selected nine cases. Additional results retrieved using other morphology metric sets are provided in A.
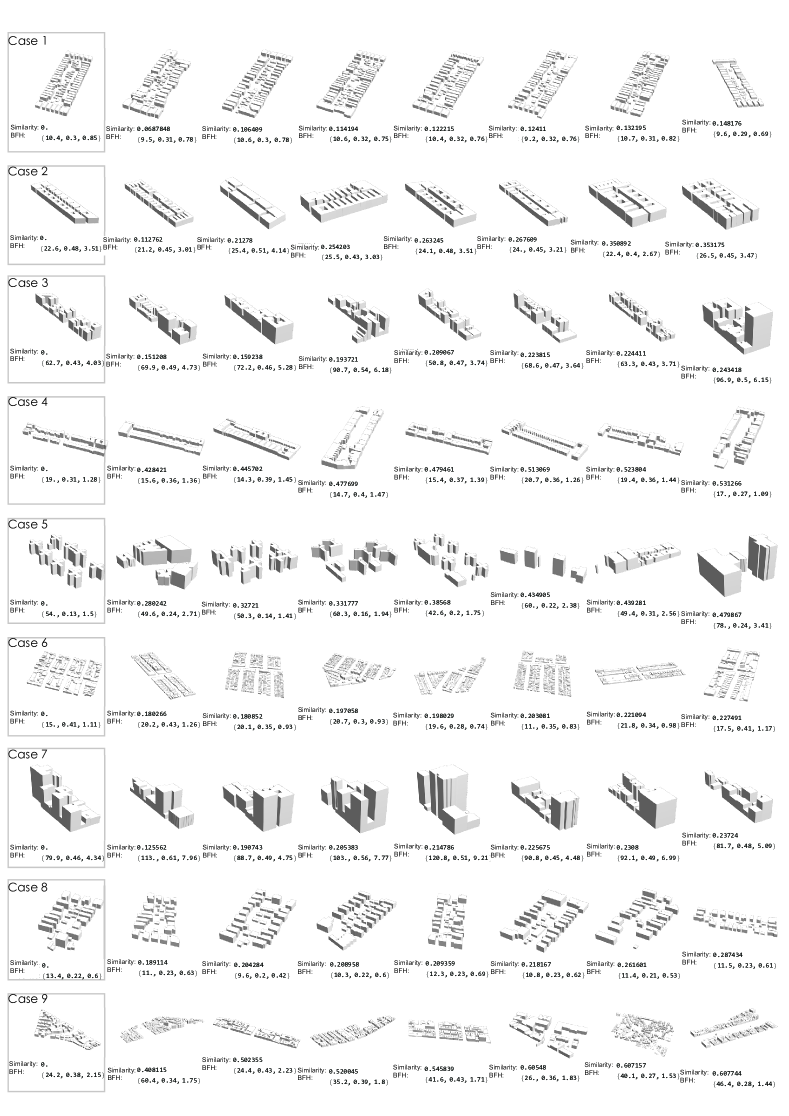
For case 3, retrieved models demonstrate a good level of similarity, capturing the medium-density, staggered building arrangement. Some variations in height and spacing, but the overall form remains consistent. For case 4, the retrieved models have elongated and fragmented layouts. Though some retrieved models show different orientations, the building layouts are still similar to the target. For case 5, the retrieved models successfully capture the cross-shaped blocks and their spacing. However, a few models (the first, sixth and last models) show variations in density and building volume. For case 6, the retrieved models present distinct characteristics of the targeted block: multiple plots with courtyard or perimeter plot configurations. Slight variations in internal plot layouts and block boundaries are present but do not significantly impact the overall similarity. For case 7, high similarity is observed, with retrieved models effectively replicating the dense, vertically dominant buildings. The arrangement and height variations closely match the target. For case 9, the retrieved models replicate the triangular form and curved block boundary to some extent, though variations in building arrangement reduce the overall resemblance. However, given that the urban form of case 9 is inherently challenging to define using computational rules, the retrieval results demonstrate the advantages of HybridBlockMetric. In summary, the 3D models retrieved using HybridBlockMetric demonstrate a high level of similarity to the target urban form prototypes while also capturing a diverse and rich variety of urban forms.
What we established by observing the results of the case retrievals is that the UMI combinations have combinatorial effects in identifying and representing 3D urban forms. HybridBlockMetric has good performance in comprehensively capturing the characteristics and complexity of 3D blocks, delivering consistently stable performance across all nine cases. It effectively represents diverse morphological prototypes and retrieves 3D blocks that are both highly similar to the target and relatively rich and diverse in urban forms. By leveraging the morphology metrics explored in this study, the proposed HybridBlockMetric demonstrates robust and convincing performance in representing urban form characteristics.
5 Discussion
5.1 Contributions
Urban morphology indicators have a combinatorial effect in representing urban forms. The results demonstrate that our study provides innovative approaches that enable the bi-directional bridging between 3D block-scale urban models and morphology metrics. Further, our study provides approaches for evaluating the effectiveness of different morphology metrics in representing 3D urban form characteristics. The results also show that our proposed HybridBlockMetric can represent volumetric block-scale urban form characteristics in terms of prototype similarity and morphological diversity. We outline our contributions:
-
1.
Our methodology offers a systematic way for deriving morphology metrics from 3D urban models, facilitating both the characterization and generation of urban form. It enables the flexible retrieval of a diverse range of 3D models with similar urban morphology based on given morphology metrics derived from 3D block-scale models, linking urban form and morphology metrics bi-directionally. As the morphology metric set can include UMI for performance evaluation, the capability allows for the integration of performance evaluation with urban form generation to advance the automation of performance-driven computational urban design.
-
2.
We extend morphology metrics to better represent urban morphology, transitioning from 2D to 3D. The vertical dimension indicators represent not only height and its derivatives but also aggregated relationships between vertical and horizontal dimensions, such as GWHR and CAR. We propose an innovative SOMEncoding method to encode morphology metric values based on the trained data space, allowing for a more context-based representation of 3D model characteristics. As a result, our approach effectively represents 3D block-scale urban morphology characteristics in digital models.
-
3.
Our systematic approaches offer a comparative method to evaluate block-scale morphology metrics for representing urban form characteristics. Based on the aforementioned metric-to-form model, the effectiveness of morphology metrics in representing urban form can be evaluated intuitively. By comparing our selected morphology metrics, we found that HybridBlockMetric represents block-scale 3D models effectively, making it a valuable finding for supporting further urban planning and design digitalization.
5.2 Directions for future work
Our study offers great potential to bridge the generation of improved urban form and optimized morphology metrics in performance-driven urban computational design. We proposed a methodology for establishing bi-directional links between morphology metrics and 3D urban forms and evaluated the performance of these morphology metrics. Many of the UMIs that constitute our morphology metrics are derived from urban form indicators primarily used for energy analysis, such as microclimate analysis.
In the further extensions, when our proposed approaches are applied to other urban form datasets, additional specific UMIs can be incorporated and further examined according to the characteristics of those urban forms. Using a case study of performance-driven design is helpful to extend our work, applying our approaches to retrieved 3D urban form models based on optimized morphology metrics with enhanced performance evaluation. For instance, by simulating and storing the energy performance of these blocks based on the morphology metrics, we can further provide improved urban form models with better energy profiles according to the input urban form types. In that way, energy implications of different urban forms can be further investigated, hence achieving a comprehensive digital link between urban form generation and design impact analysis. Integrating energy simulation into the framework can provide urban designers and planners with tools to assess the environmental impacts of their designs in real-time, fostering sustainable and efficient urban development.
6 Conclusion
The accelerating digitalization in urban planning and design underscores the importance of bi-directional links between intangible urban forms and tangible quantifications in digital models, such as real-time interactions for urban form generation and design impact analysis. This work, focusing on 3D block-scale urban forms and their morphology metrics, presents approaches for evaluating morphology metrics and associating them with 3D models that have similar urban forms. Our methodology has innovative contributions in encoding morphology metrics, evaluating morphology metrics in effectively representing features in 3D urban forms, and digitally coupling morphology metrics and 3D urban forms.
First, we extracted morphology metrics from block-scale 3D urban models, including UMIs that describe height, surface ratio, block content, and 2D block shape characteristics. The height and height variant information is included in the morphology metrics. The results demonstrate that our morphology metrics represented well the vertical dimensions of the complex 3D blocks. The 3D models were then clustered based on these morphology metrics using self-organizing maps (SOMs). We utilized SOMs not only for clustering but also for deeper encoding of the morphology metrics. Conceptually similar to Word2Vec techniques, meaningful representations for semantics are based on the context. We leverage the trained SOMs as advanced contexts to further encode the morphology metrics, hence better representing urban form characteristics in a context-aware manner.
Second, by integrating case retrieval techniques, our approach effectively associates morphology metrics with urban forms that are both similar and diverse, introducing a novel method in the field. Using the SOM encoding vectors, case retrieval results demonstrate high consistency in prototype similarity and morphological diversity, effectively addressing the representation of complex and intangible urban forms. By using this approach as a bridge, we can translate our target urban form and morphology metrics into high-level quantifications, and then, conversely, generate more urban form models that are similar to the target and maintain the diversity.
Third, our methodology provides a comparative approach to evaluating specific morphology metrics in representing targeted 3D urban forms. We emphasize the importance of developing morphology metrics that can be programmatically linked with 3D forms. Using our metric-to-form approach, we can evaluate the performance of morphology metrics based on the retrieved 3D forms. In our case, by comparing six morphology metrics, our HybridBlockMetric effectively represents block-scale 3D models. This approach is flexible and general, making it easily applicable for other evaluation purposes or datasets.
In summary, in this study, our approach provides a general and flexible way to formulate and evaluate morphology metrics for urban form in 3D block-scale models. Among the tested morphology metrics, HybridBlockMetric is a computable metric based on which numerous urban forms that are similar in prototype and rich in morphology can be retrieved. Our approach establishes the coupling between urban form and morphology metrics through a systematic methodology that simultaneously enables the characterization, generation, and performance evaluation of urban form. This methodology supports the derivation of morphology metrics from 3D models and the generation of improved urban form with enhanced performance evaluation.
Acknowledgements
Part of this research was conducted at the Future Cities Lab Global at Singapore-ETH Centre. Future Cities Lab Global is supported and funded by the National Research Foundation, Prime Minister’s Office, Singapore under its Campus for Research Excellence and Technological Enterprise (CREATE) programme and ETH Zurich (ETHZ). Part of this research was funded by the National Natural Science Foundation of China (NSFC) project (No.52378008).
CRediT author statement
Chenyi Cai: Conceptualization, Methodology, Data curation, Formal analysis, Investigation, Visualization, Writing – original draft, Writing – review & editing. Biao Li: Conceptualization, Supervision, Writing – review & editing, Funding acquisition. Qiyan Zhang: Visualization, Writing – review & editing. Xiao Wang: Writing – review & editing. Filip Biljecki: Writing – review & editing, Funding acquisition. Pieter Herthogs: Conceptualization, Writing – review & editing, Funding acquisition.
References
- Anderson et al. (1996) Anderson, W.P., Kanaroglou, P.S., Miller, E.J., 1996. Urban form, energy and the environment: a review of issues, evidence and policy. Urban studies 33, 7–35.
- Basaraner and Cetinkaya (2017) Basaraner, M., Cetinkaya, S., 2017. Performance of shape indices and classification schemes for characterising perceptual shape complexity of building footprints in gis. International Journal of Geographical Information Science 31, 1952–1977.
- Batty (1976) Batty, M., 1976. Urban modelling. Cambridge University Press Cambridge.
- Batty (1991) Batty, M., 1991. Generating urban forms from diffusive growth. Environment and Planning A 23, 511–544.
- Batty and Longley (1994) Batty, M., Longley, P.A., 1994. Fractal cities: a geometry of form and function. Academic press.
- Berghauser Pont and Haupt (2005) Berghauser Pont, M., Haupt, P., 2005. The Spacemate: Density and the typomorphology of the urban fabric. Nordic Journal of Architectural Research 4, 55–68.
- Berghauser Pont and Haupt (2021) Berghauser Pont, M., Haupt, P., 2021. Spacematrix - Space, Density and Urban Form.
- Biljecki and Chow (2022) Biljecki, F., Chow, Y.S., 2022. Global Building Morphology Indicators. Computers, Environment and Urban Systems 95, 101809. doi:10.1016/j.compenvurbsys.2022.101809.
- Biljecki et al. (2023) Biljecki, F., Chow, Y.S., Lee, K., 2023. Quality of crowdsourced geospatial building information: A global assessment of OpenStreetMap attributes. Building and Environment 237, 110295.
- Bramley and Power (2009) Bramley, G., Power, S., 2009. Urban form and social sustainability: the role of density and housing type. Environment and Planning B: Planning and Design 36, 30–48.
- Bruyns et al. (2021) Bruyns, G.J., Higgins, C.D., Nel, D.H., 2021. Urban volumetrics: From vertical to volumetric urbanisation and its extensions to empirical morphological analysis. Urban Studies 58, 922–940.
- Burian et al. (2002) Burian, S.J., Maddula, S.R.K., Velugubantla, S.P., Brown, M.J., 2002. Morphological analyses using 3D building databases: Albuquerque, New Mexico. Technical Report. LA-UR-02-6198, Los Alamos National Laboratory, Los Alamos, New Mexico.
- Cai et al. (2021) Cai, C., Guo, Z., Zhang, B., Wang, X., Li, B., Tang, P., 2021. Urban morphological feature extraction and multi-dimensional similarity analysis based on deep learning approaches. Sustainability 13, 6859.
- Cai et al. (2022) Cai, C., Zaghloul, M., Li, B., 2022. Data clustering in urban computational modeling by integrated geometry and imagery features for probabilistic navigation. Applied Sciences 12, 12704.
- Canuto et al. (2024) Canuto, R., Koenig, R., Chronis, A., Galanos, T., Celani, G., 2024. From performative to predictive-performative design: A review of current trends in performance-based design and their impact on urbanism. International Journal of Architectural Computing , 14780771241281883.
- Chadzynski et al. (2022) Chadzynski, A., Li, S., Grisiute, A., Farazi, F., Lindberg, C., Mosbach, S., Herthogs, P., Kraft, M., 2022. Semantic 3d city agents—an intelligent automation for dynamic geospatial knowledge graphs. Energy and AI 8, 100137.
- Chatzipoulka et al. (2018) Chatzipoulka, C., Compagnon, R., Kaempf, J., Nikolopoulou, M., 2018. Sky view factor as predictor of solar availability on building façades. Solar Energy 170, 1026–1038.
- Chiaradia (2019) Chiaradia, A.J., 2019. Urban morphology/urban form. The Wiley Blackwell Encyclopedia of Urban and Regional Studies , 1–6.
- Choi et al. (2021) Choi, J., Nguyen, P.C.T., Makki, M., 2021. The design of social and cultural orientated urban tissues through evolutionary processes. International Journal of Architectural Computing 19, 331–359.
- Dibble et al. (2019) Dibble, J., Prelorendjos, A., Romice, O., Zanella, M., Strano, E., Pagel, M., Porta, S., 2019. On the origin of spaces: Morphometric foundations of urban form evolution. Environment and Planning B: Urban Analytics and City Science 46, 707–730.
- Elzeni et al. (2022) Elzeni, M., Elmokadem, A., Badawy, N.M., 2022. Classification of urban morphology indicators towards urban generation. Port-Said Engineering Research Journal 26, 43–56.
- Gagne and Andersen (2012) Gagne, J., Andersen, M., 2012. A generative facade design method based on daylighting performance goals. Journal of Building Performance Simulation 5, 141–154.
- Galster et al. (2001) Galster, G., Hanson, R., Ratcliffe, M.R., Wolman, H., Coleman, S., Freihage, J., 2001. Wrestling sprawl to the ground: defining and measuring an elusive concept. Housing policy debate 12, 681–717.
- Grisiute et al. (2023) Grisiute, A., Silvennoinen, H., Li, S., Chadzynski, A., Raubal, M., Kraft, M., Von Richthofen, A., Herthogs, P., 2023. A semantic spatial policy model to automatically calculate allowable gross floor areas in singapore, in: International Conference on Computer-Aided Architectural Design Futures, Springer. pp. 455–469.
- Herfort et al. (2023) Herfort, B., Lautenbach, S., Porto de Albuquerque, J., Anderson, J., Zipf, A., 2023. A spatio-temporal analysis investigating completeness and inequalities of global urban building data in openstreetmap. Nature Communications 14. URL: http://dx.doi.org/10.1038/s41467-023-39698-6.
- Herold et al. (2002) Herold, M., Scepan, J., Clarke, K.C., 2002. The use of remote sensing and landscape metrics to describe structures and changes in urban land uses. Environment and planning A 34, 1443–1458.
- Hillier et al. (1976) Hillier, B., Leaman, A., Stansall, P., Bedford, M., 1976. Space syntax. Environment and Planning B: Planning and design 3, 147–185.
- Jabareen (2006) Jabareen, Y.R., 2006. Sustainable urban forms: Their typologies, models, and concepts. Journal of planning education and research 26, 38–52.
- Jiang et al. (2024) Jiang, F., Ma, J., Webster, C.J., Chiaradia, A.J., Zhou, Y., Zhao, Z., Zhang, X., 2024. Generative urban design: A systematic review on problem formulation, design generation, and decision-making. Progress in planning 180, 100795.
- Kämpf and Robinson (2009) Kämpf, J.H., Robinson, D., 2009. Optimisation of urban energy demand using an evolutionary algorithm, in: Proceedings of the Eleventh International IBPSA Conference, pp. 668–673.
- Kämpf and Robinson (2010) Kämpf, J.H., Robinson, D., 2010. Optimisation of building form for solar energy utilisation using constrained evolutionary algorithms. Energy and Buildings 42, 807–814.
- Kedron et al. (2019) Kedron, P., Zhao, Y., Frazier, A.E., 2019. Three dimensional (3d) spatial metrics for objects. Landscape Ecology 34, 2123–2132.
- Koenig et al. (2020) Koenig, R., Miao, Y., Aichinger, A., Knecht, K., Konieva, K., 2020. Integrating urban analysis, generative design, and evolutionary optimization for solving urban design problems. Environment and Planning B: Urban Analytics and City Science 47, 997–1013.
- Kropf (2009) Kropf, K., 2009. Aspects of urban form. Urban Morphology 13, 105–120. URL: https://journal.urbanform.org/index.php/jum/article/view/3949, doi:10.51347/jum.v13i2.3949. number: 2.
- Kropf (2018) Kropf, K., 2018. The handbook of urban morphology. John Wiley & Sons.
- Labetski et al. (2023) Labetski, A., Vitalis, S., Biljecki, F., Arroyo Ohori, K., Stoter, J., 2023. 3d building metrics for urban morphology. International Journal of Geographical Information Science 37, 36–67.
- Lee et al. (2016) Lee, G., Jeong, Y., Kim, S., 2016. Impact of individual traits, urban form, and urban character on selecting cars as transportation mode using the hierarchical generalized linear model. Journal of Asian Architecture and Building Engineering 15, 223–230.
- Li et al. (2024) Li, J., He, Z., Zhao, B., 2024. A novel method of high-density urban block form generation based on multi-objective solar performance optimization: A case study of nanjing. Energy and Buildings , 114878.
- Li et al. (2022) Li, J., You, W., Ding, W., 2022. Exploring urban space quantitative indicators associated with outdoor ventilation potential. Sustainable Cities and Society 79, 103696.
- Li and Zeng (2024) Li, K., Zeng, H., 2024. Multidisciplinary parameters for characterizing the 3D urban morphology: An overview based on the relational perspective. Sustainable Cities and Society , 105364doi:10.1016/j.scs.2024.105364.
- Liu et al. (2014) Liu, S., Fan, X., Wen, Q., Liang, W., Wu, Y., 2014. Simulated impacts of 3d urban morphology on urban transportation in megacities: case study in beijing. International Journal of Digital Earth 7, 470–491.
- Liu et al. (2020) Liu, Y., Chen, C., Li, J., Chen, W.Q., 2020. Characterizing three dimensional (3-d) morphology of residential buildings by landscape metrics. Landscape Ecology 35, 2587–2599.
- Liu et al. (2017) Liu, Y., Wu, J., Yu, D., 2017. Characterizing spatiotemporal patterns of air pollution in china: A multiscale landscape approach. Ecological Indicators 76, 344–356.
- Lowry and Lowry (2014) Lowry, J.H., Lowry, M.B., 2014. Comparing spatial metrics that quantify urban form. Computers, Environment and Urban Systems 44, 59–67.
- Lynch and Rodwin (1958) Lynch, K., Rodwin, L., 1958. A theory of urban form. Journal of the American institute of planners 24, 201–214.
- Mandić and Tepavčević (2015) Mandić, M., Tepavčević, B., 2015. Analysis of shape grammar application as a tool for urban design. Environment and Planning B: Planning and Design 42, 675–687.
- Mashhoodi and Unceta (2024) Mashhoodi, B., Unceta, P.M., 2024. Urban form and surface temperature inequality in 683 european cities. Sustainable Cities and Society , 105690.
- Miao et al. (2018) Miao, Y., Koenig, R., Knecht, K., Konieva, K., Buš, P., Chang, M.C., 2018. Computational urban design prototyping: Interactive planning synthesis methods—a case study in cape town. International Journal of Architectural Computing 16, 212–226.
- Moudon (1997) Moudon, A.V., 1997. Urban morphology as an emerging interdisciplinary field. Urban morphology 1, 3–10.
- O’Neill et al. (1988) O’Neill, R.V., Krummel, J., Gardner, R.e.a., Sugihara, G., Jackson, B., DeAngelis, D., Milne, B., Turner, M.G., Zygmunt, B., Christensen, S., et al., 1988. Indices of landscape pattern. Landscape ecology 1, 153–162.
- Pan et al. (2008) Pan, X.Z., Zhao, Q.G., Chen, J., Liang, Y., Sun, B., 2008. Analyzing the variation of building density using high spatial resolution satellite images: the example of shanghai city. Sensors 8, 2541–2550.
- Panão et al. (2008) Panão, M.J.O., Gonçalves, H.J., Ferrão, P.M., 2008. Optimization of the urban building efficiency potential for mid-latitude climates using a genetic algorithm approach. Renewable Energy 33, 887–896.
- Rakha and Reinhart (2012) Rakha, T., Reinhart, C., 2012. Generative urban modeling: a design work flow for walkability-optimized cities. Proceedings of SimBuild 5, 255–262.
- Ratti et al. (2003) Ratti, C., Raydan, D., Steemers, K., 2003. Building form and environmental performance: archetypes, analysis and an arid climate. Energy and buildings 35, 49–59.
- Rode et al. (2014) Rode, P., Keim, C., Robazza, G., Viejo, P., Schofield, J., 2014. Cities and energy: urban morphology and residential heat-energy demand. Environment and Planning B: Planning and Design 41, 138–162.
- Rybarczyk and Wu (2014) Rybarczyk, G., Wu, C., 2014. Examining the impact of urban morphology on bicycle mode choice. Environment and Planning B: Planning and Design 41, 272–288.
- Scheer (2016) Scheer, B.C., 2016. The epistemology of urban morphology. Urban morphology 20, 5–17.
- Shen and Ye (2024) Shen, X., Ye, X., 2024. Environmental performance driven optimization of urban modular housing layout in singapore. Journal of Asian Architecture and Building Engineering , 1–14.
- Shi et al. (2017) Shi, Z., Fonseca, J.A., Schlueter, A., 2017. A review of simulation-based urban form generation and optimization for energy-driven urban design. Building and Environment 121, 119–129.
- Soliman et al. (2018) Soliman, A., Mackay, A., Schmidt, A., Allan, B., Wang, S., 2018. Quantifying the geographic distribution of building coverage across the us for urban sustainability studies. Computers, Environment and Urban Systems 71, 199–208.
- Stouffs and Rafiq (2015) Stouffs, R., Rafiq, Y., 2015. Generative and evolutionary design exploration. AI EDAM 29, 329–331.
- Tsai (2005) Tsai, Y.H., 2005. Quantifying urban form: compactness versus’ sprawl’. Urban studies 42, 141–161.
- Vermeulen et al. (2013) Vermeulen, T., Kämpf, J.H., Beckers, B., 2013. Urban form optimization for the energy performance of buildings using citysim. Proceedings of CISBAT 2013 cleantech for smart cities and buildings , 915–920.
- Wan et al. (2024) Wan, Y., Du, H., Yuan, L., Xu, X., Tang, H., Zhang, J., 2024. Exploring the influence of block environmental characteristics on land surface temperature and its spatial heterogeneity for a high-density city. Sustainable Cities and Society , 105973.
- Wang et al. (2020) Wang, X., Song, Y., Tang, P., 2020. Generative urban design using shape grammar and block morphological analysis. Frontiers of Architectural Research 9, 914–924.
- Wilson et al. (2019) Wilson, L., Danforth, J., Davila, C.C., Harvey, D., 2019. How to generate a thousand master plans: A framework for computational urban design. SimAUD 2019 , 113–119.
- Wu et al. (2017) Wu, Q., Guo, F., Li, H., Kang, J., 2017. Measuring landscape pattern in three dimensional space. Landscape and Urban Planning 167, 49–59.
- Xu and Li (2019) Xu, J., Li, B., 2019. Application of Case-Based Methods and Information Technology in Urban Design - The Renewal Design of the urban region around Roma Railway Station, in: CAADRIA 2019: Intelligent & Informed, Wellington, New Zealand. pp. 625–634. doi:10.52842/conf.caadria.2019.1.625.
- Yang et al. (2022) Yang, L., Yang, X., Zhang, H., Ma, J., Zhu, H., Huang, X., 2022. Urban morphological regionalization based on 3d building blocks—a case in the central area of chengdu, china. Computers, Environment and Urban Systems 94, 101800.
- Yi and Kim (2015) Yi, Y.K., Kim, H., 2015. Agent-based geometry optimization with genetic algorithm (ga) for tall apartment’s solar right. Solar Energy 113, 236–250.
- Yin et al. (2018) Yin, C., Yuan, M., Lu, Y., Huang, Y., Liu, Y., 2018. Effects of urban form on the urban heat island effect based on spatial regression model. Science of the Total Environment 634, 696–704.
- Yu et al. (2020) Yu, S., Chen, Z., Yu, B., Wang, L., Wu, B., Wu, J., Zhao, F., 2020. Exploring the relationship between 2d/3d landscape pattern and land surface temperature based on explainable extreme gradient boosting tree: A case study of shanghai, china. Science of the Total Environment 725, 138229.
- Yu et al. (2015) Yu, W., Li, B., Jia, H., Zhang, M., Wang, D., 2015. Application of multi-objective genetic algorithm to optimize energy efficiency and thermal comfort in building design. Energy and Buildings 88, 135–143.
- Zhang et al. (2018) Zhang, H., Dana, K., Shi, J., Zhang, Z., Wang, X., Tyagi, A., Agrawal, A., 2018. Context encoding for semantic segmentation, in: Proceedings of the IEEE conference on Computer Vision and Pattern Recognition, pp. 7151–7160.
- Zhang et al. (2019) Zhang, J., Xu, L., Shabunko, V., Tay, S.E.R., Sun, H., Lau, S.S.Y., Reindl, T., 2019. Impact of urban block typology on building solar potential and energy use efficiency in tropical high-density city. Applied Energy 240, 513–533.
- Zhang et al. (2023) Zhang, P., Ghosh, D., Park, S., 2023. Spatial measures and methods in sustainable urban morphology: A systematic review. Landscape and Urban Planning 237, 104776.
- Zhang et al. (2024) Zhang, X., Wang, X., Du, S., Tian, S., Jia, A., Ye, Y., Gao, N., Kuang, X., Shi, X., 2024. A systematic review of urban form generation and optimization for performance-driven urban design. Building and Environment , 111269.
- Zhao and Gou (2023) Zhao, K., Gou, Z., 2023. Influence of urban morphology on facade solar potential in mixed-use neighborhoods: Block prototypes and design benchmark. Energy and Buildings 297, 113446.
- Zhou et al. (2022) Zhou, L., Yuan, B., Hu, F., Wei, C., Dang, X., Sun, D., 2022. Understanding the effects of 2d/3d urban morphology on land surface temperature based on local climate zones. Building and Environment 208, 108578.
Appendix A Evaluating morphology metrics by comparison
This appendix is a supplementary to section 4.2, showing the urban form retrieval results by comparing 5 morphology metric sets.