[orcid=0000-0003-3686-0793] \cormark[1] [orcid=0009-0004-8814-8946] [orcid=0000-0002-3219-7587]
Assessing the viability of non-light water reactor concepts for electricity and heat generation in decarbonized energy systems
Abstract
Recent pledges to triple global nuclear capacity by 2050 suggest a "nuclear renaissance," bolstered by reactor concepts such as sodium-cooled fast reactors, high-temperature reactors, and molten salt reactors. These technologies claim to address the challenges of today’s high-capacity light-water reactors, i.e., cost overruns, delays, and social acceptance, while also offering additional non-electrical applications. However, this analysis reveals that none of these concepts currently meet the prerequisites of affordability, competitiveness, or commercial availability. We omit social acceptability. The cost analysis reveals optimistic FOAK cost assumptions of 5,623 to 9,511 USD per kW, and NOAK cost projections as low as 1,476 USD per kW. At FOAK cost, the applied energy system model includes no nuclear power capacity, and thus indicates that significant cost reductions would be required for these technologies to contribute to energy system decarbonization. In low-cost scenarios, reactors capable of producing high temperature heat become competitive with other low-carbon technologies. We conclude that, for reactor capacties to increase significantly, a focus on certain technology lines ist necessary. However, until a concept becomes viable and commercially available, policymakers should prioritize existing technologies to decarbonize energy systems.
keywords:
nuclear power \sepdecarbonized energy system \sepnuclear renaissance \sepnon-light water reactors \sepcogeneration \sepenergy system model \sepnon-electrical applicationsAnalysis of historical and ongoing non-electrical applications of nuclear power
Assessment of the viability of different reactor concepts for such applications
Detailed cost analysis for proposed non-light water reactor concepts
Energy system modeling of nuclear cogeneration with parallel renewables expansion
1 Introduction
There is a broad consensus that decarbonizing energy systems is necessary to limit global warming and reduce the potentially hazardous effects of climate change [1]. However, extensive debates exist on the means to this end, especially regarding the technologies that are part of a cost-efficient and executable solution. In these debates, nuclear power is often considered a low-carbon technology that will play a significant part in global energy system decarbonization [2, 1], albeit existing uncertainties regarding the cost-efficiency and availability of this technology [3, 4, 5, 6, 7, 8]. In the last decade, these prospects have launched a narrative of a so-called "nuclear renaissance" coinciding with the promotion of so-called new reactor (SNR) concepts, or "advanced" reactor technologies [9, 10]. This is supported by recent governmental proclamations of plans to triple the installed nuclear power plant capacity by 2050 [11].
These ambitious expansion targets stand against a number of challenges that the industry is currently facing [7], including cost escalations when building new high-capacity light water reactors (LWR) [3, 4], uncertainty regarding the availability of so-called "small modular reactors" (SMR) and other "advanced" reactor concepts [5] as well as a limited actor base [12]. These challenges raise concerns about whether the nuclear industry will be able to live up to the high expectations raised by proponents of the proclaimed nuclear renaissance.
Currently, several SNR concepts are being developed. According to a 2023 report by the U.S. "Committee on Laying the Foundations for New and Advanced Nuclear Reactors" [13, p.43], these concepts must fulfill four conditions to be competitive in an energy system with a high share of fluctuating renewables: They must be 1) "affordable for owner investment without ’betting the company’", 2) "economically competitive with other technologies […]", 3) "socially acceptable", and 4) "commercially available." This coincides with required overnight construction costs in the range of 2000 to 6000 USD per kW and the establishment and diffusion of non-electrical uses for nuclear power plants [14, 15, 13]. However, there is a considerable discrepancy between cost assumptions or projections and actual costs of high capacity LWR projects, especially in OECD countries [8]. For SMR and SNR concepts, limited operational experience hinders the availability of accurate cost and other performance data [7]. Especially for SMR concepts, manufacturers’ cost projections appear somewhat optimistic compared to production theory [5]. Nonetheless, smaller sizes, non-electrical uses, and other benefits of nuclear, such as reliability and flexibility, could increase the competitiveness of both SNR and SMR concepts [16, 17, 18].
Further, most previous studies limit their assessment of the role of nuclear power in future energy systems to existing technologies (i.e., high capacity LWRs) and electricity production [14, 19, 20, 8]. At the same time, some literature refers to "advanced" reactor technologies with links to (thermal) storage options (e.g., [2, 21]). However, to our knowledge, a gap exists regarding the detailed assessment of the potential of non-electrical applications for nuclear power. Further, a model-based consideration of the potential non-electrical applications of different nuclear reactor concepts is missing due to the limitation of previous studies on a single respective reactor design.
Thus, in this work, we assess the potential validity of SMR and SMR concept applicability in future energy systems, including non-electrical applications, by following a three-step approach. First, based on an extensive literature assessment, we investigate potential non-electrical applications of nuclear power, e.g., for heat applications, and discuss technology availability. Second, we discuss the potential costs for each technology based on an analysis of 51 references. Third, based on the prior steps, we investigate the economic efficiency of these technologies by integrating them into a European energy system model [22] with the ability to generate both electricity and heat. Assuming SNR technologies become commercially available, we find that costs must be reduced substantially, i.e., well below current LWR project costs in Europe, and reactor concepts compete mainly for heat provision in which competitive low-carbon technologies are similarly expensive.
The remainder of this work is structured as follows. Section LABEL:background provides the main results of the literature assessment on use cases and technology availability, and of the cost data analysis. Section 3 introduces the applied energy system model and relevant assumptions and data. The results of the energy system model are presented in Section 4, and are discussed in Section 5. Section 6 concludes. Further background information is provided in the Appendix.
2 Background
LABEL:background
This section gives an overview of potential non-electrical use cases for nuclear power and of reactor concept availability. Further, we provide an assessment of cost projections for these currently commercially unavailable reactor concepts. This section provides relevant background information for the implementation of the energy system model regarding scenario definition and technology selection.
2.1 Potential Non-electrical Applications of Nuclear Power
Despite the dominance of LWRs in today’s global nuclear fleet, which is mainly used to generate electricity [23], the cogeneration of electricity and heat has been the subject of literature and technology development for decades, as in general, nuclear reactors are already "heat generation devices" [24, p. 23]. Csik and Kupitz [24] further differentiate between reactors intended for heat generation only and those that can also produce electricity, allowing some degree of flexibility. However, cogeneration experience remains limited to individual applications; see Appendix A. This results from the low-level output temperature from LWRs, which limits the economic retrievability of energy. However, this output temperature could theoretically be raised at the expense of electricity generation [25].
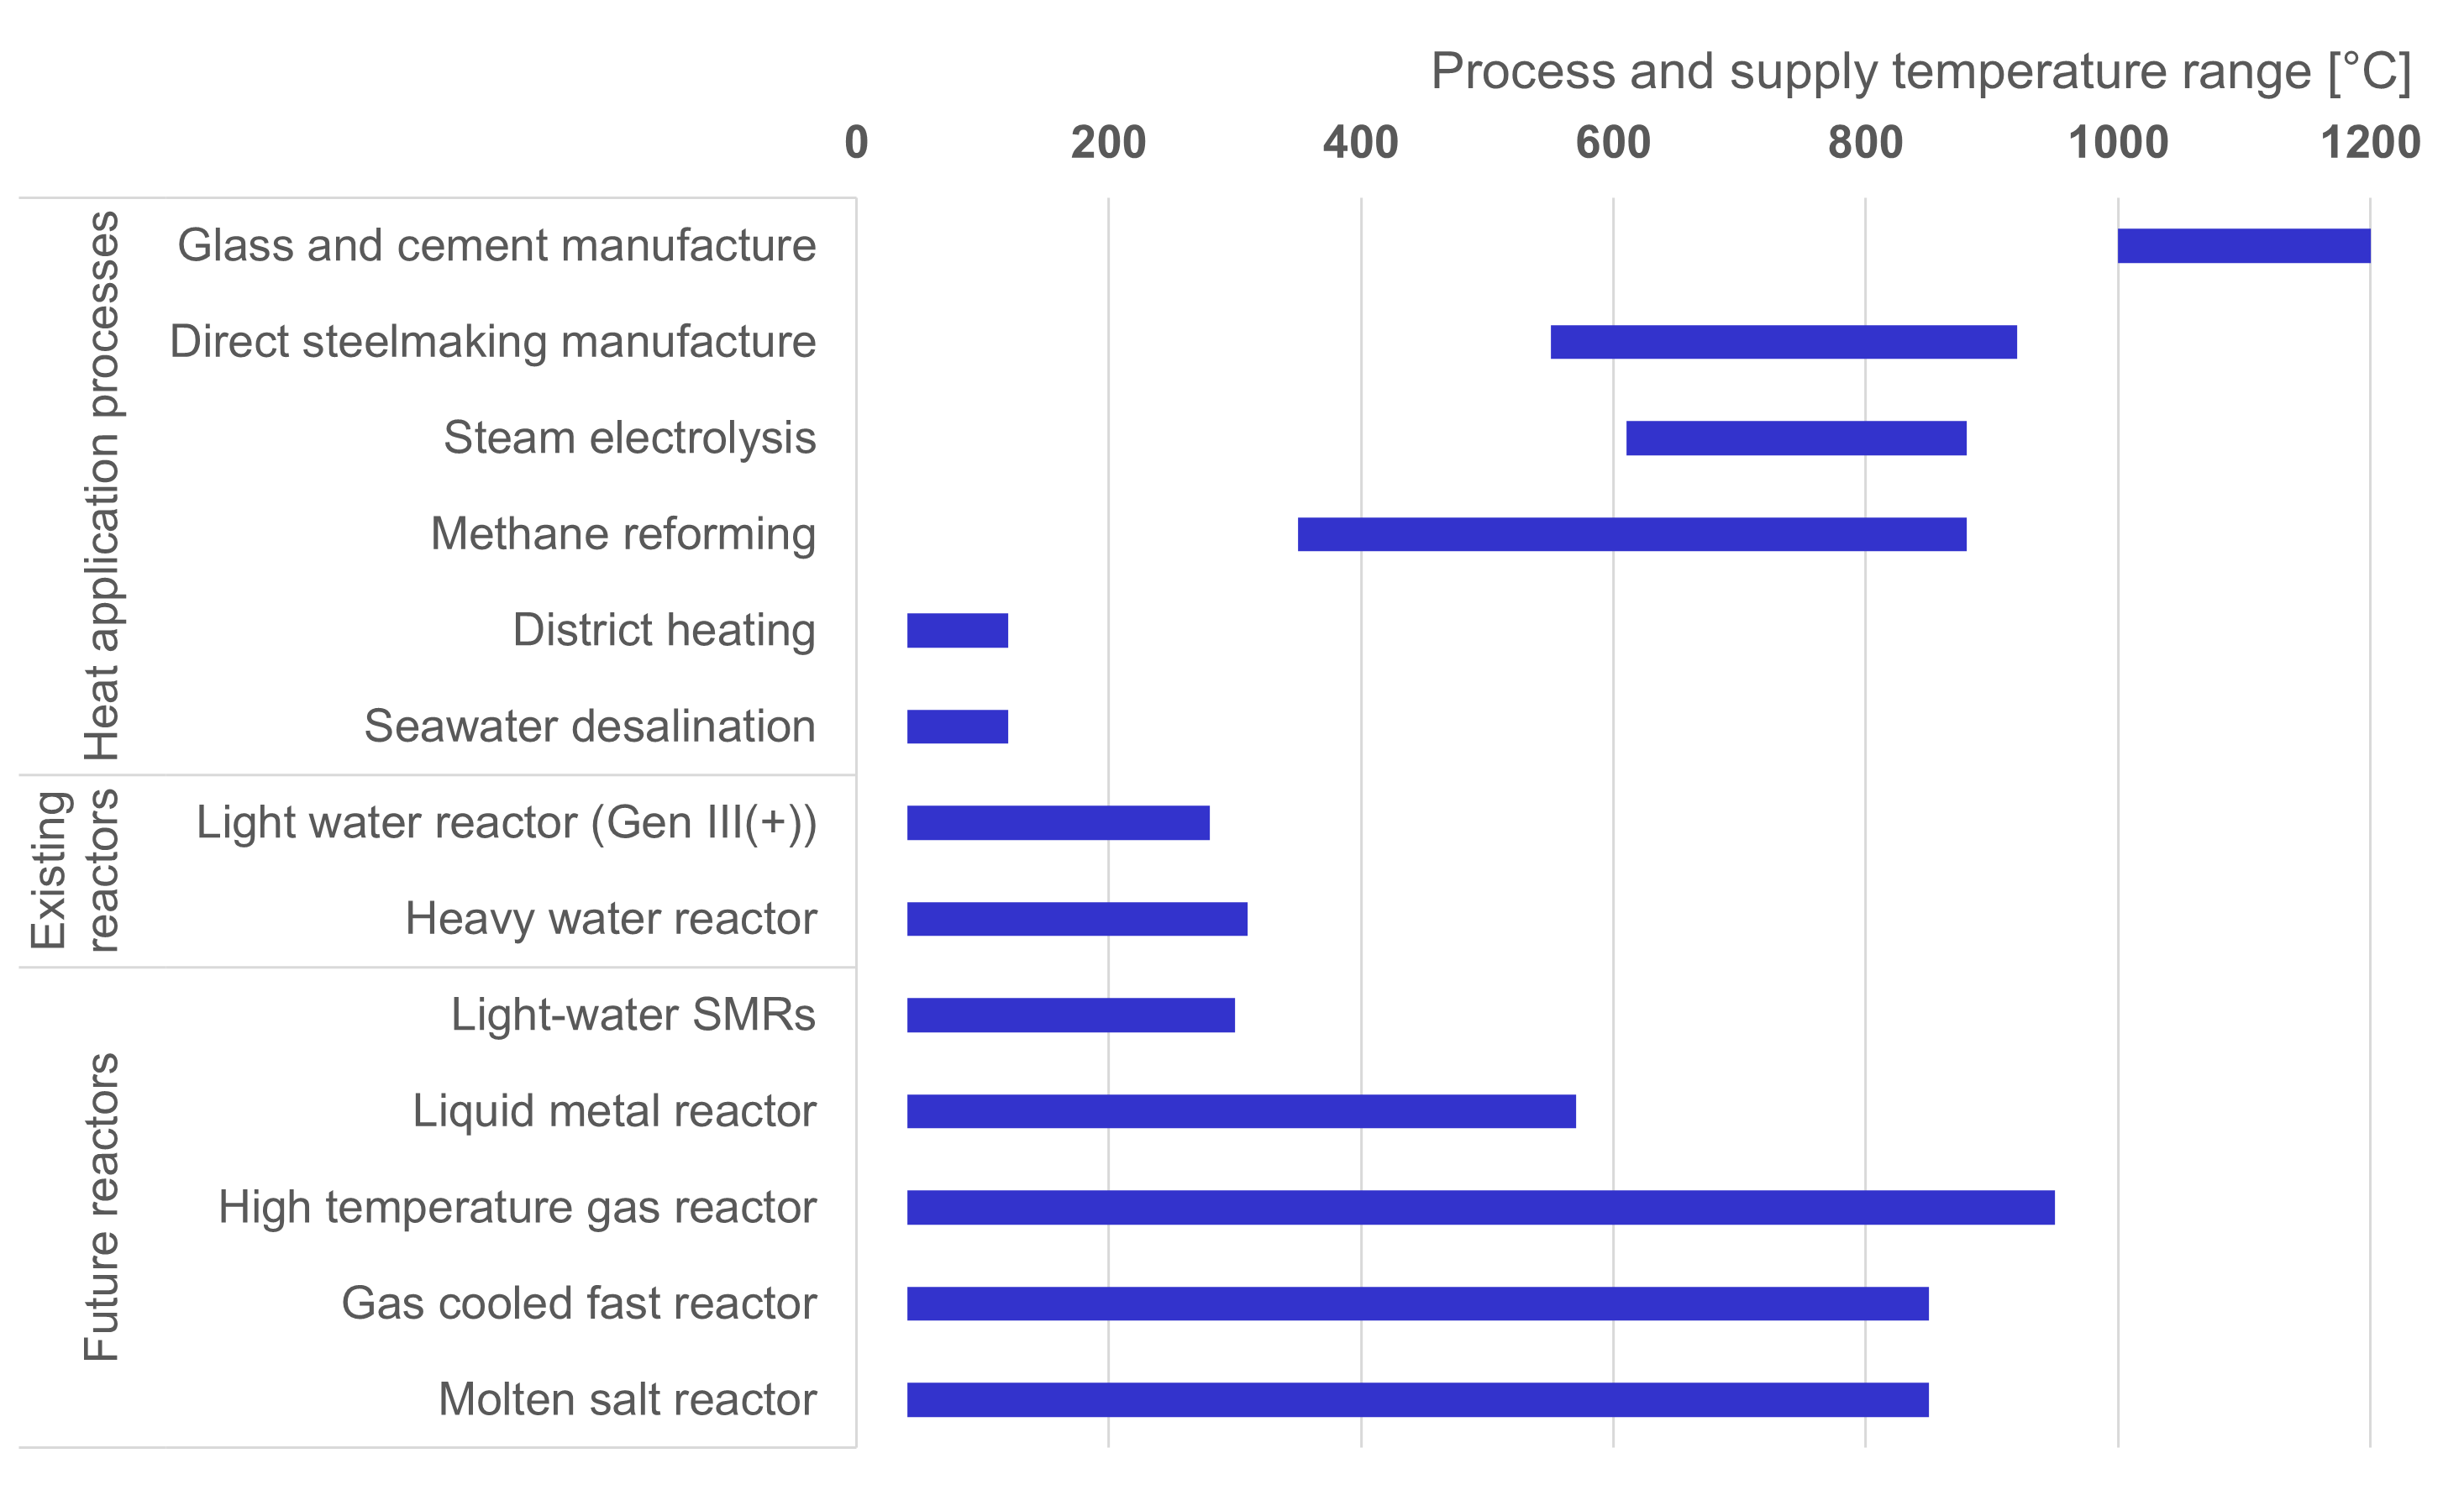
The remainder of this section provides an overview of the potential applications of nuclear power plants for non-electrical uses, such as the provision of industrial and district heat. An overview of possible applications and potential reactor types is shown in Figure 1, and several agency reports provide detailed overviews of potential applications of nuclear cogeneration [26, 27, 28, 29]. A list of nuclear power plants used for non-electrical energy provision is provided in Appendix A, showing that historical applications are limited to individual plants.
2.1.1 District Heat
Nuclear power reactors have been supplying low-temperature heat up to 100°C for district heating for decades [30, 31]. While there are issues related to acceptance, e.g., addressing the proximity to populated areas [13], regulation, e.g., regarding the establishment of emergency planning zones [31, 18], as well as technology, e.g., the challenge of efficiency losses when transferring heat over long distances [25, 17], SMRs and SNRs are thought to be especially applicable to this use case [31]. There have been several attempts to design reactors specifically for district heating in Sweden, Finland, and China [30, 31]. Mostly in Eastern Europe, there exists decade-long experience with district heating via nuclear cogeneration, for example, at the Kozloduy plant in Bulgaria, the Bohunice V-2 plant in Slovakia, or the Paks plant in Hungary. The heat is used for small demand centers nearby [32, 29]. Additionally, in 2019, two Westinghouse AP1000 reactors began providing district heat to the city of Haiyang in China [33].
2.1.2 Process Heat for Industry
Decarbonizing the provision of heat for industrial processes such as cement production and steel manufacturing is challenging as most processes require heightened temperature levels of several hundred °C and a near-constant provision of energy [34]. For decades, it has been argued that nuclear power can provide both the required heat and capacity. For example, current high-capacity LWRs can theoretically produce heat ranging from 200 to 300 °C, applicable for pulp, paper, and textiles manufacturing or seawater desalination (see Section 2.1.4), and advanced gas-cooled reactors currently operating in the U.K., can provide heat up to 650°C, a temperature level relevant for the chemical industry [24]. So far, however, experience is limited to individual, mostly low-capacity demonstration projects that use mainly excess heat from electricity generation. Examples include the Calder Hall gas-cooled reactors, built in the 1950s in the U.K., which provided steam to the nearby Windscale reprocessing plant, or the Gösgen plant in Switzerland, which has been supplying heat to a nearby cardboard factory using 1% of its steam since 1979 [35]. In Canada, the Bruce heavy-water nuclear plant provided heat for its own usage but also to a greenhouse, an ethanol plant, and a plastic film production plant, amongst others, covering distances of over six kilometers [32]. The Norwegian boiling heavy water research reactor in Halden provided heat that would have otherwise been dissipated into a nearby river to a paper mill until the reactor was closed in 2018 [28].
2.1.3 Hydrogen Production
The use of hydrogen in industrial processes, but also for energy storage, is becoming increasingly relevant in decarbonization efforts [36, 34]. In general, there exist two ways in which nuclear energy could be utilized for hydrogen production. Either via heat provision for steam methane reforming [37] and for other thermo-chemical processes such as sulfur-iodine hydrogen production at temperatures greater than 750°C [38, 39], or via the generation of electricity for an electrolyzer, which would lead to further competition with renewables and raise efficiency concerns [38, 40]. Pinsky et al. [41] assess the applicability of so-called nuclear hybrid systems for hydrogen production and conclude that most currently available technologies for which nuclear could become competitive remain commercially unavailable. This assessment is supported by the lack of commercial nuclear hydrogen production projects, such as the scrapped U.S. Department of Energy project [37, 42].
2.1.4 Other Applications
Other non-electrical nuclear power applications include marine propulsion technology, most recently applied in Russia for the Akademik Lomonosov [23], and in nuclear submarines [43]. Other nuclear propulsion devices are used in outer space [26]. Seawater desalination is a particular use case for nuclear power applied at several locations [44]. Different desalination processes require different forms of energy, such as electricity (reverse osmosis) or heat (multi-effect distillation or multi-stage flash) [45], and are thus applicable to different reactor types or configurations. Required temperatures range from 200 to 300 °C [24]. Operational experience is limited to Japan, where since 1978, one BWR and seven PWRs use district heat for small seawater desalination plants, to Kazakhstan, where the first nuclear desalination facility at Aktau operated a sodium-cooled fast reactor from 1973 to 1999, to several Russian civilian nuclear-powered ships, operated since the 1980s, and to the Diablo Canyon power plant in California [46, 32].
2.2 Nuclear Technologies and Availability
The nuclear industry has been in decline for several decades, especially in OECD countries, as only a few projects were realized, which were behind schedule, well over budget, and resulted in a decline of major industry actors (e.g., the bankruptcy of Westinghouse) [12]. Most discussed nuclear technologies are either unavailable or economically disadvantageous compared to other low-carbon technologies, and thus, new-builds are mainly realized in state-owned spheres, especially in China and Russia [4, 23]. Regardless, ambitious expansion plans for nuclear power are being publicly announced [11], and nuclear power continues to play a significant role in energy scenarios [1]. While the global nuclear fleet is dominated by high-capacity LWRs, electrical and non-electrical applications are envisioned to be implemented by using LWRs with capacity of less than 300 MWel (referred to here as "small-modular reactors" (SMRs)) and so-called "new reactor concepts" (SNR), also referred to as "advanced" or "Generation IV" reactors, that comprise several non-light water reactor concepts [7, 29]. These alternative concepts must also fulfill four prerequisites to be viable for large-scale deployment in a future decarbonized energy system. They must be 1) affordable, 2) economically competitive with other low-carbon technologies, 3) socially acceptable, and 4) available on a commercial scale [13]. In the following, we briefly discuss these prerequisites for often discussed reactor types, while omitting questions of social acceptance. See Appendix B for more technical details and information on past and ongoing research and development for the here-discussed non-light water reactor technologies.
2.2.1 Light Water Reactors
High-capacity LWR
High-capacity light water reactors (LWR), i.e., reactors exceeding capacities of 300 MWel, referred to also as "Generation III(+)" reactors, dominate global reactor fleets today [23]. These reactors are usually operated as "baseload" plants with relatively high capacity factors and are mostly limited to electricity production. As discussed in Section 2.1, individual plants have also produced district or process heat. Currently, the construction of new plants is limited mostly to Russian and Chinese projects and will have to compensate for aging reactor fleets facing closure [23]. Projects in Europe and the U.S. are pained by cost and construction duration escalations [3], and a limited actor base shows an industry in decline [12]. Thus, it is highly questionable whether these reactor types will be available on a sufficient scale for energy system decarbonization in the coming decades [7]. Independent and reliable cost data is available for Western (OECD) countries [16]. At current cost levels, LWRs are not economically competitive against renewable energies in a low-carbon energy system [47, 8]. Nonetheless, assuming that aging fleets were to be replaced with new reactors, flexible operation and heat provision are technically feasible and could bring benefits to a system characterized by a high degree of renewables, such as lower system operational costs, increased reactor owner revenues, and reduced curtailment of renewables [19].
Small Modular Reactors (Low-capacity LWRs)
SMRs are envisioned to reduce costs compared to LWRs mainly due to modularization and factory production of components, facilitated regulation, passive safety systems, and shorter construction times that would reduce capital costs, amongst others [48, 5]. Further, SMRs are proposed for niche applications, such as energy-intensive operations in remote locations [49]. In 2014, Liu and Fan [50] assumed that light water SMRs could be on a high technology readiness level of 7 to 8 and could be elevated to level 9, i.e., the operation of a functioning system, within the next ten years because of experience of similar reactor concepts in the 1950s and 1960s. However, the transferability of knowledge from early concepts should be questioned, primarily due to increased safety requirements for nuclear reactors [51]. Operation and construction experience of SMRs is limited to a small number of research and prototype reactors that have, in parallel to their high-capacity counterparts, also suffered from decade-long construction times or are still in the licensing stage and remain years away from actual operation [7, 52]. Additionally, to be economically competitive with other low-carbon technologies, SMRs would first have to overcome diseconomies of scale, and even then, cost projections by manufacturers are likely overly optimistic [5]. Nonetheless, SMRs are considered for potential non-electrical applications. For example, the NuScale VOYGR is expected to be able to provide a pre-heated feedstock of heat for refinery processes at around 300 °C [45], and it is supposed to be compatible with a high-temperature electrolyzer for hydrogen production [45, 53, 37]. The only VOYGR order, however, was canceled in late 2023 due to cost escalations [54].
2.2.2 Reactors with Fast Neutron Spectra
Reactors operating on a fast neutron spectrum, so-called fast breeders (FBR), were historically considered to be part of historical nuclear capacity expansions in a so-called "plutonium economy" [55, 56]. The envisioned fuel cycle would reuse plutonium from spent fuel via reprocessing and MOX-fuel fabrication to decrease the demand for natural uranium (referred to as the closed fuel cycle) [57]. Proponents envisaged that FBRs would replace LWRs and energy would become "too cheap to meter" [58][p. 9]. There have been several attempts to establish FBRs for large-scale energy generation, but none have succeeded on a commercial scale [59]. The following section briefly addresses the two most common types, sodium-cooled fast reactors (SFR) and lead-cooled fast reactors (LFR). Gas-cooled fast reactors are omitted due to the lack of prototypes, see Appendix B.
Sodium-cooled Fast Reactors
SFRs were amongst the first reactor concepts to be developed in the wake of feared uranium source depletion that would ultimately render LWRs inoperable. However, while projected nuclear capacity expansions did not formulate and new uranium deposits were discovered, the economic deficiencies and the high technological complexity of SFRs remained, and a large-scale commercial deployment never happened [60, 61]. SFR projects are characterized by project failures rather than operational reactors, and due to, e.g., the high reactivity of sodium with air and water, operational reactors are unreliable [7]. Regardless, four SFRs are currently under construction [62], and increased thermal efficiency coupled with outlet temperatures of 400 to 450°C could make SFRs applicable for non-electrical applications in niche markets, despite economic deficiencies stemming mostly from additional safety requirements [63]. Current projects include a 345 MWel SFR coupled with a molten salt tank, designed by U.S.-company TerraPower, currently undergoing pre-licensing activities with regulators [23].
Lead-cooled fast reactors
Lead-cooled fast reactors (LFR) operate similarly to SFRs, but use lead as a coolant. Lead is less reactive than sodium and could thus reduce operational risks and necessary safety barriers [64]. However, operational experience is almost exclusively limited to Russia, where LFRs were experimented with for submarine propulsion, and a single reactor is currently under construction [60]. Further, a demonstration LFR with an accelerator-driven system is currently under development in Belgium (MYRRHA) [63]. Due to limited operational experience, cost information is scarce. However, it is expected that LFRs could be cheaper than SFRs due to reduced safety risks, and if a closed fuel cycle can be implemented, LFRs might also compete with current LWRs [64].
2.2.3 High temperature reactors
Like other non-light water reactor technologies, operational experience for high-temperature reactors (HTR) is also limited. Developed in the 1960s to operate on thermal spectra, different reactor concepts, such as the Dragon reactor in the UK or the pebble-bed reactor THTR-300 in Germany, were constructed as prototypes but faced significant technological challenges and were thus abandoned [63]. Current operational reactors are limited to China, where two prototypes based on the German pebble-bed design are running. In the U.S., X-energy is working on an 80 MWel HTR, the Xe-100, which is still in the design phase [65, 7]. Given their high operational temperature, HTRs are envisioned to be applicable for high-temperature heat provision of up to 1000°C [16, 63]. For example, a proposed design for a gas turbine modular helium reactor could produce outlet temperatures of 950°C and could be applied for sulfur-iodine hydrogen production with a process efficiency as high as 51% [66]. Potential cost disadvantages compared to LWRs, stemming from more complex designs, could, theoretically be offset by the provision of valuable high-temperature heat [67].
2.2.4 Molten salt reactors
Molten salt reactors (MSR) use molten salt as a coolant [68]. MSRs were initially developed for aircraft propulsion, and concepts vary regarding moderator, fuel, neutron spectrum, and fissile material. There are no commercially operational MSRs, but several concepts are currently under development in China, Switzerland, and Russia, amongst others [63]. MSRs could become applicable for heat provision in decarbonized energy systems as the proposed salts melt at around 500°C and boil at around 1400°C, allowing for outlet temperatures ranging from 600 to 700°C [68, 63]. Most MSR concepts are still in the early development stages, so information on their economic competitiveness is limited. While in the 1970s, capital costs of MSR were estimated in the same range as LWRs [69], current concepts are estimated to be cheaper. For example, the so-called "Advanced High-Temperature Reactor," also referred to as "Fluoride High-Temperature Reactor," is estimated to cost less than 1000 USD per kW, and the ThorCon concept MSR, developed by company Martingale, is envisioned to produce electricity for as little as 30 to 50 USD per MWh [70, 63].
2.3 Nuclear Cost Data Projections
Over the last decade, nuclear power has gained momentum in energy scenarios as a low-carbon technology. For example, over 80% of scenarios collected in the 6th Assessment Report of the IPCC show that to limit global warming to 1.5°C by the year 2100, it is necessary to increase absolute electricity generation from nuclear with an average annual growth rate of 3% [1, 7]. These models assume substantial overnight construction cost reductions for nuclear in the coming decades down to 5,000 or even 2,000 USD per kW [20] and highlight the necessity of cost reductions for nuclear to be competitive in energy systems with high shares of renewables [2, 71].
Thus, to assess the economic efficiency of non-light water reactors in the energy system model (see Section 3.1), it is first necessary to determine relevant cost data and other relevant information on potentially viable reactor types. Consequently, we conducted a literature analysis of cost projections and assumptions for various reactor types. Previous research has shown that for high-capacity LWRs, cost projections and experience differ strongly [8]. For SMR concepts, Steigerwald et al. [5] show that to-be-expected costs and industry expectations also vary substantially.
The here presented cost analysis is based on 51 references [72, 73, 3, 63, 74, 75, 76, 77, 78, 66, 79, 80, 81, 82, 83, 84, 85, 86, 87, 88, 89, 90, 91, 92, 93, 16, 94, 95, 96, 97, 98, 99, 100, 101, 102, 103, 104, 105, 106, 67, 15, 107, 108, 109]. About 60% are so-called grey literature, mostly industry and research organization reports. Peer-reviewed literature, i.e., journal and conference papers, account for about a third. Most references date from the 2010s, but given that the current decade is only four years old, it is remarkable that almost 40% were published in 2020 or later. A detailed overview of cost data and the corresponding references is given in the Appendix C.
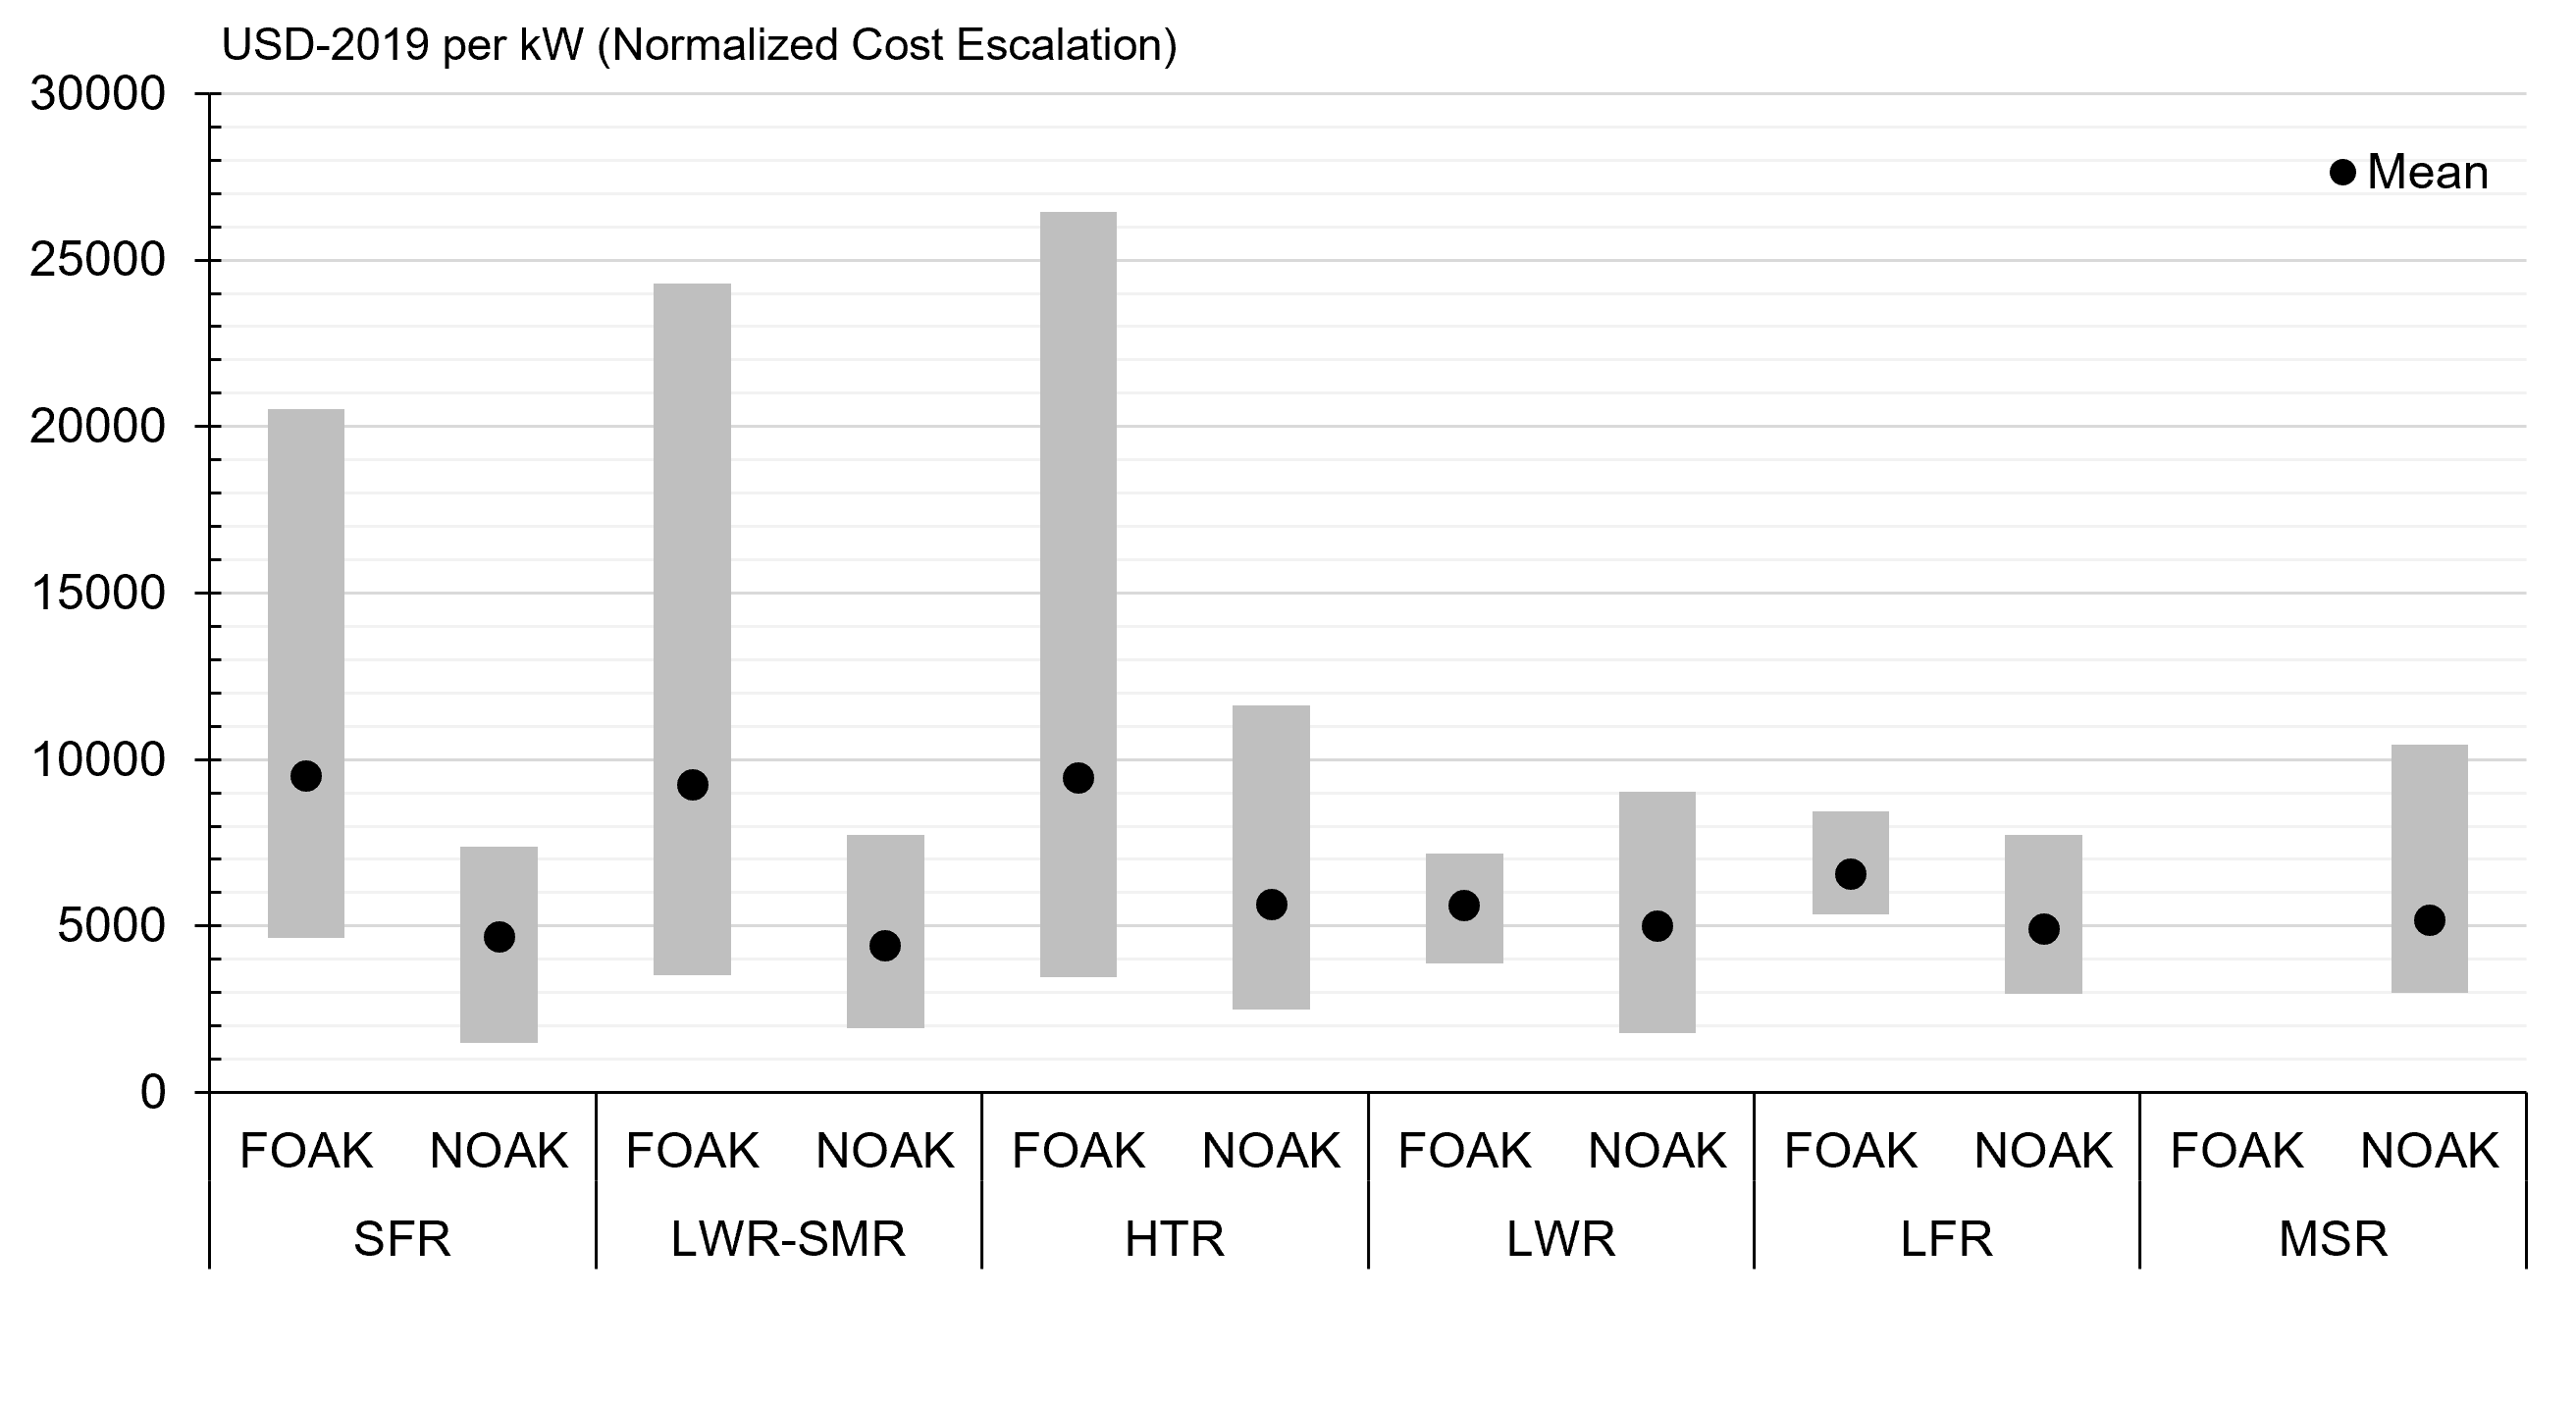
Overnight construction cost (OCC) data are provided on different "readiness levels," i.e., either as so-called "first-of-a-kind" (FOAK) or "n-th-of-a-kind" (NOAK) estimates. FOAK cost estimates acknowledge that the first built reactor of a given type will likely experience unexpected complications and thus be more expensive than subsequent projects of the same design. NOAK cost estimates consequently assume that some learning process reduces unit cost [110]. Learning rates for nuclear vary and, depending on the assessment and data, range from 2 to 15% [111]. However, negative learning rates have also been observed [112]. n indicates the number of units produced to reach a certain cost level. In general, NOAK costs are calculated following Eq. 1 with the cost for the n-th produced unit NOAKn, the cost for the first produced unit FOAK, learning rate x and doubling d of production volume n [110].
| (1) |
Regardless of the readiness level, every value constitutes either an estimation or projection, as none of the discussed reactors have been built. Furthermore, from our gathered literature, we find that only Stewart et al. [94] and Stewart and Shirvan [111] attribute a concrete value to n, i.e., 10. Additionally, in both references, the FOAK starting point is far off from historical precedence, especially for high-capacity LWRs [8]. Regarding learning rates and the feasibility of industry cost reduction projections, refer to Steigerwald et al. [5] who assess learning rates and potential cost reductions for 19 SMR and advanced reactor concepts. For the following, cost data was normalized and adjusted to 2019-USD following the "cost escalation approach" by Abou-Jaoude et al. [113] to ensure comparability. 111If not otherwise indicated, all USD values are in 2019-USD.
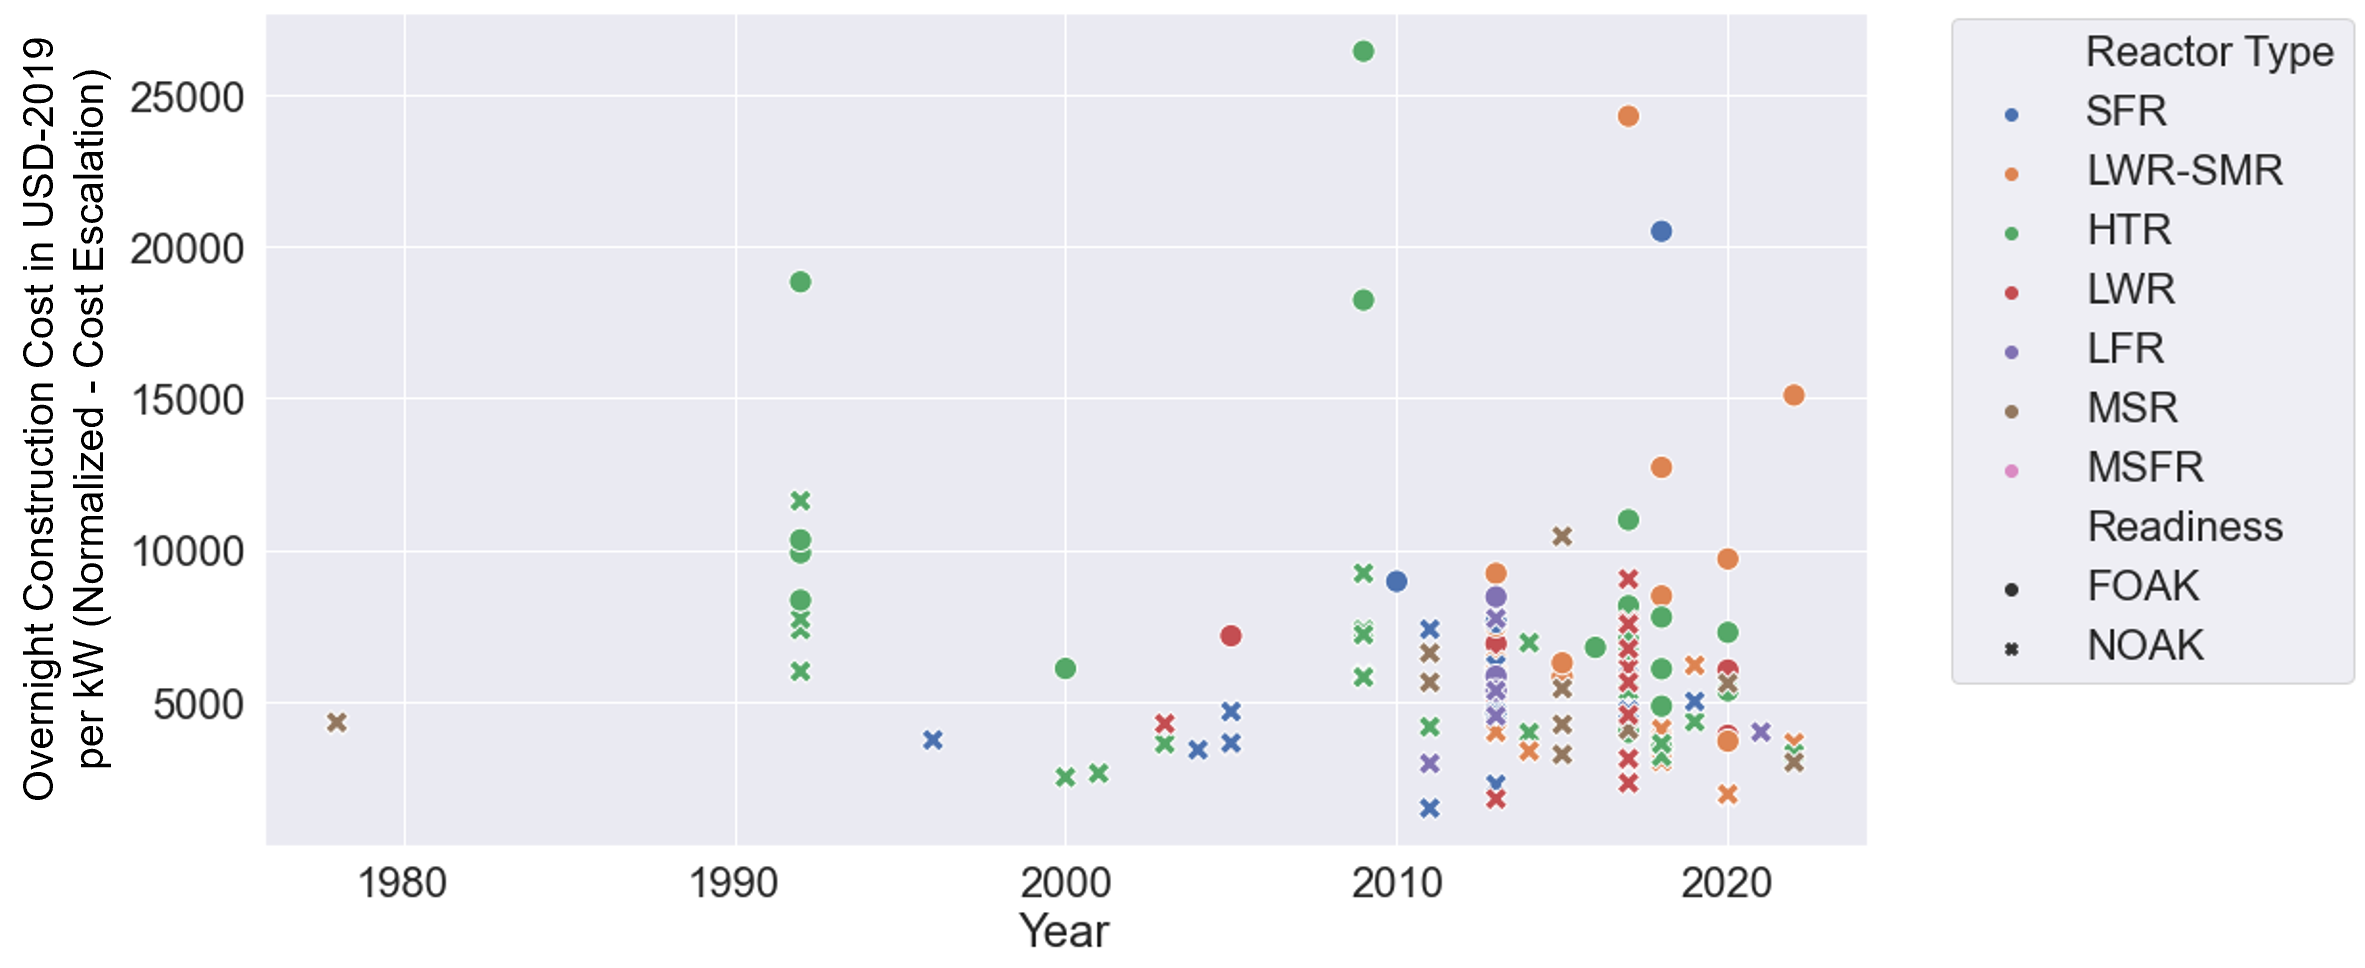
Figure 2 shows the variation of cost data between reactor types and readiness levels. FOAK cost data are not available for MSRs. In general, NOAK estimates are more numerous than FOAK estimates. Further, on average, NOAK estimates are lower than FOAK estimates by several thousand USD per kW . This indicates widespread expectations of future cost digressions despite lack of precedence [114, 112, 12]. Figure 3 shows the distribution of OCC values over time. The x-axis shows either the publication year or, if available, the stated reference year. Tables 4, 5 and 6 in Appendix C summarize cost data for OCC, as well as for fixed and variable operational costs for various reactor types. Fewer data points were identified for these cost data than for OCC, and information could not be found for each reactor type.
3 Methodology
The following section describes the methodology used to assess the economic viability of non-light water reactors in a future European energy system. First, we introduce the applied energy system model. Then, we motivate the selection of four reactor technologies for our application based on previous sections, and finally, we describe our cost assumptions, also based on previously discussed analyes.
3.1 Applied Energy System Model
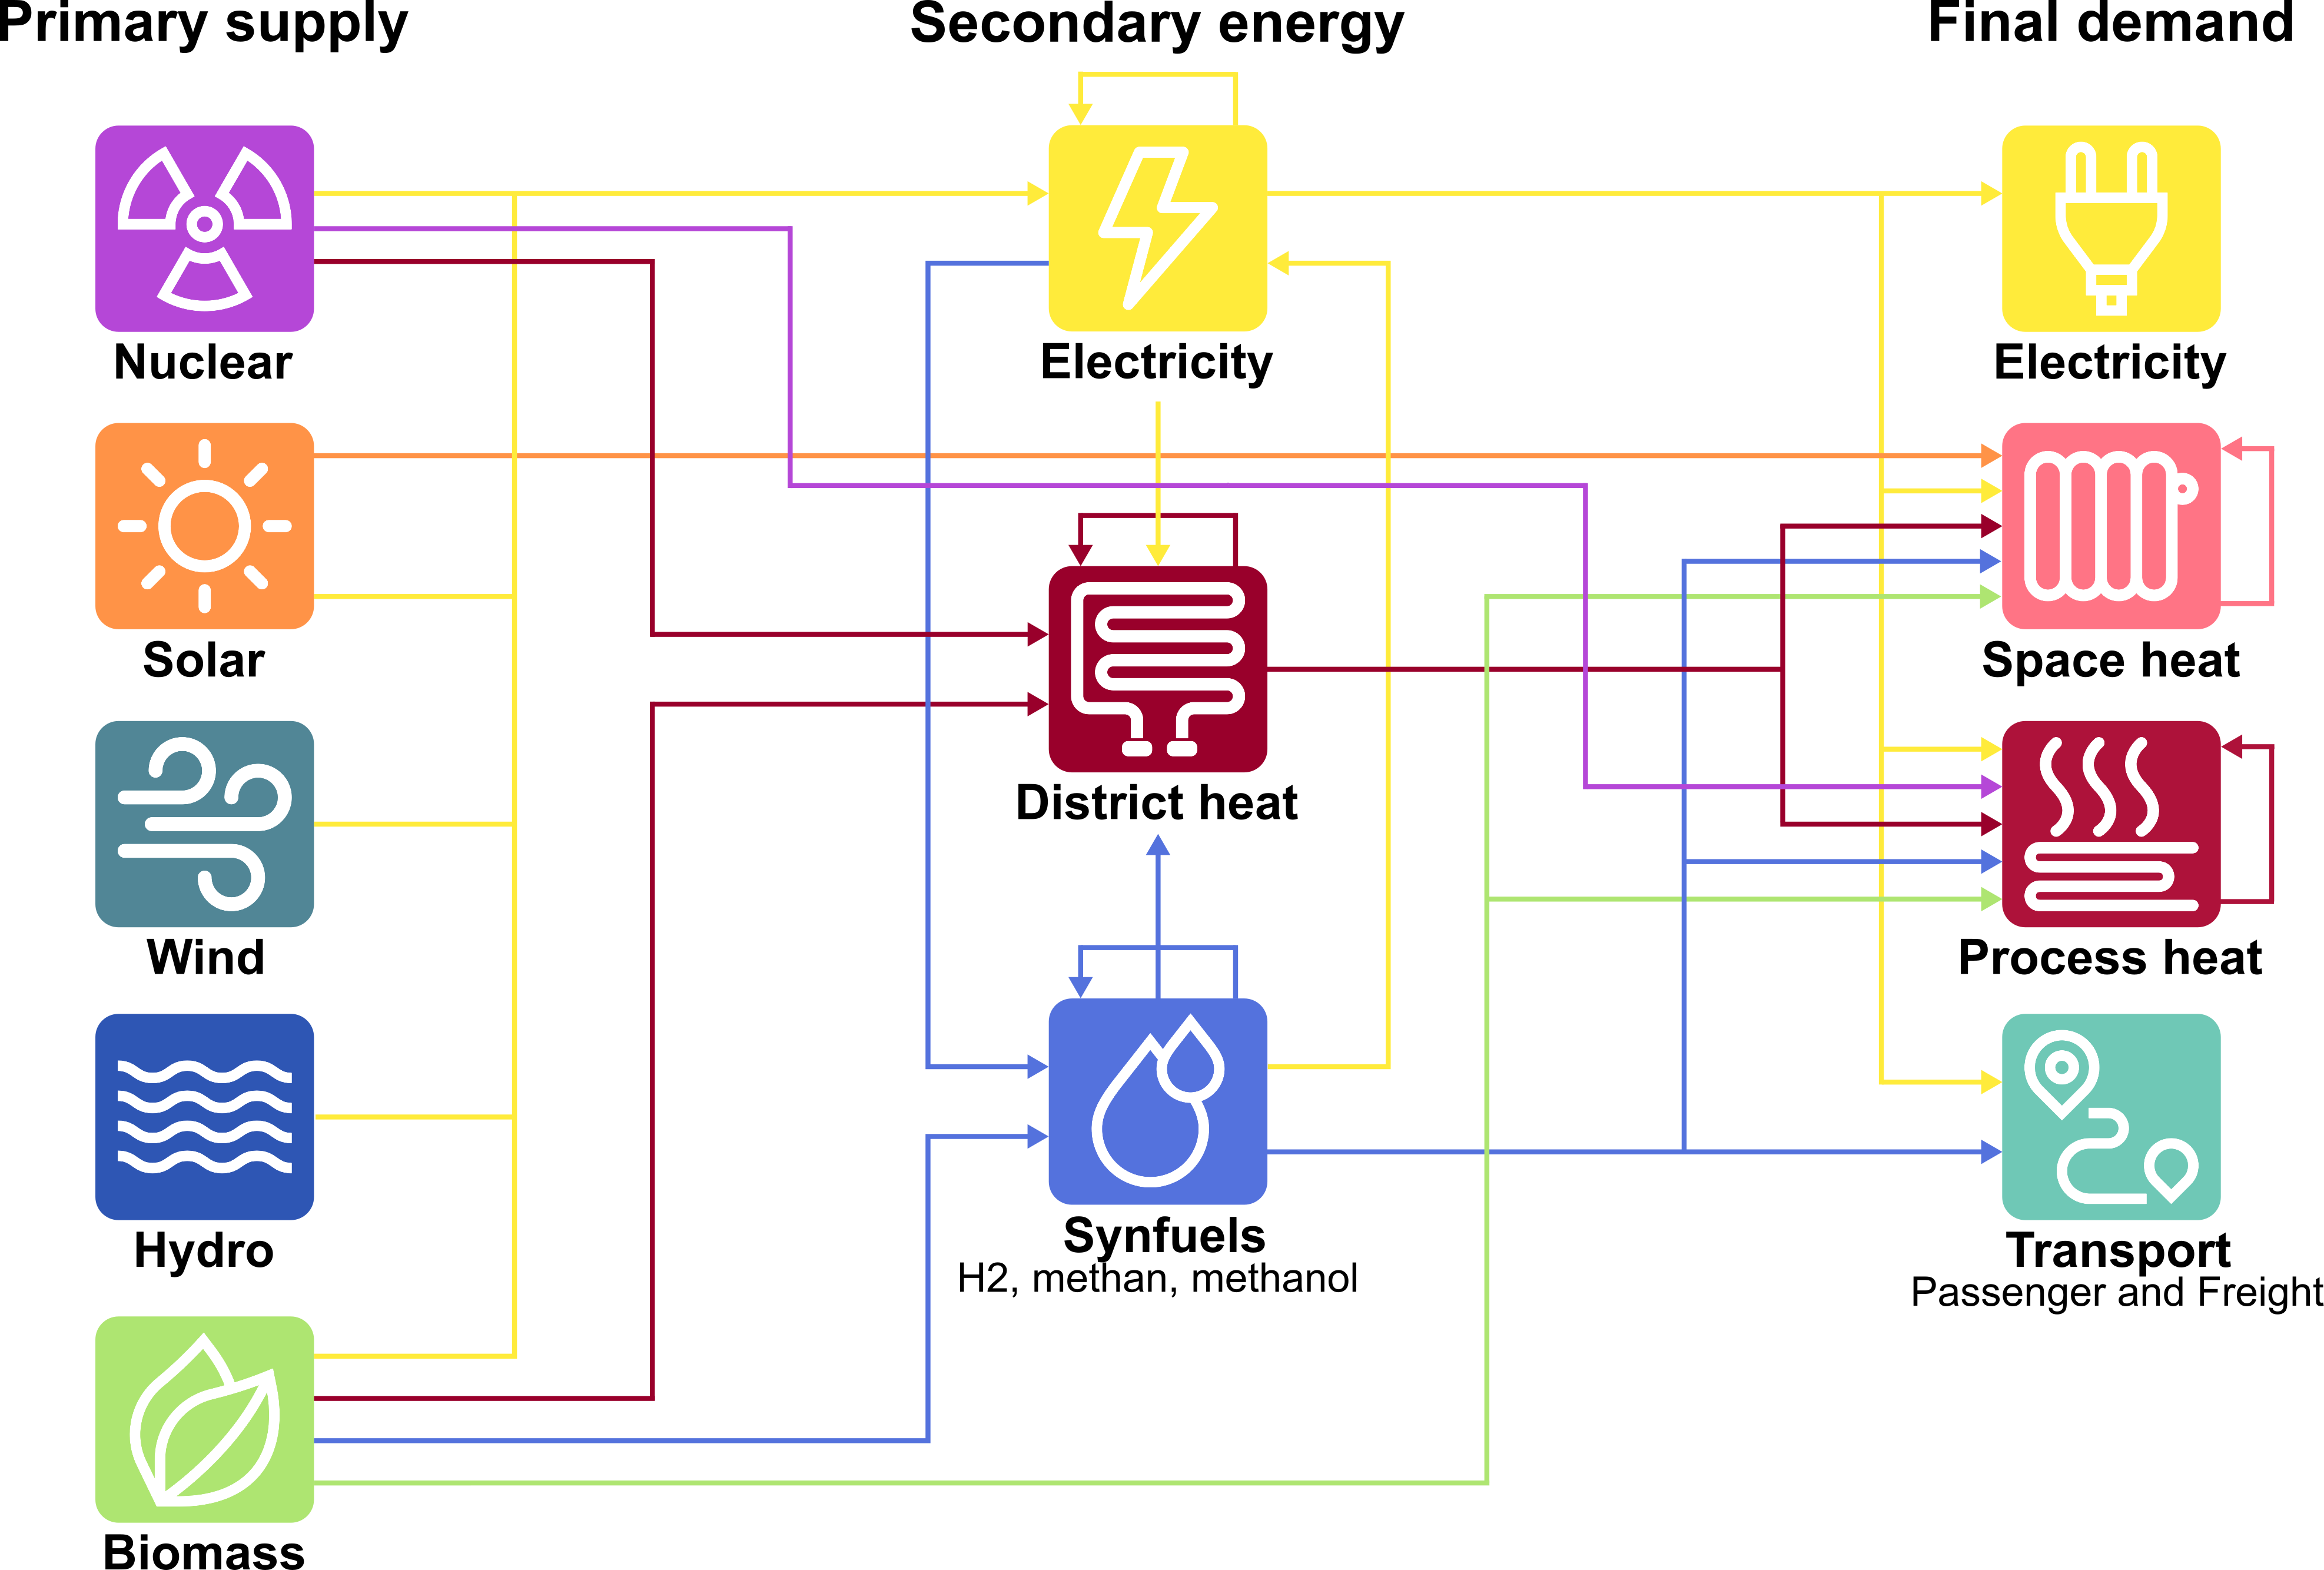
This work applies a comprehensive energy system model to assess different reactor concepts. It utilizes the AnyMOD.jl framework for energy system modeling [22]. Fig. 4 gives an overview of the energy vectors in the model. Sources of primary energy supply in the left column include nuclear and renewables, i.e., solar, wind, hydro, and biomass. The middle column of Fig. 4 lists the secondary energy carriers that can be generated from the primary supply and include electricity, district heat, and various synthetic fuels, including hydrogen, synthetic methane, and methanol. Finally, the right column shows the types of final energy demand that the model must cover. These include final demands for electricity, space heat, and process heat, respectively. The demand for process heat is further subdivided into three levels: low temperature up to 100°C, medium temperature from 100°C to 500°C, and high temperature above 500°C. Finally, the model also covers the demand for transport services, specifically private road, public road, and public rail transport for passengers and freight transport on heavy road, light road, and rail. As indicated in the figure, the model considers nuclear power not just as a source of electricity but also for the provision of district and process heat, as described in Section 3.2. [8]
The model is formulated as a linear optimization problem that decides on capacity investment and operation of capacities to satisfy a fixed final demand at the lowest cost possible. Investment options are different technologies to transport, convert, store, and generate different energy carriers, see Fig. 4. Technology data and demand are based on projections for the year 2040. The Appendix D gives an overview of the considered technologies besides nuclear power.
The spatial scope covers the European Union (excluding isolated island states), the U.K., Switzerland, Norway, and the Balkan region. The temporal scope consists of a single future year in a greenfield setting. Due to their long lifetimes, existing hydropower plants and power grids are available without additional investment. The model uses hourly profiles based on historical data from 2008 for electricity and heat demand as well as renewable capacity factors.
The spatial resolution of the model varies by context. For the characteristics of renewables, all types of heat and hydrogen, the spatial scope is split into 96 clusters. For the electricity balance and transport demand, the scope is split according to the zonal configuration of the European power market. Appendix E details the spatial configuration and the available transport infrastructure to exchange energy between regions. [8, 115]
3.2 Applied Nuclear Technologies and Assumptions
From the analysis of use cases and available technologies (see Sections 2.1 and 2.2) and the available cost data presented in Section 3.3 below, we derive the necessary input parameters for a total of four different reactor technologies to be implemented into the model. These are high-capacity (advanced) light-water reactors (LWR), low-capacity light-water reactors (SMR), sodium-cooled fast reactors (SFR), and high-temperature gas-cooled reactors (HTR). Each technology is assumed to be able to supply a particular form of heat in addition to electricity, see Table 1.
| Technology | Energy Carrier |
| LWR | Electricity; districtHeat |
| SMR | Electricity; processHeat_low |
| SFR | Electricity; processHeat_medium |
| HTR | Electricity; processHeat_medium; processHeat_high |
Nuclear power is sometimes portrayed as a dispatchable technology that could bring benefits to an energy system characterized by a high penetration from renewables [19, 116, 117]. Further assumptions relate to individual reactor technologies’ abilities to switch operational modes. We assume that reactors can flexibly switch from electricity to heat provision and vice versa without any downtime or incurred cost. Providing heat increases thermal efficiency levels by an average of 20%. Additionally, the reactors in the model operate without ramp-up time at a universal 90% capacity factor.
3.3 Nuclear Cost Assumptions
From obtained OCC data, total capital costs are calculated following Rothwell [118] by accounting for a uniform seven years of construction time and weighted average cost of capital of 10%. Input parameters that differ depending on reactor type and readiness level are given in Table 2. Due to the heterogeneity of provided data, OM costs are combined from fixed and variable values following the approach used in Göke et al. [8]. They explicitly exclude fuel costs that are included as a spererate value. Further, we assume uniform capacity factors of 90% and operational lifetimes of 40 years. To match other model input cost parameters, cost data for nuclear given in USD-2019 were converted to EUR-2020 with an inflation rate of 1.4% and an exchange rate of 0.8929.
| Readiness Level | Input Parameter | SFR | LWR | SMR | HTR |
| FOAK | OCCa | 9,511.47 | 5,622.9 | 9,241.42 | 9,438.52 |
| OMb | 50.48 | 27.03 | 47.49 | 45.29 | |
| Fuel costb | 11.9 | ||||
| NOAK (mean) | OCCa | 4,677.97 | 4,983.78 | 4,407.51 | 5,649.65 |
| OMb | 19.93 | 20.45 | 20.82 | 33.65 | |
| Fuel costb | 9.16 | ||||
| NOAK (min) | OCC | 1,476 | 1,782.62 | 1,940 | 2,501.33 |
| OMb | 13.31 | 8.37 | 15.05 | 3.13 | |
| Fuel costb | 9.16 |
4 Results
This section presents the results for three overall cost scenarios and model runs. The first assumes mean FOAK costs for each technology, the second mean NOAK costs, and the third minimum NOAK costs, see Table 2. Each of these scenarios contains five model runs. The resolution of each run is 4392 hours. While the first run assumes all four reactor technologies may be built, the other four each exclude one type (e.g., "noHTR" forbids the construction of HTRs). The model runs reflect potential variations in availability and indicate which nuclear technologies are dominated by the others. The results show the strong dependency of system design on input costs. Over all subsequently discussed technology input variations, FOAK cost assumptions lead to a de-facto exclusion of all assumed nuclear power technologies. In contrast, nuclear capacity is added to the system once mean NOAK costs are applied. In the following, we analyze the generation of electricity and heat and necessary capacity developments.
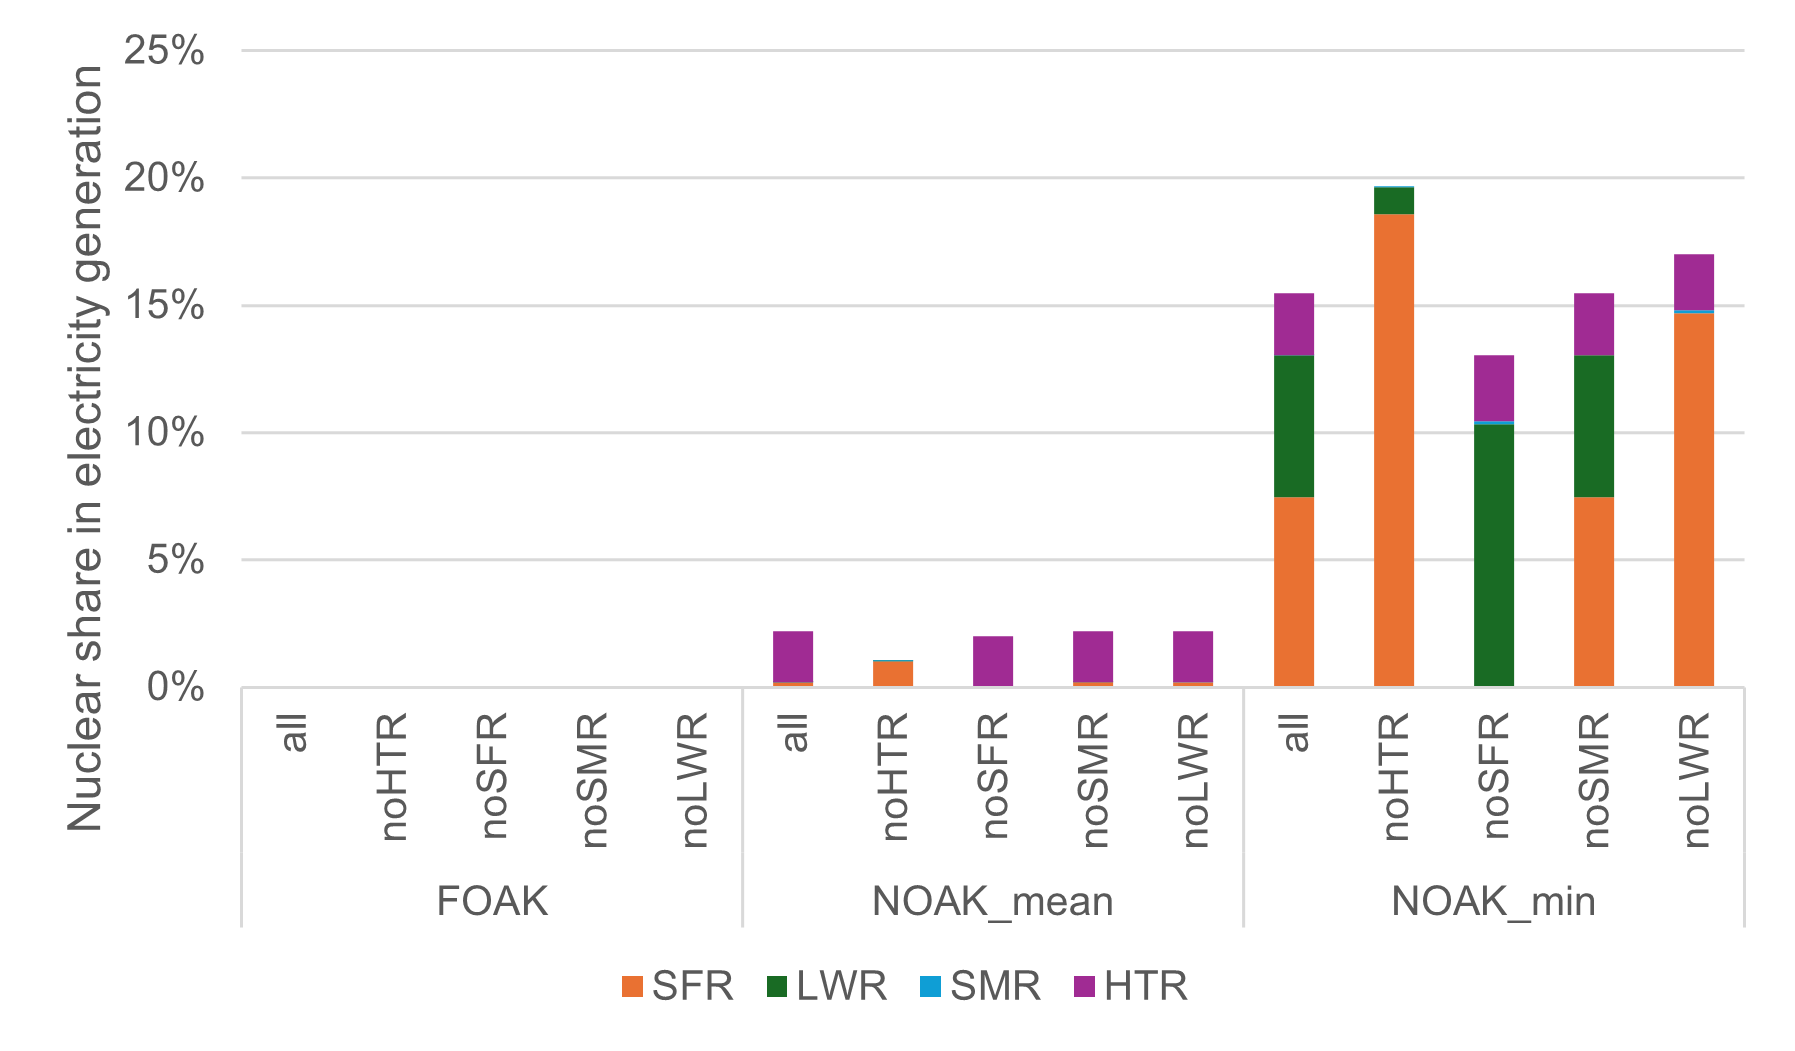
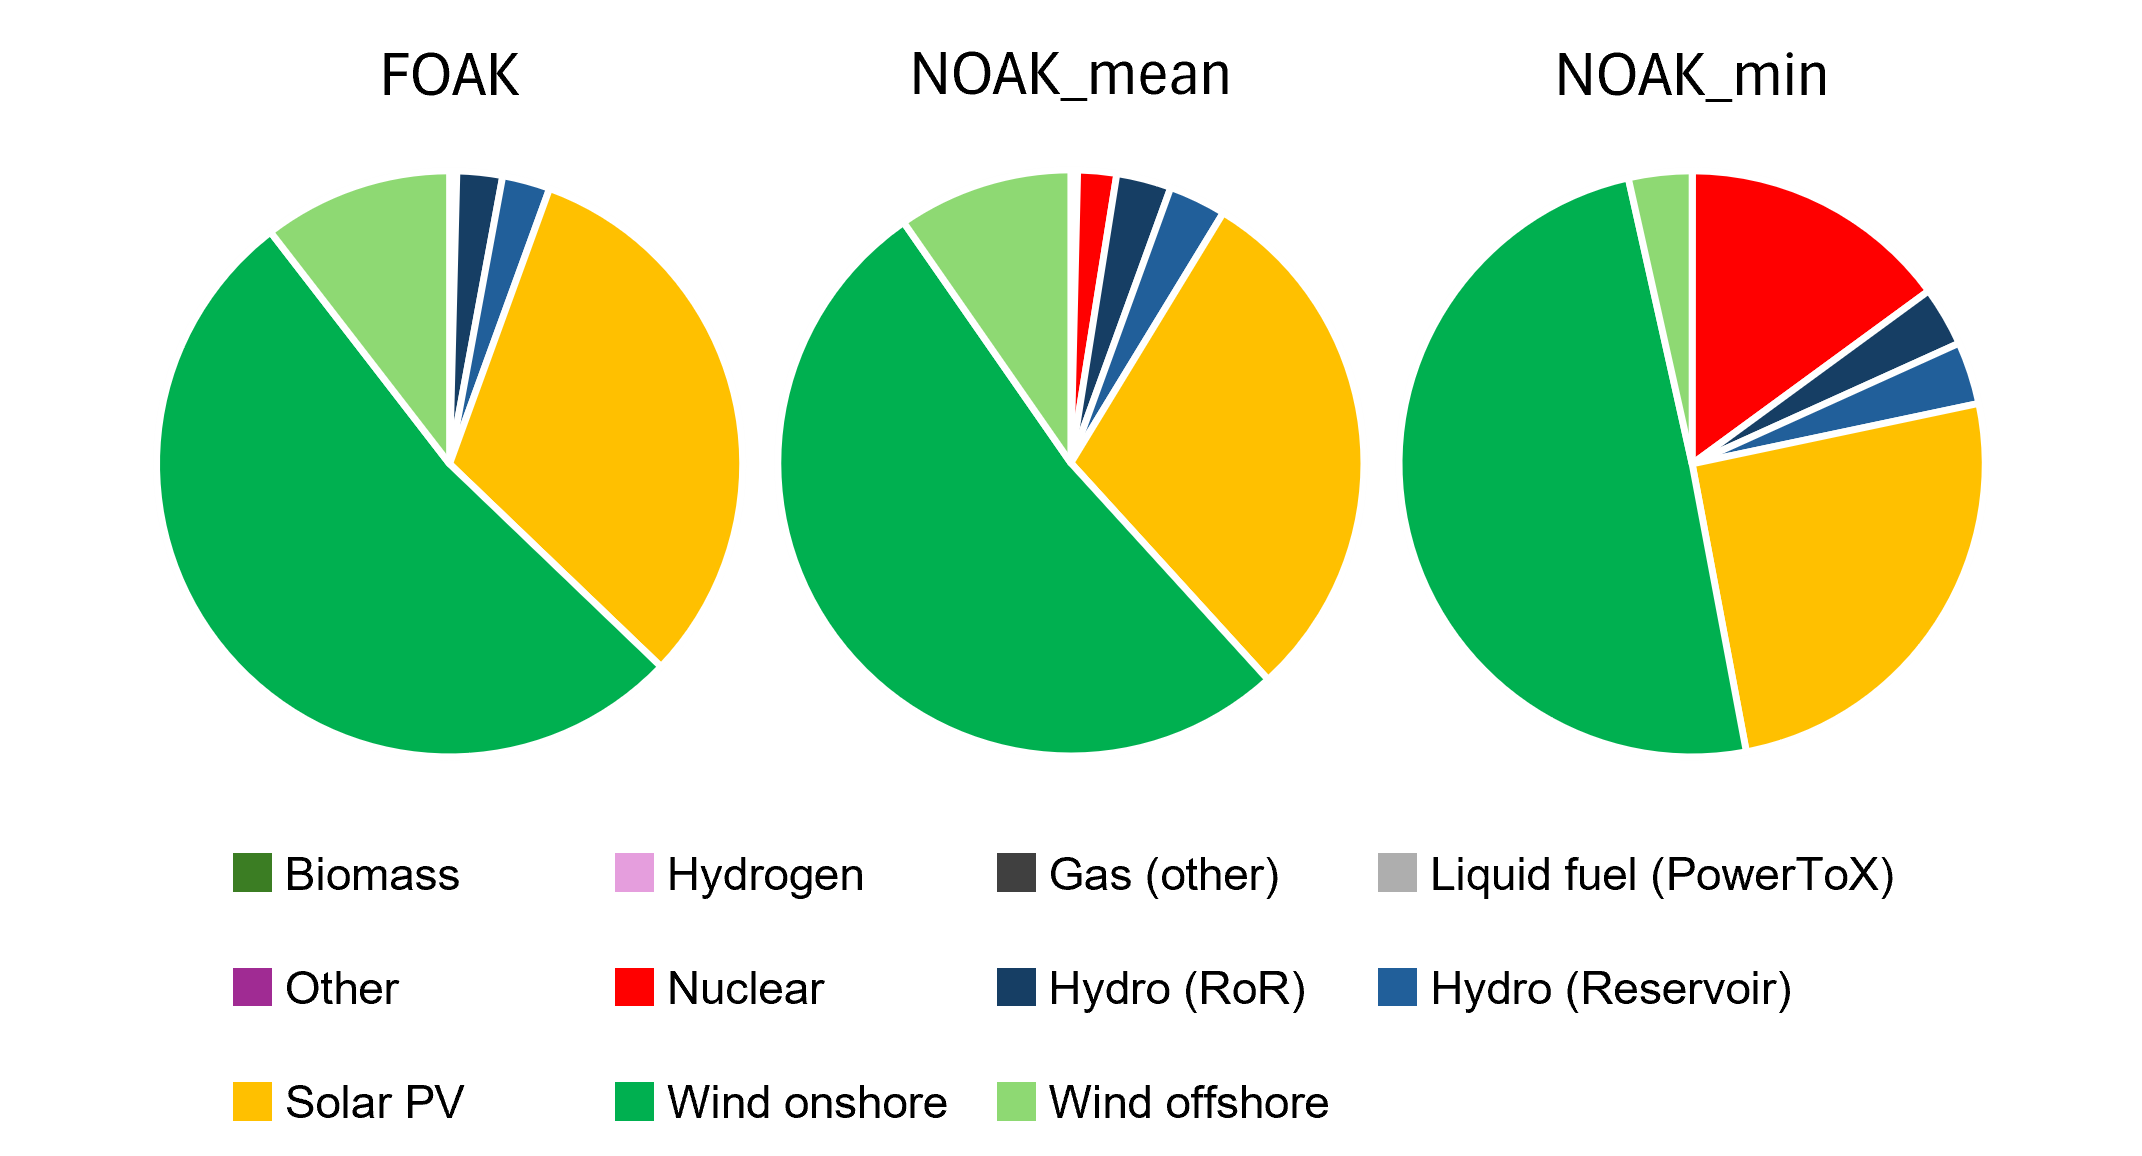
Figure 5 shows the cumulative share of nuclear in total electricity generation, while the composition of the electricity mix is shown in Figure 6. In FOAK scenarios, total electricity generation is around 7,472 TWh. For mean NOAK scenarios, electricity generation is at approximately 6,200 TWh, apart from scenario noHTR in which an additional 581 TWh of electricity is generated to cover the missing high process heat provision from HTRs. The lowest electricity generation of around 5,712 TWh is produced in the noSFR scenario for minimum NOAK cost. In these low-cost scenarios, average electricity generation lies at 5,918 TWh, with one outlier in the noHTR scenario (6,518 TWh).
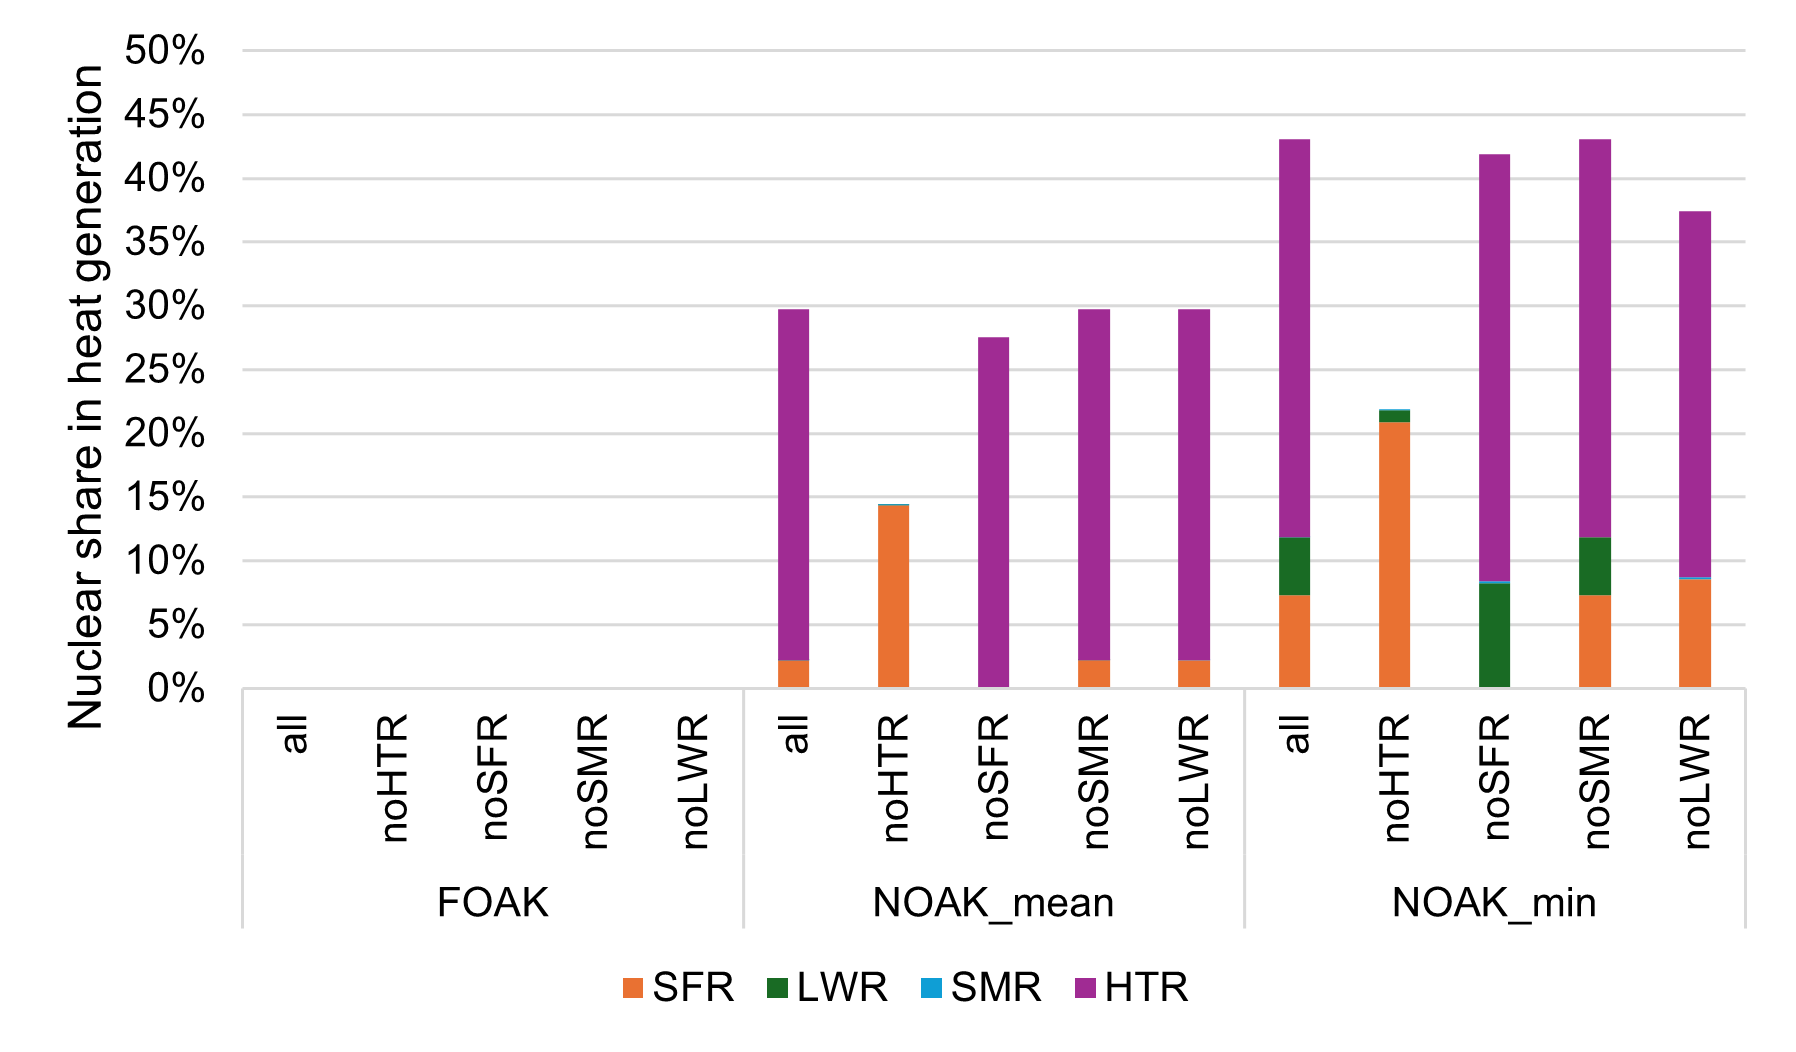
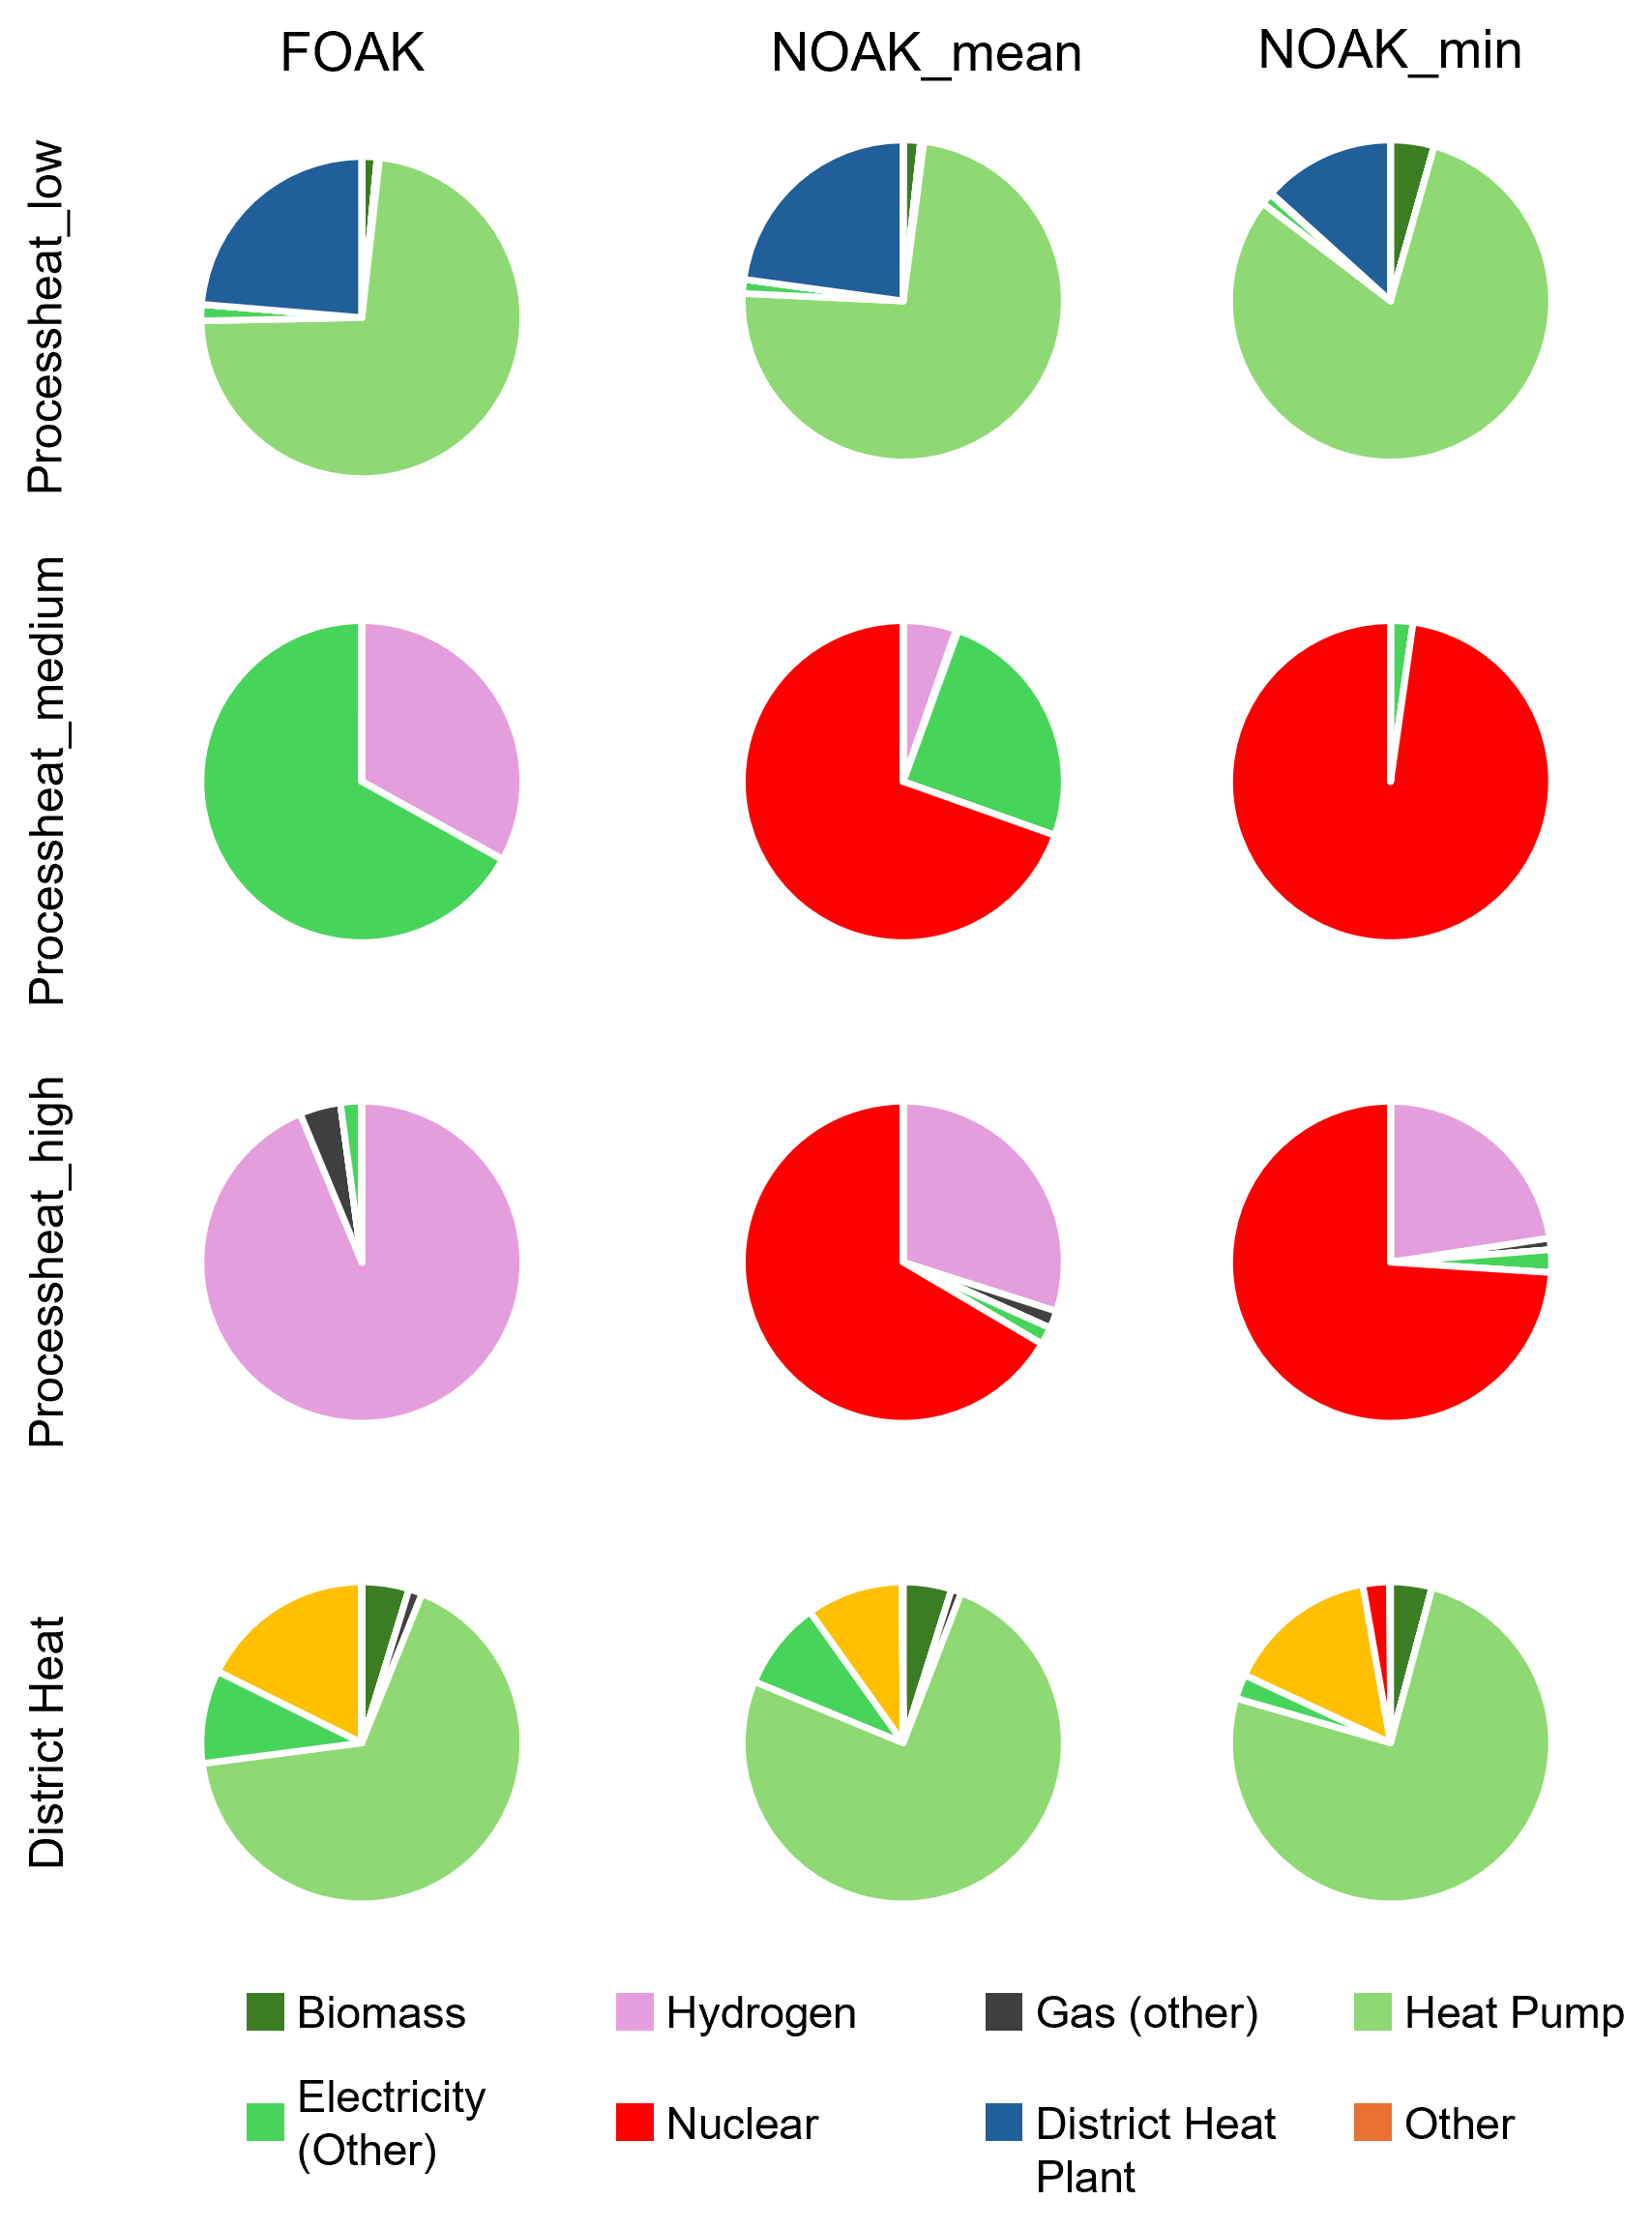
Analogously, Figures 7 and 8 show the same for heat provision. In all FOAK scenarios, electricity and heat generation from nuclear power is non-existent because no nuclear capacity is built at these cost levels, see Figure 9. Instead, heat demand is covered through a higher degree of power-to-x measures and a higher overall renewable electricity generation. Total heat generation is less variable across all scenarios. On average, 3,559 TWh of heat are generated, with a maximum of 3,589 TWh in the "noLWR" scenario for mean NOAK costs, and a minimum of 3,480 TWh for the "noHTR" scenario at minimum NOAK costs. Notably, LWRs become relevant for district heat generation only when SFRs are excluded, and costs are at minimum NOAK costs, while SMRs remain irrelevant across all scenarios. When nuclear is built, HTRs and SFRs dominate.
Once costs decrease to mean NOAK levels, the model adds nuclear power to the energy mix. However, most of this capacity refers to HTRs. While OCC input parameters for HTRs are higher than for all other reactor technologies, their ability to produce medium- and high-temperature process heat makes them competitive from an energy systems perspective as for these energy carriers, equivalent renewable technologies, i.e., high-temperature heat pumps or hydrogen, are comparatively expensive or also non-existent as of today. 1,109 GW of HTR capacity is built when all technologies are allowed, of which only 49 GW are used primarily for electricity, the remainder for heat provision. This HTR fleet is aided by 63 GW of SFRs that provide mainly medium-temperature process heat (61 GW dedicated to heat). If HTRs are excluded, additional SFR capacity is added (410 GW in total). Still, they cannot fully compensate, resulting in a substantially lower nuclear share in electricity and heat, down from 2% and 30% to 1% and 14%, respectively. LWRs and SMRs play little to no role due to their non-competitiveness with renewables for district and low-temperature process heat provision.
The dominance of HTRs in the installed nuclear fleet ends once costs drop to the minimum NOAK cost assumptions. Here, SFRs become competitive for electricity and heat provision. While they provide only 9% of nuclear heat in the "all" scenario, see Figure 7, they provide the overwhelming majority of nuclear electricity, adding to the substantial share of 23%. If HTRs are excluded, SFRs become even more dominant and are the only nuclear technology to be added to the grid (with a negligible 438 MW of SMRs added). Notably, high-capacity LWRs are introduced for the first time in these scenarios. SMRs are de facto not built in any scenario; they appear to be strictly dominated by other nuclear technologies, and low-temperature heat is provided by cheaper (renewable) alternatives, mainly heat pumps. When SFRs are excluded, the installed nuclear capacity is dominated by HTRs (1335 GW), and 395 GW of LWR capacities. Regardless, HTRs provide most process heat, while LWRs produce some district heat. 5 GW of SMR capacity is built. For all readiness levels, excluding SMR and LWR technologies has no noticable impact.
Total system costs for the FOAK scenarios are the highest, averaging at €317.5 billion with a standard deviation (sd) of €21.1 million. Mean NOAK scenarios average €307.2 billion (sd = €2.7 billion), and minimum NOAK scenarios are the cheapest, averaging only €290 billion (sd = €3.1 billion). The main differences in cost stem from the increased expansion of nuclear power capacity at comparatively low cost (compared to actual to be expected costs, see Section 3.3). In the FOAK scenarios, additional flexibility measures are built, such as open-circuit hydrogen power plants, and consequently, investments into powerToX technologies become necessary. Gas power plants are de facto not built in the minimum NOAK scenarios.
5 Discussion
The results shown above underline the lack of cost competitiveness of nuclear power compared to other energy generation technologies. They show that the cost-efficient capacity expansion of especially non-light water reactors would require substantial cost reductions that are, as described in Section 3.3, not to be expected in the coming years.
This work assumes that several different reactor concepts will have been fully developed, licensed, tested, commercialized, and produced in vast quantities in the next few years, which, given the current state of project developments, is an optimistic outlook.
However, if the above-mentioned optimistic cost reductions were to be achieved, the results show that non-light water reactor technologies could contribute to energy system decarbonization in Europe in this particular setting (e.g., assuming favorable capacity factors and industry capability, etc.). However, this is limited to mostly HTRs, which provide valuable heat energy at temperatures of up to 1000°C.
But regardless of costs, nuclear reactors feature additional challenges that would need to be overcome for a substantial capacity ramp-up. For example, the heterogeneity of fuel requirements for different SNR concepts corresponds with that of the reactor designs themselves. Many concepts additionally increase proliferation risks because of their requirement of high assay low enriched uranium (HALEU) fuel for which specialized fuel production facilities would have to be funded and constructed-which in turn requires substantial investment and long-term planning and the limitation of industry efforts to a handful of promising reactor designs [120, 121]. It is uncertain whether this type of infrastructure could be up and running in time for these reactor concepts to play a significant role in decarbonizing the European energy system.
Furthermore, the cost data mentioned above do not include external costs of nuclear, such as decommissioning and waste management, or social costs, such as risks relating to accidents, proliferation, or uranium mining and tilling [122, 123, 124, 125]. Additional waste challenges arise from implementing non-light water reactors that generate different kinds of waste from, e.g., HALEU fuel, creating additional and currently unstudied waste streams that would have to be dealt with [121]. However, with most nuclear waste responsibility lying with the respective governments [126, 127], substantial funding uncertainties could be removed from projects [128], as suggested to be implemented by Sawicki and Horbaczewska [129]. This would, however, require substantial political power to be achieved, especially in Europe. Additionally, long-term financial assurance and commitment to a limited number of reactor designs are necessary [17].
Additionally, the assumed flexibility of nuclear power plant operations without constraints can be contested. Lynch et al. [116] demonstrate that today’s LWRs can be an effective technology for load following, and Jenkins et al. [19] show in their model for the South-West U.S. that flexible nuclear operations can reduce system costs and increase reactor operator revenues. Loisel et al. [130, p. 281] even claim that "in practice, countries with […] high intermittent renewables […] need [nuclear power plants] to operate". However, despite theoretical technical feasibility, current nuclear reactors’ ability to run flexibly is seldom applied today, with operational experience limited mostly to France [42]. In the U.S., operational experience of flexibly dispatchable nuclear power plants has been limited despite regulations allowing for flexible operations and load following [131]. Reactors designed to operate as flexible backup capacities in energy systems based mainly on renewables face challenges of long standstills and fast ramp-ups. Running at high capacity factors generating heat for other purposes and then flexibly switching to power generation when required will be technologically challenging to implement, least finance [132, 51].
Our model approach faces some inevitable limitations that could limit the applicability of the results. First, the potential locality of heat demand is not accounted for. This is relevant because, for direct heat provision, sources must be located close to off-takers to minimize losses during transfer. This could be especially relevant for nuclear reactors as these technologies may face substantial opposition from local communities. Secondly, we assume that reactors can switch between operating modes without delay and incurred cost. Adding this to the high capacity factors of 90% is an assumption that is advantageous to nuclear. Whether SNRs can operate at such high capacity factors and operate flexibly remains highly uncertain given the lack of precedence in the historical track record of such concepts, see Section 2.2.
Regarding cost assumptions, we show that OCC must be drastically reduced for nuclear power to be competitive with renewable technologies. In our approach, we apply a uniform cost assumption for nuclear power that does not consider cost differences between vendors, financing schemes, or local cost differences that could occur between, for example, projects in Finland and Hungary.
The applied model to compute a cost-efficient share of the different nuclear power plants corresponds to or exceeds the state-of-the-art in energy planning. The high temporal resolution using two-hour blocks, resulting in 4380 steps, exceeds typical resolutions and accurately captures the fluctuations of wind and solar power, which are the main competitors of nuclear power. Inevitable limitations of the model impose a positive bias on nuclear power, so our results constitute an upper bound on the cost-efficient share. Most importantly, we neglect the operational constraints of nuclear power and do not impose restrictions on downtimes or production gradients to keep the underlying optimization problem computationally tractable. Of all considered technologies, these constraints are most relevant for nuclear, but according to previous literature, they are acceptable to ignore, especially if a model includes other short-term flexibility, like batteries or demand-side management [133, 134].
6 Conclusion and policy recommendations
Our analysis shows the various potential non-electrical use cases for nuclear reactors. We show that these applications are limited to individual reactors supplying heat to small localized demand centers. Most heat provision experience has been gathered in Eastern Europe, where a handful of reactors have provided district heat to neighboring towns, and to Japan, where some reactors service desalination plants. Consequentially, the industry’s experience in non-electrical use cases is limited, and it should be critically reflected upon propositions of localized heat provision given the challenge of implementing sufficient emergency planning zones, flexible operations, and the availability of potentially cheaper alternatives.
Regarding potential technologies, we find that as of today, both light and non-light water reactor concepts cannot fulfill the prerequisites defined by the Committee on Laying the Foundation for New and Advanced Nuclear Reactors in the United States et al. [13]. Most notably, our assessment shows that none of the discussed concepts is commercially available. Most concepts are in pre-licensing or licensing stages, and even for those under construction, the remaining challenges of becoming competitive and affordable (yet socially acceptable) remain to be proven.
Despite the lack of empirical data, many projections and assumptions exist regarding the future cost of diverse reactor concepts. The discrepancy between FOAK and NOAK cost estimations is substantial, and the range of cost estimations in a given readiness level is also. Notably, NOAK cost estimations are referenced more often, albeit the exact number "n" of required produced units to reach these costs through economies of multiples remains undefined. Compared to actual ongoing reactor construction projects in OECD countries, the cost assumptions are overly optimistic and could even be criticized as misleading. Furthermore, as cost overruns and construction delays have historically characterized the nuclear power industry, the costs for actual reactor projects are likely to be higher.
Nonetheless, we assess the potential application of light water reactors and SNR concepts in a future decarbonized energy system in Europe in the near future. We run five model calculations assuming variying technolgy availability in each of the three general readiness level scenarios (FOAK, mean NOAK, minimum NOAK for OCC, fuel, and OM cost). For FOAK cost scenarios, the cost-optimizing model builds no nuclear and relies on renewables to provide all necessary energy services. At mean NOAK cost, on average 60% of FOAK cost assumptions, nuclear power plant capacities are added to the grid, primarily for heat provision. At minimum NOAK cost, on average of FOAK cost assumptions, nuclear power plants dominate medium and high process heat generation, primarily due to the construction of HTRs and SFRs, while both high- and low-capacity LWRs are mostly neglected.
Thus, to achieve technological readiness for the widespread implementation of non-light water reactor technologies and potentially reduce expansion costs, development efforts should be focused on a limited number of reactor concepts and focussed on technologies capable of providing high temperature process heat. For policymakers, this implies goal-oriented (financial) and reliable support of projects with the highest degree of success and future applicability. Cost reductions are only possible when a substantial number of reactors of the same design are built without continuous re-designs necessitating additional safety inspections and licensing procedures.
Based on the results described above, one could assume that nuclear power could play a substantial role in a future decarbonized energy system. However, the energy model’s assumptions are skewed positively towards nuclear power. This includes optimistic assumptions of 90% capacity factors, the assumption that reactors can be built at NOAK costs in a few years, full flexibility of reactors and the ability to switch between electricity and heat provision without ramp-up, the neglect of decommissioning and waste management costs, potential safety challenges of non-light water reactor concepts, increased proliferation risks, and the uncertainty regarding actual industry capability to deliver the required capacities.
Consequentially, policymakers must address these unresolved challenges of non-light water reactor concepts. Most notably this refers to the organization of new waste disposal routes—all while most countries have yet to safely dispose of today’s fleets spent fuel—as well as the assessment of proliferation and safety risks. Redesigning licensing procedures to account for the high number of necessary reactor installations and speeding up procedures while accounting for heterogeneous designs and associated risks, might become necessary.
To conclude, given the nuclear industry’s current capabilities, the non-availability of a limited number of tested reactor concepts to attempt the proposed mass production, unproven non-electrical applications on a large scale, unsolved waste issues with novel fuel concepts, potential safety challenges, and obvious social challenges for the large scale implementation of nuclear power, it seems unlikely, from a techno-economic perspective, that non-light water reactors will play a major role in a near-future decarbonized energy system.
Thus, while the here discussed reactor concepts might become available in the coming decades, and could at some point be economically competitive, regulators and policymakers should also focus on implementing available technologies, i.e., renewables and grid capacity expansion coupled with demand-side flexibility and sufficient storage options, to continue ongoing energy system decarbonization efforts necessary today.
Acknowledgments
The research leading to these results has received funding from the Deutsche Forschungsgemeinschaft (DFG) under project number 423336886 and the German Federal Office for the Safety of Nuclear Waste Management (BASE), grant number 4722B50101.
Declaration of Interest
The authors declare that they have no known competing financial interests or personal relationships that could have appeared to influence the work reported in this paper.
Data Availability
All data used in this research is listed either in the Appendix or will be made available upon request. Model code and input data can be accessed via https://github.com/leonardgoeke/EuSysMod/tree/greenfield_nuclearHeat. Due to their size, model outputs are not part of the repository but are available upon request. The applied model uses the open AnyMOD.jl modeling framework [22]. The applied version of the tool is openly available under this link: https://github.com/leonardgoeke/AnyMOD.jl/releases/tag/flexibleElectrificationWorkingPaper.
Author Contributions
A.W.: Conceptualization; Methodology; Formal analysis; Investigation; Data Curation; Writing - Original Draft; Writing - Review & Editing; Visualization; F.B.: Investigation; Validation; Writing - Review & Editing; L.G.: Methodology; Validation; Software; Writing - Review & Editing
References
- Byers et al. [2022] Edward Byers, Volker Krey, Elmar Kriegler, Keywan Riahi, Roberto Schaeffer, Jarmo Kikstra, Robin Lamboll, Zebedee Nicholls, Marit Sandstad, Chris Smith, Kaj van der Wijst, Franck Lecocq, Joana Portugal-Pereira, Yamina Saheb, Anders Stromann, Harald Winkler, Cornelia Auer, Elina Brutschin, Claire Lepault, Eduardo Müller-Casseres, Matthew Gidden, Daniel Huppmann, Peter Kolp, Giacomo Marangoni, Michaela Werning, Katherine Calvin, Celine Guivarch, Tomoko Hasegawa, Glen Peters, Julia Steinberger, Massimo Tavoni, Detlef van Vuuren, Alaa Al Khourdajie, Piers Forster, Jared Lewis, Malte Meinshausen, Joeri Rogelj, Bjorn Samset, and Ragnhild Skeie. AR6 Scenarios Database, April 2022. URL https://zenodo.org/record/5886912.
- Duan et al. [2022] Lei Duan, Robert Petroski, Lowell Wood, and Ken Caldeira. Stylized least-cost analysis of flexible nuclear power in deeply decarbonized electricity systems considering wind and solar resources worldwide. Nature Energy, February 2022. ISSN 2058-7546. 10.1038/s41560-022-00979-x. URL https://www.nature.com/articles/s41560-022-00979-x.
- Rothwell [2022] Geoffrey Rothwell. Projected electricity costs in international nuclear power markets. Energy Policy, 164:112905, May 2022. ISSN 03014215. 10.1016/j.enpol.2022.112905. URL https://linkinghub.elsevier.com/retrieve/pii/S0301421522001306.
- Lovins [2022] Amory B. Lovins. US nuclear power: Status, prospects, and climate implications. The Electricity Journal, 35(4):107122, May 2022. ISSN 10406190. 10.1016/j.tej.2022.107122. URL https://linkinghub.elsevier.com/retrieve/pii/S1040619022000483.
- Steigerwald et al. [2023] Björn Steigerwald, Jens Weibezahn, Martin Slowik, and Christian Von Hirschhausen. Uncertainties in estimating production costs of future nuclear technologies: A model-based analysis of small modular reactors. Energy, 281:128204, October 2023. ISSN 03605442. 10.1016/j.energy.2023.128204. URL https://www.sciencedirect.com/science/article/pii/S0360544223015980.
- Wealer et al. [2021] B. Wealer, S. Bauer, C.v. Hirschhausen, C. Kemfert, and L. Göke. Investing into third generation nuclear power plants - Review of recent trends and analysis of future investments using Monte Carlo Simulation. Renewable and Sustainable Energy Reviews, 143:110836, June 2021. ISSN 13640321. 10.1016/j.rser.2021.110836. URL https://linkinghub.elsevier.com/retrieve/pii/S1364032121001301.
- Böse et al. [2024] Fanny Böse, Alexander Wimmers, Björn Steigerwald, and Christian von Hirschhausen. Questioning nuclear scale-up propositions: Availability and economic prospects of light water, small modular and advanced reactor technologies. Energy Research & Social Science, 110(April 2024):103448, 2024. https://doi.org/10.1016/j.erss.2024.103448.
- Göke et al. [2023a] Leonard Göke, Alexander Wimmers, and Christian von Hirschhausen. Flexible nuclear power and fluctuating renewables? – A techno-economic analysis for decarbonized energy systems. 2023a. 10.48550/ARXIV.2302.14515. URL https://arxiv.org/abs/2302.14515. Publisher: arXiv Version Number: 1.
- Thomas [2010] Steve Thomas. Competitive energy markets and nuclear power: Can we have both, do we want either? Energy Policy, 38(9):4903–4908, September 2010. ISSN 03014215. 10.1016/j.enpol.2010.04.051. URL https://linkinghub.elsevier.com/retrieve/pii/S0301421510003435.
- Nuttall [2022] William J Nuttall. Nuclear renaissance: technologies and policies for the future of nuclear power. CRC Press, Boca Raton, 2022. ISBN 978-1-00-059502-4 978-1-00-303873-3 978-1-00-059510-9. URL https://www.taylorfrancis.com/books/9781003038733. OCLC: 1316697337.
- WNN [2023] WNN. Ministerial declaration puts nuclear at heart of climate action. World Nuclear News, February 2023. URL https://www.world-nuclear-news.org/Articles/Ministerial-declaration-puts-nuclear-at-heart-of-c.
- Markard et al. [2020] Jochen Markard, Nuno Bento, Noah Kittner, and Alejandro Nuñez-Jimenez. Destined for decline? Examining nuclear energy from a technological innovation systems perspective. Energy Research & Social Science, 67:101512, September 2020. ISSN 22146296. 10.1016/j.erss.2020.101512. URL https://linkinghub.elsevier.com/retrieve/pii/S221462962030089X.
- Committee on Laying the Foundation for New and Advanced Nuclear Reactors in the United States et al. [2023] Committee on Laying the Foundation for New and Advanced Nuclear Reactors in the United States, Nuclear and Radiation Studies Board, Board on Energy and Environmental Systems, Division on Engineering and Physical Sciences, Division on Earth and Life Studies, National Academy of Engineering, and National Academies of Sciences, Engineering, and Medicine. Laying the Foundation for New and Advanced Nuclear Reactors in the United States. National Academies Press, Washington, D.C., 2023. ISBN 978-0-309-69077-5. 10.17226/26630. URL https://www.nap.edu/catalog/26630. Pages: 26630.
- Fattahi et al. [2022] Amirhossein Fattahi, Jos Sijm, Machteld Van Den Broek, Rafael Martínez Gordón, Manuel Sanchez Dieguez, and André Faaij. Analyzing the techno-economic role of nuclear power in the Dutch net-zero energy system transition. Advances in Applied Energy, 7:100103, September 2022. ISSN 26667924. 10.1016/j.adapen.2022.100103. URL https://linkinghub.elsevier.com/retrieve/pii/S266679242200021X.
- Ingersoll et al. [2020] Eric Ingersoll, Kirsty Gogan, John Herter, Andrew Foss, Jane Pickering, and Romana Vysatova. Cost & Performance Requirements for Flexible Advanced Nuclear Plants in Future U.S. Power Markets. Report for the ORNL Resource team supporting ARPA-E’s MEITNER Program, Lucid Catalyst, July 2020. URL https://www.lucidcatalyst.com/_files/ugd/2fed7a_a1e392c51f4f497395a53dbb306e87fe.pdf.
- MIT [2018] MIT. The Future of Nuclear Energy in a Carbon-Constrained World. Technical report, Massachusetts Institute of Technology, Cambridge, MA, 2018. URL http://energy.mit.edu/wp-content/uploads/2018/09/The-Future-of-Nuclear-Energy-in-a-Carbon-Constrained-World.pdf.
- Brown [2022] Nicholas R. Brown. Engineering demonstration reactors: A stepping stone on the path to deployment of advanced nuclear energy in the United States. Energy, 238:121750, January 2022. ISSN 03605442. 10.1016/j.energy.2021.121750. URL https://linkinghub.elsevier.com/retrieve/pii/S0360544221019988.
- Black et al. [2023] G. Black, D. Shropshire, K. Araújo, and A. Van Heek. Prospects for Nuclear Microreactors: A Review of the Technology, Economics, and Regulatory Considerations. Nuclear Technology, 209(sup1):S1–S20, January 2023. ISSN 0029-5450, 1943-7471. 10.1080/00295450.2022.2118626. URL https://www.tandfonline.com/doi/full/10.1080/00295450.2022.2118626.
- Jenkins et al. [2018] J.D. Jenkins, Z. Zhou, R. Ponciroli, R.B. Vilim, F. Ganda, F. De Sisternes, and A. Botterud. The benefits of nuclear flexibility in power system operations with renewable energy. Applied Energy, 222:872–884, July 2018. ISSN 03062619. 10.1016/j.apenergy.2018.03.002. URL https://linkinghub.elsevier.com/retrieve/pii/S0306261918303180.
- Bistline et al. [2023] John Bistline, Shannon Bragg-Sitton, Wesley Cole, Brent Dixon, Erich Eschmann, Jonathan Ho, Augustine Kwon, Laura Martin, Caitlin Murphy, Christopher Namovicz, and Andrew Sowder. Modeling nuclear energy’s future role in decarbonized energy systems. iScience, 26(2):105952, February 2023. ISSN 25890042. 10.1016/j.isci.2023.105952. URL https://linkinghub.elsevier.com/retrieve/pii/S2589004223000299.
- Shirvan [2022] Koroush Shirvan. Overnight Capital Cost of the Next AP1000. Technical Report MIT-ANP-TR-193, Massachusetts Institute of Technology, Cambridge, MA, March 2022. URL https://web.mit.edu/kshirvan/www/research/ANP193%20TR%20CANES.pdf?trk=public_post_comment-text.
- Göke [2021] Leonard Göke. AnyMOD.jl: A Julia package for creating energy system models. SoftwareX, 16:100871, 2021. ISSN 2352-7110. 10.1016/j.softx.2021.100871. URL https://www.sciencedirect.com/science/article/pii/S2352711021001382.
- Schneider et al. [2024] Mycle Schneider, Antony Froggatt, Julie Hazemann, Ozgur Gurbuz, Paul Jobin, Phil Johnstone, Timothy Judson, Yuki Kobayashi, Doug Koplow, Edwin Lyman, M. V. Ramana, Sebastian Stier, Andy Stirling, Tatsujiro Suzuki, Christian Von Hirschhausen, Alexander Wimmers, Hartmut Winkler, Maahin Ahmed, Nina Schneider, Agnès Stienne, and Friedhelm Meinass. The World Nuclear Industry Status Report 2024. Technical report, Mycle Schneider Consulting, Paris, France, September 2024. URL https://www.worldnuclearreport.org/IMG/pdf/wnisr2024-v2.pdf.
- Csik and Kupitz [1997] Bela J. Csik and Jürgen Kupitz. Nuclear power applications: Supplying heat for homes and industries. IAEA Bulletin, 39(2):21–25, 1997. URL https://www.iaea.org/sites/default/files/publications/magazines/bulletin/bull39-2/39205082125.pdf.
- Safa [2012] H. Safa. Heat recovery from nuclear power plants. International Journal of Electrical Power & Energy Systems, 42(1):553–559, November 2012. ISSN 01420615. 10.1016/j.ijepes.2012.04.052. URL https://linkinghub.elsevier.com/retrieve/pii/S0142061512001792.
- IAEA [2002] IAEA, editor. Market potential for non-electric applications of nuclear energy. Number 410 in Technical reports series / International Atomic Energy Agency. Internat. Atomic Energy Agency, Vienna, 2002. ISBN 978-92-0-115402-6.
- IAEA [2017a] IAEA. Opportunities for cogeneration with nuclear energy. Number v.NP-T-4.1 in IAEA Nuclear Energy Series No. NP-T-4.1. International Atomic Energy Agency, Vienna, Austria, 2017a. ISBN 978-92-0-103616-2.
- IAEA [2019] IAEA. Guidance on Nuclear Energy Cogeneration. Technical Report NP-T-1.7, International Atomic Energy Agency, 2019. URL https://www.iaea.org/publications/13385/guidance-on-nuclear-energy-cogeneration.
- OECD and NEA [2022a] OECD and NEA. Beyond Electricity: The Economics of Nuclear Cogeneration. Nuclear TEchnology Development and Economics 7363, Nuclear Energy Agency, 2022a. URL https://www.oecd-nea.org/jcms/pl_71699/beyond-electricity-the-economics-of-nuclear-cogeneration?details=true.
- Nilsson and Hannus [1978] L. Nilsson and M. Hannus. SECURE Nuclear District Heating Plant. Nuclear Technology, 38(2):225–234, April 1978. ISSN 0029-5450, 1943-7471. 10.13182/NT78-A32017. URL https://www.tandfonline.com/doi/full/10.13182/NT78-A32017.
- Leppänen [2019] Jaakko Leppänen. A Review of District Heating Reactor Technology. Technical Report VTT-R-06895-18, VTT Technical Research Centre of Finland, October 2019. URL https://cris.vtt.fi/ws/portalfiles/portal/24936486/VTT_R_06895_18.pdf.
- Kupitz [2001] Jürgen Kupitz. Small and medium reactors: Development status and application aspects. pages 497–534, Trieste, Italy, December 2001. ICTP Lecture Notes. URL https://www.osti.gov/etdeweb/biblio/20854884.
- Kraev [2021] Kamen Kraev. City Of Haiyang ‘First In Country’ To Have District Heating System Powered By Nuclear. NucNet, December 2021. URL https://www.nucnet.org/news/city-of-haiyang-first-in-country-to-have-district-heating-system-powered-by-nuclear-11-5-2021.
- Pisciotta et al. [2022] Maxwell Pisciotta, Hélène Pilorgé, John Feldmann, Rory Jacobson, Justine Davids, Shelvey Swett, Zachary Sasso, and Jennifer Wilcox. Current state of industrial heating and opportunities for decarbonization. Progress in Energy and Combustion Science, 91:100982, July 2022. ISSN 03601285. 10.1016/j.pecs.2021.100982. URL https://linkinghub.elsevier.com/retrieve/pii/S0360128521000800.
- IAEA [2017b] IAEA. Industrial Applications of Nuclear Energy. Technical Report NP-T-4.3, International Atomic Energy Agency, 2017b. URL https://www.iaea.org/publications/10979/industrial-applications-of-nuclear-energy.
- OECD and NEA [2022b] OECD and NEA. The Role of Nuclear in the Hydrogen Economy: Cost and Competitiveness. Technical Report 7630, Nuclear Energy Agency, Boulogne-Billancourt, France, 2022b. URL https://www.oecd-nea.org/jcms/pl_73133/the-role-of-nuclear-power-in-the-hydrogen-economy.
- Bartels et al. [2010] Jeffrey R. Bartels, Michael B. Pate, and Norman K. Olson. An economic survey of hydrogen production from conventional and alternative energy sources. International Journal of Hydrogen Energy, 35(16):8371–8384, August 2010. ISSN 03603199. 10.1016/j.ijhydene.2010.04.035. URL https://linkinghub.elsevier.com/retrieve/pii/S0360319910007317.
- Nuttall and Bakenne [2020] William J. Nuttall and Adetokunboh T. Bakenne. Fossil Fuel Hydrogen: Technical, Economic and Environmental Potential. Springer International Publishing, Cham, 2020. ISBN 978-3-030-30907-7 978-3-030-30908-4. 10.1007/978-3-030-30908-4. URL http://link.springer.com/10.1007/978-3-030-30908-4.
- Doctor [2006] Richard D. Doctor. Evaluation of a Continuous Calcium-Bromine Thermochemical Cycle, May 2006. URL https://www.hydrogen.energy.gov/pdfs/review06/pd_16_doctor.pdf.
- Pregger et al. [2009] Thomas Pregger, Daniela Graf, Wolfram Krewitt, Christian Sattler, Martin Roeb, and Stephan Möller. Prospects of solar thermal hydrogen production processes. International Journal of Hydrogen Energy, 34(10):4256–4267, May 2009. ISSN 03603199. 10.1016/j.ijhydene.2009.03.025. URL https://linkinghub.elsevier.com/retrieve/pii/S0360319909004352.
- Pinsky et al. [2020] Roxanne Pinsky, Piyush Sabharwall, Jeremy Hartvigsen, and James O’Brien. Comparative review of hydrogen production technologies for nuclear hybrid energy systems. Progress in Nuclear Energy, 123:103317, May 2020. ISSN 01491970. 10.1016/j.pnucene.2020.103317. URL https://linkinghub.elsevier.com/retrieve/pii/S014919702030069X.
- Schneider et al. [2023] Mycle Schneider, Antony Froggatt, Julie Hazemann, Christian von Hirschhausen, M.V. Ramana, Alexander James Wimmers, Nina Schneider, Tatsujiro Suzuki, Agnès Stienne, Friedhelm Meinass, Doug Koplow, Timothy Judson, and Hartmut Winkler. World Nuclear Industry Status Report 2023. Technical report, Mycle Schneider Consulting, Paris, 2023. URL https://www.worldnuclearreport.org/IMG/pdf/wnisr2023-v1-hr.pdf.
- Rawool-Sullivan et al. [2002] Mohini Rawool-Sullivan, Paul D. Moskowitz, and Ludmilla N. Shelenkova. Technical and Proliferation-Related Aspects of the Dismantlement of Russian Alfa-Class Nuclear Submarines. The Nonproliferation Review, Spring:161–171, 2002. URL https://nonproliferation.org/wp-content/uploads/npr/91mosk.pdf.
- Al-Othman et al. [2019] Amani Al-Othman, Noora N. Darwish, Muhammad Qasim, Mohammad Tawalbeh, Naif A. Darwish, and Nidal Hilal. Nuclear desalination: A state-of-the-art review. Desalination, 457:39–61, May 2019. ISSN 00119164. 10.1016/j.desal.2019.01.002. URL https://linkinghub.elsevier.com/retrieve/pii/S0011916418323531.
- Ingersoll et al. [2014] D Ingersoll, Z Houghton, R Bromm, M McKellar, and R Boardman. Extending Nuclear Energy to Non - Electrical Applications. Technical report, The 19th Pacific Basin Nuclear Conference (PBNC 2014), August 2014. URL https://inldigitallibrary.inl.gov/sites/sti/sti/6303857.pdf.
- Faibish et al. [2002] R. S. Faibish, T. Konishi, and M. Gasparini. Application of Nuclear Energy for Seawater Desalination: Design Concepts of Nuclear Desalination Plants. In 10th International Conference on Nuclear Engineering, Volume 4, pages 15–22, Arlington, Virginia, USA, January 2002. ASMEDC. ISBN 978-0-7918-3598-2. 10.1115/ICONE10-22071. URL https://asmedigitalcollection.asme.org/ICONE/proceedings/ICONE10/35987/15/295413.
- Price et al. [2023] James Price, Ilkka Keppo, and Paul E. Dodds. The role of new nuclear power in the UK’s net-zero emissions energy system. Energy, 262:125450, January 2023. ISSN 03605442. 10.1016/j.energy.2022.125450. URL https://linkinghub.elsevier.com/retrieve/pii/S0360544222023325.
- Robb Stewart and Shirvan [2023] W. Robb Stewart and Koroush Shirvan. Construction schedule and cost risk for large and small light water reactors. Nuclear Engineering and Design, 407:112305, June 2023. ISSN 00295493. 10.1016/j.nucengdes.2023.112305. URL https://linkinghub.elsevier.com/retrieve/pii/S0029549323001541.
- Black et al. [2021] Geoffrey Black, David Shropshire, and Kathleen Araújo. Small modular reactor (SMR) adoption: Opportunities and challenges for emerging markets. In Handbook of Small Modular Nuclear Reactors, pages 557–593. Elsevier, 2021. ISBN 978-0-12-823916-2. 10.1016/B978-0-12-823916-2.00022-9. URL https://linkinghub.elsevier.com/retrieve/pii/B9780128239162000229.
- Liu and Fan [2014] Zhitao Liu and Jihong Fan. Technology readiness assessment of Small Modular Reactor (SMR) designs. Progress in Nuclear Energy, 70:20–28, January 2014. ISSN 01491970. 10.1016/j.pnucene.2013.07.005. URL https://linkinghub.elsevier.com/retrieve/pii/S0149197013001303.
- Ramana [2021] M. V. Ramana. Small Modular and Advanced Nuclear Reactors: A Reality Check. IEEE Access, 9:42090–42099, 2021. ISSN 2169-3536. 10.1109/ACCESS.2021.3064948. Conference Name: IEEE Access.
- Pistner et al. [2021] Christoph Pistner, Matthias Englert, Christian Küppers, Ben Wealer, Björn Steigerwald, Christian von Hirschhausen, and Richard Donderer. Sicherheitstechnische Analyse und Risikobewertung einer Anwendung von SMR-Konzepten (Small Modular Reactors). Technical Report Vorhaben 4720F50500, Bundesamt für die Sicherheit der nuklearen Entsorgung, Berlin, 2021. URL https://www.base.bund.de/SharedDocs/Downloads/BASE/DE/berichte/kt/gutachten-small-modular-reactors.pdf?__blob=publicationFile&v=6.
- Henderson and Taylor [2006] A. David Henderson and Amy Taylor. The US Department of Energy research and development programme on hydrogen production using nuclear energy. International Journal of Nuclear Hydrogen Production and Applications, 1(1):51, 2006. ISSN 1743-4939, 1743-4947. 10.1504/IJNHPA.2006.009868. URL http://www.inderscience.com/link.php?id=9868.
- Gardner and Mishra [2023] Timothy Gardner and Manas Mishra. NuScale ends Utah project, in blow to US nuclear power ambitions. Reuters, September 2023. URL https://www.reuters.com/business/energy/nuscale-power-uamps-agree-terminate-nuclear-project-2023-11-08/.
- Seaborg [1970] Glenn T. Seaborg. The Plutonium Economy of the Future, 1970. URL http://fissilematerials.org/library/aec70.pdf.
- Midttun and Baumgartner [1986] Atle Midttun and Thomas Baumgartner. Negotiating Energy Futures: The Politics of Energy Forecasting. Energy Policy, 14(3):219–241, June 1986. ISSN 0301-4215. 10.1016/0301-4215(86)90145-X. URL http://www.sciencedirect.com/science/article/pii/030142158690145X.
- Bunn et al. [2003] Matthew Bunn, Steve Fetter, John P. Holdren, and Bob van der Zwaan. The Economics of Reprocessing Versus Direct Disposal of Spent Nuclear Fuel. Technical report, Belfer Center for Science and International Affairs, Harvard Kennedy School, 2003.
- Strauss [1954] Lewis L. Strauss. Remarks Prepared by Lewis L. Straus, Chairman, United States Atomic Energy Commission, For Delivery At The Founders’ Day Dinner, National Association of Science Writers, On Thusday, September 16, 1954, New York, New York., September 1954. URL https://www.nrc.gov/docs/ML1613/ML16131A120.pdf.
- Cochran et al. [2010] Thomas B. Cochran, Harold A. Feiveson, Walter Patterson, Gennadi Pshakin, M.V. Ramana, Mycle Schneider, Tatsujiro Suzuki, and Frank von Hippel. Fast Breeder Reactor Programs: History and Status. Technical Report Research Report 8, International Panel on Fissile Materials, Princeton, N.J, 2010. URL http://fissilematerials.org/library/2010/02/fast_breeder_reactor_programs_.html.
- Schulenberg [2022] Thomas Schulenberg. The fourth generation of nuclear reactors: Fundamentals, Types, and Benefits Explained. Springer Berlin Heidelberg, Berlin, Heidelberg, 2022. ISBN 978-3-662-64918-3 978-3-662-64919-0. 10.1007/978-3-662-64919-0. URL https://link.springer.com/10.1007/978-3-662-64919-0.
- Ohshima and Kubo [2016] H. Ohshima and S. Kubo. Sodium-cooled fast reactor. In Handbook of Generation IV Nuclear Reactors, pages 97–118. Woodhead Publishing, Cambridge, UK, 2016. ISBN 978-0-08-100149-3. 10.1016/B978-0-08-100149-3.00005-7. URL https://linkinghub.elsevier.com/retrieve/pii/B9780081001493000057.
- IAEA [2022a] IAEA. Nuclear Power Reactors in the World. Number IAEA-RDS-2/42. International Atomic Energy Agency, Vienna, 2022a. ISBN 978-92-0-125122-0.
- Pistner et al. [2023] Christoph Pistner, Matthias Englert, Christian von Hirschhausen, Fanny Böse, Björn Steigerwald, and Lukas Gast. Analyse und Bewertung des Entwicklungsstands, der Sicherheit und des regulatorischen Rahmens für sogenannte neuartige Reaktorkonzepte. Zwischenbericht zu AP-1 und -2 Vorhaben 4721F50501, Bundesamt für die Sicherheit der nuklearen Entsorgung, Berlin, 2023. URL https://www.base.bund.de/SharedDocs/Downloads/BASE/DE/berichte/kt/zwischenbericht-gutachten-sogenannte-neuartige-reaktorkonzepte.pdf?__blob=publicationFile&v=4.
- Alemberti [2021] Alessandro Alemberti. Lead Cooled Fast Reactors. In Encyclopedia of Nuclear Energy, pages 523–544. Elsevier, Berkeley, California, 2021. ISBN 978-0-12-819732-5. 10.1016/B978-0-12-819725-7.00001-5. URL https://linkinghub.elsevier.com/retrieve/pii/B9780128197257000015.
- Zhang et al. [2016] Zuoyi Zhang, Yujie Dong, Fu Li, Zhengming Zhang, Haitao Wang, Xiaojin Huang, Hong Li, Bing Liu, Xinxin Wu, Hong Wang, Xingzhong Diao, Haiquan Zhang, and Jinhua Wang. The Shandong Shidao Bay 200 MWe High-Temperature Gas-Cooled Reactor Pebble-Bed Module (HTR-PM) Demonstration Power Plant: An Engineering and Technological Innovation. Engineering, 2(1):112–118, March 2016. ISSN 20958099. 10.1016/J.ENG.2016.01.020. URL https://linkinghub.elsevier.com/retrieve/pii/S2095809916301552.
- Schultz et al. [2003] K.R. Schultz, L.C. Brown, G.E. Besenbruch, and C.J. Hamilton. Large-scale production of hydrogen by nuclear energy for the hydrogen economy. In Proceedings, Washington, D.C., April 2003. URL https://www.osti.gov/servlets/purl/814028.
- Stewart and Shirvan [2021] William Robb Stewart and Koroush Shirvan. Capital Cost Estimation for Advanced Nuclear Power Plants. preprint, Open Science Framework, January 2021. URL https://osf.io/erm3g.
- Riley et al. [2019] Brian J. Riley, Joanna McFarlane, Guillermo D. DelCul, John D. Vienna, Cristian I. Contescu, and Charles W. Forsberg. Molten salt reactor waste and effluent management strategies: A review. Nuclear Engineering and Design, 345:94–109, April 2019. ISSN 00295493. 10.1016/j.nucengdes.2019.02.002. URL https://linkinghub.elsevier.com/retrieve/pii/S002954931930024X.
- Rosenthal et al. [1970] M. Rosenthal, P. Kasten, and R. Briggs. Molten-Salt Reactors: History, Status, and Potential. Nuclear Applied Technology, 8(107), 1970. URL https://moltensalt.org/references/static/downloads/pdf/NAT_MSRintro.pdf.
- WNA [2021] WNA. Molten Salt Reactors, May 2021. URL https://www.world-nuclear.org/information-library/current-and-future-generation/molten-salt-reactors.aspx.
- Baik et al. [2022] Ejeong Baik, Kais Siala, Thomas Hamacher, and Sally M. Benson. California’s approach to decarbonizing the electricity sector and the role of dispatchable, low-carbon technologies. International Journal of Greenhouse Gas Control, 113:103527, January 2022. ISSN 17505836. 10.1016/j.ijggc.2021.103527. URL https://www.sciencedirect.com/science/article/pii/S1750583621002784.
- Asuega et al. [2023] Anthony Asuega, Braden J. Limb, and Jason C. Quinn. Techno-economic analysis of advanced small modular nuclear reactors. Applied Energy, 334:120669, March 2023. ISSN 03062619. 10.1016/j.apenergy.2023.120669. URL https://linkinghub.elsevier.com/retrieve/pii/S0306261923000338.
- Rodriguez [2018] Gilles Rodriguez. ASTRID - Lessons Learned, July 2018. URL https://www.gen-4.org/gif/jcms/c_101347/gen-iv-webinar-series-22-astrid-lessons-learned-mr-gilles-rodriguez?details=true.
- Budi et al. [2019] Rfs Budi, Ap Rijanti, Sm Lumbanraja, Md Birmano, Es Amitayani, and E Liun. Fuel and O&M Costs Estimation of High Temperature Gas-cooled Reactors and Its Possibility to be Implemented in Indonesia. IOP Conference Series: Materials Science and Engineering, 536(1):012144, June 2019. ISSN 1757-8981, 1757-899X. 10.1088/1757-899X/536/1/012144. URL https://iopscience.iop.org/article/10.1088/1757-899X/536/1/012144.
- Green [2019] Jim Green. SMR cost estimates, and costs of SMRs under construction. Nuclear Monitor, 872-873:18–22, July 2019. ISSN 2542-5439.
- IAEA [2020] IAEA. Advances in Small Modular Reactor Developments. A Supplement to: IAEA Advanced Reactors Information System (ARIS). Technical report, International Atomic Energy Agency, Vienna, Austria, 2020. URL https://aris.iaea.org/Publications/SMR_Book_2020.pdf.
- Stein et al. [2022] Adam Stein, Jonah Messinger, Seaver Wang, Juzel LLoyd, Jameson McBride, and Rani Franovich. Advancing Nuclear Energy - Evaluating Deployment, Investmant, and Impact in Amercia’s Clean Energy Future. Technical report, The Breakthrough Institute, Berkeley, California, June 2022. URL https://thebreakthrough.org/articles/advancing-nuclear-energy-report.
- Dixon et al. [2017] B. W. Dixon, F. Ganda, K. A. Williams, E. Hoffman, and J. K. Hanson. Advanced Fuel Cycle Cost Basis – 2017 Edition. Technical Report INL/EXT–17-43826, 1423891, September 2017. URL http://www.osti.gov/servlets/purl/1423891/.
- Nian and Zhong [2020] Victor Nian and Sheng Zhong. Economic feasibility of flexible energy productions by small modular reactors from the perspective of integrated planning. Progress in Nuclear Energy, 118:103106, January 2020. ISSN 01491970. 10.1016/j.pnucene.2019.103106. URL https://linkinghub.elsevier.com/retrieve/pii/S0149197019302070.
- Faibish [2019] Ron Faibish. Status Report - EM² (General Atomics). Technical report, September 2019. URL https://aris.iaea.org/PDF/EM2(GeneralAtomics)_2020.pdf.
- IAEA [2001] IAEA. Current status and future development of modular high temperature gas cooled reactor technology. Technical Report IAEA-TECDOC-1198, International Atomic Energy Agency, 2001. URL https://www.iaea.org/publications/6124/current-status-and-future-development-of-modular-high-temperature-gas-cooled-reactor-technology.
- Birch [2019] Scott Birch. EBR-II experience aided ARC-100 SMR design review. Reuters Events Nuclear, October 2019. URL https://www.reutersevents.com/nuclear/ebr-ii-experience-aided-arc-100-smr-design-review.
- Hibbs [2018] Mark Hibbs. The Future of Nuclear Power in China. Technical report, Carnegie Endowment for International PEace, 2018. URL https://carnegieendowment.org/files/Hibbs_ChinaNuclear_Final.pdf.
- Holdman et al. [2011] Gwen Holdman, Dennis Witmer, Frank Williams, Dominique Pride, Richard Stevens, Ginny Gay, and Tobias Schwörer. Small Scale Modular Nuclear Power: an option for Alaska? Technical report, University of Aslaska, Alaska Center for Energy and Power, Institute for Social and Economic Research, March 2011. URL http://large.stanford.edu/courses/2017/ph241/tesfai1/docs/holdmann.pdf.
- Samalova et al. [2017] Ludmila Samalova, Ondrej Chvala, and G. Ivan Maldonado. Comparative economic analysis of the Integral Molten Salt Reactor and an advanced PWR using the G4-ECONS methodology. Annals of Nuclear Energy, 99:258–265, January 2017. ISSN 03064549. 10.1016/j.anucene.2016.09.001. URL https://linkinghub.elsevier.com/retrieve/pii/S0306454916307356.
- Brooking [2015] Jon Brooking. Design review and hazop studies for stable salt reactor. Mumbai, India, October 2015.
- Wang [2019] Brian Wang. Micro-reactor as cheap as natural gas without air pollution. Next Big Future, January 2019. URL https://www.nextbigfuture.com/2019/01/micro-reactors-as-cheap-as-natural-gas-without-air-pollution.html.
- TASS [2021] TASS. Cost of BREST fast reactor construction estimated at $1.3 bln, says Rosatom. TASS - Russian News Agency, August 2021. URL https://tass.com/economy/1300401.
- Lu and Brown [2019] Cihang Lu and Nicholas R. Brown. Fully ceramic microencapsulated fuel in prismatic high-temperature gas-cooled reactors: Design basis accidents and fuel cycle cost. Nuclear Engineering and Design, 347:108–121, June 2019. ISSN 00295493. 10.1016/j.nucengdes.2019.03.022. URL https://linkinghub.elsevier.com/retrieve/pii/S0029549318311294.
- DOE [2023] U.S. DOE. Pathways to Commercial Liftoff: Advanced Nuclear. Technical report, United States Department of Energy, 2023. URL https://liftoff.energy.gov/wp-content/uploads/2023/03/20230320-Liftoff-Advanced-Nuclear-vPUB.pdf.
- Start [2021] SMR Start. The Economics of Small Modular Reactors. Technical report, March 2021. URL https://smrstart.org/wp-content/uploads/2021/03/SMR-Start-Economic-Analysis-2021-APPROVED-2021-03-22.pdf.
- Stewart et al. [2020] W.Robb Stewart, Enrique Velez, Ralph Wiser, and Koroush Shirvan. Pathways to Cost-effective Advanced Nuclear Technology. preprint, Volume 8: Advances in Energy Innovation and Development, December 2020. URL https://www.energy-proceedings.org/?p=6880.
- Gandrik et al. [2012] A. M. Gandrik, B. W. Wallace, M. W. Patterson, and P. Mills. Assessment of High Temperature Gas-Cooled Reactor (HTGR) Capital and Operating Costs. Techncial Evaluation Study TEV-1196, Idaho National Laboratory, January 2012. URL https://art.inl.gov/NGNP/INL%20Documents/Year%202012/Assessment%20of%20High%20Temperature%20Gas-Cooled%20Reactor%20-%20HTGR%20-%20Capital%20and%20Operating%20Costs.pdf.
- Stewart et al. [2021] W.R. Stewart, E. Velez-Lopez, R. Wiser, and K. Shirvan. Economic solution for low carbon process heat: A horizontal, compact high temperature gas reactor. Applied Energy, 304:117650, December 2021. ISSN 03062619. 10.1016/j.apenergy.2021.117650. URL https://linkinghub.elsevier.com/retrieve/pii/S0306261921010175.
- U.S. DOE [1993] U.S. DOE. Modular high temparature gas-cooled reactor commercialization and generation cost estimates. Technical Report DOE/HTGR–90365, 10198837, ON: TI94020283, United States Department of Energy, November 1993. URL https://www.osti.gov/servlets/purl/10198837/.
- Ltd and Lucid Strategy [2018] CleanTech Catalyst Ltd and Inc. Lucid Strategy. The ETI Nuclear Cost Drivers Project: Summary Report. Technical report, Energy Technology Institute, April 2018. URL https://www.lucidcatalyst.com/_files/ugd/2fed7a_0bf1b6be925b4f729ffcd13a8410d6bc.pdf.
- Ganda [2015] F. Ganda. Economic Evaluation of Promising Options. Technical Report FCRD-FCO–2015-000013, 1555293, FCRD- FCO-2015-000013, September 2015. URL https://www.osti.gov/servlets/purl/1555293/.
- David E. Shropshire [2009] David E. Shropshire. Advanced Fuel Cycle Economic Tools, Algorithms, and Methodologies. Technical Report INL/EXT-09-15483, 957561, May 2009. URL http://www.osti.gov/servlets/purl/957561-sgvcTc/.
- Boardman et al. [2001] Charles E. Boardman, Marvin Hui, Douglas G. Carrol, and Allen E. Dubberley. Economic assessment of S-prism including development and generating costs. Nice, France, April 2001.
- Hoffmann et al. [2004] E. A. Hoffmann, R. N. Hill, and P. J. Finck. Estimated Cost for Low Conversion Ratio Burners. Technical report, Argonne National Laboratory, 2004.
- Engel et al. [1980] J.R. Engel, H.F. Bauman, J.F. Dearing, W.R. Grimes, H.E. McCoy, and W.A. Rhoades. Conceptual design characteristics of a denatured molten-salt reactor with once-through fueling. Technical Report ORNL/TM-7207, 5352526, July 1980. URL http://www.osti.gov/servlets/purl/5352526-JYbAWb/.
- Holcomb et al. [2011] D. E. Holcomb, F. J. Peretz, and A. L. Qualls. Advanced High Temperature Reactor Systems and Economic Analysis. Technical Report ORNL/TM-2011/364, Oak Ridge National Laboratory, September 2011. URL https://info.ornl.gov/sites/publications/files/Pub32466.pdf.
- IAEA [2023] IAEA. Comparaitve Evaluation of Nuclear Energy System Options. Final Report of the INPRO Collaborative Project CENESO. Technical Report IAEA-TECDOC-2027, International Atomic Energy Agency, 2023. URL https://www.iaea.org/publications/15331/comparative-evaluation-of-nuclear-energy-system-options.
- Schröders et al. [2018] Sarah Schröders, Karl Verfondern, and Hans-Josef Allelein. Energy economic evaluation of solar and nuclear driven steam methane reforming processes. Nuclear Engineering and Design, 329:234–246, April 2018. ISSN 00295493. 10.1016/j.nucengdes.2017.08.007. URL https://linkinghub.elsevier.com/retrieve/pii/S0029549317303813.
- van Heek [1996] A. I. van Heek. INCOGEN: Nuclear cogeneration in the Netherlands. Johannesburg, South Africa, November 1996. URL https://www.osti.gov/etdeweb/biblio/618604.
- Tolley et al. [2004] George S. Tolley, Donald W. Jones, Martin Castellano, William Clune, Philo Davidson, Kant Desai, Amelia Foo, Adrian Kats, Minghao Liao, Emil Iantchev, Nathan Ilten, Wei Li, Mark Nielson, Ashwin Rode Harris, James Taylor, Walter Theseria, Stephanie Waldhoff, Daniel Weitzenfeld, and Jie Zheng. The Economic Future of Nuclear Power. Study, University of Chicago, August 2004. URL https://www.nrc.gov/docs/ML1219/ML12192A420.pdf.
- Karakosta et al. [2013] Charikleia Karakosta, Charalampos Pappas, Vangelis Marinakis, and John Psarras. Renewable energy and nuclear power towards sustainable development: Characteristics and prospects. Renewable and Sustainable Energy Reviews, 22:187–197, June 2013. ISSN 13640321. 10.1016/j.rser.2013.01.035. URL https://linkinghub.elsevier.com/retrieve/pii/S136403211300066X.
- Moir [2002] R. W. Moir. Cost of Electricity from Molten Salt Reactors. Nuclear Technology, 138(1):93–95, April 2002. ISSN 0029-5450, 1943-7471. 10.13182/NT02-A3281. URL https://www.tandfonline.com/doi/full/10.13182/NT02-A3281.
- EC et al. [2014] EC, JRC, and SERTIS. Energy Technology Reference Indicator (ETRI) projections for 2010-2050. Technical Report Report EUR 26950 EN, Institute for Energy and Transport of the Joint Research Centre of the European Commission, 2014. URL https://data.europa.eu/doi/10.2790/057687.
- Lloyd et al. [2020] Clara Lloyd, Robbie Lyons, and Tony Roulstone. Expanding Nuclear’s Contribution to Climate Change with SMRs. Nuclear Future, page 39, November 2020. URL https://www.researchgate.net/publication/345362136_Expanding_Nuclear’s_Contribution_to_Climate_Change_with_SMRs.
- Stewart and Shirvan [2022] W.R. Stewart and K. Shirvan. Capital cost estimation for advanced nuclear power plants. Renewable and Sustainable Energy Reviews, 155:111880, March 2022. ISSN 13640321. 10.1016/j.rser.2021.111880. URL https://linkinghub.elsevier.com/retrieve/pii/S1364032121011473.
- Grübler [2010] Arnulf Grübler. The costs of the French nuclear scale-up: A case of negative learning by doing. Energy Policy, 38(9):5174–5188, 2010. ISSN 0301-4215. 10.1016/j.enpol.2010.05.003. URL http://ac.els-cdn.com/S0301421510003526/1-s2.0-S0301421510003526-main.pdf?_tid=9fb81ed6-a436-11e5-93a5-00000aacb361&acdnat=1450299202_c0b4578bbda2083d3e728df85d5dccbe.
- Abou-Jaoude et al. [2023] Abdalla Abou-Jaoude, Linyu Lin, Chandrakanth Bolisetti, Elizabeth Worsham, Levi M Larsen, and Aaron Epiney. Literature Review of Advanced Reactor Cost Estimates. Technical Report INL/RPT-23-72972, Idaho National Laboratory, October 2023. URL https://inldigitallibrary.inl.gov/sites/sti/sti/Sort_66425.pdf.
- Koomey et al. [2017] Jonathan Koomey, Nathan E. Hultman, and Arnulf Grubler. A reply to “Historical construction costs of global nuclear power reactors”. Energy Policy, 102:640–643, March 2017. ISSN 03014215. 10.1016/j.enpol.2016.03.052. URL http://linkinghub.elsevier.com/retrieve/pii/S0301421516301549.
- Göke et al. [2023b] Leonard Göke, Jens Weibezahn, and Mario Kendziorski. How flexible electrification can integrate fluctuating renewables. Energy, 278:127832, September 2023b. ISSN 03605442. 10.1016/j.energy.2023.127832. URL https://linkinghub.elsevier.com/retrieve/pii/S0360544223012264.
- Lynch et al. [2022] Arthur Lynch, Yannick Perez, Sophie Gabriel, and Gilles Mathonniere. Nuclear fleet flexibility: Modeling and impacts on power systems with renewable energy. Applied Energy, 314:118903, May 2022. ISSN 03062619. 10.1016/j.apenergy.2022.118903. URL https://linkinghub.elsevier.com/retrieve/pii/S0306261922003282.
- Aunedi et al. [2023] Marko Aunedi, Abdullah A. Al Kindi, Antonio M. Pantaleo, Christos N. Markides, and Goran Strbac. System-driven design of flexible nuclear power plant configurations with thermal energy storage. Energy Conversion and Management, 291:117257, September 2023. ISSN 01968904. 10.1016/j.enconman.2023.117257. URL https://linkinghub.elsevier.com/retrieve/pii/S0196890423006039.
- Rothwell [2016] Geoffrey Rothwell. Economics of Nuclear Power. Routledge, London, UK, 2016. ISBN 978-1-138-85840-4.
- IAEA [2024] IAEA. Power Reactor Information System, 2024. URL https://pris.iaea.org/pris/home.aspx.
- Committee on Merits and Viability of Different Nuclear Fuel Cycles and Technology Options and the Waste Aspects of Advanced Nuclear Reactors et al. [2023] Committee on Merits and Viability of Different Nuclear Fuel Cycles and Technology Options and the Waste Aspects of Advanced Nuclear Reactors, Nuclear and Radiation Studies Board, Board on Energy and Environmental Systems, Division on Earth and Life Studies, Division on Engineering and Physical Sciences, and National Academies of Sciences, Engineering, and Medicine. Merits and Viability of Different Nuclear Fuel Cycles and Technology Options and the Waste Aspects of Advanced Nuclear Reactors. National Academies Press, Washington, D.C., February 2023. ISBN 978-0-309-29508-6. 10.17226/26500. URL https://www.nap.edu/catalog/26500. Pages: 26500.
- Krall et al. [2022] Lindsay M. Krall, Allison M. Macfarlane, and Rodney C. Ewing. Nuclear waste from small modular reactors. Proceedings of the National Academy of Sciences, 119(23):e2111833119, June 2022. ISSN 0027-8424, 1091-6490. 10.1073/pnas.2111833119. URL https://pnas.org/doi/full/10.1073/pnas.2111833119.
- IPCC [2014] IPCC. Climate Change 2014: Synthesis Report. Contribution of Working Groups I, II and III to the Fifth Assessment Report of the Intergovernmental Panel on Climate Change. Technical report, IPCC, Geneva, Switzerland, 2014. URL https://www.ipcc.ch/site/assets/uploads/2018/02/SYR_AR5_FINAL_full.pdf.
- Wheatley et al. [2016] Spencer Wheatley, Benjamin K. Sovacool, and Didier Sornette. Reassessing the safety of nuclear power. Energy Research & Social Science, 15:96–100, May 2016. ISSN 22146296. 10.1016/j.erss.2015.12.026. URL https://linkinghub.elsevier.com/retrieve/pii/S2214629615301067.
- Sovacool et al. [2014] Benjamin K. Sovacool, Alex Gilbert, and Daniel Nugent. Risk, innovation, electricity infrastructure and construction cost overruns: Testing six hypotheses. Energy, 74:906–917, September 2014. ISSN 03605442. 10.1016/j.energy.2014.07.070. URL https://linkinghub.elsevier.com/retrieve/pii/S0360544214008925.
- Wimmers et al. [2024] Alexander Wimmers, Fanny Böse, Jasmin Beppler, Pauline Morawe, Maximilian Weber, and Christian von Hirschhausen. (Re)integrating radioactive materials and waste into a global sustainable development context. Radiation and Environmental Biophysics, 2024. https://doi.org/10.1007/s00411-024-01088-x.
- Bell and Macfarlane [2022] Marissa Z. Bell and Allison Macfarlane. “Fixing” the nuclear waste problem? The new political economy of spent fuel management in the United States. Energy Research & Social Science, 91:102728, September 2022. ISSN 22146296. 10.1016/j.erss.2022.102728. URL https://linkinghub.elsevier.com/retrieve/pii/S2214629622002328.
- Bärenbold et al. [2024] Rebekka Bärenbold, Muhammad Maladoh Bah, Rebecca Lordan-Perret, Björn Steigerwald, Christian von Hirschhausen, Ben Wealer, Hannes Weigt, and Alexander Wimmers. Decommissioning of commercial nuclear power plants: Insights from a multiple-case study. Renewable and Sustainable Energy Reviews, 201:114621, 2024. ISSN 13640321. 10.1016/j.rser.2024.114621. URL https://linkinghub.elsevier.com/retrieve/pii/S1364032124003472.
- Bowring [1980] Joseph Bowring. Federal Subsidies to Nuclear Power: Reactor Design and the Fuel Cycle. Analysis Report, United States Department of Energy, March 1980. URL https://www.earthtrack.net/sites/default/files/EIA%20Nuclear%20Subsidies%201980.pdf.
- Sawicki and Horbaczewska [2021] Lukasz Sawicki and Bozena Horbaczewska. Role of the state in implementation of strategic investment projects: The SaHo Model for nuclear power. International Journal of Management and Economics, 57(4):343–359, December 2021. ISSN 2543-5361. 10.2478/ijme-2021-0020. URL https://www.sciendo.com/article/10.2478/ijme-2021-0020.
- Loisel et al. [2018] Rodica Loisel, Victoria Alexeeva, Andreas Zucker, and David Shropshire. Load-following with nuclear power: Market effects and welfare implications. Progress in Nuclear Energy, 109:280–292, November 2018. ISSN 01491970. 10.1016/j.pnucene.2018.08.011. URL https://linkinghub.elsevier.com/retrieve/pii/S0149197018301938.
- LLC [2023] Monitoring Analytics LLC. State of the Market Report for PJM Q2 2023. Independent Market Monitor for PJM, October 2023. URL https://www.monitoringanalytics.com/reports/PJM_State_of_the_Market/2023/2023q2-som-pjm.pdf.
- Richards et al. [2021] James Richards, Cristian Rabiti, Hiroyuki Sato, Xing L. Yan, and Nolan Anderson. Economic Dispatch Model of Nuclear High-Temperature Reactor with Hydrogen Cogeneration in Electricity Market. Energies, 14(24):8289, December 2021. ISSN 1996-1073. 10.3390/en14248289. URL https://www.mdpi.com/1996-1073/14/24/8289.
- Poncelet et al. [2016] Kris Poncelet, Erik Delarue, Daan Six, Jan Duerinck, and William D’haeseleer. Impact of the level of temporal and operational detail in energy-system planning models. Applied Energy, 162:631–643, January 2016. ISSN 03062619. 10.1016/j.apenergy.2015.10.100. URL https://linkinghub.elsevier.com/retrieve/pii/S0306261915013276.
- Poncelet et al. [2020] Kris Poncelet, Erik Delarue, and William D’haeseleer. Unit commitment constraints in long-term planning models: Relevance, pitfalls and the role of assumptions on flexibility. Applied Energy, 258:113843, January 2020. ISSN 03062619. 10.1016/j.apenergy.2019.113843. URL https://linkinghub.elsevier.com/retrieve/pii/S0306261919315302.
- News [2021] 3E News. Kozloduy NPP has produced 28 percent more heat for its customers. 3E News, April 2021. URL https://3e-news.net/en/a/view/26376/kozloduy-npp-has-produced-28-percent-more-heat-for-its-customers.
- [136] CNL. WR-1 Reactor Decommissioning. URL https://www.cnl.ca/environmental-stewardship/wr-1-reactor-decommissioning/.
- Lunn and Sears [2018] Susan Lunn and Sarah Sears. A relic of Canada’s atom age, the NRU reactor is shutting down for good. CBC News, March 2018. URL https://www.cbc.ca/news/politics/a-relic-of-canada-s-atom-age-the-nru-reactor-is-shutting-down-for-good-1.4595836.
- WNA [2020] WNA. Desalination, March 2020. URL https://www.world-nuclear.org/information-library/non-power-nuclear-applications/industry/nuclear-desalination.aspx.
- IAEA [2000] IAEA. Status of non-electric nuclear heat applications: Technology and safety. Technical Report IAEA-TECDOC-1184, International Atomic Energy Agency, November 2000. URL https://www.iaea.org/publications/6013/status-of-non-electric-nuclear-heat-applications-technology-and-safety.
- Biarrotte et al. [2013] Jean-Luc Biarrotte, Didier Uriot, Luis Medieros Romao, and Dirk Vandelplassche. Beam operation aspects for the MYRRHA linear accelerator. In Technology and Components of Accelerator-driven Systems. Second International Workshop Proceedings, pages 135–147, Nantes, France, May 2013. OECD/NEA.
- IAEA [2022b] IAEA. Status and Trends in Spent Fuel and Radioactive Waste Management. IAEA Nuclear Energy. Vienna, 2022b. ISBN 978-92-0-130621-0.
- Hatala [2021] Branislav Hatala. Gas Cooled Fast Reactor System (GFR). In Encyclopedia of Nuclear Energy, pages 545–552. Elsevier, 2021. ISBN 978-0-12-819732-5. 10.1016/B978-0-12-409548-9.12207-9. URL https://linkinghub.elsevier.com/retrieve/pii/B9780124095489122079.
- Tsvetkov [2016] P. Tsvetkov. Gas-cooled fast reactors. In Handbook of Generation IV Nuclear Reactors, pages 91–96. Elsevier, 2016. ISBN 978-0-08-100149-3. 10.1016/B978-0-08-100149-3.00004-5. URL https://linkinghub.elsevier.com/retrieve/pii/B9780081001493000045.
- GIF [2024] GIF. Gas-cooled fast reactor, 2024. URL https://www.gen-4.org/generation-iv-criteria-and-technologies/gas-cooled-fast-reactor-gfr.
- AEC [1972] AEC. An Evaluation of the Molten Salt Breeder Reactor. Technical Report WASH-1222 UC-80, Atomic Energy Commission of the United States, September 1972. URL http://large.stanford.edu/courses/2021/ph241/lecroy1/docs/wash-1222.pdf.
- Ramana [2016] M. V. Ramana. The checkered operational history of high-temperature gas-cooled reactors. Bulletin of the Atomic Scientists, 72(3):171–179, May 2016. ISSN 0096-3402, 1938-3282. 10.1080/00963402.2016.1170395. URL https://www.tandfonline.com/doi/full/10.1080/00963402.2016.1170395.
- Moormann et al. [2018] Rainer Moormann, R. Scott Kemp, and Ju Li. Caution Is Needed in Operating and Managing the Waste of New Pebble-Bed Nuclear Reactors. Joule, 2(10):1911–1914, October 2018. ISSN 25424351. 10.1016/j.joule.2018.07.024. URL https://linkinghub.elsevier.com/retrieve/pii/S2542435118303350.
- Short and Schmitt [2018] SM Short and BE Schmitt. Deployability of Small Modular Reactors for Alberta Applications - Phase II. Technical Report PNNL-27270, Pacific Northwest National Laboratory, 2018. URL https://albertainnovates.ca/wp-content/uploads/2020/07/Pacific-Northwest-National-Laboratory-Deployability-of-Small-Modular-Nuclear-Reactors-for-Alberta-Applications-Phase-2.pdf.
- WNN [2020] WNN. NuScale announces SMR power uprate. World Nuclear News, November 2020. URL https://www.world-nuclear-news.org/Articles/NuScale-announces-SMR-power-uprate#:%7E:text=The%20increase%20in%20generating%20capacity,about%20USD2850%2C%2.
- Schlissel [2023] David Schlissel. Eye-popping new cost estimates released for NuScale small modular reactor. Technical report, Institute for Energy Economics and Financial Analysis, November 2023. URL https://ieefa.org/resources/eye-popping-new-cost-estimates-released-nuscale-small-modular-reactor.
- Foss et al. [2021] A. Foss, H. Bryan, and P. Jeremiah. Cost Assessment of Small and Micro Nuclear Reactors for Oil Sands Applications. Technical Report INL/LTD-21-01565, Idaho National Laboratory, 2021.
- DOE [2020] U.S. DOE. Capital Cost and Performance Characteristic Estimates for Utility Scale Electric Power Generating Technologies. Technical report, United States Department of Energy, February 2020. URL https://www.eia.gov/analysis/studies/powerplants/capitalcost/pdf/capital_cost_AEO2020.pdf.
- Ganda et al. [2018] F. Ganda, T. A. Taiwo, and T. K. Kim. Report on the Update of Fuel Cycle Cost Algorithms. Technical Report NTRD-FCO-2018-000439, Argonne National Laboratory, June 2018. URL https://publications.anl.gov/anlpubs/2018/07/144923.pdf.
- Auer et al. [2020] Hans Auer, Pedro Crespo del Granado, Pao-Yu Oei, Karlo Hainsch, Konstantin Löffler, Thorsten Burandt, Daniel Huppmann, and Ingeborg Grabaak. Development and modelling of different decarbonization scenarios of the European energy system until 2050 as a contribution to achieving the ambitious 1.5 °C climate target—establishment of open source/data modelling in the European H2020 project openENTRANCE. e & i Elektrotechnik und Informationstechnik, 137(7):346–358, November 2020. ISSN 0932-383X, 1613-7620. 10.1007/s00502-020-00832-7. URL https://link.springer.com/10.1007/s00502-020-00832-7.
- Risch et al. [2022] Stanley Risch, Rachel Maier, Junsong Du, Noah Pflugradt, Peter Stenzel, Leander Kotzur, and Detlef Stolten. Potentials of Renewable Energy Sources in Germany and the Influence of Land Use Datasets. Energies, 15(15):5536, July 2022. ISSN 1996-1073. 10.3390/en15155536. URL https://www.mdpi.com/1996-1073/15/15/5536.
- Dupré La Tour [2023] Marie-Alix Dupré La Tour. Photovoltaic and wind energy potential in Europe – A systematic review. Renewable and Sustainable Energy Reviews, 179:113189, June 2023. ISSN 13640321. 10.1016/j.rser.2023.113189. URL https://linkinghub.elsevier.com/retrieve/pii/S136403212300045X.
- Commission of the European Union. Joint Research Centre. Institute for Energy and Transport. [2015] Commission of the European Union. Joint Research Centre. Institute for Energy and Transport. The JRC-EU-TIMES model: bioenergy potentials for EU and neighbouring countries. Publications Office, LU, 2015. URL https://data.europa.eu/doi/10.2790/39014.
- Hampp et al. [2023] Johannes Hampp, Michael Düren, and Tom Brown. Import options for chemical energy carriers from renewable sources to Germany. PLOS ONE, 18(2):e0262340, February 2023. ISSN 1932-6203. 10.1371/journal.pone.0281380. URL https://dx.plos.org/10.1371/journal.pone.0281380.
- Caglayan et al. [2020] Dilara Gulcin Caglayan, Nikolaus Weber, Heidi U. Heinrichs, Jochen Linßen, Martin Robinius, Peter A. Kukla, and Detlef Stolten. Technical potential of salt caverns for hydrogen storage in Europe. International Journal of Hydrogen Energy, 45(11):6793–6805, February 2020. ISSN 03603199. 10.1016/j.ijhydene.2019.12.161. URL https://linkinghub.elsevier.com/retrieve/pii/S0360319919347299.
- ENTSO-E [2020] ENTSO-E. Completing the Map - Power System Needs in 2030 and 2040. Technical report, 2020. URL https://eepublicdownloads.blob.core.windows.net/public-cdn-container/tyndp-documents/TYNDP2020/FINAL/entso-e_TYNDP2020_IoSN_Main-Report_2108.pdf.
- ACER [2023] ACER. Unit Investment Cost Indicators for Energ Infrastructure Categories. Technical report, European Union Agency for the Cooperation of Energy Regulators, April 2023. URL https://www.acer.europa.eu/sites/default/files/documents/Publications/ACER_UIC_indicators_table.pdf.
- 50Hertz et al. [2021] 50Hertz, Amprion, TransnetBW, and Tennet. Kostenschätzungen im Netzentwicklungsplan Strom 2035. Technical Report 1. Entwurf, 2021. URL https://www.netzentwicklungsplan.de/sites/default/files/2023-02/NEP_2035_2021_1_Entwurf_Kostenschaetzungen_0.pdf.
- Neumann et al. [2022] Fabian Neumann, Veit Hagenmeyer, and Tom Brown. Assessments of linear power flow and transmission loss approximations in coordinated capacity expansion problems. Applied Energy, 314:118859, May 2022. ISSN 03062619. 10.1016/j.apenergy.2022.118859. URL https://linkinghub.elsevier.com/retrieve/pii/S0306261922002938.
- Danish Energy Agency [2022] Danish Energy Agency. Technology Data. Technical report, 2022. URL https://ens.dk/en/our-services/technology-catalogues.
Appendix A Heat Provision Examples
| Country | Reactor | Type | Application | Heat provided (MWth) | Operational Lifetime (Reactor)* | Gross Power (MWe) | Reference |
|---|---|---|---|---|---|---|---|
| Bulgaria | Kozloduy-1 | PWR | District heat | 230 (total) | 1974 - 2002 | 440 | [32] |
| Kozloduy-2 | PWR | District heat | 230 (total) | 1975-2002 | 440 | [32] | |
| Kozloduy-3 | PWR | District heat | 230 (total) | 1981-2006 | 440 | [32] | |
| Kozloduy-4 | PWR | District heat | 230 (total) | 1982-2006 | 440 | [32] | |
| Kozloduy-5 | PWR | District heat | 230 (total) | 1988 - today | 1100 | [32, 135] | |
| Kozloduy-6 | PWR | District heat | 230 (total) | 1993 - today | 1100 | [32, 135] | |
| Canada | WR-1 | CANDU OCR | District heat | 13 - 15 | 1965 - 1985 | 60 (MWth) | [32, 136] |
| NRU reactor | HWR | District heat | 4-8 | 1957-2007 | 125 MWth | [32, 137] | |
| Bruce-1 | CANDU | Process heat | 840 (total | 1977 - today** | 868 | [32] | |
| Bruce-2 | CANDU | Process heat | 840 (total | 1977 - today*** | 836 | [32] | |
| Bruce-3 | CANDU | Process heat | 840 (total | 1978 - today**** | 868 | [32] | |
| Bruce-4 | CANDU | Process heat | 840 (total | 1979 - today***** | 868 | [32] | |
| China | NHR-5 | PWR | n.a. | n.a. | 1989 - ? | 5 | [32, 31] |
| Haiyang-1 | PWR | District heat | n.a. | 2018-today | 1250 | [33] | |
| Haiyang-2 | PWR | District heat | n.a. | 2019-today | 1250 | [33] | |
| Germany | Stade | PWR | Process heat | 40 | 1972 - 2003 | 630 | [32] |
| Greifswald-1 | PWR | District heat | 180 (total) | 1974-1990 | 440 | [32] | |
| Greifswald-2 | PWR | District heat | 180 (total) | 1975-1990 | 440 | [32] | |
| Greifswald-3 | PWR | District heat | 180 (total) | 1978-1990 | 440 | [32] | |
| Greifswald-4 | PWR | District heat | 180 (total) | 1979-1990 | 440 | [32] | |
| Hungary | Paks-1 | PWR | District heat | 55 (total) | 1983-today | 509 | [32, 29] |
| Paks-2 | PWR | District heat | 55 (total) | 1984-today | 509 | [32, 29] | |
| Paks-3 | PWR | District heat | 55 (total) | 1986-today | 509 | [32, 29] | |
| Paks-4 | PWR | District heat | 55 (total) | 1987-today | 509 | [32, 29] | |
| India | Madras 1 | PHWR | Desalination | N.a. | 1983-today | 205 | [138] |
| Madras 2 | PHWR | Desalination | N.a. | 1985-today | 205 | [138] | |
| BARC | N.a. | Desalination | N.a. | N.a. | [32] | ||
| Japan | Ikata-1 | PWR | Desalination | N.a. | 1977-2016 | 566 | [46] |
| Ikata-2 | PWR | Desalination | N.a. | 1982-2018 | 566 | [46] | |
| Ikata 3 | PWR | Desalination | N.a. | 1994 - today | 890 | [46] | |
| Ohi-1 | PWR | Desalination | N.a. | 1979-2018 | 1175 | [46] | |
| Ohi-2 | PWR | Desalination | N.a. | 1979-2018 | 1175 | [46] | |
| Ohi-3 | PWR | Desalination | N.a. | 1991 - today | 1180 | [46] | |
| Ohi-4 | PWR | Desalination | N.a. | 1993 - today | 1180 | [46] | |
| Genkai-4 | PWR | Desalination | N.a. | 1997 - today | 1180 | [46] | |
| Genkai-3 | PWR | Desalination | N.a. | 1994 - today | 1180 | [46] | |
| Takahama-3 | PWR | Desalination | N.a. | 1985 - today | 870 | [46] | |
| Takahama-4 | PWR | Desalination | N.a. | 1985 - today | 870 | [46] | |
| Kashiwazai Kariwa-1 | BWR | Desalination | N.a. | 1985 - 2011* | 1100 | [46] | |
| Kazakhstan | BN-350 | SFR | Desalination | N.a. | x-1999 | 150 | [46, 28] |
| Norway | Halden | BHWR | Process heat | 20 | 1958-2018 | n.a. | [28] |
| Romania | Cernavoda-1 | CANDU | District heat | N.a. | 1996-today | 706 | [32] |
| Russia | APS-1 OBNINSK | LWGR | District heat | 10 | 1954-2002 | 6 | [32] |
| Bilibino-1 | LWGR | District heat | 19 | 1974-2019 | 12 | [32] | |
| Bilibino-2 | LWGR | District heat | 19 | 1975-today | 12 | [32] | |
| Bilibino-3 | LWGR | District heat | 19 | 1976-today | 12 | [32] | |
| Bilibino-4 | LWGR | District heat | 19 | 1977-today | 12 | [32] | |
| VK-50 | BWR | District heat | n.a. | 50 | [32] | ||
| Novovoronezh 4(shut down for modernisation) | PWR | Process heat | 38 | 1973-today | 417 | [139] | |
| Novovoronezh 5(shut down for modernization in 2010) | PWR | Process heat | 38 | 1981-today | 950 | [139] | |
| Balakovo 1 | PWR | District heat | 233 | 1985-today | 950 | [139] | |
| Balakovo 2 | PWR | District heat | 233 | 1987-today | 950 | [139] | |
| Balakovo 3 | PWR | District heat | 233 | 1988-today | 950 | [139] | |
| Balakovo 4 | PWR | District heat | 233 | 1993-today | 950 | [139] | |
| Kalinin 1 | PWR | District and process heat | 93 | 1984-today | 950 | [139] | |
| Kalinin 2 | PWR | District and process heat | 93 | 1986-today | 950 | [139] | |
| Kola 1 | PWR | District and process heat | 29 | 1973-today | 411 | [139] | |
| Kola 2 | PWR | District and process heat | 29 | 1974-today | 411 | [139] | |
| Kola 3 | PWR | District and process heat | 58 | 1981-today | 411 | [139] | |
| Kola 4 | PWR | District and process heat | 29 | 1984-today | 411 | [139] | |
| Belojarsk 3 | FBR | District and process heat | 198 | 1980-today | 560 | [139] | |
| Leningrad 1 | LWGR | District and process heat | 29 | 1973-2018 | 925 | [139] | |
| Leningrad 2 | LWGR | District and process heat | 29 | 1975-2020 | 925 | [139] | |
| Leningrad 3 | LWGR | District and process heat | 29 | 1979-today | 925 | [139] | |
| Leningrad 4 | LWGR | District and process heat | 29 | 1981-today | 925 | [139] | |
| Kursk 1 | LWGR | District and process heat | 148 | 1976-2021 | 925 | [139] | |
| Kursk 2 | LWGR | District and process heat | 148 | 1979-2024 | 925 | [139] | |
| Kursk 3 | LWGR | District and process heat | 204 | 1983-today | 925 | [139] | |
| Kursk 4 | LWGR | District and process heat | 204 | 1985-today | 925 | [139] | |
| Smolensk 1 | LWGR | District and process heat | 201 | 1982-today | 925 | [139] | |
| Smolensk 2 | LWGR | District and process heat | 201 | 1985-today | 925 | [139] | |
| Smolensk 3 | LWGR | District and process heat | 201 | 1990-today | 925 | [139] | |
| BOR-60 | FBR | District heat | n.a. | 12 | [32] | ||
| Slovakia | Bohunice-3 | PWR | District heat | 240 (total) | 1985-today | 500 | [32] |
| Bohunice-4 | PWR | District heat | 240 (total) | 1985-today | 500 | [32] | |
| Sweden | Agesta | PHWR | District heat | 55-68 | 1964-1974 | 12 | [32, 31] |
| Switzerland | Beznau-1 | PWR | District and process heat | 80 | 1969 - today | 380 | [32, 29] |
| Beznau-2 | PWR | District and process heat | 80 | 1972 - today | 380 | [32, 29] | |
| Goesgen | PWR | Process heat | n.a. | 1979-today | 1060 | [32] | |
| U.K. | Calder Hall 1-4 | GCR | Process heat | n.a. | 1956-2006 | 60 | [32] |
| U.S. | Diablo Canyon-1 | PWR | Desalination | n.a. | 1985-today | 1197 | [32] |
| Diablo Canyon-2 | PWR | Desalination | n.a. | 1986-today | 1197 | [32] | |
| Ukraine | Zaporozhye-1 | PWR | District heat | 1165 (total) | 1985-today | 1000 | [32] |
| Zaporozhye-2 | PWR | District heat | 1165 (total) | 1986-today | 1000 | [32] | |
| Zaporozhye-3 | PWR | District heat | 1165 (total) | 1987-today | 1000 | [32] | |
| Zaporozhye-4 | PWR | District heat | 1165 (total) | 1988-today | 1000 | [32] | |
| Zaporozhye-5 | PWR | District heat | 1165 (total) | 1989-today | 1000 | [32] | |
| Zaporozhye-6 | PWR | District heat | 1165 (total) | 1996-today | 1000 | [32] | |
| South Ukraine 1 | PWR | District heat | 534 (total) | 1983-today | 1000 | [32] | |
| South Ukraine 2 | PWR | District heat | 534 (total) | 1985-today | 1000 | [32] | |
| South Ukraine 3 | PWR | District heat | 534 (total) | 1989-today | 1000 | [32] | |
| Rivne-1 | PWR | District heat | 291 (Total) | 1981-today | 420 | [32] | |
| Rivne-2 | PWR | District heat | 291 (Total) | 1982-today | 415 | [32] | |
| Rivne-3 | PWR | District heat | 291 (Total) | 1987-today | 1000 | [32] |
Appendix B Non-Light Water Reactor Technologies
In this section of the appendix, we provide a brief technological overview of the non-light water reactors discussed in Section 2.2. Other concepts, not discussed here, include Accelerator-Driven Systems [140], and Supercritical water-cooled reactors [63]. In this overview, we also give examples of existing or planned experimental, demonstration, and, if available, commercial reactors.
Sodium Cooled Fast Reactors (SFR)
SFRs operate on a fast neutron spectrum and thus require no moderator. The core is cooled by liquid sodium. SFRs can operate on Mixed-oxide (MOX) fuel, which contains plutonium, or on enriched uranium fuel. They output temperature ranges from 400 to 450 °C. The main technical challenges SFRs have faced in the past relate to the high reactivity of sodium when in contact with water and air. Furthermore, the opaque nature of liquid sodium complicates inspection, monitoring and fuel exchange operations and induces component stress. To establish a fleet of SFRs, fuel manufacturing infrastructure must be set up, and additional proliferation safeguarding measures will have to be set up. Potential applications, in addition to electricity and heat provision, is the potential of so-called waste "recycling" via reprocessing facilities (to be reestablished) and plutonium breeding in the reactor itself [63, 60, 59]. SFR research has been ongoing since the 1940s, with the first experimental reactors built in the 1950s and 1960s, e.g., EBR-1, Fermi-1, and EBR-2 in the U.S., DFR in the U.K., or Rapsodie in France. All of these reactors are closed. In the 1970s, further experimental and demonstration reactors were built in Germany (KNK-II (closed), SNR-300 (never critical)), France (Phénix and Superphénix (both closed)), the Soviet Union/Kazakhstan (BN-350 (closed)), the U.K. (PFR, closed), Japan (Jōyō (operational), Monju (closed)), and India (FBTR (operational)). China commissioned its first experimental SFR CEFR in 2012. The only two operational commercial SFRs, BN-600 and BN-800, are located in Russia [23, 61, 63, 7]. Two SFRs are currently under construction in India (PFBR) and China (CFR-600). Other ongoing development projects are in various planning and licensing stages. These include the Indian FBR 1 & 2 projects, the Japanese Toshiba 4S, the Russian BN-1200 and BOR-60 (MBIR), the South Korean PGSFR, and GE Hitachi’s PRISM and VTR, as well as TerraPower’s TWR, both in the U.S.. The French ASTRID project was discontinued in 2019 [141, 61, 60].
Lead-cooled fast reactors (LFR)
LFRs operate with fast neutrons and thus require no moderator. The coolant is liquid lead or lead-bismuth composite. LFRs are planned to run on MOX fuel with output temperatures of 400 to 620°C. The main challenges for LFR implementation relate to the supply of MOX fuel and required infrastructure, the management of generated polonium-210, corrosion and material erosion risks because fuel rods containing iron, nickel and cobalt would be diluted in the coolant, the sensitivity of a potential reactor to seismic activity due to the high density and mass of the coolant, and finally, inspection and monitoring challenges due to opaque coolant. Historically, LFRs were used for marine propulsion, but in addition to the same potential applications of SFRs, they could provide load-following services due to the theoretically short ramp-up times [63, 64, 60]. Initial development efforts began in 1942 in the U.S. but were soon canceled. The first experimental reactor 27/VT was built in 1959 in the Soviet Union for marine propulsion. In the 1970s, seven Soviet Lira-class submarines were fitted with LFRs, all of which have been out of service since the mid-1990s [43]. Currently, there is no operational LFR. Current concepts are the Belgian MYRRHA (also planned as an accelerator-driven system), the Chinese CLFR-100, CLFR-300 and BLESS, the EU-funded projects ALFRED and ELFR, the LRF-AS-200 under development in Luxemburg, the Russian BREST-OD-300 (under construction) and SVBR-100, the South Korean PEACER, and the Westinghouse-LFR in the U.S. [64, 60, 63].
Gas-cooled fast reactors (GFR)
In addition to SFRs and LFRs discussed in the main text, there exist fast reactor concepts not based on liquid metal coolants, but instead on gasses, such as Helium or CO2. Depending on the coolant, these GFRs can reach output temperatures ranging from 500 to 850°C. Up to 600°C, MOX fuel could be used for operations, at higher temperatures, to-be-developed uranium-plutonium-carbide fuels could be applied. Technical challenges are the low thermal conductivity of gasses, complicating cooling system design and inflating the size of the reactor itself, the unavailability of required fuels, and the availability of suitable materials capable of whithstanding high temperatures and pressures. The main advantage compared to SFRs and LFRs is the low reactivity of helium (inert), and the potentially high thermal efficiency. Furthermore, the high output temperatures could be used to supply valuable process heat to the industry [142, 143]. The first reactor concept was designed around 1962 by General Atomics in the U.S., followed by EU-funded concept designs from the 1970s onwards (GBR 1-4), and the Enhanced Gas-Cooled Reactor concept in the U.K., designed in the 1990s. However, no reactor was built. Since the early 2000s, France has been fostering GFR research, leading to the proposed ALLEGRO concept. Other concepts under development are the KAMADO FBR in Japan and the General Atomics EM2 [144, 142, 143].
Molten Salt Reactors (MSR)
The term MSRs comprises a multitude of different reactor concepts and designs. The common denominator is the chosen coolant being a type of molten salt, based on lithium or sodium in combination with fluoride or chloride. Furthermore, some concepts run on fast, some on slow neutron spectra. The latter require graphite as moderator. Fuel can be sometimes integrated into the molten salts, and be of various liquid and solid concepts, such as HALEU, uranium-plutonium, uranium-thorium, or plutonium combined with minor actinides. Output temperatures range around 600 to 700°C. In addition to heat and electricity provision, MSRs could function as thermal storage facilities. Current challenges limiting MSR establishment relate to the identification and testing of suitable salt-material combinations and the development of integrated models for safety case assessments. Furthermore, the radioactive salts require the establishment of infrastructure for storage and transport. Additionally, proliferation and safety regulations might have to be adapted [63, 68]. The U.S. Air Force first researched MSRs for aircraft propulsion in the 1950s, followed by the MSRE experimental reactor built at the Oak Ridge National Laboratory (ORNL) in the 1960s. This reactor has been in a long-term enclosure since 1969 [145]. There are no currently operating MSRs, but an array of different concepts are under development. Thermal fluoride-based MSRs with solid fuel are under development in China (TSMR-SF) and the U.S. Here, the ORNL is working on the AHTR and Mark 1 PB-FHR concepts, and Kairos Power is developing the KP-FHR. Thermal fluoride-based MSRs with liquid fuel are under development in Canada (Terrestrial Energy’s IMSR-400), China (TSMR-LF), Denmark (Seaborgy Technology’s MSTR or CMSR concept), Japan (FUJI), and the ORNL’s ThorCon in the US. Two projects, the Russian MOSART and the internationally-funded MSFR (funded by Australia, Canada, the EU, France, Russia, Switzerland, and the U.S.) are concepts for fast fluoride-based MSRs with liquid fuel. Finally, three fast chloride-based MSR concepts with liquid fuel are under development. The projects are the German-designed, recently Canada-based Dual-Fluid reactor, and US-based concepts MSCFR by Elysium, and the SSR-W by Moltex Energy [68, 63].
(Very-)High-temperature reactors (HTR)
HTRs are moderated with graphite and require gas, such as helium, as coolant. They require so-called TRISO fuel, usually pebble-based, to operate. This fuel can be based on uranium, plutonium, or thorium. The advantage of HTRs is their potentially very high output temperature of up to 1,000°C (albeit experimental reactors have yielded only 800°C), making them promising for providing high-temperature process heat for, e.g., coal gasification or cement production. Depending on the design, they might be suitable for reprocessed fuel, and high operating temperatures increase thermal efficiency. However, these high temperatures pose the most significant challenges for HTR development. For example, graphite moderation functions only up to 950°C. Thus new materials are required for higher temperatures. Every component must be able to withstand high corrosion and stress. Further, operations must ensure that internal temperatures do not reach the TRISO fuel melting point at 1,800°C. Additionally, waste volumes are inflated due to pebble-based fuel and graphite [146, 63, 66, 147]. The first experimental reactors were built in the 1960s in the UK (Dragon) and the US (Peach Bottom and AVR); they are all closed. Two demonstration reactors built in the 1980s in Germany (THTR) and the U.S. (Fort St. Vrain) have also been closed. Two experimental reactors are operational in China (HTR-10), and Japan (HTTR). China also operates the only commercial-scale HTR worldwide, the 210-MW-HTR-PM, connected to the grid in 2021. Current concepts under development are the Japanese GTHTR300, the Polish TeResa, and several concepts in the U.S., such as the FHR, the AHTR-100, and X-Energy’s Xe-100 microreactor. The ANTARES and Pismatic Modular HTGRs were both discontinued [65, 16, 7, 146, 113].
Appendix C Cost and Technology Data
This section of the appendix provides all the data from the literature analysis. Tables 4, 5, and 6 give the minimum, mean, and maximum OCC and OM cost normalized to USD-2019, as well as the number of retrieved data points, per reactor type. Table 7 shows the factors used to normalize the cost data taken from the literature shown in Tables LABEL:tab:cost_raw_occ, LABEL:tab:cost_raw_om_fix and LABEL:tab:cost_raw_om_var.
| Readiness Level | Reactor Type | Data Points | Mean | Min | Max |
| FOAK | LWR | 5 | 5,622.9 | 3,880 | 7,164 |
| SMR | 12 | 9,241.42 | 3,466.2 | 26,452.44 | |
| SFR | 5 | 9,511.47 | 4641 | 20,511 | |
| HTR | 18 | 9,438.52 | 3,466.2 | 26,452.22 | |
| NOAK | LWR | 16 | 4,983.78 | 1,782.62 | 9,035.4 |
| SMR | 10 | 4,407.51 | 1,940 | 7,735 | |
| SFR | 15 | 4,677.97 | 1,476 | 7,380 | |
| HTR | 22 | 5,649.65 | 2,501.33 | 11,618 | |
| LFR | 5 | 4,910.07 | 2,952 | 7,735 | |
| MSR | 11 | 5,167.05 | 2,988.75 | 10,447.31 | |
| MSFR | 1 | 1,891.5 | 1,891.5 | 1,891.5 |
| Readiness Level | Reactor Type | Data Points | Mean | Min | Max |
| FOAK | LWR | 3 | 184.72 | 38.8 | 398 |
| SMR | 1 | 175.96 | 175.96 | 175.96 | |
| SFR | 1 | 398 | 398 | 398 | |
| HTR | 9 | 184.72 | 38.8 | 613.04 | |
| NOAK | LWR | 3 | 124.07 | 31 | 199 |
| SMR | 1 | 95 | 95 | 95 | |
| SFR | 3 | 86.58 | 199 | 112.42 | |
| HTR | 8 | 114.61 | 13.4 | 480.24 | |
| LFR | 1 | 120.29 | 120.29 | 120.29 | |
| MSR | 3 | 116.92 | 18.15 | 205.78 | |
| MSFR | 1 | 126.83 | 126.83 | 126.83 |
| Readiness Level | Reactor Type | Data Points | Mean | Min | Max |
| FOAK | LWR | 2 | 3.6 | 2.36 | 4.85 |
| SMR | 2 | 25.17 | 21.34 | 29 | |
| HTR | 4 | 20.12 | 0.34 | 30.81 | |
| NOAK | LWR | 2 | 4.71 | 4.44 | 4.98 |
| SMR | 2 | 8.78 | 3 | 2.33 | |
| SFR | 1 | 2.33 | 2.33 | 2.33 | |
| HTR | 12 | 19.11 | 1.43 | 34.2 | |
| MSR | 2 | 28.27 | 21.09 | 35.44 |
| Year | Inflation to 2019 | Combined Cost Factor following Abou-Jaoude et al. (2023) |
| 1978 | 392% | 6.6 |
| 1979 | 352% | 6.22 |
| 1980 | 310% | 5.9 |
| 1981 | 281% | 5.35 |
| 1982 | 265% | 4.89 |
| 1983 | 257% | 4.5 |
| 1984 | 246% | 4.17 |
| 1985 | 238% | 3.89 |
| 1986 | 233% | 3.77 |
| 1987 | 225% | 3.66 |
| 1988 | 216% | 3.55 |
| 1989 | 206% | 3.45 |
| 1990 | 196% | 3.35 |
| 1991 | 188% | 3.24 |
| 1992 | 182% | 3.14 |
| 1993 | 177% | 3.04 |
| 1994 | 172% | 2.94 |
| 1995 | 168% | 2.85 |
| 1996 | 163% | 2.83 |
| 1997 | 159% | 2.77 |
| 1998 | 157% | 2.76 |
| 1999 | 153% | 2.73 |
| 2000 | 148% | 2.71 |
| 2001 | 144% | 2.63 |
| 2002 | 142% | 2.51 |
| 2003 | 139% | 2.37 |
| 2004 | 135% | 2.19 |
| 2005 | 131% | 1.99 |
| 2006 | 127% | 1.48 |
| 2007 | 123% | 1.16 |
| 2008 | 119% | 1.21 |
| 2009 | 119% | 1.26 |
| 2010 | 117% | 1.25 |
| 2011 | 114% | 1.23 |
| 2012 | 111% | 1.18 |
| 2013 | 110% | 1.19 |
| 2014 | 108% | 1.16 |
| 2015 | 108% | 1.14 |
| 2016 | 107% | 1.13 |
| 2017 | 104% | 1.11 |
| 2018 | 102% | 1.06 |
| 2019 | 100% | 1 |
| 2020 | 99% | 0.97 |
| 2021 | 94% | 0.92 |
| 2022 | 87% | 0.75 |
| Reactor | Reactor Type | Capacity in MWe | OCC | Unit | Year | Description | Readiness Level | Reference |
|---|---|---|---|---|---|---|---|---|
| ASTRID | SFR | 600 | 7167 | USD/kWe | 2010 | Total Project Cost | FOAK | [73, 63] |
| NuScale | LWR-SMR | 924 | 3600 | USD/kWe | 2018 | NOAK OCC | NOAK | [3] |
| NuScale | LWR-SMR | 924 | 8000 | USD/kWe | 2018 | FOAK OCC | FOAK | [3] |
| TerraPower | LWR-SMR | 600 | 12000 | USD/kWe | 2018 | FOAK OCC | FOAK | [3] |
| HTGR | HTR | 250 | 6000 | USD/kWe | 2016 | OCC | FOAK | [75] |
| CAREM25 | LWR-SMR | 25 | 21900 | USD/kWe | 2017 | OCC | FOAK | [75] |
| SMART | LWR-SMR | 30 | 10000 | USD/kWe | 2020 | FOAK | FOAK | [76] |
| HTGR | HTR | 80 | 5518 | USD/kWe | 2020 | Lower Cost, High Learning (Best Case) // FOAK CAPEX | FOAK | [77] |
| Advanced reactor with thermal storage (ARTES) | LWR | 345 | 4000 | USD/kWe | 2020 | Lower Cost, High Learning (Best Case) // FOAK CAPEX | FOAK | [77] |
| HTGR | HTR | 80 | 7500 | USD/kWe | 2020 | Upper Cost, Low Learning (Worst Case) // FOAK CAPEX | FOAK | [77] |
| Advanced reactor with thermal storage (ARTES) | LWR | 345 | 6220 | USD/kWe | 2020 | Upper Cost, Low Learning (Worst Case) // FOAK CAPEX | FOAK | [77] |
| Fast Reactors | SFR | 4700 | USD/kWe | 2017 | OCC | NOAK | [78] | |
| Gas-cooled reactors | HTR | 5170 | USD/kWe | 2017 | OCC | NOAK | [78] | |
| Gas Turbines Modular Helium Reactor | HTR | 264 | 1521 | USD/kWe | 2003 | Capital Cost (+8% interest) | NOAK | [66] |
| KLT-40s | LWR-SMR | 35 | 3314 | USD/kWe | 2018 | FOAK | FOAK | [79] |
| EM2 | HTR | 116.6 | 4330 | USD/kWe | 2019 | NOAK 4 units // Var cost divided over full lifetime | NOAK | [80] |
| HTR-PM | HTR | 210 | 3270 | USD/kWe | 2018 | FOAK | FOAK | [79] |
| PBMR-400 | HTR | 265 | 1000 | USD/kWe | 2001 | NOAK plant cost | NOAK | [81] |
| ARC-100 | SFR | 44 | 5000 | USD/kWe | 2019 | Construction Cost | NOAK | [82] |
| GT-MHR | HTR | 285 | 2245 | USD/kWe | 2000 | FOAK prototype | FOAK | [81] |
| GT-MHR | HTR | 285 | 923 | USD/kWe | 2000 | NOAK 4 units | NOAK | [81] |
| CEFR | SFR | 8.8 | 19350 | USD/kWe | 2018 | FOAK | FOAK | [83] |
| 4S (Small) | SFR | 4.4 | 6000 | USD/kWe | 2011 | Capital Cost and Combined Operating License (Medium Case) | NOAK | [84] |
| 4S (Large) | SFR | 22 | 1200 | USD/kWe | 2011 | Capital Cost and Combined Operating License (Medium Case) | NOAK | [84] |
| Hyperion | LFR | 25 | 2400 | USD/kWe | 2011 | Capital Cost and Combined Operating License (Medium Case) | NOAK | [84] |
| IMSR-300 | MSR | 62.04 | 3720 | USD/kWe | 2015 | Overnight cost with first fuel load | NOAK | [85] |
| IMSR-600 | MSR | 128.04 | 2851 | USD/kWe | 2015 | Overnight cost with first fuel load | NOAK | [85] |
| IMSR-80 | MSR | 14.3 | 9165 | USD/kWe | 2015 | Overnight cost with first fuel load | NOAK | [85] |
| SSR-W | MSFR | 13.2 | 1950 | USD/kWe | 2020 | Construction Cost | NOAK | [86] |
| e-Vinci | MSR | 1.54 | 5772 | USD/kWe | 2020 | Construction Cost | NOAK | [87] |
| Brest-OD-300 | LFR | 132 | 4333 | USD/kWe | 2021 | Construction Cost | NOAK | [88] |
| Advanced reactor | LWR | n.a. | 3600 | USD/kWe | 2020 | NOAK OCC | NOAK | [90] |
| NuScale iPWR | LWR-SMR | 570 | 5100 | USD/kWe | 2015 | FOAK for 12 Units | FOAK | [148] |
| SMART | LWR-SMR | 100 | 5500 | USD/kWe | 2015 | FOAK for 2 - 3 units | FOAK | [148] |
| NGNP | HTR | 275 | 5980 | USD/kWe | 2014 | NOAK single module | NOAK | [148] |
| GT-HTR300 | HTR | 275 | 3420 | USD/kWe | 2014 | NOAK single module | NOAK | [148] |
| NuScale iPWR | LWR-SMR | 570 | 2895 | USD/kWe | 2014 | NOAK for 12 Units | NOAK | [148] |
| NuScale iPWR | LWR-SMR | 685 | 3856 | USD/kWe | 2018 | 10th-OAK for 12 Units | NOAK | [111] |
| NuScale VOYGR | LWR-SMR | 924 | 2850 | USD/kWe | 2018 | NOAK for 12 Units | NOAK | [149] |
| Nuscale/UAMPS | LWR-SMR | 426 | 20139 | USD/kWe | 2022 | FOAK for 6 units | FOAK | [150] |
| SMART iPWR | LWR-SMR | 5600 | USD/kWe | 2014 | n.a. | FOAK | [151] as cited by Abou-Jaoude et al. [113] | |
| SMR | LWR-SMR | 600 | 6191 | USD/kWe | 2019 | NOAK 12 units | NOAK | [152] |
| SMR | LWR-SMR | 600 | 3800 | USD/kWe | 2020 | FOAK 4 units | FOAK | [91] |
| SMR | LWR-SMR | 600 | 2000 | USD/kWe | 2020 | NOAK 4 units | NOAK | [91] |
| Traditional HTGR | HTR | 1100 | 4814 | USD/kWe | 2017 | NOAK 4 units | NOAK | [92] |
| Traditional HTGR | HTR | 1100 | 9900 | USD/kWe | 2017 | FOAK 4 units | FOAK | [92] |
| HTGR | HTR | n.a. | 6600 | USD/kWe | 2015 | NOAK | [151] as cited by Abou-Jaoude et al. [113] | |
| MIGHTR | HTR | 616 | 7346 | USD/kWe | 2017 | FOAK 4 units | FOAK | [92] |
| MIGHTR | HTR | 616 | 3585 | USD/kWe | 2017 | FOAK 4 units | FOAK | [92] |
| NGNP | HTR | 156 | 20994 | USD/kWe | 2009 | FOAK | FOAK | [93] |
| NGNP | HTR | 267 | 14479 | USD/kWe | 2009 | FOAK | FOAK | [93] |
| NGNP | HTR | 154 | 7324 | USD/kWe | 2009 | NOAK 1 unit | NOAK | [93] |
| NGNP | HTR | 267 | 5841 | USD/kWe | 2009 | NOAK 1 unit | NOAK | [93] |
| NGNP | HTR | 616 | 5718 | USD/kWe | 2009 | NOAK 4 units | NOAK | [93] |
| NGNP | HTR | 1068 | 4656 | USD/kWe | 2009 | NOAK 4 units | NOAK | [93] |
| NGNP | HTR | 1000 | 4602 | USD/kWe | 2009 | NOAK 4 units | NOAK | [16] |
| HC-HTGR | HTR | 101.2 | 7338 | USD/kWe | 2018 | FOAK 1 unit | FOAK | [94] |
| HC-HTGR | HTR | 404.8 | 4569 | USD/kWe | 2018 | FOAK 4 units | FOAK | [94] |
| HC-HTGR | HTR | 404.8 | 3000 | USD/kWe | 2018 | 10th-OAK 4 unit | NOAK | [94] |
| NGNP | HTR | 1056 | 5728 | USD/kWe | 2018 | FOAK 4 units | FOAK | [94] |
| NGNP | HTR | 1056 | 3400 | USD/kWe | 2018 | 10th-OAK 4 unit | NOAK | S [94] |
| MHTGR-SC | HTR | 693 | 3153 | USD/kWe | 1992 | FOAK 4 units | FOAK | [95] |
| MHTGR-SC | HTR | 693 | 2347 | USD/kWe | 1992 | NOAK 4 units | NOAK | [95] |
| MHTGR-GT/IC | HTR | 806 | 3290 | USD/kWe | 1992 | FOAK 4 units | FOAK | [95] |
| MHTGR-GT/IC | HTR | 806 | 2458 | USD/kWe | 1992 | NOAK 4 units | NOAK | [95] |
| MHTGR-GT/DC | HTR | 869 | 2656 | USD/kWe | 1992 | FOAK 4 units | FOAK | [95] |
| MHTGR-GT/DC | HTR | 869 | 1908 | USD/kWe | 1992 | NOAK 4 units | NOAK | [95] |
| HTGR | HTR | 1124 | 5468 | USD/kWe | 2017 | NOAK | NOAK | [96] as cited by [113] |
| SFR | SFR | 1100 | 4940 | USD/kWe | 2013 | NOAK 4 units | NOAK | [16] |
| LSPB | SFR | 1100 | 4734 | USD/kWe | 2013 | NOAK | [97] | |
| ABR1000 | SFR | 380 | 5612 | USD/kWe | 2017 | NOAK | [153] | |
| ALWR | LWR | 1000 | 3600 | USD/kWe | 2005 | FOAK | FOAK | [98] |
| ALWR | LWR | 1000 | 1800 | USD/kWe | 2005 | NOAK | NOAK | [98] |
| FBR | SFR | n.a. | 4400 | USD/kWe | 2005 | FOAK | FOAK | [98] |
| FBR | SFR | n.a. | 2200 | USD/kWe | 2005 | NOAK | NOAK | [98] |
| S-PRISM | SFR | 1520 | 2343 | USD/kWe | 2005 | NOAK | NOAK | [98] |
| S-PRISM | SFR | 1651 | 1317 | USD/kWe | 1996 | TCC 4 units ???? | NOAK | [99] |
| S-PRISM Mod B | SFR | 1866 | 1823 | USD/kWe | 2005 | NOAK | NOAK | [98] |
| S-PRISM Mod B | SFR | 1866 | 1554 | USD/kWe | 2004 | NOAK 6 units | NOAK | [100] |
| LSPB | SFR | 1311 | 4240 | USD/kWe | 2017 | NOAK | NOAK | [96] as cited by [113] |
| AHTR | MSR | 1350 | 4576 | USD/kWe | 2011 | NOAK | NOAK | [16] |
| MSR | MSR | 1000 | 5362 | USD/kWe | 2011 | NOAK | NOAK | [16] |
| FHR | MSR | 1330 | 4757 | USD/kWe | 2015 | NOAK 12 units | NOAK | [16] |
| DMSR | MSR | 1000 | 650 | USD/kWe | 1978 | NOAK | NOAK | [101] |
| AHTR | HTR | 1530 | 3384 | USD/kWe | 2011 | NOAK | NOAK | [102] |
| MSR | MSR | 190-1000 | 3664 | USD/kWe | 2017 | NOAK | NOAK | [96] as cited by [113] |
| FR | SFR | 2500 | USD/kWe | 2016 | NOAK | NOAK | [103] | |
| HTGR | HTR | 100 | 6319 | EUR/kWe | 2017 | FOAK | FOAK | [104] |
| HTGR | HTR | 100 | 5896 | EUR/kWe | 2017 | NOAK | NOAK | [104] |
| INCOGEN | HTR | 16.5 | 6000 | USD/kWe | 1992 | FOAK | FOAK | [105] |
| INCOGEN | HTR | 16.5 | 3700 | USD/kWe | 1992 | NOAK | NOAK | [105] |
| Advanced Nuclear Reactor | LWR | 1000 | 1800 | USD/kWe | 2003 | No-Policy Nuclear LCOE Installations (Max OCC) | NOAK | [106] |
| Nuclear Reactor | LWR | 1000 | 6880 | USD/kWe | 2017 | US (high) | NOAK | [16] |
| Nuclear Reactor | LWR | 1000 | 5500 | USD/kWe | 2017 | US (nominal) | NOAK | [16] |
| Nuclear Reactor | LWR | 1000 | 4100 | USD/kWe | 2017 | US (low) | NOAK | [16] |
| Nuclear Reactor | LWR | 1000 | 2750 | USD/kWe | 2017 | US (very low) | NOAK | [16] |
| Nuclear Reactor | LWR | 1000 | 2800 | USD/kWe | 2017 | China (nominal) | NOAK | [16] |
| Nuclear Reactor | LWR | 1000 | 2080 | USD/kWe | 2017 | China (low) | NOAK | [16] |
| Nuclear Reactor | LWR | 1000 | 6800 | USD/kWe | 2017 | France (nominal) | NOAK | [16] |
| Nuclear Reactor | LWR | 1000 | 5070 | USD/kWe | 2017 | France (low) | NOAK | [16] |
| Nuclear Reactor | LWR | 1000 | 8140 | USD/kWe | 2017 | UK (nominal) | NOAK | [16] |
| Nuclear Reactor | LWR | 1000 | 6070 | USD/kWe | 2017 | UK (low) | NOAK | M[16] |
| Large Passive Safety PWR | LWR | 4328 | USD/kWe | 2018 | FOAK (US) | FOAK | [67] | |
| Large Passive Safety PWR | LWR | 1700 | USD/kWe | 2018 | FOAK (China) (min) | FOAK | [67] | |
| Large Passive Safety PWR | LWR | 2200 | USD/kWe | 2018 | FOAK (China) (max) | FOAK | [67] | |
| Large Active Safety PWR | LWR | 5337 | USD/kWe | 2018 | First-4 unit average | NOAK | S[67] | |
| Advanced Nuclear Reactor | LWR | 3234 | USD/kWe | 2019 | Model assumptions and maximum allowable CapEx for flexbiel nuclear plant | NOAK | [15] | |
| European Fast Reactor | SFR | 1450 | 1900 | USD/kWe | 2013 | Nuclear technology overview | NOAK | [107] |
| EPR | LWR | 1590 | 1498 | USD/kWe | 2013 | Nuclear technology overview | NOAK | [107] |
| NuScale | LWR-SMR | 924 | 4844 | USD/kWe | 2022 | NOAK | [72] | |
| GT-MHR | HTR | 1048 | 4355 | USD/kWe | 2022 | NOAK | [72] | |
| IMSR | MSR | 1000 | 3985 | USD/kWe | 2022 | NOAK | [72] | |
| Gen III | LWR | 1420 | 4350 | USD/kWe | 2013 | CAPEX ref | FOAK | [109] |
| Gen III | LWR | 1420 | 3850 | USD/kWe | 2013 | CAPEX low | FOAK | [109] |
| Gen III | LWR | 1420 | 5800 | USD/kWe | 2013 | CAPEX high | FOAK | [109] |
| Gen III | LWR | 1450 | 3750 | USD/kWe | 2013 | CAPEX ref | NOAK | [109] |
| Gen III | LWR | 1450 | 3350 | USD/kWe | 2013 | CAPEX low | NOAK | [109] |
| Gen III | LWR | 1450 | 5000 | USD/kWe | 2013 | CAPEX high | NOAK | [109] |
| Small and Medium Sized light water reactor | LWR-SMR | 225 | 6300 | USD/kWe | 2013 | CAPEX ref | FOAK | [109] |
| Small and Medium Sized light water reactor | LWR-SMR | 225 | 3850 | USD/kWe | 2013 | CAPEX low | FOAK | [109] |
| Small and Medium Sized light water reactor | LWR-SMR | 225 | 7750 | USD/kWe | 2013 | CAPEX high | FOAK | [109] |
| Small and Medium Sized light water reactor | LWR-SMR | 225 | 5300 | USD/kWe | 2013 | CAPEX ref | NOAK | [109] |
| Small and Medium Sized light water reactor | LWR-SMR | 225 | 3350 | USD/kWe | 2013 | CAPEX low | NOAK | [109] |
| Small and Medium Sized light water reactor | LWR-SMR | 225 | 6500 | USD/kWe | 2013 | CAPEX high | NOAK | [109] |
| Sodium-cooled fast reactor | SFR | 1500 | 4900 | USD/kWe | 2013 | CAPEX ref | FOAK | [109] |
| Sodium-cooled fast reactor | SFR | 1500 | 3900 | USD/kWe | 2013 | CAPEX low | FOAK | [109] |
| Sodium-cooled fast reactor | SFR | 1500 | 6400 | USD/kWe | 2013 | CAPEX high | FOAK | [109] |
| Sodium-cooled fast reactor | SFR | 1500 | 4500 | USD/kWe | 2013 | CAPEX ref | NOAK | |
| Sodium-cooled fast reactor | SFR | 1500 | 3900 | USD/kWe | 2013 | CAPEX low | NOAK | [109] |
| Sodium-cooled fast reactor | SFR | 1500 | 5200 | USD/kWe | 2013 | CAPEX high | NOAK | [109] |
| Lead-cooled fast reactor | LFR | 600 | 4900 | USD/kWe | 2013 | CAPEX ref | FOAK | [109] |
| Sodium-cooled fast reactor | LFR | 600 | 4500 | USD/kWe | 2013 | CAPEX low | FOAK | [109] |
| Sodium-cooled fast reactor | LFR | 600 | 7100 | USD/kWe | 2013 | CAPEX high | FOAK | [109] |
| Sodium-cooled fast reactor | LFR | 600 | 4500 | USD/kWe | 2013 | CAPEX ref | NOAK | [109] |
| Sodium-cooled fast reactor | LFR | 600 | 3800 | USD/kWe | 2013 | CAPEX low | NOAK | [109] |
| Sodium-cooled fast reactor | LFR | 600 | 6500 | USD/kWe | 2013 | CAPEX high | NOAK | [109] |
| Molten Salt Reactor | MSR | 1000 | 653 | USD/kWe | 1978 | total capital cost | NOAK | [108] |
| Reactor | Reactor Type | Capacity in MWe | OM Cost (fix) | Unit | Year | Description | Readiness Level | Reference |
|---|---|---|---|---|---|---|---|---|
| HTGR | HTR | 600 | 99.63333333 | USD/kWe | 2012 | Annual O&M Costs | FOAK | [74] |
| HTGR | HTR | 350 | 161.8 | USD/kWe | 2012 | Annual O&M Costs | FOAK | [74] |
| HTGR | HTR | 80 | 39 | USD/kWe | 2020 | Lower Cost, High Learning (Best Case) // FOAK CAPEX | FOAK | [77] |
| Advanced reactor with thermal storage (ARTES) | LWR | 345 | 121 | USD/kWe | 2020 | Lower Cost, High Learning (Best Case) // FOAK CAPEX | FOAK | [77] |
| HTGR | HTR | 80 | 189 | USD/kWe | 2020 | Upper Cost, Low Learning (Worst Case) // FOAK CAPEX | FOAK | [77] |
| Advanced reactor with thermal storage (ARTES) | LWR | 345 | 40 | USD/kWe | 2020 | Upper Cost, Low Learning (Worst Case) // FOAK CAPEX | FOAK | [77] |
| Fast Reactors | SFR | n.a. | 78 | USD/kWe | 2017 | OCC | NOAK | [78] |
| Gas Turbines Modular Helium Reactor | HTR | 264 | 6.8 | USD/MW(th) | 2003 | Capital Cost (+8% interest) | NOAK | [66] |
| KLT-40s | LWR-SMR | 35 | 166 | USD/kWe | 2018 | FOAK | FOAK | [79] |
| EM2 | HTR | 116.6 | 94 | USD/kWe | 2019 | NOAK 4 units // Var cost divided over full lifetime | NOAK | [80] |
| HTR-PM | HTR | 210 | 164 | USD/kWe | 2018 | FOAK | FOAK | [79] |
| ARC-100 | SFR | 44 | 130.75 | USD/kWe | 2019 | Construction Cost | NOAK | [82] |
| GT-MHR | HTR | 285 | 154 | USD/kWe | 2000 | FOAK prototype | FOAK | [81] |
| GT-MHR | HTR | 285 | 89 | USD/kWe | 2000 | NOAK 4 units | NOAK | [81] |
| IMSR-300 | MSR | 62.04 | 180.512 | USD/kWe | 2015 | Overnight cost with first fuel load | NOAK | [85] |
| SSR-W | MSFR | 13.2 | 130.75 | USD/kWe | 2020 | Construction Cost | NOAK | [86] as cited by Steigerwald et al. [5] |
| e-Vinci | MSR | 1.54 | 130.75 | USD/kWe | 2020 | Construction Cost | NOAK | [87] as cited by Steigerwald et al. [5] |
| Brest-OD-300 | LFR | 132 | 130.75 | USD/kWe | 2021 | Construction Cost | NOAK | [88] |
| SMR | LWR-SMR | 600 | 95 | USD/kWe | 2019 | NOAK 12 units | NOAK | [152] |
| NGNP | HTR | 156 | 25.1730798 | USD/kWe | 2009 | FOAK | FOAK | [93] |
| NGNP | HTR | 267 | 16.0192326 | USD/kWe | 2009 | FOAK | FOAK | [93] |
| NGNP | HTR | 154 | 16.0192326 | USD/kWe | 2009 | NOAK 1 unit | NOAK | [93] |
| NGNP | HTR | 267 | 25.1730798 | USD/kWe | 2009 | NOAK 1 unit | NOAK | [93] |
| NGNP | HTR | 616 | 10.6346166 | USD/kWe | 2009 | NOAK 4 units | NOAK | [93] |
| NGNP | HTR | 1068 | 15.9070531 | USD/kWe | 2009 | NOAK 4 units | NOAK | [93] |
| ALWR | LWR | 1000 | 200 | USD/kWe | 2005 | FOAK | FOAK | [98] |
| ALWR | LWR | 1000 | 100 | USD/kWe | 2005 | NOAK | NOAK | [98] |
| FR | SFR | n.a. | 200 | USD/kWe | 2005 | FOAK | FOAK | [98] |
| FR | SFR | n.a. | 100 | USD/kWe | 2005 | NOAK | NOAK | [98] |
| DMSR | MSR | 1000 | 2.75 | USD/kWe | 1978 | NOAK | NOAK | [101] |
| HTGR | HTR | 100 | 552.28625 | USD/kWe | 2017 | FOAK | FOAK | [104] |
| HTGR | HTR | 100 | 432.6530713 | USD/kWe | 2017 | NOAK | NOAK | [104] |
| Advanced Nuclear Reactor | LWR | 1000 | 60 | USD/kWe | 2003 | No-Policy Nuclear LCOE Installations (Max OCC) | NOAK | [106] |
| Advanced Nuclear Reactor | LWR | n.a. | 31 | USD/kWe | 2019 | Model assumptions and maximum allowable CapEx for flexibel nuclear plant | NOAK | [15] |
| Molten Salt Reactor | MSR | 1000 | 2.4 | USD/kWh | 1978 | total capital cost | NOAK | [108] |
| Reactor | Reactor Type | Capacity in MWe | OM Cost (var) | Unit | Year | Description | Readiness Level | Reference |
|---|---|---|---|---|---|---|---|---|
| HTGR | HTR | 80 | 0.35 | USD/MWh | 2020 | Lower Cost, High Learning (Best Case) // FOAK CAPEX | FOAK | [77] |
| Advanced reactor with thermal storage (ARTES) | LWR | 345 | 2.43 | USD/MWh | 2020 | Lower Cost, High Learning (Best Case) // FOAK CAPEX | FOAK | [77] |
| HTGR | HTR | 80 | 0 | USD/MWh | 2020 | Upper Cost, Low Learning (Worst Case) // FOAK CAPEX | FOAK | [77] |
| Advanced reactor with thermal storage (ARTES) | LWR | 345 | 5 | USD/MWh | 2020 | Upper Cost, Low Learning (Worst Case) // FOAK CAPEX | FOAK | [77] |
| Fast Reactors | SFR | n.a. | 2.1 | USD/MWh | 2017 | OCC | NOAK | [78] |
| Gas-cooled reactors | HTR | n.a. | 0 | USD/MWh | 2017 | OCC | NOAK | [78] |
| EM2 | HTR | 116.6 | 1.429054625 | USD/MWh | 2019 | NOAK 4 units // Var cost divided over full lifetime | NOAK | [80] |
| PBMR-400 | HTR | 265 | 4 | USD/MWh | 2001 | NOAK plant cost | NOAK | [81] |
| HTGR | HTR | n.a. | 40-75% | n.a. | 2019 | Additional Fuel Cost for FCM compared to conventional fuel? | n.a. | [89] |
| SMART iPWR | LWR-SMR | n.a. | 25 | USD/MWh | 2014 | n.a. | FOAK | [151] as cited by Abou-Jaoude et al. [113] |
| SMR | LWR-SMR | 600 | 3 | USD/MWh | 2019 | NOAK 12 units | NOAK | [152] |
| SMR | LWR-SMR | 600 | 22 | USD/MWh | 2020 | FOAK 4 units | FOAK | [91] |
| SMR | LWR-SMR | 600 | 15 | USD/MWh | 2020 | NOAK 4 units | NOAK | [91] |
| HTGR | HTR | n.a. | 30 | USD/MWh | 2015 | NOAK | [151] as cited by Abou-Jaoude et al. [113] | |
| NGNP | HTR | 156 | 24.455131 | USD/MWh | 2009 | FOAK | FOAK | [93] |
| NGNP | HTR | 267 | 24.455131 | USD/MWh | 2009 | FOAK | FOAK | [93] |
| NGNP | HTR | 154 | 14.2916683 | USD/MWh | 2009 | NOAK 1 unit | NOAK | [93] |
| NGNP | HTR | 267 | 14.2916683 | USD/MWh | 2009 | NOAK 1 unit | NOAK | [93] |
| NGNP | HTR | 616 | 14.2916683 | USD/MWh | 2009 | NOAK 4 units | NOAK | [93] |
| NGNP | HTR | 1068 | 14.2916683 | USD/MWh | 2009 | NOAK 4 units | NOAK | [93] |
| MHTGR-SC | HTR | 693 | 8 | USD/MWh | 1992 | NOAK 4 units | NOAK | [95] |
| MHTGR-GT/IC | HTR | 806 | 6 | USD/MWh | 1992 | NOAK 4 units | NOAK | [95] |
| MHTGR-GT/DC | HTR | 869 | 5 | USD/MWh | 1992 | NOAK 4 units | NOAK | [95] |
| DMSR | MSR | 1000 | 5.37 | USD/MWh | 1978 | NOAK | NOAK | [101] |
| AHTR | HTR | 1530 | 26.85 | USD/MWh | 2011 | NOAK | NOAK | [102] |
| MSR | MSR | 190-1000 | 19 | USD/MWh | 2017 | NOAK | NOAK | [96] as cited by Abou-Jaoude et al. [113] |
| HTGR | HTR | 100 | 16.675 | USD/MWh | 2017 | FOAK | FOAK | [104] |
| HTGR | HTR | 100 | 16.675 | USD/MWh | 2017 | NOAK | NOAK | [104] |
| Advanced Nuclear Reactor | LWR | 1000 | 2.1 | USD/MWh | 2003 | No-Policy Nuclear LCOE Installations (Max OCC) | NOAK | [106] |
| Advanced Nuclear Reactor | LWR | n.a. | 4.44 | USD/MWh | 2019 | Model assumptions and maximum allowable CapEx for flexbiel nuclear plant | NOAK | [15] |
| Molten Salt Reactor | MSR | 1000 | 4.6 | USD/MWh | 1978 | total capital cost | NOAK | [108] |
Appendix D Energy vectors and technologies in the system model
The section gives a more detailed overview of the technology options and final demand categories considered in the model. Since the described features of the model are not novel or specific to this publication, the description is very similar to that of Göke et al. [8]. Overall, the model covers 22 energy carriers and 125 technologies, excluding the nuclear technologies we explicitly added for this paper. To illustrate the resulting complexity, Fig 10 Fig 10. In this graph, the entering edges of technologies refer to input carriers, and the outgoing edges refer to outputs.
For primary supply, the model considers the following renewable technologies. Electricity generation from PV differentiates photovoltaic in open spaces, on roofs of residential buildings, and on roofs of industrial buildings; electricity generation from wind differentiates on- and offshore. All wind and PV technologies fluctuate, and their supply is contingent on an exogenous time-series of capacity factors. For hydro supply, the model considers run-of-river and reservoirs. Run-of-river fluctuates, like wind and PV. Reservoirs have exogenous and fluctuating inflows, but supply is dispatchable as long as the water in the reservoir is sufficient. For biomass, the most versatile energy source, the model distinguishes raw biogas, solid biomass, and non-solid biomass. Boilers or CHP plants can directly burn biomass to generate electricity, district heat, space heat, or process heat up to 500°C. Alternatively, various routes are available to convert biomass into synthetic fuels, like the gasification of solid biomass or upgrading raw biogas to synthetic methane and the liquefaction of solid and non-solid biomass to synthetic methanol. We use data from Auer et al. [154] for the technical potential of wind and PV. To put these numbers into context, we compare them against the results of a meta-analysis on renewable potential in Europe in Tab. 11 and Germany in Tab. 12 [155, 156]. The material demonstrates that the assumed potential aligns with the meta-analyses’ results. For Germany, capacities are close to the reference, assuming current legislation except for PV; here, we are more conservative. On a European level, our assumptions are close to or lower than the median of literature values.
| Own assumptions | Literature values in | |||
| based on | Dupré La Tour [156] | |||
| Auer et al. [154] | First quartile | Median | Third quartile | |
| Wind, onshore | 4,508 | 1,518 | 3,421 | 7,489 |
| Wind, offshore | 1,678 | 1,628 | 4,844 | 8,704 |
| PV, openspace | 2,793 | 1,252 | 4,235 | 8,625 |
| PV, rooftop | 1,558 | 610 | 952 | 1,665 |
| Own assumption | Results for | Literature values | ||
| based on | current legislation | in Risch et al. [155] | ||
| Auer et al. [154] | in Risch et al. [155] | Lowest | Highest | |
| Wind, onshore | 386 | 385 | 68 | 1,188 |
| Wind, offshore | 84 | 79 | 34 | 99.6 |
| PV, openspace | 301 | 456 | 90 | 1,285 |
| PV, rooftop | 177 | 492 | 43 | 746 |
In the case of hydropower, we assume today’s capacities are available without any investment due to their long technical lifetime but prohibit any expansion, assuming the available potential is fully utilized. The use of biomass in each country is subject to an upper energy limit of 1,081 TWh for the entire model, including waste for the production of biomass [157].
Besides the generation of primary supply, the model includes several technologies that provide secondary energy, which is the intermediate step from primary supply to final demand. Heat-pumps and electric boilers convert electricity into district heat; equally, each synthetic fuel, hydrogen, methane, or methanol, can fuel a different boiler technology to provide district heat. Alkali, solid-oxide, or proton exchange membrane electrolyzers utilize electricity to generate hydrogen while feeding waste heat into district heating networks. In addition to domestic production, the model can import hydrogen by ship at costs of 131.8 US-$ per MWh and by pipeline from Morocco or Egypt at 90.7 and 86.8 US-$ per MWh, respectively [158]. Vice versa, synthetic fuels can fuel different engines or turbines to generate electricity and district heat. In addition, there are several conversion pathways among the synthetic fuels: methane pyrolysis creates hydrogen from methane, methanation synthesizes methane from hydrogen (and raw biogas), and hydrogen-to-methanol conversion is possible but requires a carbon input supplied by direct air capture.
Furthermore, the model can invest in storage systems for secondary energy carriers, as indicated by the arrows starting and ending at the same carrier. Electricity storage encompasses lithium-ion batteries, redox flow batteries, and pumped hydro storage. Short-term storage of district heat requires investment in water tanks and long-term storage in pit thermal storage. Caverns can store hydrogen and synthetic gas but depend on geological conditions, so the technical potential in each region is limited. For gas, the potential corresponds to today’s gas storages; the potential for hydrogen caverns builds on Caglayan et al. [159]. In addition, investment into tanks for hydrogen storage is possible without any restrictions on potential. Still, investment costs per energy are substantially higher.
The right column of Fig. 4 lists the final energy demands the model considers. Section LABEL:demFlex details how the model represents the flexibility of final demand. The final electricity demand corresponds to residential, service, and industry appliances. Next, there is a final demand for space and process heating. The model further splits process heat into three temperature levels: low temperature up to 100°C, medium temperature from 100°C to 500°C, and high temperature above 500°C. To cover the demand for space heat, the model can invest in solar thermal heating, boilers and heat-pumps fuelled by electricity, the connection to a district heating network, and boilers fuelled by biomass or synthetic fuels. The same options are available for low temperature heat, except for solar thermal heating; medium and high temperatures preclude heat-pumps and district heating. Even if a technology can provide a particular heat type, its capacity can still be constrained. The potential for district heating and ground-source heat-pumps in space heating reflects settlement structures. District heating can only supply heat in cities, towns, and suburbs; ground-source heat-pumps in rural areas and half the demand in towns and suburbs. In process heating, today’s shares of district heating and electric boilers are an upper limit since it is indeterminate whether their temperature level is sufficient to supply a larger share of demand. Technologies for space heat and low-temperature heat utilize heat storage, as section LABEL:demFlex elaborates.
Finally, the model encompasses the demand for transport services. Passenger transport includes private road, public road, and public rail transport; freight includes heavy road, light road, and rail transport. Vehicle options for road transport include BEVs, fuel cells, and internal combustion engines using synthetic fuels. In addition, compressed natural gas vehicles are available for private passenger road transport and electric overhead lines for heavy freight transport. Rail transport can run on electricity, diesel, or fuel cell engines. Finally, there is a fixed demand for methanol for aviation and navigation.
Appendix E Spatial resolution and infrastructure in the system model
This appendix provides the exact spatial resolutions and detailed modeling assumptions for exchange infrastructure. Since the described features of the model are not novel or specific to this publication, the description is very similar to the one in Göke et al. [8].
The spatial resolution for electricity corresponds to the electricity market zones as shown in Fig. 11. The exchange of electricity between zones requires HVAC (high-voltage alternating current) or HVDC (high-voltage direct current) lines, as indicated by the arrows in the figure. Whether HVAC or HVDC transmission connects two zones depends on the information provided by the European grid operator, but generally, HVDC is limited to long distances over sea ENTSO-E [160]. The model can invest in new transmission lines; today’s lines are available without investment, only incurring maintenance costs to reflect their long technical lifetime. The costs of new lines also include maintenance costs. The numbers in Fig. 11 specify today’s capacities. The dotted arrows represent potential connections without any pre-existing capacity.
Electricity exchange within a market zone is unrestricted. This "copper plate" assumption neglects interzonal congestion but it allows building on specific ENTSO-E data listing potential expansion projects in the European electricity grid ENTSO-E [160]. From this data, we obtain a potential-cost curve for each connection with increasing investment costs and an upper limit on expansion. For example, Fig. 12 shows this curve for the connection between Germany and the Netherlands. In this case, the specific investment costs rise from 200 to 3,700 million € per GW, and the total expansion limit is 7.5 GW. A more detailed spatial resolution cannot utilize this data and has to rely on potential and cost data that is not connection-specific and subject to substantial uncertainty; for instance, literature values for expansion costs vary by a factor of 5 for underground cables [161, 162].
We use a transport instead of flow formulation to model the grid operation since previous research found this simplification to be sufficiently accurate [163, cited by 115]. In line with the same source, transmission losses amount to 5% and 3% per 1,000 km for HVAC and HVDC grids, respectively. The distance used is the distance between the geographic centers of each zone.
For hydrogen exchange between clusters, the model can invest in pipelines indicated by the dotted lines in Fig. 13. These pipelines are subject to costs of 0.4 million EUR per GW and km and energy losses of 2.44% per 1,000 km [164]. The distance between the geographic center of clusters serves as an estimate for pipeline length. The exchange of methanol and biomass between countries is possible but does not require grid infrastructure. Instead, it uses trucks and only incurs variable costs based on Commission of the European Union. Joint Research Centre. Institute for Energy and Transport. [157].