ECGtizer: a fully automated digitizing and signal recovery pipeline for electrocardiograms
Abstract
Electrocardiograms (ECGs) are essential for diagnosing cardiac pathologies, yet traditional paper-based ECG storage poses significant challenges for automated analysis. This study introduces ECGtizer, an open-source, fully automated tool designed to digitize paper ECGs and recover signals lost during storage, facilitating automated analyses with modern AI methods. ECGtizer employs automated lead detection, three pixel-based signal extraction algorithms, and a deep learning-based signal reconstruction module. We evaluated ECGtizer on two datasets: a real-life cohort from the COVID-19 pandemic (JOCOVID) and a publicly available dataset (PTB-XL). Performance was compared with two existing methods: the fully automated ECGminer and the semi-automated PaperECG, which requires human intervention. ECGtizer’s digitization performance was assessed in terms of signal recovery and the fidelity of clinically relevant feature measurement. Additionally, we tested these tools on a third dataset (GENEREPOL) for downstream AI tasks. Results show that ECGtizer outperforms existing tools, with its ECGtizer algorithm delivering superior signal recovery performance. While PaperECG demonstrated better outcomes than ECGminer, it also required human input. ECGtizer enhances the usability of historical ECG data and supports advanced AI-based diagnostic methods, making it a valuable addition to the field of AI in ECG analysis.
keywords:
electrocardiograms, digitization, signal recovery, fully automated, torsades-de-pointes, artificial intelligenceIntroduced ECGtizer, a fully automated tool to digitize paper ECGs.
ECGtizer outperforms current methods in signal recovery.
Tested on real-world and public datasets.
Supports advanced AI diagnostic methods.
Opens new research avenues by allowing the use of ECG historical data.
1 Introduction
An electrocardiogram (ECG) is a diagnostic tool that captures the heart’s electrical activity by placing electrodes on the patient’s body [5]. The resulting ECG waveform contains vital information, with minor variations potentially indicating a range of diseases. Historically, ECGs have been printed and stored on paper or saved as images, with typically only one quarter of the original signal preserved to save space and enhance readability. This approach presents clear long-term challenges for accessing and analyzing ECG data, not only in terms of accessibility, which demands significant human resources, but also its unsuitability for automated analysis, especially with novel AI-based methods.
In addition to providing ECG images in PDF files, ECG system manufacturers may also offer raw data, often encoded in proprietary formats. However, these raw files are generally lost due to the difficulty of long-term reliable storage in patients’ medical records [26]. Many countries, particularly in developing regions, still rely on paper-based ECGs [1, 30]. Numerous healthcare centers worldwide have amassed valuable cohorts of well-characterized patients with rare diseases, with ECGs recorded on paper over decades. However, accessing and analyzing these ECGs with specialized software remains challenging, which poses a significant barrier to clinical research and diagnosis advancement.
Over the years, several tools have been developed to convert ECG scans or PDF versions into numerical waveform signals [13]. Despite these advancements, most tools are not easily accessible [2, 22, 3] and require human intervention, making large-scale digitization of ECG data challenging. Some newer tools have enhanced automatic ECG digitization capabilities [26, 10], but they can only digitize the portion of the signal preserved in the ECG image and cannot recover the missing three-quarters of the signal lost during printing or PDF conversion.
Digitization serves two primary objectives. Firstly, it offers an alternative method for storing ECG records, mitigating issues like paper degradation and ink evaporation, while significantly reducing storage space [19, 4]. Secondly, it enables automatic signal analysis using AI-based systems, which are revolutionizing ECG interpretation [29, 34]. Training deep learning models on digital ECG data in numerical format proves more effective than using images, as it preserves the temporal sequence of the signal and simplifies preprocessing tasks such as normalization and pseudonymization, thereby enhancing model performance [17].
Research on ECG digitization has been ongoing since the 1990s, with a notable surge in interest since the mid-2000s [33, 13]. This article focuses on the digitization of an ECG as the extraction of an equivalent numerical vector representation from an analog-recorded ECG signal image.
Here, we propose ECGtizer, a fully automated open-source software that not only digitizes ECG images with high accuracy but also recovers the missing signal discarded during the printing process. ECGtizer uses automatic lead detection through pixel variance estimation before extracting the signal pixel by pixel, adjusting it for both temporal and spatial scales (amplitude). The raw digitized signal is then input into the ECGrecover module. Based on a deep learning UNet architecture [14], ECGrecover uses the signal of other leads to regenerate the missing portions of the signal. The final output is a data frame containing the complete signal, which can be stored as a standalone XML file, and includes automated anonymization features to facilitate data sharing.
Specifically, our contributions are threefold:
-
1.
An open-source and fully automated software called ECGtizer is provided 111Code available at: https://github.com/UMMISCO/ecgtizer.git.
-
2.
Three distinct lead-extraction algorithms — Full, Fragmented, and Lazy — were proposed and thoroughly evaluated in ECGtizer. Performance compared with two state-of-the-art methods, ECGminer [26] and PaperECG [6] are given, focusing on their impact on downstream AI tasks like TdP-risk prediction. ECGtizer outperformed these methods.
-
3.
TheECGrecover [14] module has been integrated into ECGtizer for reconstructing complete ECG signals from incomplete parts, enhancing the accuracy and utility of downstream AI-based diagnostic tools.
The article is organized as follows. In Section 2, we review related works. In Section 3, we detail the ECGtizer approach, specifying the input and output at each stage and providing the pseudo-code for the lead-extraction algorithms. The performance of the digitization tools, both before and after the lead-completion process, is evaluated in Section 4. The impact of digitization on downstream AI tasks, such as TdP-risk prediction, is analyzed in Section 4.2. Finally, we present the conclusion of the paper in Section 5.
2 Related Works
2.1 Digitization Tools
ECG digitization has emerged as a widely explored area of research. A recent review from 2023 [13] identified and analyzed 63 pertinent articles, categorizing digitization tools into manual and fully automated types. Manual tools, such as those described in [2, 6, 23], require user interaction for tasks like lead delineation and threshold setting. Semi-automatic methods, exemplified by [16] and [3], also involve user intervention, typically for corrections during signal extraction.
Fully automated tools, on the other hand, allow users to input scanned ECGs and automatically complete the digitization process, as seen with ECGminer [26] and our proposed software, ECGtizer. Among the manual tools, we highlight PaperECG by Fortune et al. [6], which requires initial manual adjustments, such as image tilting and lead positioning, before proceeding to digitally extract each lead. In contrast, our ECGtizer provides a fully automated solution for digitizing paper-based ECGs, simplifying the process and reducing the potential for human error.
2.2 Digitization Process
Overall, the digitization process typically involves three stages: (i) lead detection, (ii) image thresholding, and (iii) lead extraction.
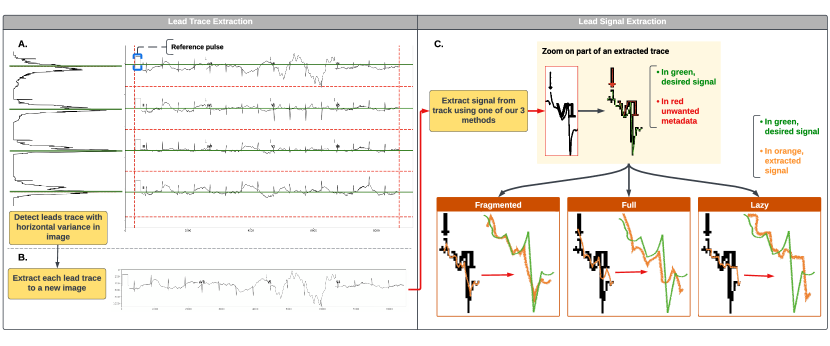
Lead detection. An ECG is a stereotyped image; for the same format, the position of the leads is generally consistent. Lead detection involves segmenting the ECG image to localize each trace produced by the ECG leads. The leads typically appear as black traces on a colored or black-and-white grid. Their detection may require human intervention [12, 17, 22]. Baydoun et al. [3] proposed an automatic lead detection approach that analyzes the variance in the image to distinguish between areas of significant variation and those with minimal variation (see Section 3.1.3). In the vicinity of the lead line, pixels show significant peaks and variations that help pinpoint the positions of the ECG leads ( Fig. 1).
Image thresholding. In most paper ECGs, the signal is traced in black on a red grid and white background. Removing the grid is crucial as it interferes with the signal extraction process. Image thresholding involves selecting an optimal threshold value that separates pixel intensities. Pixels above this threshold are classified as foreground (active), while those below are classified as background (inactive). This method effectively helps distinguish areas of interest from the rest of the image. Two thresholding approaches are commonly recommended: the Otsu method [18] for sharp, high-quality images, and the Sauvola method [27] for noisier images. More recent approaches include deep learning techniques [15].
Lead extraction. This stage involves associating each pixel in the signal with an amplitude value and a corresponding time position. Methods for extracting leads include active contour approaches [2], which dynamically adjust contours around lead traces, and waveform path methods, which isolate and traverse each lead to extract individual pixels [34, 26].
Current literature on the digitization of paper ECGs highlights three main limitations: (i) automation of the process, (ii) access to the software’s code, and (iii) the lack of benchmark datasets in original studies. To address these issues, we have identified two approaches that provide code access for direct comparison: ECGminer [26], a fully automated digitizing method, and PaperECG [6], which offers an API for digitizing ECGs but requires manual lead selection.
3 Methods
We propose ECGtizer, a fully automated software for ECG digitization. To address the critical problem of partial signal representation in ECGs, ECGtizer includes a module named ECGrecover [14], which utilizes a deep learning model based on the U-Net architecture to reconstruct the missing portions of the signal from existing segments of the 12 leads across a 10-second recording.
3.1 The ECGtizer Pipeline
Below, we outline the ECGtizer pipeline, which consists of five main steps: (i) conversion of the PDF to an image, (ii) removal of textual elements, (iii) identification of the traces, (iv) extraction of the signal, and (v) completion of the signal.
3.1.1 PDF to RGB-Matrix Conversion
The first step involves converting the .pdf file into an RGB matrix. This conversion is crucial, as it influences the quality of the subsequent digitization steps. We recommend a resolution of 300 dots per inch (DPI), which offers a balance between file size and detail preservation, crucial for maintaining the integrity of the ECG signals. However, ECGtizer provides flexibility, allowing users to select their preferred resolution based on the specific requirements of their ECG data. This adaptability ensures that ECGtizer can handle both vector-based images, typically generated during ECG acquisition, and scanned images, where resolution settings can significantly impact the quality of the digitized output.
Input: Paper-based ECG in .pdf, .jpeg or .png format.
Output: A tensor containing the image encoded in RGB (red, green, blue), as three matrixes of size nm (the dimensions of the image in pixels).
3.1.2 Text Removal
Paper-based ECGs often contain metadata, including printed text, which provides automatic annotations of the ECG visit, and sometimes even manual manuscript annotations along with patient information. The challenge is to detect and remove this text from the image while preserving the electrocardiographic signal intact. For this purpose, ECGtizer employs the Pytesseract library, an optical character recognition (OCR) tool222https://github.com/madmaze/pytesseract. This OCR capability is critical for distinguishing and eliminating text without degrading the underlying ECG signal. If text removal is unsuccessful, it typically indicates that the text is superimposed directly on the signal, posing significant challenges for signal extraction without quality degradation.
Input: Paper-based ECG converted into a RGB matrix.
Output: The RGB matrix, with the text pixels replaced by the average value of the surrounding pixels. The textual metadata is stored in a separate vector.
3.1.3 Trace Detection
After text removal, the next step is to isolate the signal trace. This process begins with the image undergoing a thresholding process, which converts it into a black-and-white image using Otsu’s binarization method [18]. This technique automatically calculates an optimal threshold to distinguish the foreground (signal) from the background (non-signal areas), based on pixel brightness variance across the image.
Specifically, pixel brightness variance is quantified horizontally across rows to identify the positions of ECG lines, and vertically across columns to define the start and end points of each trace. These peaks in variance facilitate the precise and automated separation of individual traces, thereby defining their boundaries accurately. This method ensures that each trace of the ECG is clearly isolated for further processing.
Input: Paper-based ECG converted into an RGB matrix with the text pixels replaced by the average value of the surrounding pixels.
Output: Binary matrix with 0 (black) representing the trace of the signal and (1) the background. Each trace can contain one or more leads (see Fig. 1).
3.1.4 Trace Extraction
As illustrated in Fig. 1 A, the trace extraction phase involves segmenting the binarized matrix into distinct traces, where each trace contains one or more leads. The goal is to identify pixel coordinates that represent the leads and convert these into amplitude values at each time step. This process involves scanning the matrix from left to right using three distinct techniques, some of which is detailed below.
Fragmented Extraction. The Fragmented Extraction technique, outlined in Algorithm 1, refines the extraction process by specifically targeting the lowest-lit pixels in each column. In the context of ECG digitization, ’lit pixels’ refer to those with a zero value, which indicates the presence of the ECG signal. It is designed to consider only the darkest group of pixels when gaps appear between clusters of lit pixels. This approach is particularly effective at ignoring extraneous markings, such as lead annotations, although it typically requires a longer processing time compared to other extraction methods. This method ensures that the data extracted from the ECG is as accurate and clean as possible, enhancing the quality of the digitization process.
Full Extraction. This technique involves calculating the average position of lit pixels in each column of the matrix. This method is efficient and generally preserves the signal amplitude well. However, it can occasionally be susceptible to inaccuracies caused by artifacts, such as text annotations (e.g., lead names) superimposed on the signal. These artifacts may skew the average position calculation, potentially affecting the fidelity of the extracted signal. Despite this, the Full Extraction method is favored for its speed and overall accuracy in environments where such artifacts are minimal or can be effectively managed. The pseudocode for this method is detailed in Algorithm 2.
Lazy Extraction. Lazy Extraction begins by establishing an ’anchor point’ — defined as the average position of active pixels in the first column of the matrix. This anchor point serves as a reference for scanning the matrix from left to right. The method primarily checks for lit pixels at the anchor point’s position in each subsequent column. If no lit pixels are found directly at the anchor point, the search expands above and below this point to locate the nearest active pixels. The pseudocode for this method is detailed in Algorithm 3.
This approach is notably fast and efficiently minimizes interference from artifacts such as superimposed text. However, its reliance on a fixed anchor point can occasionally lead to reduced signal fidelity, particularly when the ECG trace significantly deviates from the initial anchor position. This reduction in fidelity may impact the accuracy of the extracted signal, making it less suitable for applications requiring high precision in signal interpretation, such as detailed diagnostic analyses. Despite this, Lazy Extraction is advantageous in scenarios where speed is critical and minor inaccuracies are acceptable.
Noteworthy, each trace includes a reference pulse, typically found at the beginning of the signal (see Fig. 1). This reference pulse, typically measuring 1 mV, serves as an amplitude scale to calibrate the rest of the signal. It is extracted simultaneously with the corresponding lead, ensuring that all amplitude measurements are accurately scaled.
Lead Separation. After identifying the lit pixels, lead separation is achieved based on key assumptions: (1) The first element in the vector containing the lit pixel coordinates marks the start of the reference pulse, while the last element indicates the end of the final lead. (2) The ECG to be digitized typically adheres to one of two common standard formats: either a reference pulse followed by four leads in a 3x4 configuration, each lasting 2.5 seconds, or a reference pulse followed by two leads in a 2x6 configuration, each lasting 5 seconds. These formats are prevalent in clinical settings, making them the primary focus of our digitization efforts. While there are many other ECG formats, specific to particular recording devices, these will not be covered in this document due to their specialized nature and lesser prevalence.
This methodological framework allows ECGtizer to effectively standardize and automate the digitization process, ensuring reliable and consistent extraction of ECG data across the most commonly encountered formats.
The lead-separation procedure involves the following steps:
-
1.
Given the vector , we up-sample or down-sample it to 5,140 points333Using linear interpolation (numpy.interp).. This size is based on the assumption of 10-second recordings at a 500 Hz sampling rate, resulting in 5,000 points, with an additional 140 points specifically allocated for the reference pulse. This resized vector is referred to as .
-
2.
Based on the assumptions above, the signal is segmented by slicing off the first 140 points to isolate the reference pulse ().
-
3.
The leads are then isolated by slicing every 1,250 points (for the 2.5-second format) or every 2,500 points (for the 5-second format). The vector representing a generic lead will be denoted as .
-
4.
Once the leads and reference pulse have been isolated, the next step involves scaling the extracted leads in terms of amplitude. The reference pulse, serving as a calibration baseline, has its first pixels set to an amplitude of 0 mV, and its highest pixels to an amplitude of 1 mV. The final amplitude for each pixel in the lead is calculated using the equation:
(1) where ranges from 0 to 1,250 or 2,500, depending on the ECG format.
Input: A binarized matrix where 0 (black) represents the trace of the ECG signal, and 1 (white) denotes the background. This matrix is derived from an initial processing step where the original grayscale or color image is converted into a binary format to simplify trace detection. Each trace within the matrix may contain one or more ECG leads. Output: After processing the digitized ECG image, each lead is represented as a one-dimensional vector. Each element in this vector corresponds to a specific point in time, with its value indicating the amplitude of the signal at that time step. The amplitude values are normalized based on reference points determined during the signal extraction process, typically ranging from 0 (minimum amplitude) to 1 (maximum amplitude), reflecting the relative intensity of the signal.
3.1.5 Signal Completion
In digitized ECGs, each lead is typically displayed over a specific time window. For example, in the Standard 34 format, leads I, II, and III are shown for the first 2.5 seconds, followed by leads aVR, aVL, and aVF for the next 2.5 seconds, and so forth. Various methods have been developed to impute the missing portions of these leads [28, 11]. Among these, ECGrecover [14] is notable for its approach to reconstructing the missing sections of each lead by leveraging information from the available leads within the same time window. ECGrecover utilizes a U-Net architecture, a type of deep learning model that is particularly effective in handling data with significant spatial and temporal dependencies. The model is trained to reconstruct missing ECG segments by minimizing a cost function designed to maintain the integrity and continuity of both the spatial alignment and temporal sequence of the lead data.
As the final step in the digitization process ECGrecover allows users to generate a comprehensive 10-second recording that integrates all 12 leads. This synthesis not only fills in any missing data but also aligns and calibrates the leads to ensure the recording reflects a continuous and accurate representation of the cardiac activity.
Optional Input: Leads I, II, III, aVR, aVL, and aVF, each represented as a one-dimensional vector covering a 2.5-second timeframe. Each entry in the vector corresponds to a specific time point, with its value indicating the signal’s amplitude at that moment. Output: The completed representation includes all 12 leads over a 10-second period, totaling 60,000 data points (12 leads x 5,000 points per lead). Each entry in this extended vector corresponds to a specific time point, with its value indicating the signal’s amplitude. This comprehensive dataset enhances diagnostic capabilities by providing a full cardiac cycle representation for detailed analysis.
3.2 Datasets
In this work, we utilized three datasets: two for evaluating the digitizing methods (JOCOVID and PTB-XL) and one for downstream classification tasks (GENEREPOL).
JOCOVID. This dataset was acquired at the Pitié-Salpétrière hospital across various departments, including Cardiology, Internal Medicine, and Clinical Pharmacology during the COVID-19 pandemic [25]. The JOCOVID study (NCT04320017) is a retrospective observational study aimed at characterizing cardiac arrhythmias in COVID-19 hospitalized patients, conducted between March and May 2020. It consists of 807 10-second ECG recordings from 160 patients, available in both .xml and .pdf formats. The recordings, captured with an ELI 280 (Mortara device) at a sampling rate of 1,000 Hz with a 150 Hz filter under resting conditions, are displayed in a 34 format with detailed segmentation of each lead. The cohort featured a male-to-female ratio of 1.6, a median age of 72 years [IQR=22], and a median follow-up duration of 12 days [IQR=7].
PTB-XL. The PTB-XL dataset [32] is a publicly available collection of clinical ECGs recorded between 1989 and 1996, comprising 21,799 recordings from 18,869 patients. These 12-lead ECGs are each 10 seconds long, recorded at sampling frequencies of either 500 Hz or 300 Hz, and encompass a wide age range from 0 to 95 years, with a median of 62 years [IQR=22]. Approximately 44% of the recordings are annotated as normal, while the remaining 56% represent various pathologies, all annotated by specialist doctors. This dataset is widely used as a benchmark in ECG analysis research.
GENEREPOL. Extracted from the Generepol study [24], this dataset includes 15,119 10-second ECGs from 990 healthy volunteers, recorded at 500Hz with eight leads. Leads III, aVF, aVL, and aVR were computed from leads I, II, and V1-V6, following standard practices. The volunteers were part of a study conducted from 2008 to 2012 at the Clinical Investigation Center of Pitié-Salpétrière Hospital, where ECGs were recorded before and at several time points after administering 80mg of oral Sotalol. The recordings were curated by two expert cardiologists to ensure high data quality.
3.3 Evaluation Metrics
We assessed the performance of different methods in digitizing ECG signals by comparing the extracted numerical signals with the original signals stored in .xml files. For this evaluation, we utilized three main metrics: the Pearson Correlation Coefficient (PCC), the Root Mean Square Error (RMSE), and Soft-Distance Time Warping (SDTW). The PCC assesses the linear correlation between two signals, indicating their similarity in temporal dynamics. The RMSE measures the magnitude of differences between two signals, with smaller values indicating a closer match between the predicted and actual values. SDTW evaluates the alignment of two signals over time, accounting for potential time shifts. Additionally, we analyzed the accuracy of identifying specific ECG features (P, Q, R, S, T waves) using the NeuroKit Python library444https://neuropsychology.github.io/NeuroKit/, which provides tools for clinically relevant feature detection in ECG signals. This comparison focused on the concordance of feature positioning between the extracted and original .xml signals as well as the derrived calculated time distances.
3.4 State-of-the-art (SOTA) Comparison
We compared the performance of two digitization tools, ECGminer555https://github.com/adofersan/ecg-miner [26], a fully automated Python-based tool that optimizes pixel connectivity across regions of interest using a cost function, and PaperECG666https://github.com/Tereshchenkolab/paper-ecg/tree/master[6], which requires manual lead identification and uses Viterbi’s dynamic programming algorithm for signal extraction[31]. Both tools were evaluated on the entire JOCOVID dataset of 807 ECGs. Additionally, we replicated the same evaluation on the PTB-XL dataset, but without including PaperECG as it required extensive human intervention. These results are presented in the supplementary materials (Appendix A).
3.5 Statistical Analyses
Statistical analyses were conducted in R using linear mixed models, implemented through the lme4 and lmerTest packages. The models included ‘patient id‘ and ‘lead‘ as random variables to account for intra-subject variability and differences among ECG leads, respectively. Figures and graphical representations of the data were generated using ggplot2 package and the whole tidyverse suite, ensuring high-quality visualizations of our results.
4 Results
In this section, we present the results of evaluating ECGtizer for the digitization of ECG signals, with and without the optional lead-completion phase, as discussed in Sections 4.1.1 and 4.1.2 and detailed in Section 4.1.3.
4.1 Digitization Performance
| Fully Automatic | Extracted ECG | Time/ECG (seconds) | Time Total (hours) | |
|---|---|---|---|---|
| ECGtizer | Yes | 807 | 9 | 2 |
| ECGtizer | Yes | 807 | 10 | 2.24 |
| ECGtizer | Yes | 807 | 9 | 2 |
| ECGminer | Yes | 807 | 17 | 3.8 |
| PaperECG | No | 807 | 137 | 30.7 |
We compare the performance of ECGtizer, using three distinct methodologies, to ECGminer and PaperECG across different evaluation metrics. These methodologies, referred to as ECGtizer, ECGtizer, and ECGtizer (described in Section 3.1.4), each employ a unique approach to signal extraction.
4.1.1 Signal Fidelity
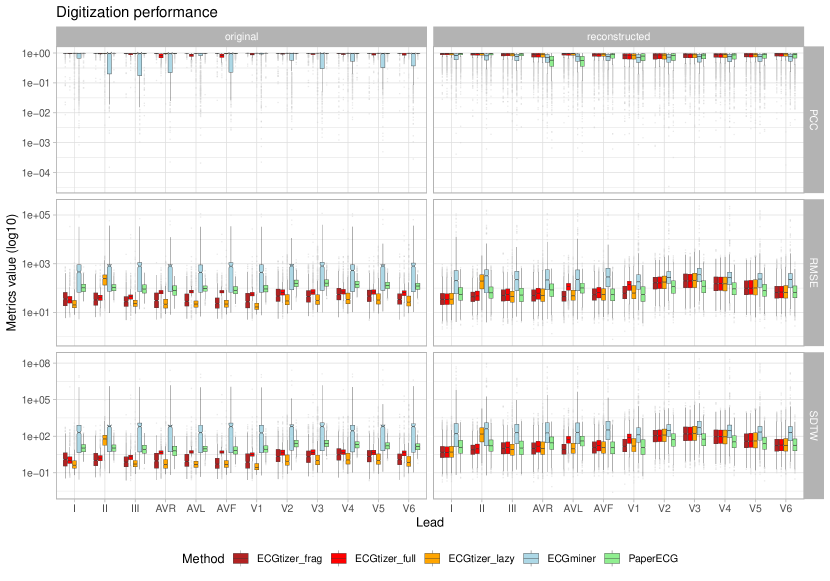
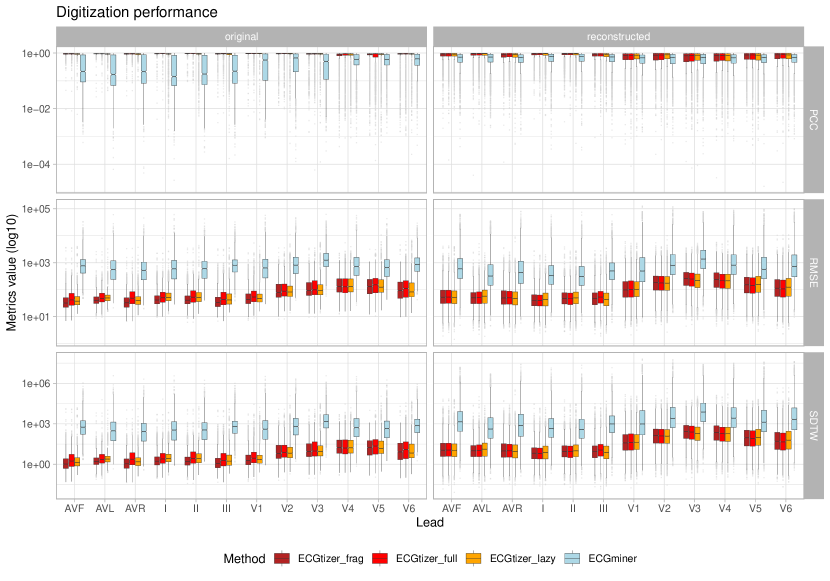
The results, summarized in Fig. 2, indicate that all three ECGtizer methods outperform ECGminer in terms of signal fidelity across all metrics. Specifically, PaperECG shows lower variability and comparable performance to the best ECGtizer methods.
In terms of the Pearson Correlation Coefficient (PCC), ECGtizer achieves an average correlation of 0.954, significantly higher than ECGminer’s 0.672 (p¡2e-16), but comparable to PaperECG’s 0.952 (p=0.51, not significant). ECGtizer and ECGtizer also perform well with correlations of 0.885 and 0.933, respectively.
For Root Mean Square Error (RMSE), which ideally should be as close to 0 as possible, ECGtizer methods demonstrate significantly lower values than ECGminer (902.4) and PaperECG (158.96, p¡0.032). Specifically, RMSE values are 88.21 for ECGtizer, 120.57 for ECGtizer, and 132.52 for ECGtizer.
Finally, Soft-Distance Time Warping (SDTW) scores, where lower values indicate better temporal alignment, further confirm the superiority of the ECGtizer methods. ECGtizer, ECGtizer, and ECGtizer record scores of 916.8, 1388.5, and 1059.8, respectively, significantly outperforming ECGminer’s 26432.5 (p¡8.54e-09) and are similar to PaperECG’s 1443.1.
These results underscore the effectiveness of ECGtizer in accurately digitizing ECG signals while maintaining high fidelity in signal reproduction compared to existing tools.
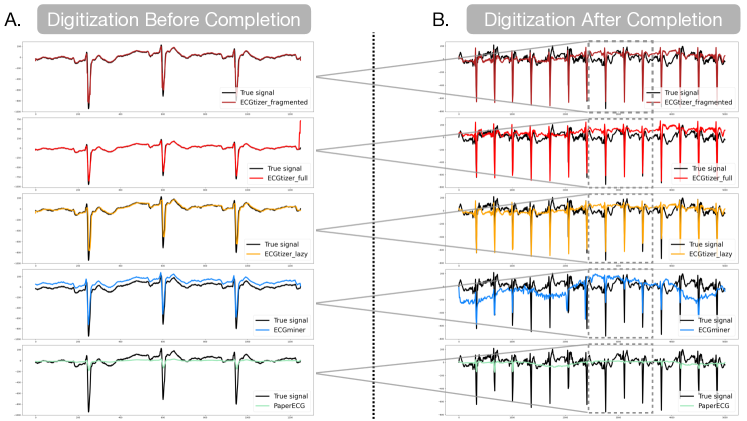
In Fig. 3, we present an example of the digitized ECGs produced by ECGtizer, ECGminer, and PaperECG, compared with the original ECG signal (shown in black). The comparison is illustrated before (Panel A) and after (Panel B) the application of ECGrecover to the digitized signals. This visual representation reveals two notable phenomena: first, both PaperECG and ECGminer methods tend to underestimate the amplitude of the R peak, which could affect the clinical interpretation of the ECG. This is also the case for ECGtizer. Second, the amplitude scaling of PaperECG is not acurate, and for ECGminer a notable misalignment is observed in the basal amplitude of the extracted ECGs compared with the true basal amplitude.
These discrepancies are critical as they could lead to misdiagnoses or errors in patient monitoring. The underestimation of the R peak amplitude, for instance, might affect the clinical assessments related to cardiac conditions that are often indicated by changes in this specific peak.
Finally, Table 1 details the time required by each method to digitize an ECG from the Jocovid dataset. It is noteworthy that the PaperECG method requires approximately 15 times longer than the automated methods. More than 30 human hours were necessary to digitize 807 ECG with PaperECG, compared to 2 hours for ECGtizer by a single unprallelized computer. Such differences in processing time are important considerations for clinical settings where rapid ECG analysis may be crucial.
4.1.2 ECG Feature Detection
This section evaluates the ability of different digitizing tools to preserve crucial ECG features utilized by clinicians, specifically focusing on the P-wave, QRS complex, and T-wave, using lead II. This lead is commonly used to measure these features due to its clear depiction of the heart’s electrical activity [9]. Using the NeuroKit Python library, each ECG heartbeat—defined as the segment centered around the R peak, with 200 data points before and 300 points after—was isolated as described in [7]. The digitized 10-second ECGs, scaled at 500 Hz, comprise a vector of 5,000 data points.
We analyzed time intervals, such as the QT interval and the QRS complex, along with the wave peak amplitudes. The QT interval is crucial for assessing the risk of arrhythmias like Torsades-de-Pointes (TdP), while the QRS complex duration and amplitude are indicators of conditions such as hypertrophic cardiomyopathy and pulmonary diseases [20]. Peak amplitudes, measured in millivolts (mV), provide insights into cardiac function and signal integrity.
The differences in QT and QRS durations and peak amplitudes between the digitized and original signals are summarized in Table 2. We computed the absolute differences in these measurements to assess the fidelity of the digitization, with smaller differences indicating more accurate reproduction.
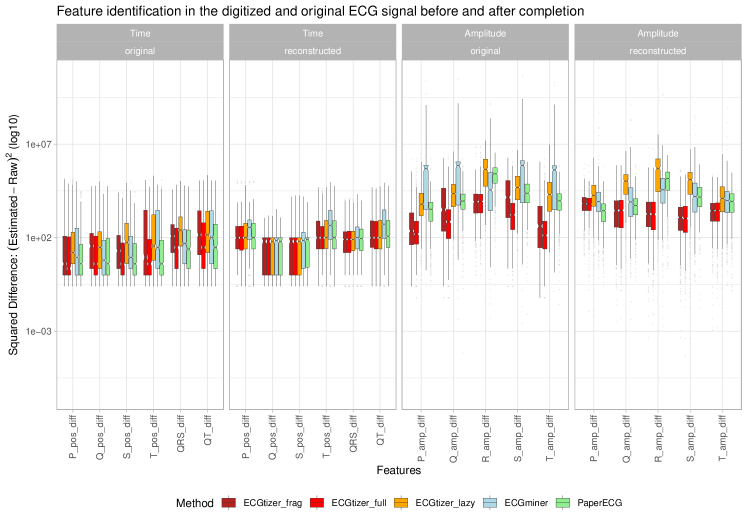
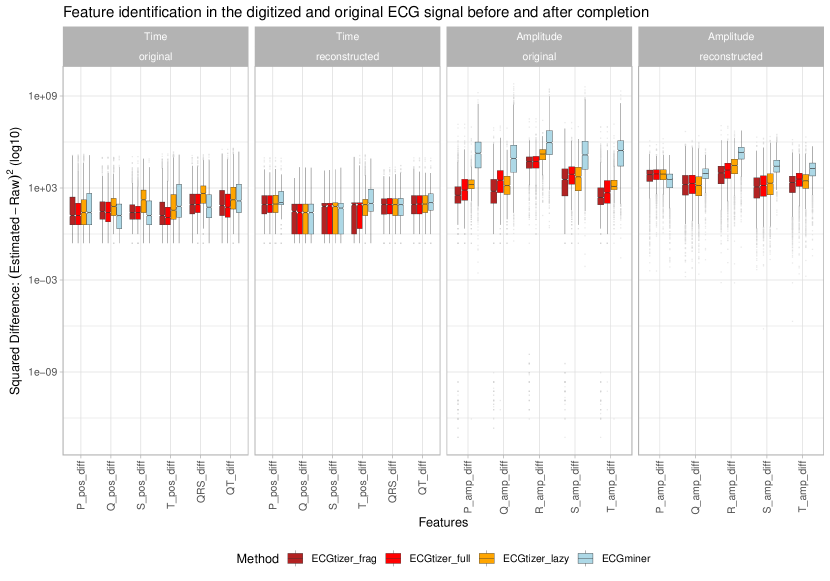
Figure 4 illustrates the squared differences between the estimated features in the digitized and the original signals, displayed on a logarithmic scale to enhance clarity. Comparative statistics were performed using linear mixed models, with ‘Patient id’ and ‘Features’ as random variables, providing a robust framework for interpretation. The ‘Features’ indicate the different measurements of positions and the resulting durations (QT, QRS).
In the time domain, PaperECG showed the smallest average absolute difference at 25.47 ms, closely followed by ECGtizer at 28.02 ms, a difference which was not statistically significant (p=0.08). ECGtizer, ECGminer, and ECGtizer showed larger differences, with ECGminer and ECGtizer differing significantly (p¡6.15e-12).
In the amplitude domain, ECGtizer and ECGtizer were equivalent, with average absolute differences of 74.79 and 124.58 , respectively. They outperformed PaperECG, ECGtizer, and ECGminer, which exhibited larger discrepancies in amplitude measurements, respectively 217.33, 345.88 and 895.41 of average absolute difference.
These findings highlight the effectiveness of ECGtizer in accurately preserving essential ECG features, which is critical for reliable clinical assessments and research.
| ECGtizer | ECGtizer | ECGtizer | ECGminer | PaperECG | |
| P | 0.02 ± 0.06 | 0.02 ± 0.07 | 0.04 ± 0.11 | 0.03 ± 0.06 | 0.02 ± 0.05 |
| Q | 0.02 ± 0.04 | 0.02 ± 0.03 | 0.03 ± 0.05 | 0.01 ± 0.03 | 0.01 ± 0.03 |
| S | 0.01 ± 0.03 | 0.02 ± 0.04 | 0.04 ± 0.07 | 0.02 ± 0.05 | 0.01 ± 0.03 |
| T | 0.03 ± 0.08 | 0.05 ± 0.1 | 0.08 ± 0.16 | 0.06 ± 0.09 | 0.03 ± 0.08 |
| QT | 0.06±0.10 | 0.04±0.08 | 0.09±0.16 | 0.06±0.09 | 0.04±0.08 |
| QRS | 0.03±0.05 | 0.03±0.05 | 0.06±0.08 | 0.03±0.05 | 0.02±0.04 |
| R | 0.11±0.18 | 0.13±0.20 | 0.85±0.74 | 0.49±2.05 | 0.55±0.34 |
| P | 0.04±0.08 | 0.03±0.08 | 0.12±0.14 | 0.93±6.13 | 0.07±0.07 |
| Q | 0.16±0.21 | 0.06±0.11 | 0.19±0.19 | 0.96±6.42 | 0.12±0.10 |
| S | 0.21±0.25 | 0.08±0.14 | 0.33±0.34 | 1.11±7.91 | 0.19±0.16 |
| T | 0.07±0.14 | 0.03±0.08 | 0.22±0.24 | 0.94±6.71 | 0.11±0.09 |
4.1.3 Recovering the missing signal
At this step of the ECGtizer pipeline, the ECG signal is only partial. In this section, we discuss the final and optional step in the ECGtizer pipeline: lead completion. This process is essential for downstream analyses, such as advanced classification methods. To address this, we employ ECGrecover [14], a deep learning model specifically designed to reconstruct missing parts of the ECG. Initially trained on the Generepol dataset [24], ECGrecover was applied to digitized ECGs processed by the five methods previously discussed. This analysis, besides providing an evaluation of the digitizers in their capacity to recover the missing signal, allows to generate complete ECG for downstream analyses.
Figure 3 B illustrates an example of an ECG post-digitization and completion. The highlighted box indicates the segment originally digitized from the paper ECG (panel A). The reconstructed signal, while slightly different from the original, completes the entire ECG, offering a potential replacement for the digitized portion with a reconstructed equivalent.
Signal Fidelity after Signal Completion with ECGrecover
The effectiveness of the signal completion was quantitatively assessed by comparing the reconstructed signals to the original ECGs from the .xml files, focusing on metrics such as the Pearson Correlation Coefficient (PCC), Root Mean Square Error (RMSE), and Soft-Distance Time Warping (SDTW). The results, presented in Fig. 2 right, highlight the accuracy of ECGrecover restoring the full ECG waveform. This completion only enhances the usability of historical ECG data in downstream applications.
When evaluating the reconstructed signals, ECGtizer methods demonstrate notable efficacy. Specifically, ECGtizer exhibits the highest Pearson Correlation Coefficient (PCC) at 0.806, closely followed by ECGtizer with a PCC of 0.800 and ECGtizer at 0.798. The differences between ECGtizer and ECGtizer are not statistically significant (p=0.11), indicating comparable performance in terms of correlation. Meanwhile, PaperECG and ECGminer show lower correlations of 0.705 and 0.633, respectively.
In terms of Root Mean Square Error (RMSE), ECGtizer, ECGtizer, and ECGtizer achieve 129.89, 139.67, and 166.15, respectively, indicating precise signal reconstruction. PaperECG performs comparably well with an RMSE of 107.87, not significantly different from the best performing ECGtizer methods. Conversely, ECGminer lags significantly behind with an RMSE of 606.59 (p¡2e-16).
For Soft-Distance Time Warping (SDTW), the three ECGtizer methods again perform best, showing the lowest values: 201.75, 221.29, and 389.05 for ECGtizer, ECGtizer, and ECGtizer respectively. This contrasts starkly with ECGminer, which records an exceedingly high SDTW of 88683.23, significantly worse than all other methods (p¡2e-16). PaperECG achieves the best SDTW performance at 95.95, indicating excellent temporal alignment.
| ECGtizer | ECGtizer | ECGtizer | ECGminer | PaperECG | |
| P | 0.03 ± 0.05 | 0.03 ± 0.05 | 0.03 ± 0.06 | 0.04 ± 0.05 | 0.03 ± 0.05 |
| Q | 0.01 ± 0.01 | 0.01 ± 0.01 | 0.01 ± 0.01 | 0.01 ± 0.02 | 0.01 ± 0.01 |
| S | 0.01 ± 0.02 | 0.01 ± 0.02 | 0.01 ± 0.02 | 0.02 ± 0.03 | 0.02 ± 0.02 |
| T | 0.04 ± 0.06 | 0.04 ± 0.06 | 0.04 ± 0.06 | 0.07 ± 0.07 | 0.04 ± 0.06 |
| QT | 0.04±0.06 | 0.04±0.06 | 0.04±0.06 | 0.07±0.08 | 0.04±0.06 |
| QRS | 0.02±0.03 | 0.02±0.03 | 0.02±0.03 | 0.03±0.04 | 0.02±0.03 |
| R | 0.08 ± 0.13 | 0.08 ± 0.13 | 0.85 ± 0.78 | 0.41 ± 0.29 | 0.41 ± 0.29 |
| P | 0.09 ± 0.07 | 0.09 ± 0.06 | 0.18 ± 0.19 | 0.18 ± 0.88 | 0.06 ± 0.05 |
| Q | 0.07 ± 0.09 | 0.08 ± 0.09 | 0.35 ± 0.31 | 0.24 ± 1.44 | 0.08 ± 0.07 |
| S | 0.06 ± 0.08 | 0.06 ± 0.07 | 0.41 ± 0.38 | 0.31 ± 1.72 | 0.17 ± 0.14 |
| T | 0.06 ± 0.06 | 0.07 ± 0.06 | 0.18 ± 0.23 | 0.19 ± 1.15 | 0.11 ± 0.08 |
Overall, the results indicate that the methods proposed by ECGtizer and PaperECG lay a solid foundation for subsequent reconstruction with ECGrecover. Across all evaluated metrics—PCC, RMSE, and SDTW—the ECGtizer technique consistently outperforms the other ECGtizer variants. Moreover, for the PCC metric, the methods proposed by ECGtizer surpass current state-of-the-art techniques, showcasing their robustness in maintaining temporal dynamics of the ECG signal.
While PaperECG exhibits slightly better results than ECGtizer for RMSE and SDTW metrics, the differences are not statistically significant. This suggests that both methods are comparably effective at minimizing errors and aligning the signals over time, despite slight variations in their operational algorithms.
Interestingly, there is a noted decrease in performance after the signal completion phase. This decline is anticipated as the completion process inherently modifies the original signal. Specifically, it tends to attenuate noise, which can make the completed ECG appear less similar to the original, particularly at higher frequencies. However, this modification is crucial for reducing artifacts and preserving essential clinical information that is critical for accurate diagnosis and analysis.
ECG Feature Identification Fidelity After Signal Completion
In the assessment of feature detection fidelity in the time domain for the reconstructed signal, ECGtizer demonstrates the best performance with a minimal average absolute time difference of 25.9 ms, closely followed by ECGtizer at 26.27 ms, with no significant difference between them. ECGtizer, PaperECG, and ECGminer follow, with time differences of 27.85 ms, 28.21 ms, and 41.37 ms, respectively. In the amplitude domain, ECGtizer and ECGtizer also lead, both exhibiting an average absolute difference of around 80 V, significantly outperforming the other methods. These results are visualized in Fig. 4.
Table 3 indicates that ECGrecover partially corrects the digitized ECG, notably improving QT and QRS measurements. This improvement might be attributed to ECGrecover’s ability to enhance peak detection by clarifying the signal, thus facilitating the isolation of peak-related pixels. Another contributing factor could be the initial measurement approach, which was based on averaging only 2 to 3 beats. After completion, averaging extends across 10 beats, likely reducing the impact of minor errors.
It is important to highlight that while ECGrecover is primarily designed for reconstructing missing segments of the ECG, it appears to also clean the signal, although this was not an intended function during its training, as discussed in the reference paper [14]. Despite these enhancements in time domain measurements, amplitude measurements see no improvement post-completion, reflecting ECGrecover’s design focus, which does not include modifying signal amplitude.
In the subsequent section, we will delve deeper into the characteristics of the ECG post-completion to further analyze how these modifications impact the clinical utility of the reconstructed signals. This analysis will help us understand the trade-offs involved in enhancing signal fidelity while maintaining clinical relevance.
4.2 Downstream Classification Tasks
As we conclude our evaluation of ECGtizer, we transition from analyzing its performance in signal digitization and feature reconstruction to assessing its utility in a critical clinical application. Specifically, we estimate its effectiveness in classifying the IKr-blockade ECG footprint, a crucial marker for predicting the risk of Torsades-de-Pointes. This classification task, as demonstrated by Prifti et al. [21], relies heavily on the accurate detection and representation of specific ECG features that ECGtizer has been shown to preserve effectively.
The ability of ECGtizer to maintain high fidelity in the reconstructed signals suggests that it could significantly enhance the reliability of downstream classification tasks in cardiology. By ensuring that crucial waveforms and intervals are accurately captured and represented, ECGtizer supports advanced analytical methods that predict potentially life-threatening arrhythmias like Torsades-de-Pointes.
For this experiment, we utilized the Generepol dataset (refer to Section 3), focusing exclusively on ECGs recorded before (Sot-) and 3 hours after (Sot+) Sotalol intake, which are critical for assessing TdP risk. The dataset comprised 3,066 Sot- and 2,734 Sot+ ECGs. Notably, while the original ECGs were in .xml format, we converted them to a paper-like format using the ecg2pdf library777https://github.com/RigacciOrg/ecg-contec/tree/main, adapting the process to ensure compatibility with our digitizing tools. However, due to format incompatibility, the ECGs generated were not readable by ECGminer, necessitating an alternative conversion method as described in [26]. Moreover, PaperECG was excluded from this experiment due to the extensive time required for manual lead annotation.
We employed a CNN model, originally developed by Prifti et al. [21], to predict TdP risk. This DenseNet-style model features six blocks, each with eight dense convolutional layers, and was trained over 200 epochs using the Adam optimizer (learning rate: 0.001, dropout rate: 0.2). We trained five versions of the model: one on the original .xml data and four on data digitized via ECGtizer and ECGminer. Given that ECG lead II is inherently 10 seconds long in the standard 44 paper format, this lead required no further completion or reconstruction, focusing our analysis solely on this lead.
In Table 4, we compare the performance of the model trained on the original data with that on the digitized testing set from the Generepol dataset. A noticeable performance decline was observed across the digitized data compared to the original. Notably, the most significant declines were seen with ECGtizer and ECGminer, which also showed the greatest discrepancies in peak amplitude (Section 4.1.2), underscoring the importance of peak amplitude accuracy for TdP-risk prediction. Interestingly, the original model’s relatively robust performance suggests that accurate QT distance detection, a feature well-preserved in the original data, may play a critical role in effective TdP-risk prediction.
| Accuracy | Precision | Recall | F1-Score | |
|---|---|---|---|---|
| ECGtizer | 0.83 | 0.93 | 0.70 | 0.80 |
| ECGtizer | 0.85 | 0.91 | 0.75 | 0.82 |
| ECGtizer | 0.76 | 0.69 | 0.82 | 0.75 |
| ECGminer | 0.47 | 0.47 | 1.00 | 0.64 |
| Original data | 0.94 | 0.95 | 0.92 | 0.93 |
| Accuracy | Precision | Recall | F1-Score | |
|---|---|---|---|---|
| ECGtizer | 0.88 | 0.89 | 0.85 | 0.86 |
| ECGtizer | 0.89 | 0.89 | 0.86 | 0.87 |
| ECGtizer | 0.80 | 0.88 | 0.65 | 0.75 |
| ECGminer | 0.79 | 0.79 | 0.74 | 0.76 |
| Original data | 0.94 | 0.95 | 0.92 | 0.93 |
In Table 5, we present the performance of the DenseNet model retrained on digitized training data from the same dataset with the same framework. This retraining led to improved performance compared to the results in Table 4, where models were tested on digitized data without retraining. However, despite these gains, the performance levels with digitized data still did not match those achieved with the original .xml data. Among the ECGtizer methods, ECGtizer showed the best results, underscoring its capacity to preserve essential features critical for accurate TdP-risk prediction.
One plausible explanation for the persistent performance gap can be linked to the inherent loss of information during the paper conversion. As outlined in another study by Granese et al. [8], basic alterations to the signal, particularly through processes like cleaning and pre-processing, can detrimentally impact deep learning models. In addition, the digitization process itself includes operations such as smoothing and resampling, which might also contribute to subtle but clinically significant alterations, thus negatively affecting the performance of the DenseNet model. These changes can obscure or alter key ECG features that deep learning algorithms, like DenseNet, rely on for making accurate predictions.
This phenomenon highlights a critical challenge in applying machine learning to clinical diagnostics: maintaining the integrity of original data features during preprocessing and digitization is essential for preserving model accuracy. Moving forward, it is crucial to refine these methods to minimize information loss and better simulate the characteristics of original ECG recordings, ensuring that advanced predictive models can perform optimally in clinical settings. Future research could further refine ECGtizer’s algorithms to optimize for specific classification tasks or explore its integration into broader clinical workflows. The ongoing development and validation of ECGtizer in these practical applications hold the potential to improve diagnostic accuracy and patient outcomes in cardiac care.
5 Conclusion
In this paper, we introduced ECGtizer, an innovative open-source tool designed to automatically digitize paper-based ECGs in the Standard 4x4 clinical format. A unique feature of ECGtizer is its ability to reconstruct missing segments of the ECG, ensuring complete 10-second coverage for each of the 12 leads, a capability that sets it apart from other state-of-the-art methods.
ECGtizer has shown superior performance in our evaluations, particularly with its three signal extraction algorithms: ECGtizerFull, ECGtizerFrag, and ECGtizerLazy. Notably, ECGtizerFrag excels in preserving the QT/QRS segments critical for accurate ECG interpretation, while ECGtizer has demonstrated particular effectiveness in supporting downstream AI tasks sensitive to specific ECG features such as peak amplitudes.
Despite these promising results, our study has limitations, primarily focusing on digitally generated, clean paper-like ECGs from original XML files. In real-world applications, paper ECGs often present additional challenges, including annotations, creases, and variable scan qualities. Future work will involve extensive testing of ECGtizer under these more complex conditions to confirm its effectiveness in typical clinical environments.
Looking forward, we aim to enhance ECGtizer’s adaptability to a variety of ECG formats used by single-lead recording devices. This development will broaden its applicability across different clinical tools and healthcare systems, potentially transforming ECG digitization practices for better diagnostic and therapeutic outcomes.
In conclusion, ECGtizer constitutes a substantial innovation in the field of electrocardiography digitization. As an open-source and fully automated tool, it is uniquely positioned to enhance the scope and speed of electrocardiology research by facilitating access to and utilization of extensive historical datasets from well-characterized cohorts globally.
Acknowledgements
This study was supported by the ANR-20-CE17-0022 DeepECG4U funding from the French National Research Agency (ANR).
Declaration of generative AI and AI-assisted technologies in the writing process
During the preparation of this work the author(s) used ChatGPT 4 in order to improve the readibility of the text. After using this tool/service, the author(s) reviewed and edited the content as needed and take(s) full responsibility for the content of the published article.
References
- Adedinsewo et al. [2022] Adedinsewo, D.A., Siddiqui, H., Johnson, P.W., Douglass, E.J., Cohen-Shelly, M., Attia, Z.I., Friedman, P., Noseworthy, P.A., Carter, R.E., 2022. Digitizing paper based ecg files to foster deep learning based analysis of existing clinical datasets: An exploratory analysis. Intelligence-Based Medicine 6, 100070.
- Badilini et al. [2005] Badilini, F., Erdem, T., Zareba, W., Moss, A.J., 2005. Ecgscan: a method for conversion of paper electrocardiographic printouts to digital electrocardiographic files. Journal of electrocardiology 38, 310–318.
- Baydoun et al. [2019] Baydoun, M., Safatly, L., Abou Hassan, O.K., Ghaziri, H., El Hajj, A., Isma’eel, H., 2019. High precision digitization of paper-based ecg records: a step toward machine learning. IEEE journal of translational engineering in health and medicine 7, 1–8.
- Chebil et al. [2008] Chebil, J., Al-Nabulsi, J., Al-Maitah, M., 2008. A novel method for digitizing standard ecg papers, in: 2008 international conference on computer and communication engineering, IEEE. pp. 1308–1312.
- Einthoven [1903] Einthoven, W., 1903. Die galvanometrische registrirung des menschlichen elektrokardiogramms, zugleich eine beurtheilung der anwendung des capillar-elektrometers in der physiologie. Pflügers Archiv European Journal of Physiology 99, 472–480.
- Fortune et al. [2022] Fortune, J.D., Coppa, N.E., Haq, K.T., Patel, H., Tereshchenko, L.G., 2022. Digitizing ecg image: a new method and open-source software code. Computer methods and programs in biomedicine 221, 106890.
- Golany and Radinsky [2019] Golany, T., Radinsky, K., 2019. Pgans: Personalized generative adversarial networks for ecg synthesis to improve patient-specific deep ecg classification, in: Proceedings of the AAAI Conference on Artificial Intelligence, pp. 557–564.
- Granese et al. [2023] Granese, F., Fall, A., Lence, A., Salem, J.E., Zucker, J.D., Prifti, E., 2023. The negative impact of denoising on automated classification of electrocardiograms .
- Hampton and Hampton [2019] Hampton, J., Hampton, J., 2019. The ECG Made Easy E-Book: The ECG Made Easy E-Book. Elsevier Health Sciences.
- Himmelreich and Harskamp [2023] Himmelreich, J.C., Harskamp, R.E., 2023. Diagnostic accuracy of the pmcardio smartphone application for artificial intelligence–based interpretation of electrocardiograms in primary care (amstelheart-1). Cardiovascular Digital Health Journal 4, 80–90.
- Joo et al. [2023] Joo, J., Joo, G., Kim, Y., Jin, M., Park, J., Im, H., 2023. Twelve-lead ecg reconstruction from single-lead signals using generative adversarial networks 14226.
- Kumar et al. [2012] Kumar, V., Sharma, J., Ayub, S., Saini, J., 2012. Extracting samples as text from ecg strips for ecg analysis purpose, in: 2012 Fourth International Conference on Computational Intelligence and Communication Networks, IEEE. pp. 317–321.
- Lence et al. [2023] Lence, A., Extramiana, F., Fall, A., Salem, J.E., Zucker, J.D., Prifti, E., 2023. Automatic digitization of paper electrocardiograms–a systematic review. Journal of Electrocardiology .
- Lence et al. [2024] Lence, A., Fall, A., Granese, F., Hanczar, B., Salem, J.E., Zucker, J.D., Prifti, E., 2024. Ecgrecover: a deep learning approach for electrocardiogram signal completion. arXiv:2406.16901.
- Li et al. [2020] Li, Y., Qu, Q., Wang, M., Yu, L., Wang, J., Shen, L., He, K., 2020. Deep learning for digitizing highly noisy paper-based ecg records. Computers in biology and medicine 127, 104077.
- Mallawaarachchi et al. [2014] Mallawaarachchi, S., Perera, M.P.N., Nanayakkara, N.D., 2014. Toolkit for extracting electrocardiogram signals from scanned trace reports, in: 2014 IEEE Conference on Biomedical Engineering and Sciences (IECBES), IEEE. pp. 868--873.
- Mishra et al. [2021] Mishra, S., Khatwani, G., Patil, R., Sapariya, D., Shah, V., Parmar, D., Dinesh, S., Daphal, P., Mehendale, N., 2021. Ecg paper record digitization and diagnosis using deep learning. Journal of medical and biological engineering 41, 422--432.
- Otsu et al. [1975] Otsu, N., et al., 1975. A threshold selection method from gray-level histograms. Automatica 11, 23--27.
- Patil and Karandikar [2017] Patil, R., Karandikar, R., 2017. Robust algorithm for digitization of degraded electrocardiogram paper records. ICTACT Journal on Communication Technology 8, 21--44.
- Power et al. [2021] Power, J.R., Alexandre, J., Choudhary, A., Ozbay, B., Hayek, S., Asnani, A., Tamura, Y., Aras, M., Cautela, J., Thuny, F., et al., 2021. Electrocardiographic manifestations of immune checkpoint inhibitor myocarditis. Circulation 144, 1521--1523.
- Prifti et al. [2021] Prifti, E., Fall, A., Davogustto, G., Pulini, A., Denjoy, I., Funck-Brentano, C., Khan, Y., Durand-Salmon, A., Badilini, F., Wells, Q.S., et al., 2021. Deep learning analysis of electrocardiogram for risk prediction of drug-induced arrhythmias and diagnosis of long qt syndrome. European Heart Journal 42, 3948--3961.
- Randazzo et al. [2022] Randazzo, V., Puleo, E., Paviglianiti, A., Vallan, A., Pasero, E., 2022. Development and validation of an algorithm for the digitization of ecg paper images. Sensors 22, 7138.
- Ravichandran et al. [2013] Ravichandran, L., Harless, C., Shah, A.J., Wick, C.A., Mcclellan, J.H., Tridandapani, S., 2013. Novel tool for complete digitization of paper electrocardiography data. IEEE journal of translational engineering in health and medicine 1, 1800107--1800107.
- Salem et al. [2017] Salem, J.E., Germain, M., Hulot, J.S., Voiriot, P., Lebourgeois, B., Waldura, J., Tregouet, D.A., Charbit, B., Funck-Brentano, C., 2017. Genome wide analysis of sotalol-induced ikr inhibition during ventricular repolarization,“generepol study”: Lack of common variants with large effect sizes. PLoS One 12, e0181875.
- Salem et al. [2022] Salem, J.E., Hammoudi, N., Pinna, B., Ederhy, S., Lamazière, A., Fenioux, C., Redheuil, A., Salem, P., Ribet, C., Hamwy, O., et al., 2022. Echocardiography and renin-aldosterone interplay as predictors of death in covid-19. Archives of cardiovascular diseases 115, 96.
- Santamónica et al. [2024] Santamónica, A.F., Carratalá-Sáez, R., Larriba, Y., Pérez-Castellanos, A., Rueda, C., 2024. Ecgminer: A flexible software for accurately digitizing ecg. Computer Methods and Programs in Biomedicine , 108053.
- Sauvola and Pietikäinen [2000] Sauvola, J., Pietikäinen, M., 2000. Adaptive document image binarization. Pattern recognition 33, 225--236.
- Seo et al. [2022] Seo, H.C., Yoon, G.W., Joo, S., Nam, G.B., 2022. Multiple electrocardiogram generator with single-lead electrocardiogram. Computer Methods and Programs in Biomedicine 221, 106858.
- Somani et al. [2021] Somani, S., Russak, A.J., Richter, F., Zhao, S., Vaid, A., Chaudhry, F., De Freitas, J.K., Naik, N., Miotto, R., Nadkarni, G.N., et al., 2021. Deep learning and the electrocardiogram: review of the current state-of-the-art. EP Europace 23, 1179--1191.
- Tun et al. [2017] Tun, H.M., Moe, W., Naing, Z., 2017. Analysis on conversion process from paper record ecg to computer based ecg. MOJ Appl. Bionics Biomech 1, 1--11.
- Viterbi [1967] Viterbi, A., 1967. Error bounds for convolutional codes and an asymptotically optimum decoding algorithm. IEEE transactions on Information Theory 13, 260--269.
- Wagner et al. [2020] Wagner, P., Strodthoff, N., Bousseljot, R.D., Kreiseler, D., Lunze, F.I., Samek, W., Schaeffter, T., 2020. Ptb-xl, a large publicly available electrocardiography dataset. Scientific data 7, 1--15.
- Widman and Hines [1991] Widman, L.E., Hines, L.S., 1991. Digitization of electrocardiograms by desktop optical scanner. Journal of electrocardiology 24, 325--338.
- Wu et al. [2022] Wu, H., Patel, K.H.K., Li, X., Zhang, B., Galazis, C., Bajaj, N., Sau, A., Shi, X., Sun, L., Tao, Y., et al., 2022. A fully-automated paper ecg digitisation algorithm using deep learning. Scientific Reports 12, 20963.
Appendix A Additional Results on PTB-XL database
In this section, we present the results of applying ECGtizer to a public database, the PTB-XL database describe in Section 3.2 . This database contains ECG recordings in digital format, which first required a step to convert this digital format into images, as discussed in section Section 4.2.
For this analysis, we have chosen to focus on signal fidelity and ECG feature detection.
The main aim of this section is to demonstrate ECGtizer’s ability to adapt to other databases. In addition, a sample of the PTB-XL database and instructions for converting it to PDF format are available on the ECGtizer Git repository.
A.1 Signal fidelity
Before Completion
Overall in Fig. 5 (original), we can see that the methods proposed by ECGtizer significantly outperform the ECGminer approach for all the metrics evaluated, namely PCC, RMSE and SDTW. PCC scores reach 0.861, 0.87 and 0.86 respectively for ECGtizerFragmented, ECGtizerFull and ECGtizer, while ECGminer only achieves an PCC of 0.37. The ECGtizerFull version appears significantly superior to the ECGtizerFragmented version () for this metric.
In terms of RMSE, the ECGtizerFragmented and ECGtizerFull perform best, with values of 103.79 and 121.43 respectively. Conversely, the ECGtizer and ECGminer show significantly lower results (p = 0.0001), with RMSE values of 149.48 and 1397.82 respectively.
With regard to SDTW, the different ECGtizer methods show no significant differences, with scores ranging from 35.52 to 168.75. In contrast, ECGminer displays a significantly lower score (), reaching a value of 9077.85.
After Completion
We completed the signal in accordance with the methods described in Section 4.1.3. The results, calculated only on the missing portions of the signal, are presented in Fig. 5 (reconstructed).
Overall, the results show that the various methods proposed by ECGtizer outperform those proposed by ECGminer. Among the ECGtizer approaches, the Fragmented and Full versions stand out, without showing significant differences after reconstruction on all the metrics analyzed (PCC, RMSE and SDTW). With a PCC of around 0.76, RMSE of 165 and 157 and SDTW of 357 and 300.
The ECGtizer is slightly inferior to the other ECGtizer variants in terms of PCC alone. In terms of RMSE and STDW, this method equals ECGtizerFragmented and ECGtizerFull.
As for ECGminer, it performs significantly worse on all metrics after signal completion, with a PCC of 0.57, an RMSE of 1732 and an SDTW of 99857.
A.2 ECG feature detection
Before Completion
| ECGtizer | ECGtizer | ECGtizer | ECGminer | |
| P | 0.04 ± 0.09 | 0.04 ± 0.1 | 0.05 ± 0.11 | 0.04 ± 0.08 |
| Q | 0.02 ± 0.04 | 0.02 ± 0.04 | 0.03 ± 0.06 | 0.02 ± 0.04 |
| S | 0.02 ± 0.04 | 0.02 ± 0.03 | 0.04 ± 0.06 | 0.03 ± 0.06 |
| T | 0.04 ± 0.08 | 0.03 ± 0.08 | 0.07 ± 0.14 | 0.06 ± 0.1 |
| QT | 0.05 ± 0.09 | 0.05 ± 0.09 | 0.08 ± 0.15 | 0.07 ± 0.11 |
| QRS | 0.03 ± 0.05 | 0.06 ± 0.08 | 0.04 ± 0.06 | 0.06 ± 0.06 |
| R | 0.24 ± 0.23 | 0.27 ± 0.25 | 0.44 ± 0.28 | 2.1 ± 3.83 |
| P | 0.04 ± 0.13 | 0.05 ± 0.13 | 0.05 ± 0.1 | 0.88 ± 1.76 |
| Q | 0.06 ± 0.15 | 0.09 ± 0.15 | 0.06 ± 0.11 | 1.14 ± 3.87 |
| S | 0.11 ± 0.18 | 0.13 ± 0.17 | 0.11 ± 0.14 | 1.31 ± 3.49 |
| T | 0.04 ± 0.14 | 0.05 ± 0.13 | 0.06 ± 0.12 | 1.02 ± 2.19 |
Looking at the Table 7, we can clearly see that the ECGtizer set of methods outperforms ECGminer. Furthermore, the Fig. 6(original) shows that the ECGtizerFull and ECGtizerFragmented methods achieve the best results.
Concerning the coherence in feature detection in the time domain for the original digitization, the first place is taken by ECGtizer with an average absolute distance of 32.42 ms, followed by ECGtizer with an average absolute distance of 32.48 ms, however, this difference is not significant (p=0.95) and they can be considered as equivalent. They are followed by ECGminer with 41.86 ms and ECGtizer with 55.84 ms. The difference between ECGtizer and ECGminer is statistically significant ().
For the coherence in feature detection in the amplitude domain in the original signal, the first place is taken by ECGtizer, which is equivalent to ECGtizer with a respective average absolute difference of 98.423 and 118,125 . They are followed by ECGtizer and ECGminer with respectively 146,422 and 1288,758 of average absolute
After Completion
| ECGtizer | ECGtizer | ECGtizer | ECGminer | |
| P | 0.02 ± 0.03 | 0.02 ± 0.04 | 0.02 ± 0.03 | 0.03 ± 0.04 |
| Q | 0.01 ± 0.01 | 0.01 ± 0.01 | 0.01 ± 0.01 | 0.01 ± 0.02 |
| S | 0.01 ± 0.02 | 0.01 ± 0.02 | 0.01 ± 0.02 | 0.01 ± 0.02 |
| T | 0.03 ± 0.06 | 0.02 ± 0.06 | 0.03 ± 0.07 | 0.04 ± 0.06 |
| QT | 0.02 ± 0.03 | 0.02 ± 0.04 | 0.02 ± 0.03 | 0.03 ± 0.03 |
| QRS | 0.02 ± 0.02 | 0.02 ± 0.02 | 0.02 ± 0.02 | 0.02 ± 0.03 |
| R | 0.12 ± 0.14 | 0.17 ± 0.18 | 0.21 ± 0.18 | 1.45 ± 2.16 |
| P | 0.09 ± 0.07 | 0.1 ± 0.06 | 0.1 ± 0.07 | 0.42 ± 1.61 |
| Q | 0.07 ± 0.1 | 0.07 ± 0.08 | 0.06 ± 0.09 | 0.98 ± 2.73 |
| S | 0.06 ± 0.08 | 0.07 ± 0.09 | 0.07 ± 0.1 | 1.16 ± 3.1 |
| T | 0.06 ± 0.07 | 0.08 ± 0.07 | 0.07 ± 0.08 | 0.4 ± 1.05 |
Results for the absolute difference between extracted and real ECG are shown in Table 7, while the absolute difference for certain key features is shown in the Fig. 6(reconstructed).
A reduction in error on temporal features is observed after completion. The ECGtizerFrag approach achieves the best performance, followed by ECGtizerFull, with absolute errors of 18.81 and 19.14 ms respectively. The ECGtizer and ECGminer methods performed less well, with absolute errors of 20.00 and 24.61 ms respectively ().
In terms of amplitude-domain characteristics, ECGtizerFrag achieved the best results, with an error of 79.06 µV. In comparison, the other methods perform significantly worse (), with errors of 94.24 µV, 103.31 µV and 205.21 µV respectively for ECGtizerFull, ECGtizer and ECGminer.