mode = titleTransition dynamics of electricity asset-owning firms
[orcid=0000-0002-7522-1532] \cormark[1] \cortext[cor1]Corresponding author: anton.pichler@wu.ac.at
Transition dynamics of electricity asset-owning firms
Abstract
Despite dramatic growth and cost improvements in renewables, existing energy companies exhibit significant inertia in adapting to the evolving technological landscape. This study examines technology transition patterns by analyzing over 140,000 investments in power assets over more than two decades, focusing on how firms expand existing technology holdings and adopt new technologies. Building on our comprehensive micro-level dataset, we provide a number of quantitative metrics on global investment dynamism and the evolution of technology portfolios. We find that only about 10% of firms experience capacity changes in a given year, and that technology portfolios of firms are highly concentrated and persistent in time. We also identify a small subset of frequently investing firms that tend to be large and are key drivers of global technology-specific capacity expansion. Technology transitions within companies are extremely rare. Less than 3% of the more than 8,400 fossil fuel dominated firms have substantially transformed their portfolios to a renewable focus and firms fully transitioning to renewables are, up-to-date, virtually non-existent. Notably, firms divesting into renewables do not exhibit very characteristic technology-transition patterns but rather follow idiosyncratic transition pathways. Our results quantify the complex technology diffusion dynamics and the diverse corporate responses to a changing technology landscape, highlighting the challenge of designing general policies aimed at fostering technological transitions at the level of firms.
keywords:
Energy transition \sepDecarbonization \sepPower sector \sepTechnology adoption \sepTechnology diffusion \sepTechnological change1 Introduction
As decarbonization pressures remain high, the technology landscape in the electricity sector is poised for transformation. Typically, energy transition scenarios are investigated at the level of technologies that neglect the role of individual decision-making agents, such as firms. However, incumbent stakeholders face substantial transition risks with potential adverse impacts beyond their own operations (Caldecott et al., 2015; Battiston et al., 2017; Mercure et al., 2018; Hickey et al., 2021). Moreover, incumbent firms could use their market power to delay the transition (Fouquet, 2016). Consequently, a better understanding of how firms drive or resist the energy transition is crucial for investors, financial regulators, policymakers, and the affected firms themselves.
Independent power producers (IPPs) and other firms hold substantially larger shares of renewable energy than electric utilities, which have traditionally dominated electricity markets and continue to represent the largest owners of fossil power assets (Supplementary Information [SI] Fig. S4). However, staying within the carbon budgets necessary for avoiding extreme climate change will involve the stranding of substantial amounts of fossil assets (Davis et al., 2010; McGlade and Ekins, 2015; Pfeiffer et al., 2016, 2018; Tong et al., 2019; Lu et al., 2022; Rekker et al., 2023). Moreover, the heterogeneous exposures to renewable and fossil assets (Baer et al., 2022) and the high levels of ownership concentration (Semieniuk et al., 2022; von Dulong, 2023) will likely result in diverse transition impacts across different regions.
A fast-changing technology landscape can threaten the existence of incumbent firms if they fail to adapt their value propositions and business models (Christensen, 2015; Richter, 2012; Castaneda et al., 2017). To gain a comprehensive understanding of the socio-economic impacts of the energy transition, it is crucial to examine how fossil-focused energy companies can adjust and innovate their business models. Decarbonizing fossil-based portfolios through investments in low-carbon energy is an apparent adaptation strategy in the transitioning energy sector (Richter, 2013; Bryant et al., 2018). However, while major utilities are investing in renewables (Patala et al., 2021; Steffen et al., 2022), case studies suggest that these efforts fall short of transitioning towards low-carbon technology portfolios (Kungl, 2015), suggesting that the energy transition follows a “substitution” path where challenger firms crowd out incumbent utilities (Kelsey and Meckling, 2018).
Despite the relevance of this topic, large-scale firm-level studies on technology adoption in the power sector are scarce. A notable exception is Alova (2020), which examines the technology portfolio dynamics of more than 3k electric utilities. The study shows that while many utilities have adopted renewable energy technologies, the majority continue to expand or maintain their fossil fuel assets.
In this paper, we contribute to this literature by providing a comprehensive quantitative characterization of the diffusion of key energy technologies at the level of firms, focusing on empirical transition and diversification pathways of previously fossil-dominated companies. Using an extensive asset-level database covering more than 70k power plants and 20k firms (see Appendix A.1), we show that energy assets are highly unevenly distributed across firms and that firms’ technology portfolios are strongly biased towards single technologies. Technology portfolios are highly static in time, as only a small minority of firms invest in new assets in any given year. We can identify a small subgroup of, typically, large firms that are investing very frequently. These frequent investors account for a large portion of the observed expansion of electricity generation capacity. However, even if firms invest, their technological choices resonate with existing portfolio concentrations, resulting in a highly path-dependent evolution of technology portfolios.
Despite persistent investment dynamics, we show that fossil-focused businesses have contributed non-negligibly to the recent expansion of renewable energy. Nevertheless, only a small minority of them have significantly transformed their portfolios from a fossil to a renewable focus. When zooming into the investment dynamics of this small subset, we do not find highly typical technology transition pathways. Instead, we find diverse diversification and transition strategies of firms. While the adoption of solar and wind power represents the most crucial component of technology focus-switching companies, we find that the adoption of hydro- and biopower also played an important role.
2 Results
2.1 Uneven distribution of power assets
We focus on asset ownership at the level of ultimate parent companies, as direct owners frequently only act as their operating subsidiaries. An analysis at the level of direct owners thus might mask the diversification strategies of companies through specialized subsidiaries (Appendix A.2). We further do not restrict our sample to utilities or IPPs, as is done in previous studies, as we observe that other company types hold more than 30% of total capacity (SI Section S3.1).
While we observe a large number of power asset-owning legal entities (23k ultimate parents and 30k direct owners), the bulk of these assets is concentrated in a few hands. 80% of all installed power capacity is held by less than 3% of firms in our sample, corresponding to merely 633 firms (SI Section S3.2). We find that the top 25 companies own about a quarter of the total installed capacity. Compared to the global average, the top 25 firms own a disproportionately large share of coal power, accounting for about 40% of worldwide installed coal power capacity.
The development of solar and wind power is often attributed to small-scale firms. However, we observe similar ownership distributions across all major technology groups – all of them show concentration in large firms, and renewables are not an exception. Moreover, the ownership of power capacities has not become less evenly distributed over time as the increasing penetration of renewables might have suggested. Thus, the global ownership of power assets is dominated by a relatively small number of key players who are likely to play an important role in the energy transition.
2.2 High technological concentration
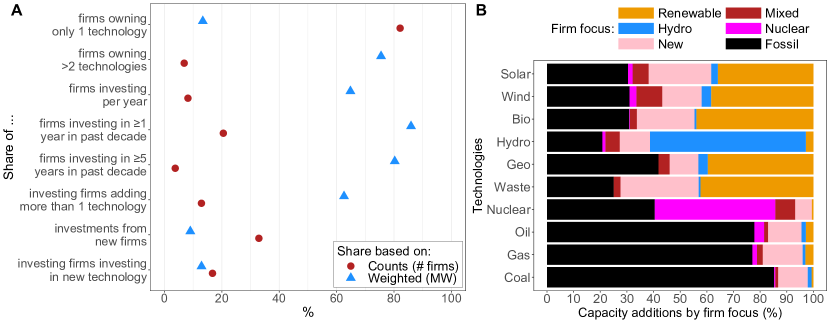
If we zoom into the technological composition of the firms’ assets, we find extremely high levels of concentration. About 80% of firms hold only a single technology, so multi-technology energy firms are the exception rather than the rule (Fig. 1A). However, a clear positive relationship exists between firm size and the number of technologies owned (SI Section S3.3). The 20% of firms owning multiple technologies own almost 90% of the total capacity in our sample. While the typical single technology firm is small, and the typical multiple-capacity firm is large, there are also notable exceptions. Among them are the Venezuelan Electrificación del Caroní or the Iranian Water and Power Resources Development Company, which hold multiple GW of hydropower-only. We observe similar notable exceptions across various technological domains. For example, the typical solar PV-dominated firm is comparatively small (SI Section S3.3). Nevertheless, in our sample, there are eleven solar PV-only firms larger than 1 GW (e.g., Canadian Solar Inc., Pine Gate Renewables).
Interestingly, even multiple-technology firms tend to be highly specialized in single technologies. The typical 2-technology firm allocates almost 80% of its total capacity to a primary technology rather than evenly splitting it between both technologies. Similarly, the dominant technology of the median 3-technology firm accounts for about 70% of portfolio capacity, compared to an even 33%-split across the three technologies. We observe similar high levels of technology concentrations for firms owning even more technologies (SI Section S3.4).
2.3 Slow and persistent investment dynamics
Confirming previous research (Alova, 2020), we find that electricity technology portfolios change slowly over time. In an average year, less than 10% of firms in our sample invest in new capacity, and over the past decade, only about a fifth of firms have made any investments (Fig. 1A). However, the inclination to invest is strongly size-dependent: The firms that do invest represent about two-thirds of global installed capacity. Investments are primarily focused on single technologies. Only a minority of (typically large) firms invest in more than one technology per year (Fig. 1A).
We run logistic regressions to investigate which firm characteristics affect the probability of investing (SI Section S3.5). While firm size plays a role, the two most important covariates are a firm’s historical investment frequency and the number of technologies it owns. We identify a small fraction of persistent investors who make capacity additions on a regular basis. About 4% of firms have invested in at least half of the years over the past decade. These companies account for of global power capacity (Fig. 1A). A firm’s technology focus also affects its inclination to invest: Firms focusing on solar PV and wind onshore are more likely to invest than fossil firms or firms with more diversified portfolios.
Recent market entrants such as IPPs play a crucial role in the deployment of renewable energy and challenge the dominance of incumbent utilities (Kelsey and Meckling, 2018). We identify high entry rates into the power sector, with one-third of all investing firms corresponding to new market entrants (i.e., firms that did not hold power assets previously). These new firms account for about 10% of all new capacity additions in any given year (Fig. 1A). As demonstrated in Fig. 1B, firms entering the market over the last decade account for about 30% of total expansion in solar, biomass, and waste power plants.
A crucial question in understanding energy transition dynamics is whether firms invest in new technologies, i.e., technologies that they have not owned previously. About 15-20% of investing firms add new technologies in a given year. Taken together with the low investment rates, this implies that the rate of new technologies entering existing technology portfolios is small: If 10% of firms invest in a given year and 15% of them invest in new technologies, only 1.5% of existing portfolios experience additions of new technologies in any year.
In SI Section S3.6, we fit logistic regression models to investigate potential driving factors behind the adoption of specific technologies. Our results show that a technology’s relative share within a firm’s portfolio is a key factor in determining whether an investor adds capacity of that particular technology. This relationship is nonlinear, becoming stronger with higher portfolio concentration. The second key explanatory variable is the historical investment behavior. The likelihood of investing in a particular technology increases substantially if an investment in that technology has been made in the preceding years, particularly if a firm invested exclusively in that technology. These simple regression specifications explain a substantial share of the observed variance, indicating that an investor’s technology choice is relatively predictive. Specifically, investors’ technology choices mimic previous choices and strongly reinforce existing portfolio compositions.
Despite strong path dependencies in firms’ investment choices, fossil-dominated companies have substantially contributed to the expansion of low-carbon technologies over the past decade (Fig. 1B). Over the past ten years, about 40% of all added solar, wind, and biomass capacity is due to fossil companies, and their contribution to geothermal expansion is even larger. Conversely, we observe that investments in fossil technologies are much more concentrated and dominated by fossil firms. Renewable firms have contributed only little to new developments of fossil capacities and not at all to nuclear power expansion. Note that this is also due to size effects. Fossil firms tend to be larger than renewable firms (SI Fig. S6A) and investment amount strongly correlates with firm size (SI Section S3.6).
2.4 Transition dynamics of firms
We consider a firm having transitioned from fossils to renewables if the firm’s total capacity consisted of 50% fossil power (coal + gas + oil) for five consecutive years in the past but held a majority in renewables (solar, wind, hydro, geothermal, biomass) in every year between 2021 and 2023 (see Appendix A.4 for details).
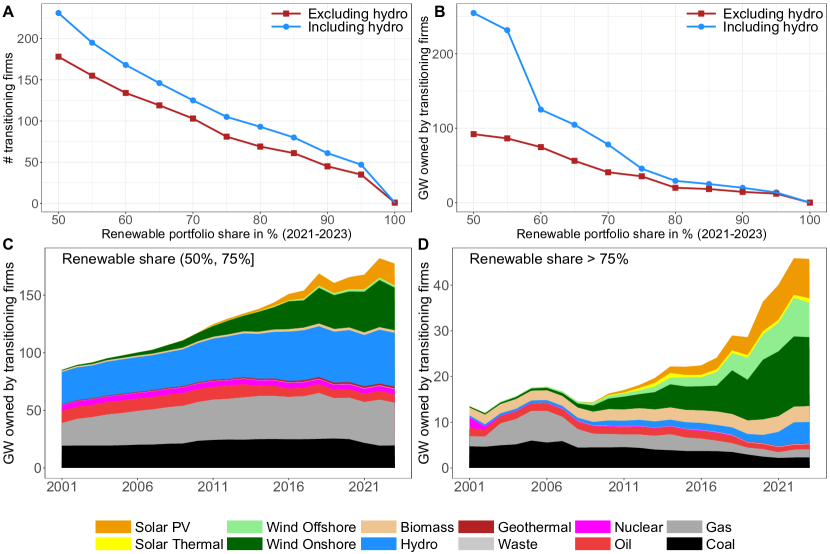
Following this definition, Fig. 2A shows the number of transitioning firms for different renewable portfolio share thresholds. Out of more than 8,400 companies that have held predominantly fossils for at least five years, we can identify about 230 firms (2.7%) that have transitioned to at least 50% renewables. These firms held about 160 GW when exceeding the 50% renewable threshold and grew to 255 GW in 2023 (Fig. 2B), accounting for 3.5% of global capacity.
If we focus only on non-hydro renewables, the number of fossil companies transitioning drops to only 178, indicating that the majority of transitioning firms do not rely on adopting hydropower. However, transitioning firms that rely on adopting hydropower tend to be very large (Fig. 2B). A prominent example of a large transitioning firm reliant on hydropower is the Italian multinational utility, Enel. Over the past decade, Enel has shrunk its fossil portfolio share from almost 60% to 35% by expanding its capacity in hydro, solar PV, and onshore wind while at the same time decreasing its coal and gas power fleets (after growing them previously). In Nov 2024, Enel announced to invest an additional EUR 12bn into renewable energy expansion until 2027 (Enel, 2024).
Figs. 2A-B make clear that the number of transitioning firms declines if we apply more stringent definitions. If we require previously fossil-based companies to increase their renewable shares to at least 75%, the number of transitioning firms drops to less than half, owning less than 50 GW of power capacity in 2023. Strikingly, despite the long time horizon and large sample, only one previously fossil-fuel-dominated firm has transitioned to 100% renewables: the Finnish company Oy Turku Energia. This transition was achieved by retrofitting the previously coal-powered Naantali CHP plant to use biomass.
After transitioning, firms that hold between 50% and 75% renewables own large amounts of hydropower and have also vastly expanded their onshore wind capacities. However, they have not unwound their fossil assets in absolute terms (Fig. 2C). If we restrict the sample to firms that have switched to >75% renewables, the important role of solar PV and offshore wind capacity becomes visible. In contrast, hydro capacities play a limited role for these firms (Fig. 2D). Importantly, these firms have significantly reduced their fossil assets to almost a third over the past ten years.
Our results indicate that few firms have transitioned from fossil fuel technologies to renewables. While a number of previously fossil-dominated companies have expanded their renewable capacities, most still maintain significant fossil fuel assets. These firms have diversified into renewables rather than fully transitioning away from fossil fuels.
2.5 Technology transition dynamics
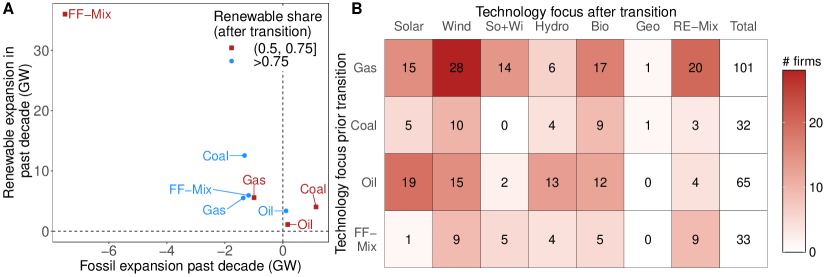
Among transitioning fossil firms, previously gas-focused companies represent the largest group (Fig. 3B). Conversely, diversified fossil firms, i.e., firms that do not hold an absolute majority of a single fossil technology, represent a relatively small group. Only 33 of them meet our criteria for transitioning to renewable energy. However, these firms tend to be large and have significantly contributed to the expansion of renewable capacity at the expense of fossil capacity (Fig. 3A). Transitioning diversified fossil companies – that have only moderately transformed their portfolios to renewable shares between 50% and 75% – have expanded more than 35 GW of renewables and divested from more than 7 GW of fossil power capacity over the past decade.
Transitioning oil-focused firms have continued to expand their fossil capacity over the past decade. Similarly, transitioning coal-focused firms, which now hold between 50% and 75% renewables, have increased their fossil capacity. In contrast, all other transitioning firm types have reduced their fossil capacity ownership in absolute terms while simultaneously expanding their renewable energy assets.
Fig. 3B makes it clear that there are no “typical” transition pathways. Instead, there is substantial heterogeneity in how transitioning firms move in the technology space. Most transitioned portfolios are dominated by solar and wind power. Despite accounting only for a small share of global installed capacity, we also observe relatively many transitions to biopower. This observation may be explained by the fact that biopower is combustion-based, making it easier for firms specialized in fossil generation to adopt.
Previously mixed fossil companies tend to transition to diversified renewable portfolios or focus on wind power. A well-known example of this group is Ørsted A/S, which, based on our typology, was a diversified fossil company before transitioning to a diversified renewable focus in the early 2010s. Through continued expansion of (off- and onshore) wind power, Ørsted now holds a majority of wind power in its energy portfolio.
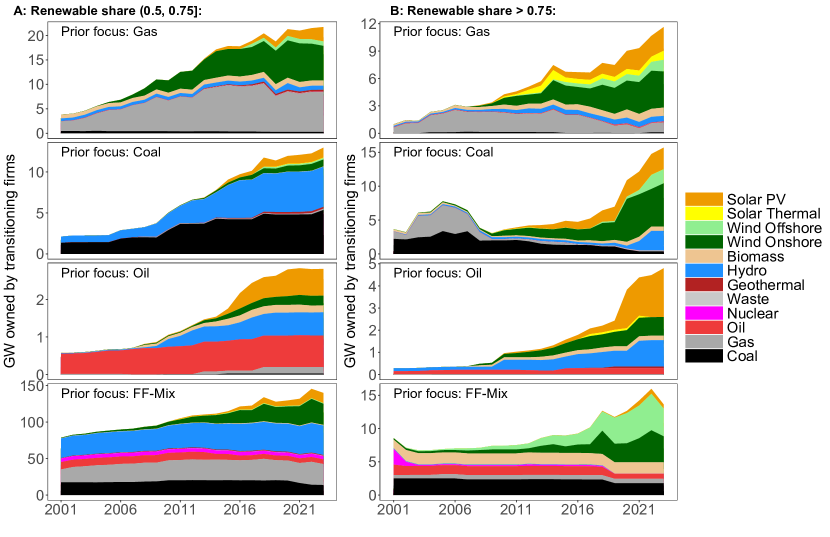
Firms that have transitioned to renewables only moderately have dramatically increased their solar PV and wind power ownership (Fig. 4A). Particularly in transitioning gas companies, the expansion of solar and wind energy dwarfs the increase in other renewable capacities. Moreover, coal- and oil-based companies have substantially increased their stakes in hydropower. While hydropower also plays a significant role for previously diversified fossil companies (FF-Mix), they have predominantly grown wind and solar power. Notably, these firms still hold on to substantial amounts of fossil capacity.
Firms that have transitioned to renewables more radically have started unwinding their fossil capacities (Fig. 4B). Still, these firms have grown in absolute terms due to the massive expansion of solar and wind power. For these firms, the expansion of hydropower only played a minor role in the transition.
Notably, diversified fossil firms that have only moderately transitioned represent by far the largest group in terms of capacity ownership. Although they still hold a minority share of wind and solar capacity in recent years, their expansion in these technologies has been enormous in absolute terms, surpassing the growth achieved by other types of transitioning firms.
3 Discussion
This paper contributes to the recent research on firm-level transition dynamics in the energy sector (Bryant et al., 2018; Kelsey and Meckling, 2018; Alova, 2020; Alova and Caldecott, 2021; Steffen et al., 2022). Our results demonstrate that firm power technology portfolios are highly concentrated, with most firms focusing on single technologies. Firm investment dynamics are sluggish, as only a small share of power asset-owning firms invest in a given year. However, there exists a minority of frequent investors, typically larger firms, that are crucial in driving the expansion of global power capacity. In line with institutional inertia and technological lock-in (Nelson and Winter, 1982; Arthur, 1989; Unruh, 2000), we find that investment decisions exhibit strong path dependency, with existing portfolio concentrations and previous technology choices being the key factors in explaining future technology adoption.
The dramatic cost declines in renewable energy over the past two decades (Way et al., 2022) have not led to systematic transformations of fossil-focused technology portfolios. While major incumbent firms have started integrating renewables into their technology portfolios (Frei et al., 2018; Alova, 2020) and have contributed substantially to the expansion of renewables, they still tend to hold on to fossil-dominated portfolios that are non-compliant with 1.5°C pathways (Rekker et al., 2022).
We have also identified several exceptions where fossil fuel firms shifted their focus toward renewable technologies. While the expansion of wind and solar capacity played a significant role for transitioning firms, we did not observe very typical transition trajectories tied to firms’ existing technological predispositions. Transition pathways appear idiosyncratic, depending on the specific historical context and business case. This poses challenges for designing policies targeted at fostering firm transitions to renewable energy. Therefore, conducting more detailed, in-depth analyses of individual transition trajectories will be necessary to better understand potential drivers and barriers influencing these transitions.
Limitations of this study point to interesting future research avenues. For example, we did not include financial characteristics of firms or policy constraints in our analysis, as this would have compromised the coverage of our data. Clearly, financial aspects such as rates of return, financing costs, and debt structures affect investment decisions and the adaptive capacity of firms in the energy sector (Polzin et al., 2015; Egli et al., 2018; Egli, 2020; Zhou et al., 2021; Polzin et al., 2019; Kempa et al., 2021) and could enrich our technology-centered analysis.
Further work could also be directed towards building predictive firm-level transition models. Our analysis reveals that technology choices and investment dynamics are relatively predictive, indicating the potential to forecast the future evolution of firms’ technology portfolios. Such predictions could complement existing business-as-usual scenarios obtained from top-down projections and yield more granular insights into asset stranding and firm-level transition risks.
Acknowledgments
This work was supported by the OeNB anniversary fund under contract number 18943 and the NSF APTO project under contract number 2403999. The author thanks F. Verastegui-Grunewald, J. Doyne Farmer and F. Lafond for their helpful comments.
Appendix
Appendix A Materials and methods
| Nr. unique | Comments | |
| observations | ||
| Years | 23 | 2001-2023 |
| Assets | 146,720 | i.e., plant units |
| Power plants | 72,739 | |
| Direct owners | 30,761 | Appendix A.2 |
| Firms (ultimate owners) | 23,196 | Appendix A.2 |
| Tech. categories | 12 | Appendix A.3 |
| Firm-asset pairs | 217,195 | |
| Firm-tech. pairs | 31,385 | |
| Firm-tech.-year triples | 490,941 | |
| # Investments | 147,477 | |
| # Retirements | 50,754 |
A.1 Data processing
Our main data source is S&P Capital IQ Pro – Energy (CIQ). This database contains extensive information on power plants and individual power plant units (e.g., individual turbines within a power plant), including nameplate capacities in MW, detailed geographical coordinates and the underlying technology. Moreover, we know in which year (and typically in which month) a plant went online for the first time and when it was retired (if it was retired). Due to data quality reasons, we restrict our analysis to the time horizon between 2001 and 2023.
Importantly, we also have access to the detailed ownership structure of assets, i.e., relative stakes in an asset owned by legal entities and how they change over time. For simplicity, we call these legal entities firms, although we acknowledge that a minority of them are non-firm entities. CIQ provides extensive firm information, allowing us to analyze owners with respect to their industry classification, headquarter locations or establishment dates. Moreover, we know the publicly owned shares of a firm and have detailed information on a firm’s parents and ultimate parents (see Appendix A.2).
As shown in Table 1, this database contains almost 150k unique power plant units (which we call assets) that are part of more than 70k power plants and owned by about 30k legal entities. In many cases, power plant units are owned by multiple owners. In such cases, our database provides detailed information on the ownership structure. For example, if multiple owners hold an asset, we can infer the name and unique identifiers of the owners as well as their percentage stake in the asset. In 2023, we observe that about 15% of assets in our sample have multiple owners. We aggregate asset-level capacities to owner portfolios by taking relative ownership shares into account. For example, if a 10 MW hydro plant is 60%-owned by Owner 1 and 40%-owned by Owner 2, we record that Owner 1 holds 6 MW and Owner 2 holds 4 MW of hydropower in their portfolios.
A.2 Ownership mapping
Power assets are frequently owned by firms only indirectly via subsidiaries. To develop plants of a technology that was not previously held, a company may launch a new specialized subsidiary instead of integrating these assets into its existing portfolio. For example, the state-owned Norwegian oil and gas company Equinor ASA has substantially invested in offshore wind through its UK-based subsidiary Equinor New Energy Ltd. Focusing only on direct asset ownership would miss such cases. Thus, we conduct our analysis at the level of ultimate parents, representing the highest-level entity within a corporate structure that exercises control over the subsidiaries. (We find that about 44% of capacity is owned through operating subsidiaries.)
While CIQ provides data on ultimate parents of direct owners, we are not using this information directly because ultimate parents frequently refer to majority-holding countries or states. To give a concrete example, the largest Austrian electric utility, Verbund AG, is majority-owned by the Republic of Austria. Consequently, the Republic of Austria is the ultimate parent of Verbund AG and all its subsidiaries. Since the relevant strategic business decisions arguably take place at the level of Verbund AG, we aim to map all subsidiaries’ assets to Verbund AG rather than to the Republic of Austria.
Because our data further provides information on the direct parents of firms, a simple alternative approach would be to analyze the power asset portfolios at the level of the direct owners’ parents. However, this approach neglects the possibility of more complex ownership relationships where the parent of a subsidiary could be again a subsidiary of another company. Consequently, we adopt a custom strategy to map direct asset owners to their ultimate company parents while avoiding mapping assets to countries or states.
More specifically, we adopt a “snowballing” algorithm that starts at the level of direct asset owners and percolates through the branches of the ownership tree until it arrives at a leave representing an independently operating company. We do this by taking advantage of a variable in our dataset that classifies firms into operating subsidiaries vs. operating firms, where the latter indicates that the firm is not a subsidiary of another company. For example, Equinor ASA and Verbund AG are classified as operating, while Equinor New Energy Ltd. and Verbund Hydro Power GmbH are classified as operating subsidiary. In the first step of the algorithm, we test if the direct owner is associated with the status operating (as opposed to operating subsidiary). If true, the direct owner is considered as the ultimate parent company, and the algorithm stops. However, if the direct owner is associated with the status operating subsidiary, we retrieve the parent firm of the direct owner and check the status of the parent firm. If the parent firm has the status operating, we have found the ultimate parent of the direct owner, and the algorithm stops. However, if the parent company is again an operating subsidiary, we go one level up in the ownership tree and consider the status of the parent of the parent. This procedure is repeated until we arrive at a leaf in the ownership tree with the status operating. For some firms, multiple parents are listed. In this case, we assign the subsidiary in equal parts to its parents. For example, if three parents of a direct owner holding 9 MW of power capacity are listed, we would assign 3 MW to each of the parents.
In cases where the snowballing procedure did not lead to the identification of parents labeled as operating (applying to owners representing about 15% of total capacity), we used the ultimate parent label provided by CIQ. Note that we aggregated the ownership only based on parents-operating subsidiary relationships but did not aggregate the assets of portfolio companies to their investors (see SI Section S2).
This approach maps about 30.7k direct owners into 23.2k ultimate parents, which we refer to as firms or companies in the main text. Overall, this procedure results in more than 200k unique asset-firm ownership observations (Table 1).
A.3 Technology aggregation
Our plant units are associated with detailed technological categories and fuel groups, which we aggregate into twelve electricity-generating technology categories: solar PV, solar thermal, wind offshore, wind onshore, biomass, hydro (including pumped-hydro storage), geothermal, waste, nuclear, oil, gas and coal. Doing this results in 31.4k unique observations of positive firm-technology capacity holdings, and almost 500k observations of firm-technology-year triples (Table1).
In the main text, fossil-based plants refer to plants that are based on oil, gas or coal fuels. Plants based on solar radiation, wind, biofuels, geothermal and hydropower make up the group of renewables.
A.4 Firm transition definition
We consider a firm to have transitioned from fossil to renewables if the majority of its asset portfolio has shifted from fossil-fuel-based to renewable energy technologies. To test whether this condition holds for a given firm, we require that the portfolio share of renewables is >50% in every year in the most recent 3-year period of our sample (2021–2023). Considering this recent multi-year period for the definition of transitioning firms avoids including firms that temporally held a renewables majority in the past but have not persistently transformed their portfolio. Similarly, to qualify as a transitioning firm, we require that a firm held a majority in fossil assets for at least five consecutive years. This condition ensures the exclusion of “noisy” portfolios (e.g., portfolios switching over time between zero and small positive fossil capacities).
We acknowledge that other definitions could be considered but emphasize that any definition must make specific subjective choices regarding portfolio share thresholds and time periods. Our transition definition is not particularly strict. In an extreme case, a transitioned portfolio could still consist of 49.9% of highly carbon-intensive assets. However, even with this definition, only a small group of firms have transitioned. To understand the robustness of our approach, we have explicitly explored the impact of choosing alternative thresholds and extensively discussed results when considering a 75% renewable portfolio share threshold (Sections 2.4-2.5).
A.5 Data coverage
According to CIQ, our sample covers essentially all plants that file data with the U.S. Energy Information Administration or are larger than 1 MW in North America and 5 MW outside North America. The data also comprises a number of plants that fall below these thresholds. For example, about 1/3 of all plants outside of North America in our sample are smaller than 5 MW. Overall, we observe plants in 220 countries (this number is higher than the actual list of sovereign states since specific non-independent territories are considered as states as well; e.g., Falkland Islands, Faroe Islands, Cayman Islands, Montserrat). One notable exception is Russia, for which no power plant data is included (Russian firms holding power assets abroad are included, though). In SI Section S1, we provide further detail on sample size and compare the coverage of our data to alternative estimates of global installed power capacities.
A.6 Data availability
The data on power-generation assets and owners have been obtained under an S&P Global Market Intelligence license and, therefore, cannot be made public.
A.7 Code availability
The analysis was conducted in R. Since the underlying data cannot be made public, the code was not published but is available from the author upon reasonable request.
References
- Alova (2020) G. Alova. A global analysis of the progress and failure of electric utilities to adapt their portfolios of power-generation assets to the energy transition. Nature Energy, 5(11):920–927, 2020. 10.1016/j.isci.2021.102929.
- Alova and Caldecott (2021) G. Alova and B. Caldecott. A machine learning model to investigate factors contributing to the energy transition of utility and independent power producer sectors internationally. iScience, 24(9), 2021. 10.1038/s41560-020-00686-5.
- Arthur (1989) W. B. Arthur. Competing technologies, increasing returns, and lock-in by historical events. The Economic Journal, 99(394):116–131, 1989. 10.2307/2234208.
- Baer et al. (2022) M. Baer, B. Caldecott, J. Kastl, A. M. Kleinnjienhuis, and N. Ranger. TRISK - a climate stress test for transition risk. SSRN, 2022. 10.2139/ssrn.4254114.
- Battiston et al. (2017) S. Battiston, A. Mandel, I. Monasterolo, F. Schütze, and G. Visentin. A climate stress-test of the financial system. Nature Climate Change, 7(4):283–288, 2017. 10.1038/nclimate3255.
- Bryant et al. (2018) S. T. Bryant, K. Straker, and C. Wrigley. The typologies of power: Energy utility business models in an increasingly renewable sector. Journal of Cleaner Production, 195:1032–1046, 2018. 10.1016/j.jclepro.2018.05.233.
- Caldecott et al. (2015) B. Caldecott, G. Dericks, and J. Mitchell. Stranded assets and subcritical coal: The risk to companies and investors. Smith School of Enterprise and the Environment, 2015.
- Castaneda et al. (2017) M. Castaneda, C. J. Franco, and I. Dyner. Evaluating the effect of technology transformation on the electricity utility industry. Renewable and Sustainable Energy Reviews, 80:341–351, 2017. 10.1016/j.rser.2017.05.179.
- Christensen (2015) C. M. Christensen. The innovator’s dilemma: when new technologies cause great firms to fail. Harvard Business Review Press, 2015.
- Davis et al. (2010) S. J. Davis, K. Caldeira, and H. D. Matthews. Future CO2 emissions and climate change from existing energy infrastructure. Science, 329(5997):1330–1333, 2010. 10.1126/science.1188566.
- Egli (2020) F. Egli. Renewable energy investment risk: An investigation of changes over time and the underlying drivers. Energy Policy, 140:111428, 2020. 10.1016/j.enpol.2020.111428.
- Egli et al. (2018) F. Egli, B. Steffen, and T. S. Schmidt. A dynamic analysis of financing conditions for renewable energy technologies. Nature Energy, 3(12):1084–1092, 2018. 10.1038/s41560-018-0277-y.
- Enel (2024) Enel. Capital markets day 2024, 2024. URL https://www.enel.com/investors/overview.
- Fouquet (2016) R. Fouquet. Historical energy transitions: Speed, prices and system transformation. Energy research & social science, 22:7–12, 2016. 10.1016/j.erss.2016.08.014.
- Frei et al. (2018) F. Frei, S. R. Sinsel, A. Hanafy, and J. Hoppmann. Leaders or laggards? The evolution of electric utilities’ business portfolios during the energy transition. Energy Policy, 120:655–665, 2018. 10.1016/j.enpol.2018.04.043.
- Hickey et al. (2021) C. Hickey, J. O’Brien, B. Caldecott, C. McInerney, and B. Ó. Gallachóir. Can european electric utilities manage asset impairments arising from net zero carbon targets? Journal of Corporate Finance, 70:102075, 2021. 10.1016/j.jcorpfin.2021.102075.
- Kelsey and Meckling (2018) N. Kelsey and J. Meckling. Who wins in renewable energy? Evidence from Europe and the United States. Energy Research & Social Science, 37:65–73, 2018. 10.1016/j.erss.2017.08.003.
- Kempa et al. (2021) K. Kempa, U. Moslener, and O. Schenker. The cost of debt of renewable and non-renewable energy firms. Nature Energy, 6(2):135–142, 2021. 10.1038/s41560-020-00745-x.
- Kungl (2015) G. Kungl. Stewards or sticklers for change? Incumbent energy providers and the politics of the German energy transition. Energy Research and Social Science, 8:13–23, 2015. 10.1016/j.erss.2015.04.009.
- Lu et al. (2022) Y. Lu, F. Cohen, S. M. Smith, and A. Pfeiffer. Plant conversions and abatement technologies cannot prevent stranding of power plant assets in 2°C scenarios. Nature communications, 13(1):806, 2022. 10.1038/s41467-022-28458-7.
- McGlade and Ekins (2015) C. McGlade and P. Ekins. The geographical distribution of fossil fuels unused when limiting global warming to 2°C. Nature, 517(7533):187–190, 2015. 10.1038/nature14016.
- Mercure et al. (2018) J.-F. Mercure, H. Pollitt, J. E. Viñuales, N. R. Edwards, P. B. Holden, U. Chewpreecha, P. Salas, I. Sognnaes, A. Lam, and F. Knobloch. Macroeconomic impact of stranded fossil fuel assets. Nature climate change, 8(7):588–593, 2018. 10.1038/s41558-018-0182-1.
- Nelson and Winter (1982) R. R. Nelson and S. G. Winter. An evolutionary theory of economic change. Harvard University Press, 1982.
- Patala et al. (2021) S. Patala, J. K. Juntunen, S. Lundan, and T. Ritvala. Multinational energy utilities in the energy transition: A configurational study of the drivers of FDI in renewables. Journal of International Business Studies, 52:930–950, 2021. 10.1057/s41267-020-00387-x.
- Pfeiffer et al. (2016) A. Pfeiffer, R. Millar, C. Hepburn, and E. Beinhocker. The ‘2°C capital stock’ for electricity generation: Committed cumulative carbon emissions from the electricity generation sector and the transition to a green economy. Applied Energy, 179:1395–1408, 2016. 10.1016/j.apenergy.2016.02.093.
- Pfeiffer et al. (2018) A. Pfeiffer, C. Hepburn, A. Vogt-Schilb, and B. Caldecott. Committed emissions from existing and planned power plants and asset stranding required to meet the Paris Agreement. Environmental Research Letters, 13(5):054019, 2018. 10.1088/1748-9326/aabc5f.
- Polzin et al. (2015) F. Polzin, M. Migendt, F. A. Täube, and P. von Flotow. Public policy influence on renewable energy investments—A panel data study across OECD countries. Energy policy, 80:98–111, 2015. 10.1016/j.enpol.2015.01.026.
- Polzin et al. (2019) F. Polzin, F. Egli, B. Steffen, and T. S. Schmidt. How do policies mobilize private finance for renewable energy?—A systematic review with an investor perspective. Applied Energy, 236:1249–1268, 2019. 10.1016/j.apenergy.2018.11.098.
- Rekker et al. (2022) S. Rekker, M. C. Ives, B. Wade, L. Webb, and C. Greig. Measuring corporate Paris Compliance using a strict science-based approach. Nature Communications, 13(1):4441, 2022. 10.1038/s41467-022-31143-4.
- Rekker et al. (2023) S. Rekker, G. Chen, R. Heede, M. C. Ives, B. Wade, and C. Greig. Evaluating fossil fuel companies’ alignment with 1.5°C climate pathways. Nature Climate Change, 13(9):927–934, 2023. 10.1038/s41558-023-01734-0.
- Richter (2012) M. Richter. Utilities’ business models for renewable energy: A review. Renewable and Sustainable Energy Reviews, 16(5):2483–2493, 2012. 10.1016/j.rser.2012.01.072.
- Richter (2013) M. Richter. Business model innovation for sustainable energy: German utilities and renewable energy. Energy Policy, 62:1226–1237, 2013. 10.1016/j.enpol.2013.05.038.
- Semieniuk et al. (2022) G. Semieniuk, P. B. Holden, J.-F. Mercure, P. Salas, H. Pollitt, K. Jobson, P. Vercoulen, U. Chewpreecha, N. R. Edwards, and J. E. Viñuales. Stranded fossil-fuel assets translate to major losses for investors in advanced economies. Nature Climate Change, 12(6):532–538, 2022. 10.1038/s41558-022-01356-y.
- Steffen et al. (2022) B. Steffen, V. Karplus, and T. S. Schmidt. State ownership and technology adoption: The case of electric utilities and renewable energy. Research policy, 51(6):104534, 2022. 10.1016/j.respol.2022.104534.
- Tong et al. (2019) D. Tong, Q. Zhang, Y. Zheng, K. Caldeira, C. Shearer, C. Hong, Y. Qin, and S. J. Davis. Committed emissions from existing energy infrastructure jeopardize 1.5°C climate target. Nature, 572(7769):373–377, 2019. 10.1038/s41586-019-1364-3.
- Unruh (2000) G. C. Unruh. Understanding carbon lock-in. Energy Policy, 28(12):817–830, 2000. 10.1016/S0301-4215(00)00070-7.
- von Dulong (2023) A. von Dulong. Concentration of asset owners exposed to power sector stranded assets may trigger climate policy resistance. Nature Communications, 14(1):6442, 2023. 10.1038/s41467-023-42031-w.
- Way et al. (2022) R. Way, M. C. Ives, P. Mealy, and J. D. Farmer. Empirically grounded technology forecasts and the energy transition. Joule, 6(9):2057–2082, 2022. 10.1016/j.joule.2022.08.009.
- Zhou et al. (2021) X. Zhou, C. Wilson, and B. Caldecott. The energy transition and changing financing costs. Technical report, Smith School of Enterprise and the Environment, University of Oxford, 2021. URL https://www.smithschool.ox.ac.uk/sites/default/files/2022-02/The-energy-transition-and-changing-financing-costs.pdf.