Exploring Offline Pileup Correction to Improve the Accuracy of Microdosimetric Characterization in Clinical Ion Beams
Abstract
Objective:
Microdosimetry investigates the energy deposition of ionizing radiation at microscopic scales, beyond the assessment capabilities of macroscopic dosimetry. This contributes to an understanding of the biological response in radiobiology, radiation protection and radiotherapy. Microdosimetric pulse height spectra are usually measured using an ionization detector in a pulsed readout mode. This incorporates and a charge-sensitive amplifier followed by a shaping network. At high particle rates, the pileup of multiple pulses leads to distortions in the recorded spectra. Especially for gas-based detectors, this is a significant issue, that can be reduced by using solid-state detectors with smaller cross-sectional areas and faster readout speeds. At particle rates typical for ion therapy, however, such devices will also experience pileup. Mitigation techniques often focus on avoiding pileup altogether, while post-processing approaches are rarely investigated.
Approach:
This work explores pileup effects in microdosimetric measurements and presents a stochastic resampling algorithm, allowing for offline simulation and correction of spectra. Initially it was developed for measuring neutron spectra with tissue equivalent proportional counters and is adapted for the use with solid-state microdosimeters in a clinical radiotherapy setting.
Main results:
The algorithm was tested on data acquired with solid-state microdosimeters at the MedAustron ion therapy facility. The successful simulation and reduction of pileup counts is achieved by establishing a limited number of parameters for a given setup.
Significance: The presented results illustrate the potential of offline correction methods in situations where a direct pileup-free measurement is currently not practicable.
1 Introduction
Microdosimetry is concerned with the assessment and description of the energy deposition of ionizing radiation in microscopic sites. This is of particular interest in the context of ion therapy, given the complicated interplay of different energy loss mechanisms for high linear energy transfer (LET) radiation. Ion therapy uses charged particles, such as protons and carbon ions, to irradiate tumors with high precision. Due to the targeted energy deposition, adverse effects on healthy tissue can be reduced. This requires a detailed planning of the treatment in advance. Radiation quality is currently considered in clinical treatment planning systems as the dose averaged LET, [Hagiwara_2020_LETd]. However, is a purely calculated quantity and is susceptible to significant disparities. The values between different treatment centers show notable deviations due to the use of disparate methodologies and varying degrees of reporting [Kalholm_2021_LET, Hahn_2022_LET]. Moreover, even a precisely known LET may be insufficient in predicting clinical outcomes. Recent studies indicate that different radiation qualities may result in a different radio biological effectiveness (RBE) despite featuring identical . Microdosimetry could serve as a more accurate predictor of radiobiological outcomes by incorporating the whole energy deposition spectrum into radiobiological modeling [Guan_2024_uDos, Magrin_2023_State_of_the_Art].
Microdosimetric data is typically obtained in the form of energy deposition spectra using a spectroscopic readout chain for pulse height analysis [Parisi_2022_uDos_Review, ICRU_98_Microdosimetry]. Following a particle crossing in a proportional counter or solid-state detector, the signal charge is integrated using a charge-sensitive preamplifier. It is further shaped by a feedback network to improve the signal-to-noise ratio (SNR), and consequently digitized using a multi channel analyzer (MCA). This allows for measuring the energy imparted, , per event. The measured value is then divided by the mean chord length of the sensitive volume crossed, to obtain the lineal energy . The mean chord length is defined as the mean distance a particle travels when traversing the sensitive volume. The lineal energy serves as an indicator for the radiation quality at a given point in space.
The objective of microdosimetry is to quantify the pattern of energy deposition at the microscopic scale. This inherently involves measuring small signal charges, necessitating the use of low noise electronics to ensure sufficient resolution. On the other hand, low noise electronics typically require shaping times on the order of microseconds [Bertuccio_2023_Electronic_Noise] and thus are susceptible for pileup at high particle rates, impeding an accurate energy measurement. In the field of microdosimetry, gas-based tissue equivalent proportional counters (TEPCs) have historically been the primary instrument of choice. Solid-state devices offer faster readout speeds and smaller cross-sectional areas , therefore reducing pileup [Rosenfeld_2002_uDos_Hadrontherapy]. However, in clinical ion beams with particle rates on the order of [ICRU_93_Proton_Therapy], even these small-scale microdosimeters will experience significant pileup.
As pileup does not have any physical significance in microdosimetric measurements, it should be reduced as much as possible to yield accurate single-particle energy deposition spectra. Under ideal conditions, a single particle entering the sensitive volume of the detector generates a charge cloud along its track, which is rapidly collected at the electrodes, forming a delta-like current pulse. It is amplified into a shaped pulse and digitized by the readout electronics before the next event occurs. Pileup can originate either during the charge collection in the detector (detector pileup) or as a feature of the electronic processing (pulse pileup). In the following, only pulse pileup will be discussed, assuming the fast readout speeds achieved with depleted solid-state detectors. This refers to the partial or complete overlap of two or more shaped voltage pulses generated by individually detected particles.
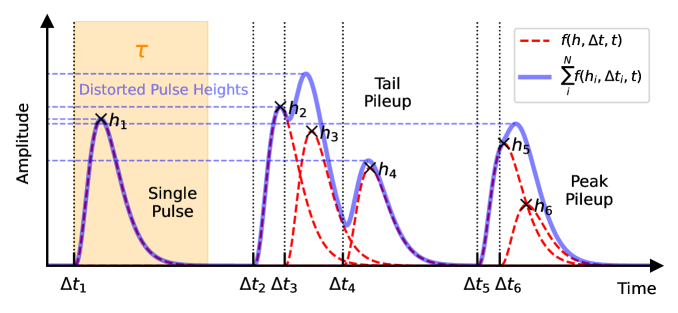
Pulse pileup is sketched in figure 1. Peak pileup refers to the complete overlap of two or more events into a single registered pulse. In a spectrum containing distinct lines, peak pileup is most evident by the formation of double sum peaks. In extreme cases, even higher-order random sum peaks can be observed [Blatt_1975_Sum_Peaks]. Tail pileup refers to the overlap of pulses with inter-arrival times below the shaped pulse rise time. Individual events can still be resolved, but depending on their sequence and type of shaping this manifests as a broadening and skewing of the spectrum. In practice, a combination of both effects is observed, resulting not only in distortions of the spectrum, but also the appearance of artificial features or even a shift of the whole spectrum in severe cases.
Pileup correction is a complex undertaking, that despite the best efforts will never be able to perfectly remove corrupted counts. It is thus recommended that efforts are made to prevent pileup online during the measurement, whenever possible. A trivial solution is to lower the effective particle rate arriving at the detector by either lowering the cross section or modifying the dose rate. Modifying the particle flux from the accelerator is not always feasible and especially when using microdosimetry as a characterization tool for clinical ion beams, the measurement of the radiation field should remain faithful to clinical dose rates. At present, most microdosimetric setups are not equipped to measure pileup-free spectra in a high dose-rate clinical settings.
A number of approaches have been put forth in various scientific disciplines to circumvent or correct pileup in spectroscopic measurements [Mohammadian_2020_Review_Pileup_Correction]. Many spectroscopy systems employ a pileup-rejection scheme based on splitting the signal onto two channels after the preamplifier. A fast channel optimized for timing measurements identifies pulse arrival times and the slow channel prepares the signal for high resolution pulse height measurement with correspondingly long integration times. A delay line in the slow channel enables the fast signals to gate the acquisition in the event of pileup [Bertolini_1964_Pileup_Circuit]. Such a discrimination circuit can be further enhanced by incorporating digital pulse processing [Redus_2006_AMPTEK] or discriminating by pulse shapes [Jordanov_2018_Shape_Discrimination, Glenn_2021_Shape_Discrimination]. Nevertheless, at exceedingly high rates, these methods have proven inadequate for the effective capture of pileup events. A promising approach in advanced pileup rejection can be based on an accurate recovery of arrival times, achieved by signal deconvolution [Gadomski_1992_Deconvolution, Saxena_2020_Deconvolution]. The reconstruction of undistorted pulse shapes from the digitized pulse train has further been the subject of extensive investigation [Drndarevic_1989_Scinti_4, Komar_1993_Scinti_5, Scott_2005_Scinti_1, Belli_2008_Scinti_3, Trigano_2015_general_algo, Scoullar_2011_general_algo], also including machine learning methods [Jeon_2022_Deep_Learning, Kim_2023_Deep_Learning]. However, it should be noted that some of these algorithms are unable to consider peak pileup and require specific pulse shapes or a high SNR, which cannot be easily achieved for microdosimetric solid-state detectors. Additionally, advanced pileup correction and rejection algorithms are not commercially available, nor are they straightforward to implement.
One initial effort to assess the possibility of offline correction was made by Langen et al. [Langen]. They proposed a stochastic algorithm, utilizing Poisson statistics, to resample the measured counts and subsequently correcting microdosimetric spectra. Since it showed promising results for correcting pileup in neutron data measured with a TEPC, in this work we aim to explore its potential for solid-state microdosimeters in ion beams. The proposed algorithm potentially offers a quick and straightforward approach to model pulse pileup and to correct pulse pileup occurring during analog processing. The method can be achieved using a conventional analog spectroscopic readout chain without digital signal processing.
2 Materials & Methods
Assuming Poisson-distributed inter-arrival times, the probability of two or more events adding up to a single detected event can be derived similar to the dead time behavior of a pulsed readout system [Knoll]. Instead of the dead time, which is assumed negligible, the statistics focus on the number of events occurring during the pileup resolution time . This parameter represents the minimum required separation between two registered events in time, to not being classified as pileup. A spectroscopic readout chain is best modeled as a non-paralyzable system, meaning that the arrival of new particles within does not extend the pileup resolution time of the initial pulse. The probability of observing pulses within this interval at an effective average particle rate is given by
| (2.1) |
It follows, that the total pileup probability , i.e. two or more events in a count , can be given as a function of rate and resolution time . Together, they form the pileup magnitude . Equation (2.1) allows for an estimate of the pulse pileup expected in a particle beam with Poisson distributed arrival times. A square slab detector centered in the beam encounters an average effective particle rate . For a Gaussian transversal distribution of particles, the effective particle rate can be calculated from the total particle rate and the ratio of the intensity arriving at the sensitive volume to the total intensity over the whole beamspot . The intensities are in turn calculated from the beam spot size and the side length of the detector as
| (2.2) |
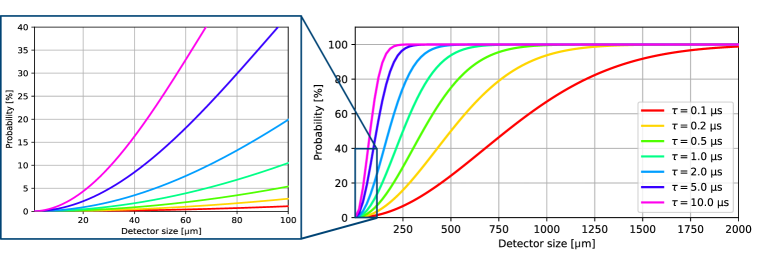
Figure 2 shows the result for a situation representative of the proton and carbon-ion beams at the MedAustron facility [Grevillot_2020_MedAustron_Commissioning] with a particle rate of on a Gaussian beamspot of full width at half maximum (FWHM) [Ulrich_Pur_2021_Commissioning, Grevillot_2018_MAUS]. Even with small cross-sectional areas and short shaping times, pileup remains a concern for state-of-the-art microdosimeters. Due to intensity fluctuations and particle bunching, non-Poissonian ripples in the rate distribution are expected in a real beam, which leads to a further increase in the probability of pileup [DeFranco_2021_MAUS_Intensity, Waid_2024].
A resampling algorithm can be used to simulate the effect of pileup in microdosimetric spectra [Langen]. For this, pulse height analysis is modeled in the time domain as a twofold random process. events with random pulse heights are separated by random time intervals , as shown in figure 1. Due to shaping, each event yields a similar pulse shape , differing only in amplitude . The individual signals add up to a continuous pulse train to be digitized. In a first step, the respective probabilities for pileup of different order are calculated according to equation (2.1), with the parameters and known in advance. These probabilities are then multiplied by the total number of counts in the spectrum to determine the number of affected events. Unaffected counts are directly transferred to the output histogram, while affected pulse heights are randomly sampled from their frequency distribution. Depending on the order of pileup, tuples of events are grouped together and their individual offsets in time are sampled within from the first pulse in the tuple. Next, the sum of the pulses per group is calculated by superposing the unit pulse shapes scaled with the corresponding sampled pulse heights. The unit pulse refers to the output of the shaping network normalized in height. A popular choice for pulse shaping are or "semi-Gaussian" shaping circuits, due to their relatively high SNR and short tail pulses [Radeka]. At equal time constants , the semi-Gaussian waveforms can be described as
| (2.3) |
By adding stages the pulse becomes more symmetrical until it converges into a Gaussian shape. For commercial analog shapers, the shaping circuit might not be a simple circuit and the waveforms are difficult to describe analytically. As a result, their characteristics must be determined using an oscilloscope. In the end, peak heights are determined from the sum, allowing for the simulation of both peak and tail pileup with the possibility of peaks being completely buried. The distorted pulse heights are transferred to the output histogram.
As demonstrated by Langen et al [Langen], the simulation of pileup can be used to correct spectra:
-
1.
Using the algorithm described above, further pileup is simulated into the spectrum in question with a given and . is given by the unit pulse shape. is either determined from prior analysis, estimated as the effective rate expected in this measurement or set to a small value () for iterative correction.
-
2.
After pileup simulation using these parameters, the bin-wise difference between the measured input spectrum and the simulation output spectrum, the pileup vector, is calculated.
-
3.
The pileup vector is subsequently subtracted from the input spectrum, thereby providing an improved guess for the pileup-free version of the given spectrum.
If the pileup parameters and have been previously determined, sufficient correction can be achieved in one cycle (single step). Should this not be the case, an iterative correction process is started, repeating the steps above. If one has access to a pileup-free spectrum, the process is then repeated until convergence with this "ideal" spectrum. Convergence can be estimated using a least-squares difference between the respective input and output spectra. Once and the unit pulse shape have been established for a given setup, future spectra can be corrected using the same parameters.
The algorithm was tested using data taken at the MedAustron facility. Microdosimetric spectra were acquired using the same acquisition chain and the same radiation quality but at different particle rates. This ensures, that differences in the shapes of the spectra can only be attributed to pileup. The readout chain consisted of an Amptek CoolFET (A250CF) charge sensitive preamplifier with an ORTEC 671 spectroscopic shaping amplifier and an ORTEC 928 MCB multichannel analyzer. The shaping amplifier features a sophisticated pileup rejection circuit employing fast-slow channel discrimination and a secondary rejection logic. The detector was a \qtyproduct200 x 200 x 2\micro\cubed diamond microdosimeter [Verona_2018_Diamond, Magrin_2020_Diamond_Measurements]. Reverse bias was supplied using a Rhode & Schwarz HCM8043 bench-top power supply via a bias-tee integrated into the preamplifier. The unit pulse shape was determined as a Gaussian pulse with a time constant of and via least squares fitting of waveforms acquired using an oscilloscope, while signals were applied to the test input of the preamplifier. Microdosimetric spectra were obtained using ,0,0,,,