Mask Enhanced Deeply Supervised Prostate Cancer Detection on B-mode Micro-Ultrasound
Abstract
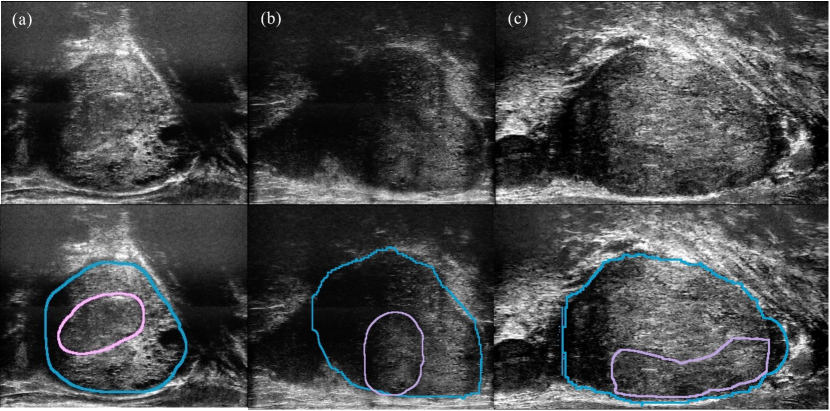
Background: Prostate cancer is a leading cause of cancer-related deaths among men. Accurate detection of prostate cancer on radiology images is essential for early diagnosis, facilitating guidance for prostate biopsies and subsequent treatment planning. The recent development of high frequency, micro-ultrasound imaging offers improved resolution compared to conventional ultrasound and potentially a better ability to differentiate clinically significant cancer from normal tissue. However, the features of prostate cancer remain subtle, with ambiguous borders with normal tissue and large variations in appearance, making it challenging for both machine learning and humans to localize it on micro-ultrasound images.
Purpose: We sought to develop a comprehensive pipeline to process micro-ultrasound images and segment clinically significant prostate cancer on Brightness (B)-mode micro-ultrasound. To address the challenges associated with this task, we propose a novel Mask Enhance Deeply-supervised Micro-US network, termed MedMusNet, to automatically and more accurately segment prostate cancer to be used as potential targets for biopsy procedures.
Methods: We used Magnetic Resonance Images (MRI) as reference to label micro-ultrasound exams, by mapping the pathology-confirmed radiology lesions onto the pseudo-sagittal plane of the micro-ultrasound. These labels were further refined by an expert clinician to match the micro-ultrasound image information. Our study included 64 men, 22 with normal or indolent cancer (ISUP Grade group 1) and 42 with clinically significant prostate cancer (Grade Group ).
To ensure the topology consistency between 2D frames, we developed MedMusNet which takes as input only the B-mode micro-ultrasound images, detects and segments clinically significant cancer. MedMusNet leverages predicted masks of prostate cancer to enforce the learned features layer-wisely within the network, reducing the influence of noise and improving overall consistency across frames.
Results: MedMusNet successfully detected 76% of clinically significant cancer with a Dice Similarity Coefficient of , significantly outperforming the baseline Swin-M2F in specificity and accuracy (Wilcoxon test, Bonferroni correction, ). While the lesion-level and patient-level analyses showed improved performance compared to human experts and different baseline, the improvements did not reach statistical significance, likely on account of the small cohort.
Conclusion: We have presented a novel approach to automatically detect and segment clinically significant prostate cancer on B-mode micro-ultrasound images. Our MedMusNet model outperformed other models, surpassing even human experts. These preliminary results suggest the potential for aiding urologists in prostate cancer diagnosis via biopsy and treatment decision-making.
I Introduction
Prostate cancer is the second leading cause of cancer-related death among men in the United States siegel2024cancer . Early diagnosis significantly improves the 5-year survival rate for prostate cancer islami_annual_2021 . Currently, the standard diagnostic method for prostate cancer is histopathology analysis of samples obtained from ultrasound-guided prostate biopsies sarkar2016review . However, due to the subtle features of prostate cancer on ultrasound images, ultrasound-guided biopsies are typically systematic, involving uniform sampling 12-14 regions of the prostate, without targeting suspicious regions as urologists are not confident in identifying lesions on conventional ultrasound harvey2012applications . Such blind systematic biopsies can miss 27-52% cancers while carrying biopsy-related morbidities, e.g., pain, infection, sepsis loeb2013systematic ; ahmed2017diagnostic . While Magnetic Resonance images (MRI) provide superior soft tissue contrast allowing the more reliable identification of prostate cancerahmed2017diagnostic , MRI often remains inaccessible due to its prohibitive cost and lack of access. Consequently, 64% of patients undergo biopsy relying solely on conventional ultrasoundSoerenson_Trends_2024 . Therefore, it is highly desirable to directly identify biopsy targets while balancing accuracy, efficiency, access, and cost-effectiveness.
Recently, micro-ultrasound imaging has emerged as a promising imaging technology for the prostate rohrbach2018high , offering improved resolution compared to conventional ultrasound (Fig. 1). Micro-ultrasound was shown to have high sensitivity in detecting prostate cancer and in some studies similar accuracy as MRI sountoulides2021micro ; dias2022multiparametric . However, its interpretation remains challenging, with urologists having only 30% agreement in localizing clinically significant lesions zhou_inter-reader_2024 with a sensitivity of 66%. Such interpretation shortcomings may be remediated by using artificial intelligence methods, that have shown great promise in detecting prostate cancer on MRI saha_end–end_2021 ; seetharaman_automated_2021 ; bhattacharya_corrsignia_2021 ; saha_artificial_2024 .
Deep learning methods have revolutionized medical image segmentation, achieving impressive performance across various tasks lecun2015deep ; litjens2017survey . Numerous automatic prostate cancer segmentation and detection methods exist across different imaging modalities, e.g. MRI ozer2010supervised ; duran2022prostattention , MRI-pathology bhattacharya2022selective , temporal-enhanced ultrasound moradi2008augmenting , or conventional ultrasound rusu_procusnet_2024 . However, detecting prostate cancer on micro-ultrasound is challenging, and recent studies focused on using raw data (radio-frequency ultrasound signal), and weak labels offered by the biopsy without precise localization of cancer. Gilany et al. gilany2022towards proposed a deep model based on co-teaching han2018co that improves the robustness of the approach to the label noise and employed an evidential deep learning method for uncertainty estimation. To address the issue of labeled data scarcity, Wilson et al. wilson2023self utilized a self-supervised learning method bardes2021vicreg to extract features from large volumes of weakly labeled micro-ultrasound data. Their approach relied on transfer learning and detected cancer in the needle track using Radio-frequency ultrasound data from 1028 biopsy cores (n=391 subjects from two centers). Building on this approach, Gilany et al. gilany2023trusformer utilized a similar method as a feature extractor and treated a set of regions of interest (ROIs) as a single biopsy core. They employed multiple instance learning dietterich1997solving ; ilse2018attention to aggregate ROI features and predict the tissue type for the entire biopsy core. Recently, foundation models were also utilized to facilitate the classification of prostate cancer on the needle track wilson_prostnfound_2024 . However, these methods rely solely on weak labels provided by the biopsy to the rectangular region encompassing the biopsy needle and typically frame the cancer detection problem as a classification within selected small ROI that lie within the needle track. Consequently, while these methods can confirm the presence of cancer in a selected region, they fail to automatically and accurately localize cancer across the entire regions of micro-ultrasound images, potentially limiting their diagnostic utility, especially in providing targets for the biopsy.
Recently, a few studies have shown the utility of B-mode micro-ultrasound, either in segmenting the prostate jiang_microsegnet_2024 or in creating ground truth labels of prostate cancer in patients undergoing radical prostatectomy by registering histopathology images into pseudo-whole mounts and subsequently onto micro-ultrasound imran_image_2023 . While the later approach can provide accurate cancer outlines for training AI models, it remains restricted to patients who undergo surgery, which all have clinically significant cancer confirmed by biopsy prior to the surgery.
Prostate cancer detection on micro-ultrasound images remains challenging for three reasons. First, micro-ultrasound captures series of 2D images in the pseudo-sagittal plane, whereas conventional processing, including expert annotation, is typically performed in the axial plane on MRI or whole mount histopathology images. This can make expert annotation of cancer in micro-ultrasound images laborious and error-prone. Second, micro-ultrasound images have speckle noise and artifacts caused by calcification and anatomic boundaries. Third, the appearance of cancer in micro-ultrasound images is highly heterogeneous often having indistinguishable borders with normal tissues (Fig. 1).
In this study, we developed a comprehensive pipeline to process micro-ultrasound images acquired in 2D pseudo-sagittal planes, and label clinically significant prostate cancer to allow the training of Artificial Intelligence (AI) methods on Brightness (B)-mode ultrasound. We introduced a novel Mask Enforced Deeply-supervised Micro-UltraUtrasound network, termed MedMusNet, to automatically and more accurately segment clinically significant prostate cancers as potential targets for biopsy procedures. The contributions of our work can be summarized as follows:
-
1.
We developed a comprehensive pipeline to process acquired micro-ultrasound images, facilitating expert annotations of prostate cancer both in the cartesian and cylindrical micro-ultrasound space.
-
2.
We proposed a novel mask-enhanced deep supervision mechanism that enhances the learned features layer-wisely within the network, thereby alleviating the adverse effects of image noise and improving the quality of the final segmentation.
-
3.
We extensively evaluated our method on a micro-ultrasound dataset and demonstrated superior performance compared to existing models and human readers both at Dice Similarity score and clinically focused pixel-level and lesion-level evaluations.
II Methods
II.1 Population Characteristics
Cohort: We conducted an Institutional Review Board (IRB)-approved prospective collection of micro-ultrasound images from patients undergoing both diagnostic micro-ultrasound and subsequent conventional ultrasound-MRI fusion guided biopsy. The study included patients who underwent both MRI and micro-ultrasound procedures at Stanford University from 2022 to 2023. All patients underwent trans-perineal targeted biopsy of lesions with PI-RADS v2.1 scores 3. A 12-14-core systematic biopsy was performed to complement the targeted biopsy.
Micro-ultrasound acquisition: Our dataset comprises 2D micro-ultrasound images. During the micro-ultrasound scanning process, sequential 100 to 200 2D images were captured in a trans-rectal rotational manner. The 2D image size was and the image spacing was .
MRI acquisition: The subjects included in this study, underwent 3 Tesla Magnetic Resonance Imaging (MRI) of the prostate prior to the biopsy. The exam included multiple sequences, T2 weighted MRI, Diffusion Weighted imaging, and the derived Appearance Diffusion Coefficient, Dynamic Contrast Enhance MRI and were interpreted as part of clinical care by board-certified radiologists.
MRI Labels: Radiologists outline cancer on MRI for clinical care (PIRADS Scores ), to guide the conventional ultrasound-MRI fusion guided biopsy. The ground truth was cross-referenced by a urologist (SZ) and genitourinary radiologist (MH) jointly. They annotated areas on micro-ultrasound corresponding to biopsy-proven ISUP Grade Group (GG) 2 prostate cancer using 3D Slicer fedorov20123d .
Multi-reader Labels: In a previous study zhou_inter-reader_2024 we investigated the inter-reader variability of six urologists (four institutions) interpreting micro-ultrasound (a subset of our cohort). All had completed a comprehensive online micro-ultrasound training program on the PRI-MUS protocol ghai2016assessing . They were provided with image stacks for all patients and asked to annotate any suspicious lesions (PRI-MUS score 3) using 3D Slicer.
| Variable | Median/Value | IQR/percentage |
|---|---|---|
| Number of Subjects | 64 | |
| Number of Clin. Sign. Cancer | \colorred51 | |
| Age | 69 | (61-73) |
| PSa (ng/mL) | 6.1 | 4.9-8.7 |
| Prostate Volume (cm3) | 42.0 | 33.0-52.3 |
| Number of Frames | 151 | 127-192 |
| Patient Grade Group | ||
| 0 | 9 | 14.1% |
| 1 | 13 | 20.3% |
| 2 | 18 | 28.1% |
| 3 | 15 | 23.4% |
| 4 | 2 | 3.1% |
| 5 | 7 | 10.9% |
| Reference Lesion Count | ||
| 0 | 22 | 34.4% |
| 1 | 34 | 53.1% |
| 2 | 7 | 10.9% |
| 2 | 1 | 1.6% |
| Reference lesion location | ||
| Anterior | 20 | 31.3 |
| Posterior | 44 | 68.8 |
II.2 Pre-processing
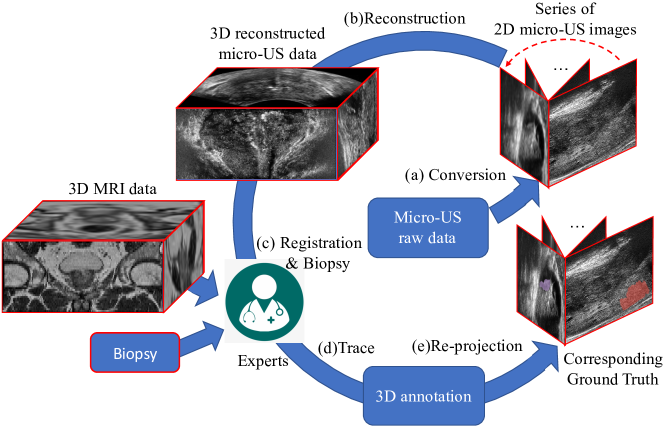
The primary goal of data preprocessing is to accurately label prostate cancer in the native (cylindrical - pseudo-sagittal) coordinates of the micro-ultrasound images using biopsy-confirmed lesions originally outlined on MRI by radiologists. We developed a preprocessing pipeline involving several steps (Figure 2):
- Step (a):
-
Step (b):
We reconstructed the series of 2D pseudo-sagittal micro-ultrasound images imran_image_2023 into the 3D Cartesian coordinates to facilitate spatial co-registration with MRI, a reference space where radiologists provide lesions targeted by the biopsy.
-
Step (c):
Manual Registration of the reconstructed micro-ultrasound images and MRI using affine transformations in 3D Slicer fedorov_3d_2012
-
Step (d):
Expert clinician (SZ) delineates prostate cancer area using the MRI label reference (Section II.2.2).
-
Step (e):
Re-project the generated 3D cancer labels onto the 2D pseudo-sagittal micro-ultrasound images to serve as the ground truth for training AI models.
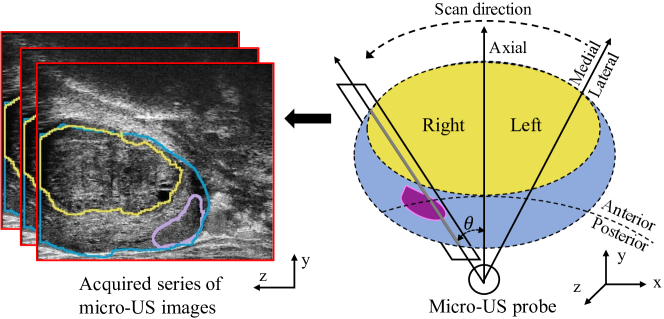
II.2.1 Image Acquisition
The micro-ultrasound images of the prostate were obtained using the ExactVu transrectal micro-ultrasound system (Exact Imaging Inc., Markham, ON, Canada). During the prostate scanning process, the transrectal imaging probe was kept stationary in the cranial-to-caudal orientation and rotated from left to right, capturing a series of 100-300 micro-ultrasound 2D images (Figure 3). These images were positioned in the pseudo-sagittal oblique plane and separated by the rotation angle . After the scan acquisition, the raw B-mode data were converted to a 0-255 range B-mode image and exported into a DICOM series using a customized MATLAB script. The rotation angle of each image was stored as the slice location in the DICOM file to facilitate subsequent reconstruction.
II.2.2 Image Annotation
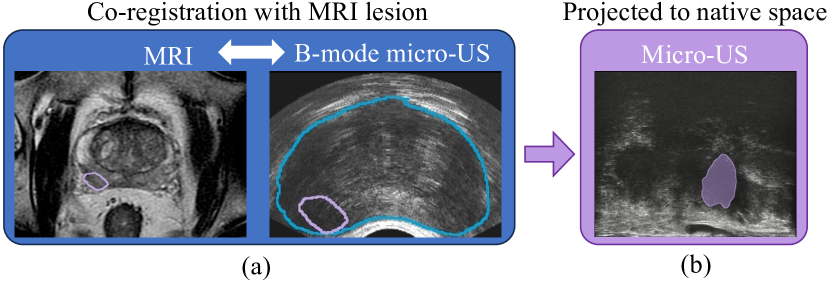
The creation of ground truth labels for clinically significant cancer can be challenging due to the subtle differences between cancer and normal tissues, and the shadowing artifacts caused by calcification and anatomic boundaries. To address these challenges, our pre-processing pipeline used MRI, and corresponding biopsy-confirmed radiologist lesions. This facilitates the identification of suspicious lesions and the generation of strong labels in micro-ultrasound images. To establish pixel correspondences between the MRI and micro-ultrasound, we developed a reconstruction algorithm that enables forward and backward projections between the cylindrical sagittal plane of the native micro-ultrasound images and the Cartesian coordinates of MRI. Consequently, the MRI can be reliably registered to the reconstructed B-mode micro-ultrasound volume (Figure 2 Steps b-c). The micro-ultrasound images, biopsy pathology and MRI results were cross-referenced by a urologist and a genitourinary radiologist to annotate areas on the B-mode micro-ultrasound volumes corresponding to biopsy-proven grade group (GG) prostate cancer (Figure 2 Step d). Finally, the cancer labels were projected onto the native pseudo-sagittal micro-ultrasound images using the backward reconstruction (Figure 2 Step e, Figure 4).
II.3 MedMusNet Architecture
MedMusNet consists of a classical 3D UNet-like backbone cciccek20163d , a mask-enhanced module, and a multi-scale deep supervision module (Figure 5). Similar to the standard UNet, the backbone includes an encoder (left side) and a decoder (right side) each with multiple resolution layers. Each encoder layer comprises two convolutions followed by an instance norm (IN) unit and a leaky rectified linear unit (LReLU). Instead of the conventional fixed pooling operator, a convolution operator with a stride of two is used at each downsampling step to facilitate more effective feature learning. Each decoder layer contains a 3D transposed convolution operator (ConvTransposed) with a stride of two for upsampling, followed by a concatenation and two convolutions, each succeeded by an IN unit and a LReLU. Shortcut connections provide cropped high-resolution feature maps from the encoder to the corresponding up-sampled features from layers of equal resolution in the decoder. In the last layer, a convolution unit reduces the number of output channels to match the number of labels and a softmax unit outputs the final probability map.
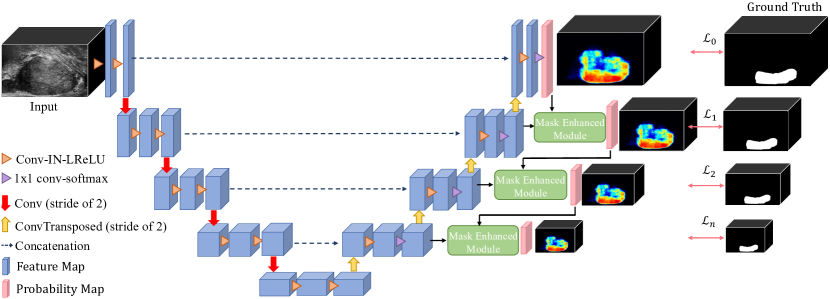
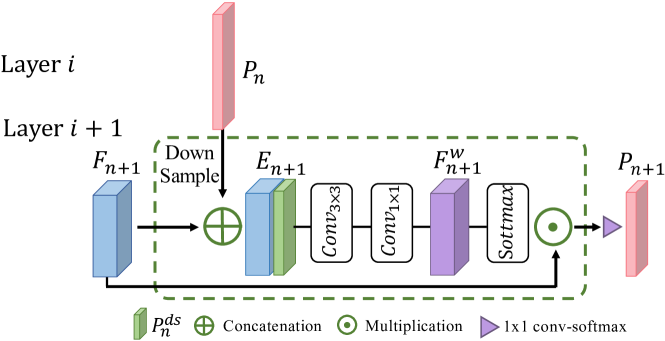
However, the direct segmentation output from the backbone is often insufficiently precise and exhibits erroneous localization of lesions (e.g., over-segmentation outside the prostate), particularly in micro-ultrasound images that routinely incorporate speckle and artifacts. To mitigate the influence of noise and improve the segmentation accuracy, we proposed the Mask Enhanced Module (MEM) and incorporated the multi-scale deep supervision. The mask-enhanced module concatenates the probability map from an intermediate layer with the high-resolution probability map from an upper layer in the decoder, aiming to incorporate the spatial constraints from a larger receptive field for better supervision (Figure 6). Moreover, the lower-scale features encompassing global information are effective integrated into the higher-scale features which include local contextual details, leading to a reduction in the impact of background noise and an enhanced emphasis on foreground features. Specifically, for the probability map, at the layer , it was first down-sampled into to match the size of the feature map at the layer , where is the batch size, is the number of labels, and , and represent the depth, height and width of a 3D image tensor, respectively. We obtained the feature embedding after the concatenation of and along the channel dimension. A and are then utilized to process to generate attention weight feature , and finally output the probability map at layer :
| (1) | ||||
| (2) | ||||
| (3) |
where denotes element-wise product.
To enhance the ability of the learned features to discriminate normal vs cancer and boost the model’s ability to accurately segment cancer, we utilized deep supervision lee2015deeply at multiple scales of the model. We computed the segmentation loss between the deep supervision output and the corresponding ground truth at each layer in the decoder (Figure 5). Due to the different resolutions of layers in the decoder, the ground truth for each layer is correspondingly down-sampled, and the weights are halved with each decrease in resolution. The loss function combines cross-entropy loss and Dice loss drozdzal2016importance , with the objective to minimize the overall loss , the normalized weighted sum of across all resolutions:
| (4) | ||||
| (5) | ||||
| (6) |
where is the number of layers of the network model, and represent the output and corresponding ground truth at the deep supervision layer (), respectively. This strategy allows the multi-scale deep supervision layers to act as proxies for assessing the quality of features at various levels. They guide the model to prioritize intermediate layers that produce highly discriminative feature maps, ultimately leading to improved performance of the model trained on these features.
II.4 Post-processing
We utilized a series of conventional post-processing methods to remove small false positives, primarily focusing on morphology and connected-component analysis. Initially, a closing operation with a kernel size of three pixels was applied to fill small holes and connect-closely disjoint predicted lesion areas by filling narrow gaps. During connect-component analysis, a threshold of pixels was set, ensuring that minor false positive areas smaller than this threshold were disregarded from the prediction.
II.5 Evaluation metrics
We used the Dice similarity coefficient (DSC) as a measure of the overlap between the segmentation of MedMusNet and the ground truth labels. In response to experts’ clinical needs to perform a more comprehensive evaluation of the performance of MedMusNet, we conducted a lesion and patient-level evaluation that includes the sensitivity, specificity, accuracy, positive predictive values (PPV), negative predictive values (NPV) and F1 score. Outlines from MedMusNet were deemed true positive if there was more than overlap with a ground truth lesion. Unlike lesion-level evaluation which focuses on identifying the individual lesion including multiple foci, patient-level evaluation emphasizes the ability to accurately identify any clinically significant prostate cancer lesion when present. A patient-level accuracy indicates that all ground truth cancer lesions were correctly identified.
II.6 Statistical Analysis
We performed non-parametric Paired Wilcoxon tests with Bonferroni multiple-comparison correction bonferroni_teoria_1936 to compare the sensitivity, specificity, NPV, PPV and Dice coefficients testing differences between our model and the baseline nnUNet or the average for the readers. Moreover, we used the non-parametric unpaired Mann-Whitney U test mcknight_mann-whitney_2010 with Bonferroni multiple-comparison correction to test the differences between the performance of MedMusNet for the anterior and posterior lesions.
II.7 Implementation details and Experimental design
Five-fold cross-validation was used for train and evaluate the performance of the proposed method. Due to the initial resolution discrepancy between axes at the micro-ultrasound images, whose pseudo ’z-size’ and ’z-spacing’ is and in 3D space, respectively, an image patch size of was set during the training of 3D models (i.e., nnUNet 3D, MusNet and MedMusNet) to ensure isotropic feature representation. The training settings included a batch size of 2, the number of layers , a learning rate of with a momentum of , and a weight decay of . Kaiming initialization he2015delving and Adam optimizer kingma2014adam were employed, with the training duration set to epochs. These hyper-parameters were kept consistent across the 3D CNN-based models. For Swin-M2F, we followed the settings of the standard base-sized (Swin-B) model as outlined in liu2021swin ; cheng2022masked . Training and evaluation processes were conducted on an NVIDIA A6000 GPU with 48 GB memory.
We compared the following models/readers across the n=37 subjects that overlap between our study and the one preported in zhou_inter-reader_2024
-
•
Swin-M2F: The model employs the transformer-based Swin-Transformer liu2021swin backbone along with Mask2Former cheng2022masked decoders,
-
•
nnUNet-3D: This represents the well established framework based on the uNet architecture, that optimized the hyperparameters based on the data signatures isensee2021nnu ,
-
•
MusNet: This models uses the MedMusNet Architectures without the mask enhanced module (MEM), which allows us to test the utility of the mask enhance module.
-
•
Readers include the six clinicians that were part of the inter-reader variability study zhou_inter-reader_2024 , and reported results represent average performance metrics zhou2024inter .
III Results
| No. Cases | Sensitivity | Specificity | Accuracy | PPV | NPV | DSC | |
|---|---|---|---|---|---|---|---|
| Swin-M2F | 64 | 0.61 | 0.88 | 0.87 | 0.24 | 0.99 | 0.283 |
| nnUNet-3D | 64 | 0.69 | 0.92 | 0.92 | 0.25 | 0.99 | 0.236 |
| MusNet | 64 | 0.72 | 0.94 | 0.93 | 0.29 | 0.99 | 0.262 |
| MedMusNet (Ours) | 64 | 0.77 | 0.94 | 0.93 | 0.35 | 0.99 | 0.313 |
| MedMusNet (Ours) | 37 | 0.76 | 0.96 | 0.95 | 0.42 | 0.99 | 0.365 |
| Readers zhou_inter-reader_2024 | 37 | 0.58 | 0.98 | 0.97 | 0.51 | 0.99 | - |
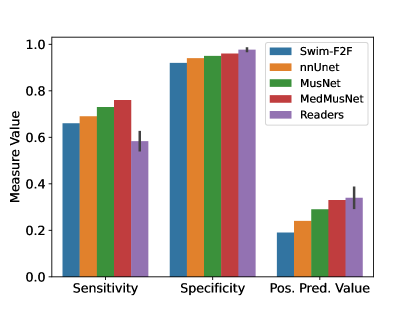
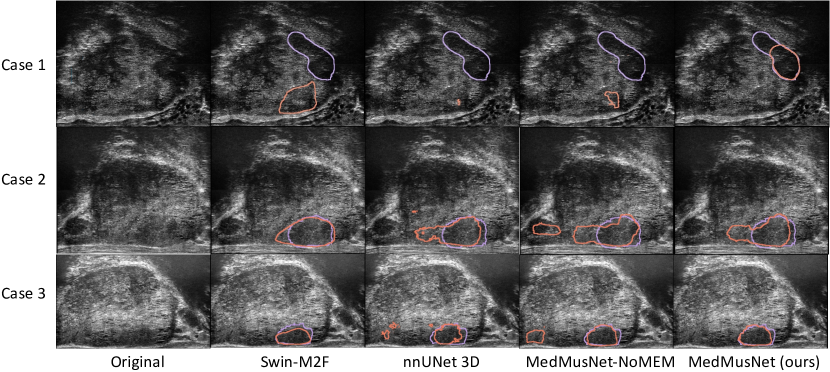
Figure 7 presents the qualitative segmentation results of four different models across three representative cases. For Case 1, the micro-ultrasound scan displayed indistinct lesion patterns and considerable artifacts. Consequently, all models except ours failed to accurately identify the correct region, despite the presence of a large-sized prostate cancer spanning the peripheral and transitional zone. Benefiting from the incorporated mask enhanced module, our method, in contrast, successfully detected the approximate location of the lesion and segments out the major region of the lesion. For Cases 2 and 3, all models demonstrated relative accurate prostate cancer segmentation meanwhile while also displaying instances of over-segmentation and under-segmentation. Although our method exhibited these issues as well, it overall outperformed the other models. Notably, our method corrected major errors in the MusNet model after incorporating MEM, showcasing its accuracy and robustness against artifacts. The comparison between these two models further demonstrated the effectiveness of spatial constraints and multi-scale feature integration provided by the mask-enhanced module, enabling the model to effectively capture image features and focus on challenging regions.
Our MedMusNet model exhibited superior performance in pixel-level clinically significant cancer segmentation compared to the Swin-M2F model and the nnUNet-3D model (Table 2, Supplementary Table S1, Figure 8). DSC improvement from in MusNet to in MedMusNet validates the effectiveness of our proposed mask-enhanced module. The MusNet model achieved overall better performance compared to other models, demonstrating the effectiveness of our network architecture design (Table 2, Supplementary Table S1). The mask-enahnced module helped MedMusNet increase the lesion level PPV (Table 2) and NPV in patient-level evaluation (Supplementary Table S1). It ultimately outperformed the other three models across most metrics. This improvement is also reflected in Figure 7, where our MedMusNet effectively increased the true positive lesions (Case 1) and suppressed the false positive predictions (Cases 2 and 3). Notably, our method demonstrated overall performance close to that of the multiple expert readers and finding more cancers as indicated by the increased sensitivity. This underscores the potential of our method to assist clinicians in accurately localizing prostate cancer during micro-ultrasound-guided biopsy. We compared the proposed model with the baseline Swin-M2F and found statistically significant improvements in specificity and accuracy (Wilcoxon test, Bonferroni correction, p), however statistical differences for the other metrics were not observed.
III.1 Subgroup Analysis
We compared the performance of MedMusNet for Anterior vs Posterior lesions and, while we observe performance improvements as estimated by the lesion level Sensitivity (0.85 vs 0.64) and PPV (0.4 vs 0.26), these differences do not show statistically significant differences. The accuracy was statistically better for posterior lesions compared to anterior lesions (Table 3), suggesting the value of the approach specifically for posterior lesions. Of note, the reader had worse ability to find anterior lesions, and while still models the MedMusNet might still be successful in assisting them in finding more of the anterior lesions.
| Sensitivity | Specificity | Accuracy | PPV | NPV | |
|---|---|---|---|---|---|
| All | 0.77 | 0.94 | 0.93 | 0.35 | 0.99 |
| Anterior | 0.64 | 0.92 | 0.91 | 0.26 | 0.99 |
| Posterior | 0.85 | 0.95 | 0.95 | 0.40 | 1.00 |
IV Discussion
Our study introduced MedMusNet, a deep learning network that successfully detected and outlined the extent of clinically significant cancer on micro-ultrasound, an exciting new high-resolution ultrasound modality. MedMusNet ensures topology consistency in 3D at different resolutions to limit the effect of noise that are common in any ultrasound acquisitions. MedMusNet reliably identified the extent of clinically significant cancer, especially those located in the peripheral zone, improving the overlap with the lesion and sensitivity compared to other models and humans.
While some studies have shown that expert urologists diagnosed the majority of cancers using micro-ultrasound lughezzani2021diagnostic , others have found its performance lower than MRI and plagued by low inter-reader agreement (30% zhou2024inter ). Compared to six experts, MedMusNet had an overall higher sensitivity, detecting 76% lesions vs 58% by readers (but did not reach statistical significance), at the cost of some false positives (0.96 vs 0.98 in lesion-level evaluation, 0.10 vs 0.39 in patient-level analysis). The difference in specificity between lesion- and patient-level evaluations is caused by the challenges in defining negative regions in a way that is comparable to a lesion outlined by clinicians (used for sensitivity calculation). Here we defined the negative regions based on the sectors used during the transperineal biopsy, while also dividing the prostate into the three subregions (apex, mid-gland, base), accounting for a total of 39 regions. While it can be straightforward to find sectors that are negative as ground truth and as MedMusNet predictions, overall at patient-level the MedMusNet has small false positives that make the predictions at patient-level less specific.
Along with the development of MedMusNet, another significant contribution of the current study is the introduction of the comprehensive pipeline to process micro-ultrasound images and create ground truth for clinically significant prostate cancer on micro-ultrasound for patients with prior MRI. While our goal was to develop this approach as a strategy to label clinically significant cancer in the native pseudo sagittal space it may provide useful functionality for micro-ultrasound-MRI fusion-guided biopsy.
Two features distinguish this study from existing methods wilson2023self ; gilany_trusformer_2023 ; wilson_prostnfound_2024 . First, we used B-mode micro-ultrasound images, without requiring radio-frequency data or other raw data which is typically unavailable outside research studies. Second, MedMusNet not only detects but also outlines the extent of clinically significant cancer on micro-ultrasound, unlike prior studies that rely on clinicians to identify regions that can be confirmed to have cancer, limiting its utility for targeting and artificially improving performance metrics.
Our study has three noteworthy limitations. First, the ultrasound images included in our study were collected from a single institution. Future studies will focus on including data from other institutions. Second, the number of cases in this prospective study is limited. Prospective studies are particularly challenging often limiting the number of subjects to be include, and the power of our statistical analysis. While we continue recruiting subjects for our study, these preliminary results are encouraging, suggesting the utility of micro-ultrasound for targeting suspicious lesions. Third, our model has a large number of false positives compared to human experts. While this comes with increased sensitivity, future studies will focus on reducing the number of false positives.
Despite these limitations, our approach holds promise in facilitating the identification of biopsy targets using micro-ultrasound, providing guidance in the absence of MRI, which remains unavailable in as many of 64% of prostate biopsies in the USA Soerenson_Trends_2024 and considerably more globally. While micro-ultrasound is gaining popularity due to its higher resolution, automated lesion identification such as the one provided by MedMusNet will enhance its clinical utility.
V Conclusion
Our approach, MedMusNet successfully detected and segmented clinically significant prostate cancer on micro-ultrasound while taking advantage of mask-enhanced and deep supervision modules to reduce the effect of noise. MedMusNet outperformed alternative approaches, suggesting its clinical utility when assisting experts using micro-ultrasound to guide prostate biopsies or local treatment. Currently, targeting suspicious lesions for prostate cancer is only possible when MRI is available, however, micro-ultrasound combined with detection models like MedMusNet can help provide more readily available alternatives.
VI Acknowledgments
This work was supported by Stanford University (Departments: Radiology, Urology) and by National Cancer Institute, National Institutes of Health (R37CA260346). The content is solely the responsibility of the authors and does not necessarily represent the official views of the National Institutes of Health.
References
- (1) R. L. Siegel, A. N. Giaquinto, and A. Jemal, Cancer statistics, 2024, CA: a cancer journal for clinicians 74, 12–49 (2024).
- (2) F. Islami, E. M. Ward, H. Sung, K. A. Cronin, F. K. L. Tangka, R. L. Sherman, J. Zhao, R. N. Anderson, S. J. Henley, K. R. Yabroff, A. Jemal, and V. B. Benard, Annual Report to the Nation on the Status of Cancer, Part 1: National Cancer Statistics, Journal of the National Cancer Institute , 1648–1669 (2021).
- (3) S. Sarkar and S. Das, A review of imaging methods for prostate cancer detection: supplementary issue: image and video acquisition and processing for clinical applications, Biomedical engineering and computational biology 7, BECB–S34255 (2016).
- (4) C. Harvey, J. Pilcher, J. Richenberg, U. Patel, and F. Frauscher, Applications of transrectal ultrasound in prostate cancer, The British journal of radiology 85, S3–S17 (2012).
- (5) S. Loeb, A. Vellekoop, H. U. Ahmed, J. Catto, M. Emberton, R. Nam, D. J. Rosario, V. Scattoni, and Y. Lotan, Systematic review of complications of prostate biopsy, European urology 64, 876–892 (2013).
- (6) H. U. Ahmed et al., Diagnostic accuracy of multi-parametric MRI and TRUS biopsy in prostate cancer (PROMIS): a paired validating confirmatory study, The Lancet 389, 815–822 (2017).
- (7) S. J. C. Soerensen, S. Li, M. E. Langston, R. E. Fan, M. Rusu, and G. A. Sonn, Trends in pre-biopsy MRI usage for prostate cancer detection, 2007-2022, Prostate Cancer and Prostatic Diseases (2024).
- (8) D. Rohrbach, B. Wodlinger, J. Wen, J. Mamou, and E. Feleppa, High-frequency quantitative ultrasound for imaging prostate cancer using a novel micro-ultrasound scanner, Ultrasound in medicine & biology 44, 1341–1354 (2018).
- (9) P. Sountoulides, N. Pyrgidis, S. A. Polyzos, I. Mykoniatis, E. Asouhidou, A. Papatsoris, A. Dellis, A. Anastasiadis, L. Lusuardi, and D. Hatzichristou, Micro-ultrasound–guided vs multiparametric magnetic resonance imaging-targeted biopsy in the detection of prostate cancer: a systematic review and meta-analysis, The Journal of urology 205, 1254–1262 (2021).
- (10) A. B. Dias, C. O’Brien, J.-M. Correas, and S. Ghai, Multiparametric ultrasound and micro-ultrasound in prostate cancer: a comprehensive review, The British Journal of Radiology 95, 20210633 (2022).
- (11) S. R. Zhou, M. H. Choi, S. Vesal, A. Kinnaird, W. G. Brisbane, G. Lughezzani, D. Maffei, V. Fasulo, P. Albers, L. Zhang, Z. Kornberg, R. E. Fan, W. Shao, M. Rusu, and G. A. Sonn, Inter-reader Agreement for Prostate Cancer Detection Using Micro-ultrasound: A Multi-institutional Study, European Urology Open Science 66, 93–100 (2024).
- (12) A. Saha, M. Hosseinzadeh, and H. Huisman, End-to-end prostate cancer detection in bpMRI via 3D CNNs: Effects of attention mechanisms, clinical priori and decoupled false positive reduction, Medical Image Analysis 73, 102155 (2021).
- (13) A. Seetharaman, I. Bhattacharya, L. C. Chen, C. A. Kunder, W. Shao, S. J. C. Soerensen, J. B. Wang, N. C. Teslovich, R. E. Fan, P. Ghanouni, J. D. Brooks, K. J. Too, G. A. Sonn, and M. Rusu, Automated detection of aggressive and indolent prostate cancer on magnetic resonance imaging, Medical Physics 48, 2960–2972 (2021).
- (14) I. Bhattacharya, A. Seetharaman, C. A. Kunder, W. Shao, C. Leo, S. J. Soerensen, J. Wang, N. Teslovich, R. E. Fan, P. Ghanouni, J. D. Brooks, G. A. Sonn, and M. Rusu, CorrSigNIA: Prostate Cancer Detection and Aggressiveness Grading on MRI using Correlated Feature Learning from Radiology-Pathology Fusion, Medical Image Analysis 75 (2021).
- (15) A. Saha et al., Artificial intelligence and radiologists in prostate cancer detection on MRI (PI-CAI): an international, paired, non-inferiority, confirmatory study, The Lancet. Oncology 25, 879–887 (2024).
- (16) Y. LeCun, Y. Bengio, and G. Hinton, Deep learning, nature 521, 436–444 (2015).
- (17) G. Litjens, T. Kooi, B. E. Bejnordi, A. A. A. Setio, F. Ciompi, M. Ghafoorian, J. A. Van Der Laak, B. Van Ginneken, and C. I. Sánchez, A survey on deep learning in medical image analysis, Medical image analysis 42, 60–88 (2017).
- (18) S. Ozer, D. L. Langer, X. Liu, M. A. Haider, T. H. Van der Kwast, A. J. Evans, Y. Yang, M. N. Wernick, and I. S. Yetik, Supervised and unsupervised methods for prostate cancer segmentation with multispectral MRI, Medical physics 37, 1873–1883 (2010).
- (19) A. Duran, G. Dussert, O. Rouvière, T. Jaouen, P.-M. Jodoin, and C. Lartizien, ProstAttention-Net: A deep attention model for prostate cancer segmentation by aggressiveness in MRI scans, Medical Image Analysis 77, 102347 (2022).
- (20) I. Bhattacharya et al., Selective identification and localization of indolent and aggressive prostate cancers via CorrSigNIA: an MRI-pathology correlation and deep learning framework, Medical image analysis 75, 102288 (2022).
- (21) M. Moradi, P. Abolmaesumi, D. R. Siemens, E. E. Sauerbrei, A. H. Boag, and P. Mousavi, Augmenting detection of prostate cancer in transrectal ultrasound images using SVM and RF time series, IEEE Transactions on Biomedical Engineering 56, 2214–2224 (2008).
- (22) ProCUSNet: Prostate Cancer Detection On B-mode Transrectal Ultrasound Using Artificial Intelligence For Targeting During Prostate Biopsies, Under review (2024).
- (23) M. Gilany, P. Wilson, A. Jamzad, F. Fooladgar, M. N. N. To, B. Wodlinger, P. Abolmaesumi, and P. Mousavi, Towards confident detection of prostate cancer using high resolution micro-ultrasound, in International conference on medical image computing and computer-assisted intervention, pages 411–420, Springer, 2022.
- (24) B. Han, Q. Yao, X. Yu, G. Niu, M. Xu, W. Hu, I. Tsang, and M. Sugiyama, Co-teaching: Robust training of deep neural networks with extremely noisy labels, Advances in neural information processing systems 31 (2018).
- (25) P. F. Wilson, M. Gilany, A. Jamzad, F. Fooladgar, M. N. N. To, B. Wodlinger, P. Abolmaesumi, and P. Mousavi, Self-supervised learning with limited labeled data for prostate cancer detection in high frequency ultrasound, IEEE Transactions on Ultrasonics, Ferroelectrics, and Frequency Control (2023).
- (26) A. Bardes, J. Ponce, and Y. LeCun, VICReg: Variance-invariance-covariance regularization for self-supervised learning, arXiv preprint arXiv:2105.04906 (2021).
- (27) M. Gilany, P. Wilson, A. Perera-Ortega, A. Jamzad, M. N. N. To, F. Fooladgar, B. Wodlinger, P. Abolmaesumi, and P. Mousavi, TRUSformer: improving prostate cancer detection from micro-ultrasound using attention and self-supervision, International Journal of Computer Assisted Radiology and Surgery 18, 1193–1200 (2023).
- (28) T. G. Dietterich, R. H. Lathrop, and T. Lozano-Pérez, Solving the multiple instance problem with axis-parallel rectangles, Artificial intelligence 89, 31–71 (1997).
- (29) M. Ilse, J. Tomczak, and M. Welling, Attention-based deep multiple instance learning, in International conference on machine learning, pages 2127–2136, PMLR, 2018.
- (30) P. F. R. Wilson, M. N. N. To, A. Jamzad, M. Gilany, M. Harmanani, T. Elghareb, F. Fooladgar, B. Wodlinger, P. Abolmaesumi, and P. Mousavi, ProstNFound: Integrating Foundation Models with Ultrasound Domain Knowledge and Clinical Context for Robust Prostate Cancer Detection, in Medical Image Computing and Computer Assisted Intervention – MICCAI 2024, edited by M. G. Linguraru, Q. Dou, A. Feragen, S. Giannarou, B. Glocker, K. Lekadir, and J. A. Schnabel, pages 499–509, Cham, 2024, Springer Nature Switzerland.
- (31) H. Jiang, M. Imran, P. Muralidharan, A. Patel, J. Pensa, M. Liang, T. Benidir, J. R. Grajo, J. P. Joseph, R. Terry, J. M. DiBianco, L.-M. Su, Y. Zhou, W. G. Brisbane, and W. Shao, MicroSegNet: A deep learning approach for prostate segmentation on micro-ultrasound images, Computerized Medical Imaging and Graphics: The Official Journal of the Computerized Medical Imaging Society 112, 102326 (2024).
- (32) M. Imran, B. Nguyen, J. Pensa, S. M. Falzarano, A. E. Sisk, M. Liang, J. M. DiBianco, L.-M. Su, Y. Zhou, W. G. Brisbane, and W. Shao, Image Registration of In Vivo Micro-Ultrasound and Ex Vivo Pseudo-Whole Mount Histopathology Images of the Prostate: A Proof-of-Concept Study, 2023, arXiv:2305.19939 [cs, eess].
- (33) A. Fedorov et al., 3D Slicer as an image computing platform for the Quantitative Imaging Network, Magnetic resonance imaging 30, 1323–1341 (2012).
- (34) S. Ghai, G. Eure, V. Fradet, M. E. Hyndman, T. McGrath, B. Wodlinger, and C. P. Pavlovich, Assessing cancer risk on novel 29 MHz micro-ultrasound images of the prostate: creation of the micro-ultrasound protocol for prostate risk identification, The Journal of urology 196, 562–569 (2016).
- (35) A. Fedorov, R. Beichel, J. Kalpathy-Cramer, J. Finet, J.-C. Fillion-Robin, S. Pujol, C. Bauer, D. Jennings, F. Fennessy, M. Sonka, J. Buatti, S. Aylward, J. V. Miller, S. Pieper, and R. Kikinis, 3D Slicer as an image computing platform for the Quantitative Imaging Network, Magnetic Resonance Imaging 30, 1323–1341 (2012).
- (36) Ö. Çiçek, A. Abdulkadir, S. S. Lienkamp, T. Brox, and O. Ronneberger, 3D U-Net: learning dense volumetric segmentation from sparse annotation, in Medical Image Computing and Computer-Assisted Intervention–MICCAI 2016: 19th International Conference, Athens, Greece, October 17-21, 2016, Proceedings, Part II 19, pages 424–432, Springer, 2016.
- (37) C.-Y. Lee, S. Xie, P. Gallagher, Z. Zhang, and Z. Tu, Deeply-supervised nets, in Artificial intelligence and statistics, pages 562–570, Pmlr, 2015.
- (38) M. Drozdzal, E. Vorontsov, G. Chartrand, S. Kadoury, and C. Pal, The importance of skip connections in biomedical image segmentation, in International workshop on deep learning in medical image analysis, international workshop on large-scale annotation of biomedical data and expert label synthesis, pages 179–187, Springer, 2016.
- (39) C. E. Bonferroni, Teoria statistica delle classi e calcolo delle probabilità, 1936.
- (40) P. E. McKnight and J. Najab, Mann-Whitney U Test, in The Corsini Encyclopedia of Psychology, pages 1–1, John Wiley & Sons, Ltd, 2010.
- (41) K. He, X. Zhang, S. Ren, and J. Sun, Delving deep into rectifiers: Surpassing human-level performance on ImageNet classification, in Proceedings of the IEEE international conference on computer vision, pages 1026–1034, 2015.
- (42) D. P. Kingma, Adam: A method for stochastic optimization, arXiv preprint arXiv:1412.6980 (2014).
- (43) Z. Liu, Y. Lin, Y. Cao, H. Hu, Y. Wei, Z. Zhang, S. Lin, and B. Guo, Swin Transformer: Hierarchical vision transformer using shifted windows, in Proceedings of the IEEE/CVF international conference on computer vision, pages 10012–10022, 2021.
- (44) B. Cheng, I. Misra, A. G. Schwing, A. Kirillov, and R. Girdhar, Masked-attention mask transformer for universal image segmentation, in Proceedings of the IEEE/CVF conference on computer vision and pattern recognition, pages 1290–1299, 2022.
- (45) F. Isensee, P. F. Jaeger, S. A. Kohl, J. Petersen, and K. H. Maier-Hein, nnU-Net: a self-configuring method for deep learning-based biomedical image segmentation, Nature methods 18, 203–211 (2021).
- (46) S. R. Zhou et al., Inter-reader Agreement for Prostate Cancer Detection Using Micro-ultrasound: A Multi-institutional Study, European Urology Open Science 66, 93–100 (2024).
- (47) G. Lughezzani et al., Diagnostic accuracy of microultrasound in patients with a suspicion of prostate cancer at magnetic resonance imaging: a single-institutional prospective study, European urology focus 7, 1019–1026 (2021).
- (48) M. Gilany, P. Wilson, A. Perera-Ortega, A. Jamzad, M. N. N. To, F. Fooladgar, B. Wodlinger, P. Abolmaesumi, and P. Mousavi, TRUSformer: improving prostate cancer detection from micro-ultrasound using attention and self-supervision, International Journal of Computer Assisted Radiology and Surgery 18, 1193–1200 (2023).
VII Supplementary Material
VII.1 Supplementary Tables
| Sensitivity | Specificity | Accuracy | PPV | NPV | |
|---|---|---|---|---|---|
| MedMusNet (Ours) | 0.77 | 0.10 | 0.56 | 0.66 | 0.14 |
| MusNet | 0.76 | 0.00 | 0.53 | 0.63 | 0.00 |
| nnUNet-3D | 0.72 | 0.10 | 0.53 | 0.64 | 0.13 |
| Swin-M2F | 0.68 | 0.18 | 0.53 | 0.65 | 0.20 |
| Readers | 0.66 | 0.39 | 0.58 | 0.73 | 0.31 |