Revisiting constraints on proton PDFs from HERA DIS, Drell-Yan, W/Z Boson production, and projected EIC measurements
Abstract
We present new parton distribution functions (PDFs) at next-to-leading order (NLO) and next-to-next-to-leading order (NNLO) in perturbative QCD, derived from a comprehensive global QCD analysis of high-precision data sets from combined HERA deep-inelastic scattering (DIS), the Tevatron, and the Large Hadron Collider (LHC). To improve constraints on quark flavor separation, we incorporate Drell-Yan pair production data, which provides critical sensitivity to the quark distributions. In addition, we include the latest W and Z boson production data from the CDF, D0, ATLAS, and CMS collaborations, further refining both quark and gluon distributions. Our nominal global QCD fit integrates these datasets and examines the resulting impact on the PDFs and their associated uncertainties. Uncertainties in the PDFs are quantified using the Hessian method, ensuring robust error estimates. Furthermore, we explore the sensitivity of the strong coupling constant, , and proton PDFs in light of the projected measurements from the Electron-Ion Collider (EIC), where improvements in precision are expected. The analysis also investigates the effects of inclusive jet and dijet production data, which provide enhanced constraints on the gluon PDF and .
I Introduction
Deep Inelastic Scattering (DIS) is one of the most thoroughly studied processes in perturbative Quantum Chromodynamics (QCD), as reviewed in Refs. South:2016cmx ; Gross:2022hyw ; Blumlein:2023aso ; Blumlein:2012bf . DIS plays a fundamental role in probing the internal structure of hadrons, particularly in determining parton distribution functions (PDFs), which describe the momentum distribution of quarks and gluons within a hadron Gao:2017yyd . Parton density functions, , are essential for accurate predictions in high-energy physics, especially at colliders such as the CERN Large Hadron Collider (LHC), and future facilities such as the Electron-Ion Collider (EIC) AbdulKhalek:2021gbh ; AbdulKhalek:2022hcn , the Large Hadron Electron Collider (LHeC) LHeC:2020van , and the Future Circular Collider (FCC) FCC:2018byv ; FCC:2018vvp ; FCC:2018bvk .
The upcoming EIC and LHeC are anticipated to enhance PDF determinations significantly by expanding the kinematic range accessible to current experiments. These facilities will enable a more precise extraction of PDFs by providing complementary insights into the proton structure. The EIC is expected to offer critical data in the large region, which HERA was unable to fully explore, while the LHeC will achieve high precision in probing the small region, thereby reducing uncertainties in the gluon and sea quark distributions. However, achieving such precision required for modern experiments presents two primary challenges: missing higher-order QCD corrections in theoretical calculations and inherent uncertainties in the PDFs themselves.
Several global QCD analyses have been carried out by multiple collaborations, including CTEQ-TEA Hou:2019efy ; Ablat:2024muy , NNPDF4.0 NNPDF:2021njg ; Cruz-Martinez:2024cbz , MSHT20 Bailey:2020ooq , and other groups H1:2021xxi ; ATLAS:2021vod ; Alekhin:2024bhs , to address these challenges and improve the PDF determinations. In particular, the CTEQ-TEA collaboration has developed a new generation of general-purpose PDFs to supersede the CT18 set Hou:2019efy , aimed at a wide range of applications, including precision studies of electroweak processes, Higgs production, and searches for physics beyond the Standard Model (BSM).
Recent advancements in PDF determinations have been driven by the inclusion of high-precision data from the LHC. For instance, the NNPDF3.1 set NNPDF:2017mvq was the first to extensively incorporate LHC data, achieving a precision level of 3-5% in PDF uncertainties. The latest NNPDF4.0 set NNPDF:2021njg builds on this by incorporating LHC Run II data at TeV and introducing machine learning techniques to optimize the PDF fitting process. This approach, along with rigorous validation through closure tests, represents a significant leap forward in PDF precision.
The MSHT collaboration introduced the MSHT20 set Bailey:2020ooq , determined through global analyses of available hard-scattering data up to NNLO accuracy. MSHT20 builds on the MMHT14 framework Harland-Lang:2014zoa with extended parameterizations and the inclusion of new datasets, ranging from the final HERA combined data on total and heavy-flavor structure functions to recent LHC measurements of vector boson production, inclusive jets, and top quark production at 7 and 8 TeV. Notable updates include improvements in the valence quark difference and the strange quark PDFs, attributed to new data and updated parameterizations. Additionally, MSHT20 incorporates NNLO corrections for dimuon production in neutrino DIS, leading to reduced uncertainties in key processes such as Higgs and W/Z boson production at the LHC. A recent update from the MSHT collaboration is presented in Ref. Harland-Lang:2024kvt , where they discuss a global closure test of the fixed parameterization approach to PDF fitting.
In this work, we present new PDFs determined at NLO and NNLO accuracy through a comprehensive analysis of high-precision data from the LHC, Tevatron, and the combined HERA DIS datasets. The focus of this study is to maximize the sensitivity of the PDFs by incorporating data from Drell-Yan pair production and W/Z boson production at the Tevatron and LHC, with particular emphasis on the strange quark density, which has been a topic of interest in recent QCD analyses Bailey:2020ooq ; Cooper-Sarkar:2018ufj ; Sato:2019yez . A combined PDF fit integrates all these datasets, providing a thorough examination of the resulting PDFs and their associated uncertainties. Uncertainty estimates are calculated using the Hessian method, ensuring robust uncertainty quantification.
Furthermore, we explore the impact of simulated inclusive DIS data from the EIC AbdulKhalek:2021gbh ; AbdulKhalek:2022hcn on the determination of proton PDFs. The EIC is expected to provide complementary information in the large Bjorken- region, which will be crucial for improving PDF precision at both NLO and NNLO accuracy Armesto:2023hnw ; Cerci:2023uhu . We also estimate the expected experimental uncertainty in the strong coupling constant, , when incorporating simulated EIC inclusive data into the QCD analysis.
Finally, we examine the significant role that jet and dijet production data play in constraining PDFs, particularly the gluon distribution. Jet production data are directly sensitive to the gluon content in the proton, and their inclusion is expected to reduce uncertainties in the gluon PDF and improve the determination of . The impact of such datasets on the precision of is also examined and discussed in this work.
The remainder of this paper is organized as follows: In Sec. II, we outline the theoretical framework used in our analysis, focusing on the key aspects of perturbative QCD and the role of proton PDFs. The datasets employed in this analysis, including those from HERA DIS, Tevatron, and the LHC, are discussed comprehensively in Sec. III. Sec. IV describes the methodology utilized in the global PDF fit, highlighting the statistical tools and techniques used to quantify uncertainties. In Sec. V, we present our main findings, offering an in-depth examination of the impact of different datasets on the resulting PDFs and providing a comparison with previous determinations. This section also explores the influence of simulated inclusive DIS data from the future EIC experiments on the determination of proton PDFs and the precision of . The role of simulated EIC DIS data in proton PDF determination is discussed in Sec. VI. Sec. VII covers the impact of jet and dijet production data on proton PDF determination. A detailed examination of the strange-quark density is provided in Sec. VIII. The effect of simulated EIC and jet production data on the determination of the strong coupling constant, , is discussed in Sec. IX. Finally, Sec. XI offers concluding remarks and suggests future research directions for improving PDF precision and reducing theoretical uncertainties.
II Global QCD Analysis Framework
In this section, we outline the theoretical framework used in our global analysis to extract the proton PDFs from high-energy scattering data. Our analysis relies on QCD factorization theorems, which allow the separation of short-distance perturbative interactions, calculable within perturbative QCD, from long-distance non-perturbative effects encoded in the PDFs Collins:1989gx . This separation ensures that PDFs are universal across different hard-scattering processes, making them indispensable for predicting cross sections at high-energy colliders.
II.1 Factorization in DIS
DIS is a cornerstone in the determination of PDFs. The DIS cross-section is expressed in terms of hadronic structure functions and , which can be written as a convolution of PDFs and perturbatively calculable Wilson coefficients, , at a given scale . Specifically, the structure functions take the form Gao:2017yyd ; Martin:2009iq ; Alekhin:2012ig :
where are the quark and antiquark distributions, and is the gluon distribution. The Wilson coefficients are known up to NNLO for massless quarks, while treatments for massive quarks are implemented through the Variable Flavor Number Scheme (VFNS), allowing for a smooth transition across heavy quark mass thresholds Martin:2009iq .
II.2 Drell-Yan Process
The Drell-Yan process, in which a quark-antiquark pair annihilates into a virtual photon or -boson that subsequently decays into a lepton pair, is another critical process for constraining PDFs. The cross-section for the Drell-Yan process is factorized as Gao:2017yyd ; NuSea:2001idv ; Hamberg:1990np :
| (2) |
where and are the PDFs for quarks and antiquarks, and is the hard-scattering cross-section for the pertinent subprocess. The Drell-Yan process is essential for constraining the sea quark and antiquark distributions, particularly at medium-to-large .
II.3 Electroweak Boson Production
The production of electroweak gauge bosons (W and Z) in hadronic collisions provides powerful constraints on the flavor decomposition of the quark PDFs. The inclusive cross-section for W or Z boson production can be expressed as Gao:2017yyd ; Nadolsky:2004vt :
| (3) |
These processes are sensitive to both quark and antiquark distributions, offering precise constraints on quark flavor separations. The inclusion of high-precision measurements from LHC experiments (e.g., ATLAS and CMS) allows for a more refined determination of the quark PDFs, particularly for the up, down, and strange quarks at low to moderate values.
II.4 Jet Production and Gluon PDF Constraints
Jet production in hadronic collisions provides crucial information about the gluon content of the proton. The cross-section for inclusive jet production can be factorized as Sapeta:2015gee ; Catani:1996vz :
| (4) |
where the partonic subprocess cross-sections include contributions from quark-quark, quark-gluon, and gluon-gluon scattering. Jet data from HERA and the LHC, particularly at high energies, provide important constraints on the gluon distribution. The recent inclusion of NNLO corrections to jet production processes has further reduced theoretical uncertainties and refined the determination of the gluon PDF, especially at low values of Ablat:2024muy .
II.5 Higher-Order Corrections in QCD
The inclusion of higher-order QCD corrections, particularly at NNLO accuracy, is crucial for achieving precise determinations of PDFs. These corrections help to reduce the dependence of cross-sections on factorization and renormalization scales, thus providing more reliable theoretical predictions. At NLO, the gluon PDF receives significant corrections from processes such as and . Moving to NNLO, additional contributions from gluon-gluon and quark-antiquark interactions become relevant. NNLO corrections have been shown to significantly improve the agreement with experimental data, especially for processes dominated by gluons, such as Higgs production via gluon fusion Harlander:2002wh and inclusive jet production. The calculation of NNLO splitting functions and Wilson coefficients allows for more precise DGLAP evolution of PDFs from the initial scale to higher scales relevant for collider processes Bertone:2024dpm . These corrections are particularly impactful in the small regime, where the gluon density rises steeply due to QCD evolution. Incorporating NNLO accuracy thus reduces theoretical uncertainties, especially in regions of phase space where gluon interactions dominate, contributing to improved predictions for hadron collider experiments.
II.6 Heavy quark treatments in QCD Analysis
Heavy quark contributions, particularly from charm and bottom quarks, are treated using the Variable Flavor Number Scheme (VFNS) Martin:2009iq ; Thorne:2006qt ; Alekhin:2012ig . In this scheme, heavy quarks are produced perturbatively at energies above their mass thresholds. This approach allows for smooth matching of PDFs across these thresholds, ensuring that heavy quark PDFs are consistently included in both DIS and hadron collider cross-sections. Recent advancements, such as the inclusion of photon-gluon fusion for charm production, have provided valuable constraints on the gluon PDF at small , thereby improving the precision of the charm PDF. This is especially important for precision studies of the Higgs and electroweak sectors at the LHC.
The treatment of heavy quarks in perturbative QCD is crucial for determining PDFs in processes involving DIS and hadron collisions. Several schemes have been developed to properly account for heavy quark mass effects in different kinematic regions: The Fixed Order plus Next-to-Leading Log (FONLL) approach Forte:2002fg ; Barontini:2024xgu combines fixed-order (FO) calculations with next-to-leading log (NLL) resummations, enabling a smooth transition between the massive and massless cases. The FONLL scheme also allows for the simultaneous treatment of charm and bottom quarks, improving the flexibility and accuracy in PDF determinations, especially at scales where both heavy quarks contribute. The ACOT scheme Aivazis:1993kh , along with its variants like S-ACOT and ACOT- Collins:1998rz , retains mass dependence in the Wilson coefficients, ensuring an accurate treatment of heavy quarks near their production thresholds where . This enables a precise description of heavy quark contributions in kinematic regions close to the threshold. The ZMVFN scheme Buza:1996wv neglects heavy quark mass effects at high energy scales, simplifying calculations. However, it can be inaccurate near threshold regions where , making it less suitable for precise studies involving heavy quark production near their mass thresholds.
The Thorne-Roberts (TR) method Thorne:1997ga is employed in the current analysis to ensure smooth transitions between the massive and massless regimes for heavy quark contributions to PDFs. This method provides a consistent framework for incorporating heavy quark effects across different kinematic regions, effectively bridging the transitions while maintaining the continuity of the PDFs. The TR scheme provided the proper handling of charm and bottom quarks, which is particularly important for accurate predictions at the LHC, including B-meson and Higgs production in association with heavy quarks. The use of the TR scheme for heavy quark treatment also enables us to achieve consistent higher-order predictions and improved constraints on the gluon PDF, which is particularly significant for electroweak studies at the LHC.
III Experimental Measurements
In this section, we provide a detailed overview of the data sets employed in our QCD analysis. We outline the sources, selection criteria, and preprocessing steps applied to ensure the robustness and reliability of our results. In global PDF analyses, DIS data sets, which span a wide range of Bjorken and momentum transfer , traditionally serve as the primary constraint. However, DIS data alone cannot sufficiently determine the gluon and sea quark distributions, particularly when it comes to distinguishing between individual quark flavors. In addition to the data from HERA DIS, we utilize a broader array of hard-scattering cross sections, primarily from proton-proton () collisions, to improve the precision of the PDF extractions. Recent studies have demonstrated that incorporating measurements from processes such as heavy flavor production, inclusive jet production, and top quark cross-sections significantly enhances the constraints on PDFs. These data sets provide improved coverage across a broad range of , , and flavor combinations, ultimately leading to more accurate determinations of the parton distributions.
| Data set | Process | Experiment | Ref. | Kinematic ranges and details | |
| HERA I+II | |||||
| HERA I+II CC | Abramowicz:2015mha | , | 0.4 | ||
| HERA I+II CC | Abramowicz:2015mha | , | 0.65 | ||
| HERA I+II NC | Abramowicz:2015mha | , | 0.65 | ||
| DIS | HERA I+II NC 460 | Abramowicz:2015mha | , | 0.65 | |
| HERA I+II NC 575 | Abramowicz:2015mha | , | 0.65 | ||
| HERA I+II NC 820 | Abramowicz:2015mha | , | 0.4 | ||
| HERA I+II NC 920 | Abramowicz:2015mha | , | 0.65 | ||
| Drell-Yan | |||||
| ATLAS | ATLAS low-mass DY 7 TeV | ATLAS:2014ape | , | ||
| ATLAS high-mass DY 7 TeV | ATLAS:2013xny | , | |||
| FNAL E866/NuSea | E866 (NuSea) | NuSea:2001idv | ?, | ||
| W/Z production | |||||
| ATLAS | ATLAS W 7 TeV ( pb-1) | ATLAS:2016nqi | , | ||
| ATLAS W 7 TeV ( pb-1) | ATLAS:2016nqi | , | |||
| ATLAS Z 7 TeV ( pb | ATLAS:2016nqi | , | |||
| ATLAS Z 7 TeV ( pb-1) | ATLAS:2016nqi | , | |||
| ATLAS W 7 TeV ( pb-1) | ATLAS:2012sjl | , | |||
| ATLAS Z 7 TeV ( pb-1) | ATLAS:2012sjl | , | |||
| CMS | CMS W electron asymmetry 7 TeV | CMS:2012ivw | , | ||
| CMS W muon asymmetry 7 TeV | CMS:2013pzl | , | |||
| CMS W muon asymmetry 8 TeV | CMS:2016qqr | , | |||
| CMS Z muon and electron 7 TeV | CMS:2011wyd | , | |||
| CDF | CDF W charge asymmetry 1.96 TeV | CDF:2009cjw | , | ||
| CDF Z differential 1.96 TeV | CDF:2010vek | , | |||
| D0 | D0 W electron asymmetry 1.96 TeV | D0:2014kma | , | ||
| D0 W muon asymmetry 1.96 TeV | D0:2013xqc | , | |||
| D0 Z differential 1.96 TeV | D0:2007djv | , |
III.1 DIS Data
The HERA dataset, collected by the H1 and ZEUS collaborations between 1994 and 2007, represents a comprehensive set of DIS measurements of electrons and positrons scattered off protons. This dataset includes over 1 fb-1 of integrated luminosity, with proton beam energies ranging from 460 to 920 GeV and an electron beam energy fixed at 27.5 GeV Abramowicz:2015mha . The data spans six orders of magnitude in Bjorken and the negative four-momentum-transfer squared, (from 0.045 GeV2 to 50000 GeV2), making it the most precise dataset available for scattering. These measurements enabled the development of the HERAPDF2.0 PDFs, which were refined through QCD analyses at leading order (LO), NLO, and NNLO accuracy. Additionally, variants such as HERAPDF2.0Jets, which incorporate jet production data, facilitated the simultaneous determination of PDFs and the strong coupling constant , providing valuable insights into proton structure and fundamental interactions Abramowicz:2015mha . The final combined HERA I+II dataset significantly improved constraints on small sea quarks and gluon PDFs. This comprehensive dataset, covering both neutral current (NC) and charged current (CC) interactions at various proton beam energies (460, 575, 820, and 920 GeV), provided a consistent set of cross-section measurements across a wide kinematic range. The electron beam energy was fixed at 27.5 GeV, resulting in center-of-mass energies of approximately 225, 251, 300, and 320 GeV. The data are available as functions of and , covering the range GeV2 and for neutral current interactions, and GeV2 and for charged current interactions. For the HERA I+II datasets included in our analysis, we follow the procedure in Ref. ATLAS:2016nqi and apply a kinematic cut at GeV2 to effectively remove higher-twist (HT) contributions.
III.2 Drell-Yan Data Sets
The precise measurement of inclusive , , and production in collisions at
the LHC provides a stringent test of perturbative QCD. The rapidity dependence of boson production
in the Drell-Yan process offers critical constraints on the PDFs of the proton, as the boson rapidity
is strongly correlated with the momentum fractions and carried by the partons
participating in the hard-scattering subprocess. The weak and electromagnetic components of the
neutral current (NC) process, , along with the weak charged
current (CC) reactions, and ,
probe the quark flavor structure of the proton, complementing the information obtained from DIS.
In this section, we present the Drell-Yan datasets included in our analysis.
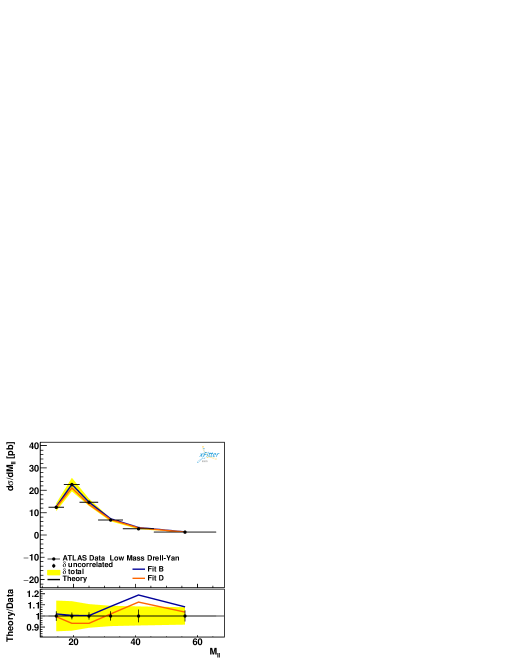
LHC Drell-Yan Data: The ATLAS collaboration provides a detailed measurement of the differential cross-section for the process (with ) as a function of the dilepton invariant mass in proton-proton collisions at , using the ATLAS detector at the LHC ATLAS:2014ape . This analysis, based on data collected in 2011, corresponds to an integrated luminosity of , covering invariant masses between 26 GeV and 66 GeV in both the electron and muon channels. Additionally, data from 2010, with of integrated luminosity, extend the measurement down to 12 GeV in the muon channel. These low-mass Drell-Yan measurements provide crucial constraints on PDFs in the low- region, complementing higher-mass analyses, and have been included in our analysis.
Building on this, ATLAS also analyzed a dataset focused on the high-mass region of Drell-Yan production, offering precise measurements of the differential cross-section in proton-proton collisions at TeV ATLAS:2013xny . This analysis, based on an integrated luminosity of , examines the channel. The differential cross-section is measured as a function of the invariant mass in the range 116 GeV 1500 GeV, within a fiducial region where both the electron and positron have transverse momentum GeV and pseudorapidity . These measurements extend the sensitivity of the analysis to higher values, complementing the lower-mass data, and have been applied in our QCD fit.
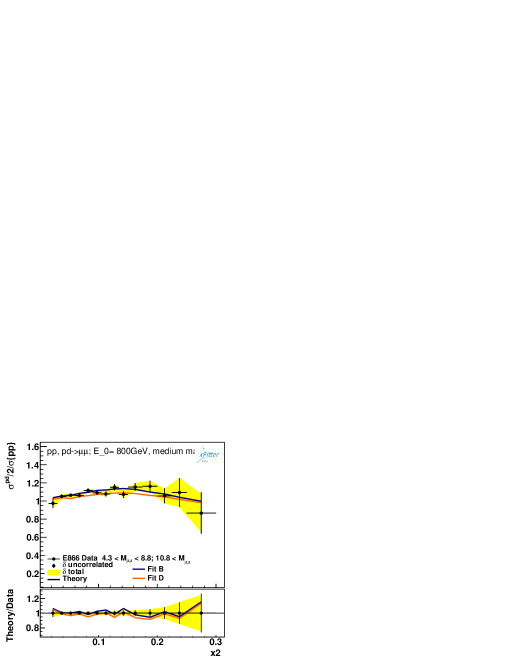
E866/NuSea (Fermilab): In addition to the LHC measurements, the E866/NuSea experiment at Fermilab, which is included in this analysis, has made significant contributions to our understanding of flavor asymmetry in the nucleon sea. This experiment measured the ratio of Drell-Yan yields from an 800 GeV/c proton beam incident on liquid hydrogen and deuterium targets NuSea:2001idv . The extensive dataset, comprising approximately 360,000 Drell-Yan muon pairs, enabled the determination of the ratio of to quark distributions in the proton sea across a broad range of Bjorken-. The results revealed a sharp downturn in the ratio at large , leading to substantial revisions in global parameterizations of the nucleon sea and providing tighter constraints on valence PDFs. These findings have inspired further interest in extending measurements to higher values using the 120 GeV/c proton beam from the Fermilab Main Injector.
III.3 Precision W/Z Production Collider Data
In addition to DIS and Drell-Yan processes, recent collider data from the LHC and other
sources provide complementary sensitivity for improving PDFs. In our global analysis, we
incorporate W and Z boson production data from both the LHC (ATLAS and CMS collaborations)
and the Tevatron (CDF and D0 collaborations), which offer crucial constraints on
the quark flavor separation in PDFs, particularly for sea quarks.
The ATLAS collaboration has provided two key datasets for this analysis:
Inclusive W/Z Production (ATLAS, 7 TeV): High-precision measurements of inclusive , , and () Drell-Yan production cross sections in proton-proton collisions at TeV were published by ATLAS ATLAS:2016nqi . These measurements are based on data corresponding to an integrated luminosity of 4.6 fb-1. The differential cross sections for and are measured within the lepton pseudorapidity range , while the differential cross sections are measured as a function of the absolute dilepton rapidity across three dilepton mass intervals (46 GeV < < 150 GeV). These measurements, combined across the electron and muon channels, provide stringent constraints on the PDFs of the proton when compared to theoretical predictions using modern PDF sets.
W/Z Production and Strange Quark Density: Another ATLAS dataset, focused on inclusive and boson
production at TeV, has been critical in improving the
understanding of the light quark sea, particularly the strange quark density ATLAS:2012sjl .
This analysis includes a NNLO perturbative QCD fit and finds that the ratio of
strange-to-down sea quark densities, , is approximately 1.00 at
and GeV2, suggesting a flavor-symmetric light quark sea at low .
This data plays a crucial role in refining the strange quark contribution to the proton sea quark content.
The CMS collaboration has provided four key datasets that are included in our analysis:
Electron Charge Asymmetry (7 TeV): A precise measurement of the electron charge asymmetry in production at TeV, based on 840 pb-1 of data, was performed by CMS CMS:2012ivw . This asymmetry measurement, as a function of electron pseudorapidity , imposes stringent constraints on PDFs by probing the differences in and production.
Muon Charge Asymmetry (7 TeV): CMS also measured the muon charge asymmetry in inclusive production, based on 4.7 fb-1 of data CMS:2013pzl . The improved precision of this measurement, in 11 bins of muon pseudorapidity with different thresholds, provides valuable input for determining valence and strange quark distributions.
W Boson Production (8 TeV): A comprehensive measurement of the differential cross-section and charge asymmetry for inclusive production at TeV, based on 18.8 fb-1 of data, was carried out by CMS CMS:2016qqr . These results, including differential cross-sections with respect to and lepton pseudorapidity, are essential for constraining both the valence and sea quark distributions.
Z Boson Production (7 TeV): CMS also measured the rapidity and transverse momentum distributions of bosons in collisions at TeV, using 36 pb-1 of data CMS:2011wyd . These measurements, with rapidity up to and transverse momentum up to 350 GeV, provide critical insights into the production dynamics of bosons and serve as an important input for refining the gluon and sea quark PDFs.
Finally, the Tevatron data sets from CDF and D0 Collaborations in which added to our data samples include:
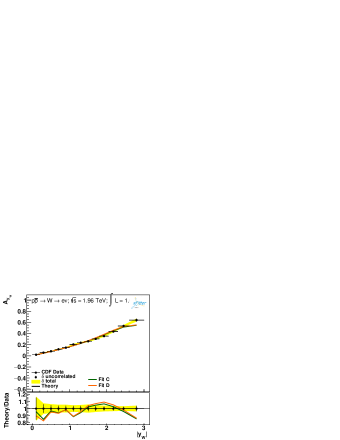
CDF W Boson Production Charge Asymmetry: The CDF collaboration measured the charge asymmetry in boson production in collisions at TeV CDF:2009cjw . This dataset provides key insights into the asymmetry between and production, helping to refine quark PDFs at intermediate .
CDF Drell-Yan Production: CDF also measured the differential cross-section for Drell-Yan pairs in the boson mass region at TeV CDF:2010vek , providing constraints on the quark-antiquark PDFs at intermediate .
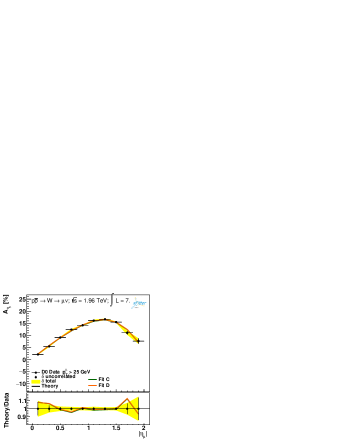
D0 Electron Charge Asymmetry: D0 also measured the electron charge asymmetry in events, providing complementary constraints to the muon charge asymmetry data D0:2014kma .
D0 Muon Charge Asymmetry: D0 measured the muon charge asymmetry in events at TeV D0:2013xqc , offering critical constraints on the and quark PDFs.
Z Boson Rapidity Distribution: Finally, D0 measured the rapidity distribution of in collisions D0:2007djv , providing detailed tests of QCD and electroweak theory through the shape of the rapidity distribution.
IV Computational Setting and PDF Parametrization
In this section, we describe the computational framework and the parameterization strategy adopted for the determination of PDFs. The accurate extraction of the PDFs requires a robust computational environment that integrates various aspects of the QCD analysis, including the evolution of parton densities, the computation of physical observables, and the fitting of theoretical predictions to experimental data. Our analysis is implemented within the xFitter framework xFitter:2022zjb ; Alekhin:2014irh , a versatile tool set designed for the global analysis of PDFs. This framework facilitates the numerical solution of the Dokshitzer-Gribov-Lipatov-Altarelli-Parisi (DGLAP) evolution equations Altarelli:1977zs ; Gribov:1972ri ; Dokshitzer:1977sg , ensuring consistency with perturbative QCD predictions up to NNLO accuracy. Moreover, xFitter allows for the incorporation of various sources of experimental uncertainties, including statistical, systematic, and correlated uncertainties, into the PDF extraction process. The PDF parameterization at the initial scale is a critical component of a QCD analysis, as it forms the basis for subsequent QCD evolution. We adopt a flexible functional form that captures the essential features of parton distributions while maintaining a balance between the number of free parameters and the stability of the fit. The optimization of the parameterization involves fitting the experimental data to the theoretical predictions, which are computed by evolving the PDFs from the initial scale to the relevant experimental scales. This process is performed using the MINUIT minimization package James:1975dr ; James:1994vla , which provides both the central values of the parameters and their associated uncertainties.
IV.1 PDF Parameterization
In our QCD analysis, a flexible yet controlled functional form is employed to describe the wide range of experimental data without overfitting the PDFs. The initial scale is chosen to be , which lies below the charm mass threshold. This ensures that heavy-quark distributions are dynamically generated above their respective mass thresholds, which are set at for the charm quark and for the bottom quark. These thresholds are determined from the most recent heavy-quark differential cross-section measurements conducted at HERA. As we mentioned before, our analysis follows the RT VFNS Thorne:1997ga ; Thorne:2006qt ; Thorne:2012az , where heavy quarks are dynamically included in the PDFs once the energy scale surpasses their respective mass thresholds Martin:2009iq ; Thorne:2006qt ; Alekhin:2012ig .
We use a HERAPDF-like parameterization for the valence and sea quark distributions, which has been well-validated in previous HERA global QCD analyses H1:2015ubc . The parameterizations for valence quarks and are constrained by the quark number sum rules, while the sea quark distributions are refined iteratively as new experimental datasets are included.
The gluon distribution poses significant challenges in the PDF parameterization, particularly at low . Previous studies, such as those in the MSTW08 analysis Martin:2009iq ; Martin:2001es , observed that when the PDF evolution begins from a low scale , the input gluon distribution can turn negative at very small values of , outside the kinematic region of the fit, causing issues for the PDFs at very low . To address this problem, and following the HERAPDF QCD analysis and similar work by MSTW08, we introduce an additional term in the gluon parameterization: . This term allows for greater flexibility in describing the gluon distribution, particularly in the small- region. The inclusion of this correction is crucial for preventing unphysical negative gluon densities and stabilizing the fit across a wide range of values.
The use of a two-component gluon distribution, represented by , also offers enhanced accuracy in describing both the small and large behavior of the gluon. By capturing the steep rise at low and the expected fall-off at high , this parameterization improves the overall precision of the proton PDFs. It also ensures that the gluon density fits smoothly with the constraints provided by experimental data, particularly in regions where data is sparse, such as for very small . This additional term ensures that the parameterization is sufficiently flexible at very low H1:2015ubc .
A key aspect of understanding the proton structure is the determination of the strange-quark density. In our QCD analysis, we define the strange-quark fraction as the ratio of the strange sea-quark distribution to the down sea-quark distribution ATLAS:2016nqi :
| (5) |
This parameter provides valuable insight into the relative contribution of strange quarks compared to down quarks in the proton sea. Recent ATLAS studies ATLAS:2016nqi have shown that plays a crucial role in improving the precision of strange-quark distributions, which are critical for predictions of processes like W and Z boson production. Including as a fit parameter allows us to extract precise information on the strange-quark content and its impact on other quark distributions. Our analysis refines this parameter to improve predictions for high-energy processes involving strange quarks.
In addition to the PDFs, the strong coupling constant at the Z boson mass () is treated as a free parameter in our QCD fit. This ensures that the coupling evolves consistently with the energy scale, allowing us to account for uncertainties in both and the PDFs. The value of is critical for accurately predicting cross-sections in processes like jet and top quark production at the LHC, where gluon interactions dominate.
Finally, we adopt the following functional forms for the parton distributions at the initial scale :
| (6) |
The above functional forms for , , , , and are tailored to ensure accurate predictions at both low and high values of . In this analysis, we assume similar behavior of the up and down sea-quark distributions, setting and . These assumptions are consistent with the HERAPDF-like H1:2015ubc and ATLAS-epWZ16 ATLAS:2016nqi parameterizations for the sea quark distributions as well. For the strange distributions, we consider , and also assume and . Given the enhanced sensitivity to the strange-quark distribution through the CMS and ATLAS W/Z data sets, the appear as a free parameter in the fit. The above assumptions also simplify the parameter space, especially given the limited experimental data constraints on these distributions. Following the HERAPDF analysis, on which our current work is closely based, as well as the MSTW2008 analysis, we have fixed the parameter to . As discussed in Refs. H1:2015ubc ; Martin:2009iq , both analyses have demonstrated that the QCD fits are generally not sensitive to the exact value of , provided that , ensuring that the additional term does not contribute significantly at large .
IV.2 Definition and Minimization of Function
In this section, we focus on two essential aspects of our QCD analysis: the optimization procedure for determining the PDFs and the incorporation of the experimental uncertainties. The free parameters of the PDFs are estimated using experimental data through a likelihood maximization method. Assuming that the data points are normally distributed, the likelihood maximization reduces to minimizing the function, which quantifies the agreement between theory and experiment.
The function used in our analysis follows the formalism of the xFitter framework xFitter:2022zjb ; Alekhin:2014irh and is expressed as follows:
| (7) | |||||
where represents the experimental measurements, and are the theoretical predictions that depend on a set of parameters . The uncertainties in each measurement are separated into two components: , the statistical uncertainty, and , the uncorrelated systematic uncertainty, while denotes the correlated systematic uncertainties. The nuisance parameters quantify the strength of the correlated systematic uncertainties across the data set.
This formulation allows us to correctly incorporate both statistical and systematic uncertainties into the minimization process. The nuisance parameters are introduced to control deviations in the correlated systematic uncertainties, with a penalty term added to the function to constrain these deviations. The minimization of this function is performed using the MINUIT James:1975dr ; James:1994vla package via the MIGRAD algorithm James:1975dr , as implemented in xFitter. Once the minimum is found, the uncertainties in the fitted parameters are evaluated using the Hessian matrix, which is central to uncertainty propagation in the context of global QCD fits.
In a limited number of experimental studies, an alternative approach is employed wherein the covariance matrix, , is used in place of Eq. 7 to account for correlations between data points:
| (8) |
where represents the experimental data, represents the theoretical predictions for the th data point, and are nuisance parameters that account for the correlated systematic uncertainties from source . The total uncertainty is the combination of statistical and uncorrelated systematic uncertainties. The parameters are optimized analytically during the minimization process. In this formulation, the covariance matrix captures both uncorrelated and correlated uncertainties and is given by:
| (9) |
where characterizes the sensitivity of the th and th data points to the correlated systematic uncertainty . This decomposition allows for a proper treatment of experimental uncertainties, ensuring that correlated systematic effects are propagated consistently.
The minimization of the function is followed by the propagation of uncertainties from the fit parameters to the physical observables. This is accomplished by generating a set of eigenvector PDF sets, which represent variations of the PDF parameters along the directions defined by the eigenvectors of the Hessian matrix. For free parameters, a total of PDF sets are generated: one central fit and two variations along each eigenvector direction. Finally, the calculated proton PDF sets are made available in the standard LHAPDF format Buckley:2014ana .
IV.3 Determination of PDF uncertainties
The Hessian formalism is widely used in the global analysis of PDFs, such as in the CT18 framework, to study the uncertainties associated with the fitted PDFs and their physical predictions Pumplin:2001ct ; Giele:2001mr . The method is based on a quadratic approximation to the function around its minimum. The eigenvectors of the Hessian matrix characterize the directions in the parameter space in which the increases most rapidly, corresponding to directions where the fit is most sensitive to the data. This allows us to generate a set of orthonormal basis PDFs, known as eigenvector PDF sets, which can be used to calculate uncertainties in physical observables by varying the fit parameters along each eigenvector direction Martin:2009iq .
In the Hessian formalism, the function near its minimum can be expressed as a quadratic form:
| (10) |
where represents the best-fit parameter vector, are the fit parameters, and represents the second-order derivatives of with respect to the parameters . This second-order derivative matrix is called the Hessian matrix, denoted as :
| (11) |
The Hessian matrix captures the shape and curvature of the surface near its minimum, reflecting how sensitive the fit is to variations in the parameters. Diagonalizing this matrix yields the eigenvectors and corresponding eigenvalues , which provide a natural basis for exploring the parameter space. The eigenvectors define directions in the parameter space along which the increases most rapidly, indicating where the fit is most sensitive to variations in the parameters.
The parameter variations along the eigenvector directions are determined by solving the following eigenvalue problem:
| (12) |
In practice, these eigenvectors are used to construct a set of orthonormal basis PDFs, known as eigenvector PDF sets. These eigenvector sets allow for the systematic variation of PDF parameters, and hence the estimation of uncertainties on physical observables. Once the eigenvectors of the Hessian matrix are known, the uncertainty in any physical observable that depends on the PDFs can be calculated Martin:2009iq .
The eigenvector basis is constructed by transforming the parameters of the fit into a new set of coordinates where the Hessian matrix is diagonal. In this new coordinate system, the parameters are normalized such that displacements from the minimum in each direction correspond to fixed increases in . The uncertainty in any observable is then calculated by evaluating the variation of along each eigenvector direction. This method provides a robust framework for propagating uncertainties in the PDFs to predictions for physical observables.
The uncertainty in any observable that depends on the PDFs is calculated as Pumplin:2001ct ; Martin:2009iq ,
| (13) |
where and are the observable values computed using the positive and negative variations of the th eigenvector. This method assumes that the variations of the observables can be approximated as linear within the region where the function behaves quadratically. Such an assumption holds well near the minimum, ensuring reliable propagation of uncertainties from the PDFs to the final physical observables.
To ensure that the fit remains well-behaved and does not overfit the data, especially in regions where the data are sparse or have large uncertainties, regularization methods are applied. In the xFitter framework, regularization is implemented through the inclusion of length penalty terms in the function. These penalty terms discourage overly complex PDF shapes, promoting smoother distributions that are more physically reasonable. Regularization is particularly important in global PDF fits, where the data cover a wide range of kinematic regions, and the parameterization of the PDFs must be flexible enough to accommodate this diversity while avoiding overfitting.
Regularization also plays a crucial role in determining the appropriate degree of flexibility in the parameterization of the PDFs. Too much flexibility can lead to poorly constrained parameters and instabilities in the fit, while too little flexibility may prevent the fit from adequately describing the data. By introducing regularization terms, we can control the complexity of the PDF parameterization and ensure that the fit remains stable and reliable across the full kinematic range.
V Fit results
This section presents the main results and findings of this work. As outlined below, different QCD fits have been performed, considering various data sets. We first examine the quality of our QCD fits, then present the extracted PDFs, and finally compare the fit quality across a selection of fitted data for different scenarios.
To explore the impact of Drell-Yan and W/Z boson production data from the CMS, ATLAS, D0, and CDF collaborations on the shape of different parton species and their associated uncertainties, we performed four different QCD fits at NLO and NNLO accuracy. The details of these approaches are described below:
-
•
Fit A: In the first fit, we incorporate only the HERA I+II Abramowicz:2015mha experimental data, which serves as a crucial baseline for any QCD analysis. Utilizing 1016 data points, as per the cut mentioned earlier, the results from Fit A provide a robust foundation for assessing the impact of additional experimental measurements on the PDFs.
-
•
Fit B: In this fit, we build on Fit A by including measurements related to the Drell-Yan process from the ATLAS collaboration ATLAS:2013xny ; ATLAS:2014ape and the E866 experiment NuSea:2001idv . The configuration of this fit remains identical to Fit A, with the only difference being the inclusion of Drell-Yan data. This fit utilizes 1082 data points, as indicated in Table 2, allowing us to evaluate how Drell-Yan measurements affect the shape of different parton species and their associated uncertainties.
-
•
Fit C: Fit C is similar to Fit B, but instead of Drell-Yan data, it includes CMS and ATLAS measurements of W/Z boson cross-sections ATLAS:2012sjl ; ATLAS:2016nqi ; CMS:2016qqr ; CMS:2012ivw ; CMS:2013pzl ; CMS:2011wyd , as well as the corresponding measurements from the D0 and CDF collaborations at Tevatron D0:2014kma ; D0:2013xqc ; D0:2007djv ; CDF:2010vek . This fit is performed using 1289 data points, enabling us to study the specific impact of W/Z boson production data on the extracted PDFs.
-
•
Fit D: The final, or nominal, fit is performed using the combination of all the data sets discussed above, providing the most comprehensive QCD analysis. This fit integrates the HERA I+II, Drell-Yan, and W/Z boson datasets, yielding a complete picture of the PDFs and their associated uncertainties. The PDFs in this fit are extracted from 1355 experimental data points.
| Observable | Experiment | Reference | Fit A | Fit B | Fit C | Fit D |
|---|---|---|---|---|---|---|
| HERA1+2 CC | Abramowicz:2015mha | 46 / 39 | 42 / 39 | 44 / 39 | 43 / 39 | |
| HERA1+2 CC | Abramowicz:2015mha | 55 / 42 | 60 / 42 | 69 / 42 | 68 / 42 | |
| HERA1+2 NC | Abramowicz:2015mha | 222 / 159 | 224 / 159 | 220 / 159 | 222 / 159 | |
| DIS | HERA1+2 NC 460 | Abramowicz:2015mha | 195 / 177 | 195 / 177 | 195 / 177 | 197 / 177 |
| HERA1+2 NC 575 | Abramowicz:2015mha | 187 / 221 | 188 / 221 | 187 / 221 | 189 / 221 | |
| HERA1+2 NC 820 | Abramowicz:2015mha | 53 / 61 | 55 / 61 | 53 / 61 | 53 / 61 | |
| HERA1+2 NC 920 | Abramowicz:2015mha | 351 / 317 | 361 / 317 | 359 / 317 | 379 / 317 | |
| ATLAS high mass | ATLAS:2013xny | - | 13 / 13 | - | 9.2 / 13 | |
| ATLAS low mass 1.6 fb-1 | ATLAS:2014ape | - | 7.5 / 8 | - | 8.7 / 8 | |
| Drell-Yan | ATLAS low mass extended 35 pb-1 | ATLAS:2014ape | - | 6.4 / 6 | - | 7.4 / 6 |
| E866 low mass | NuSea:2001idv | - | 11 / 10 | - | 14 / 10 | |
| E866 mid mass | NuSea:2001idv | - | 14 / 14 | - | 13 / 14 | |
| E866 high mass | NuSea:2001idv | - | 13 / 15 | - | 23 / 15 | |
| ATLAS | ATLAS:2012sjl | - | - | 15 / 11 | 15 / 11 | |
| ATLAS | ATLAS:2012sjl | - | - | 15 / 11 | 15 / 11 | |
| ATLAS | ATLAS:2012sjl | - | - | 8.9 / 11 | 8.9 / 11 | |
| ATLAS | ATLAS:2016nqi | - | - | 13 / 11 | 13 / 11 | |
| ATLAS | ATLAS:2016nqi | - | - | 10 / 11 | 9.6 / 11 | |
| CMS | CMS:2016qqr | - | - | 1.6 / 11 | 3.3 / 11 | |
| CMS | CMS:2016qqr | - | - | 1.2 / 11 | 2.3 / 11 | |
| CMS asymmetry | CMS:2016qqr | - | - | 7.5 / 11 | 11 / 11 | |
| CMS asymmetry | CMS:2012ivw | - | - | 10.0 / 11 | 9.2 / 11 | |
| CMS asymmetry | CMS:2013pzl | - | - | 13 / 11 | 14 / 11 | |
| Bosons | CDF asymmetry | CDF:2009cjw | - | - | 38 / 13 | 47 / 13 |
| D0 asymmetry | D0:2014kma | - | - | 31 / 13 | 31 / 13 | |
| D0 asymmetry | D0:2013xqc | - | - | 15 / 10 | 14 / 10 | |
| ATLAS high mass CF | ATLAS:2016nqi | - | - | 3.9 / 6 | 3.9 / 6 | |
| ATLAS high mass CC | ATLAS:2016nqi | - | - | 5.6 / 6 | 5.5 / 6 | |
| ATLAS low mass | ATLAS:2016nqi | - | - | 22 / 6 | 23 / 6 | |
| ATLAS peak CF | ATLAS:2016nqi | - | - | 5.5 / 9 | 8.4 / 9 | |
| ATLAS peak CC | ATLAS:2016nqi | - | - | 13 / 12 | 15 / 12 | |
| ATLAS | ATLAS:2012sjl | - | - | 2.9 / 8 | 2.5 / 8 | |
| CMS | CMS:2011wyd | - | - | 65 / 35 | 67 / 35 | |
| CDF | CDF:2010vek | - | - | 28 / 28 | 28 / 28 | |
| D0 | D0:2007djv | - | - | 22 / 28 | 22 / 28 | |
| Correlated | 49 | 61 | 95 | 113 | ||
| Log penalty | -10.87 | -17.10 | -5.05 | -13.22 | ||
| Total / dof | 1149 / 1000 | 1236 / 1066 | 1551 / 1273 | 1678 / 1339 | ||
| = 1.149 | = 1.159 | = 1.218 | = 1.253 |
V.1 Fit quality
The values characterizing our NNLO nominal QCD fit to the H1/ZEUS combined datasets, as well as the Drell-Yan and W/Z production data from the LHC and Tevatron, are listed in Table 2. As shown, our NNLO QCD fits provide a good description of the data sets both in terms of individual and total data sets from HERA, LHC, and Tevatron. Several observations can also be made based on the values for both the individual and total datasets.
For Fit A, where we utilize only the HERA data, the total is 1.149, indicating a good quality QCD fit within the chosen PDF parameterization of Eq. (IV.1). This baseline fit sets the standard against which the inclusion of additional data sets is evaluated.
The inclusion of Drell-Yan data in Fit B slightly increases the total value to 1.159. Despite this slight increase, the overall fit quality remains very good, and the description of the individual data sets is still satisfactory. This modest change suggests that the additional Drell-Yan data are largely compatible with the existing HERA data, with minimal tension between the datasets.
When combining the HERA data with the W/Z boson production cross-section data in Fit C, we observe a further increase in the total to 1.218. While the overall fit quality remains acceptable, some individual data sets show slight discrepancies. Specifically, the CDF asymmetry data CDF:2009cjw and the ATLAS low-mass data ATLAS:2016nqi show less agreement with our NNLO theory predictions, contributing to the increase in the total .
In our nominal fit, Fit D, which incorporates all data sets discussed, the total increases slightly to 1.253. This fit includes the effects of all combined data, and the observed increase is primarily driven by the tension between certain datasets. In addition to the CDF asymmetry CDF:2009cjw and ATLAS low-mass data ATLAS:2016nqi , a noticeable increase in the value is also seen for the HERA I+II NC 920 dataset Abramowicz:2015mha .
Overall, while there are slight increases in the total values with the addition of new data sets, the fits remain well within acceptable ranges, confirming that our approach provides a consistent and comprehensive description across a wide range of experimental data.
We should also highlight here that the overall fit quality is improved at NNLO compared to NLO accuracy. For our nominal fit, Fit D, at NLO accuracy, the total value is found to be higher (), indicating a less precise description of the data. In contrast, the NNLO fit provides a much closer agreement with the experimental measurements, as reflected in the lower values for both the individual and combined datasets.
This demonstrates the importance of incorporating higher-order QCD corrections to achieve a more accurate determination of the PDFs and their associated uncertainties. The difference between NNLO and NLO is mainly due to the fact that perturbative corrections are generally more significant for hadron-collider processes compared to HERA DIS, emphasizing the necessity of including higher-order QCD corrections, especially for high-precision LHC measurements. Additionally, the quantity and precision of the current LHC data are now sufficient to clearly demonstrate the superiority of NNLO calculations.
V.2 Parton distributions
We now turn to the examination of our extracted PDFs. First, we present the complete set of four PDFs and compare them to the baseline Fit A results. Following this, we provide a detailed discussion on the impact of different data set selections on the shapes of various parton species and their associated uncertainties.
In Table 3, we list the numerical values of the best-fit parameters and their associated uncertainties, obtained from our QCD fits at the input scale GeV2. The parameter values are provided for all four QCD fit sets discussed in the text. The strong coupling constant, , is treated as a free parameter in our QCD analyses. The value of extracted from our QCD fits is also presented in Table 3, reflecting the impact of including different data sets on the determination of the strong coupling constant. Additionally, as discussed earlier, the parameter , defined as the relative strange-to-down sea quark fraction , is also treated as a free parameter in our QCD fits. The values of extracted from the fits are presented in Table 3. This parameter is essential for understanding the relative behavior of the strange and down sea quark distributions, and its inclusion allows for a more flexible parameterization of the PDFs.
Several observations can be made based on the numbers presented in this table. We parameterize six different PDFs: the valence distributions and ; the gluon density ; the sea quark densities and ; and finally, a symmetric strange quark distribution . The parameters , , and are determined by the number and momentum sum rules.
As observed, nearly all parameters are well-determined from the fit to the data. However, some parameters, such as , , and , exhibit relatively large uncertainties, particularly when only the HERA data are used. This indicates that the HERA combined DIS datasets alone do not sufficiently constrain these parameters. Notably, as shown in Table 3, the inclusion of additional data sets, such as Drell-Yan and W/Z production data, significantly improves the determination of these parameters, reducing their associated uncertainties.
| Parameter | Fit A | Fit B | Fit C | Fit D |
|---|---|---|---|---|
| 25 (Fixed) | 25 (Fixed) | 25 (Fixed) | 25 (Fixed) | |
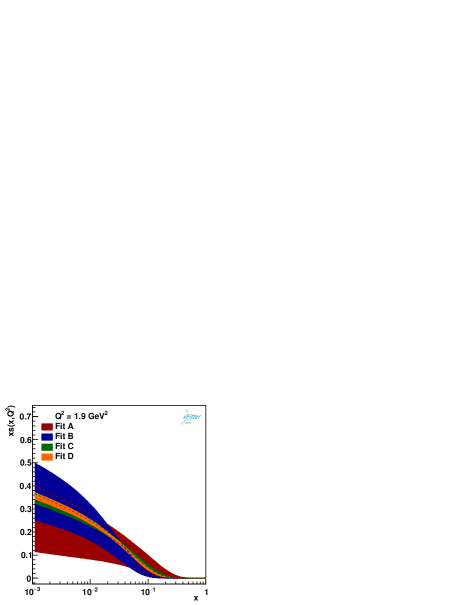
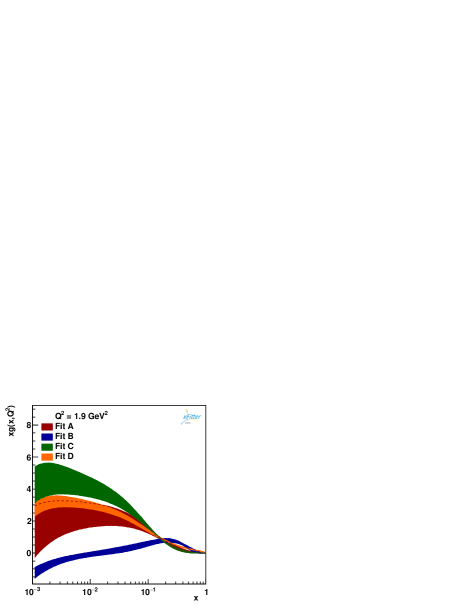
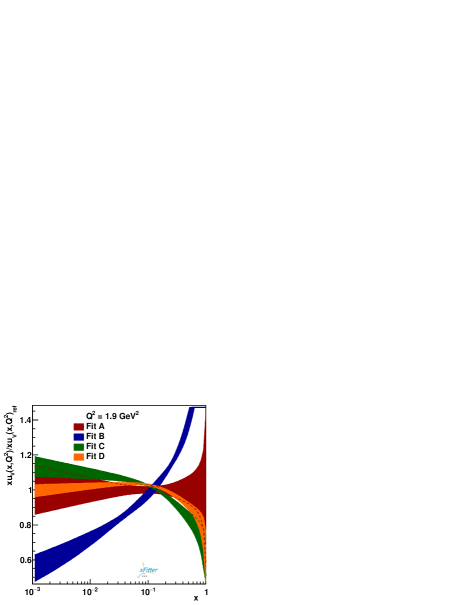
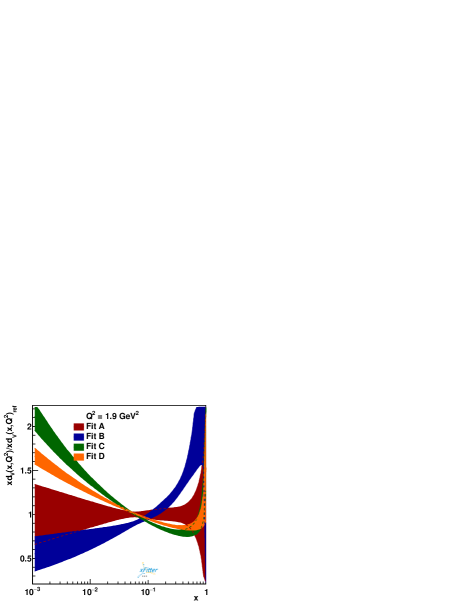
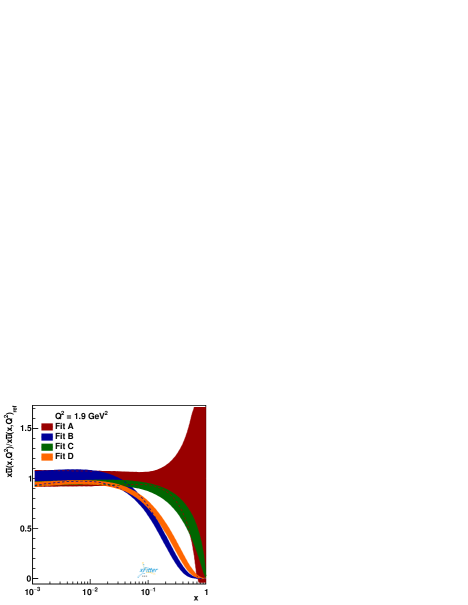
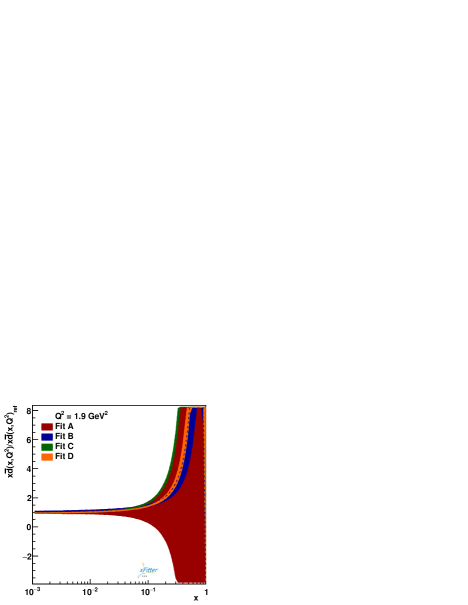
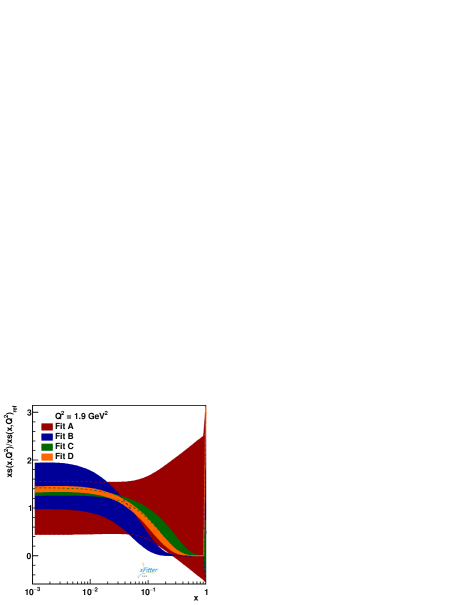
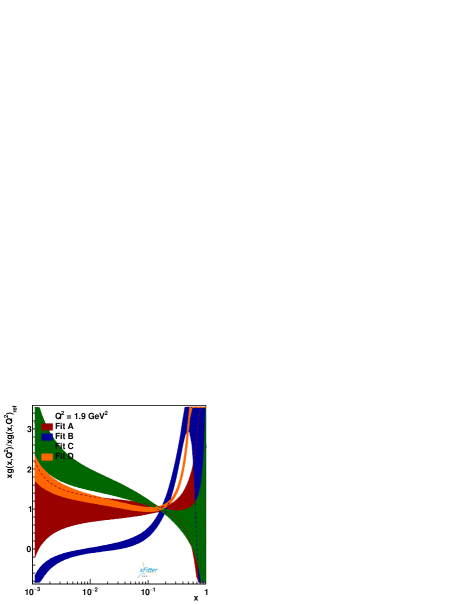
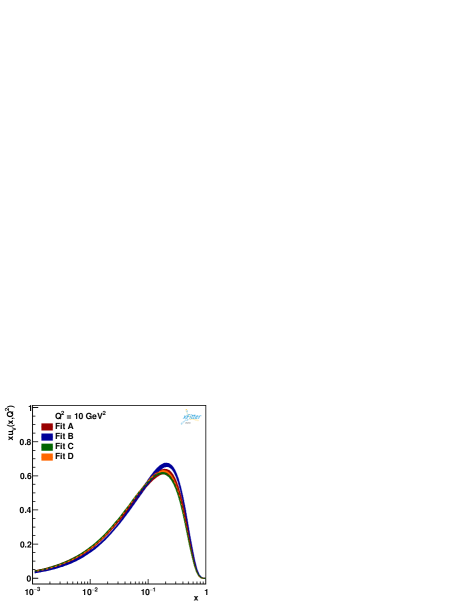
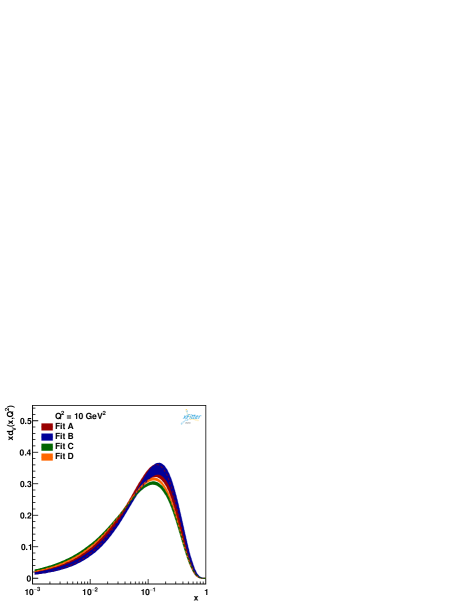
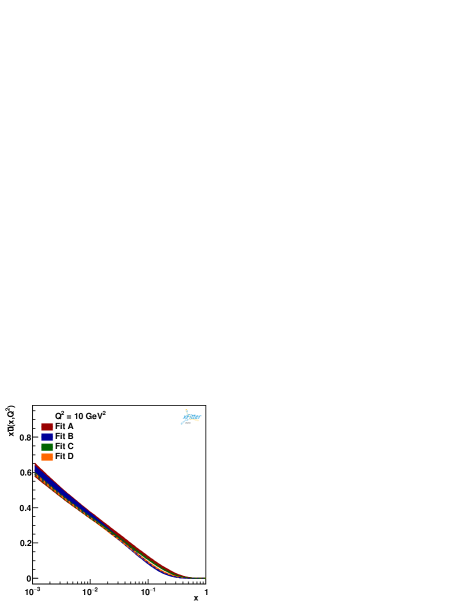
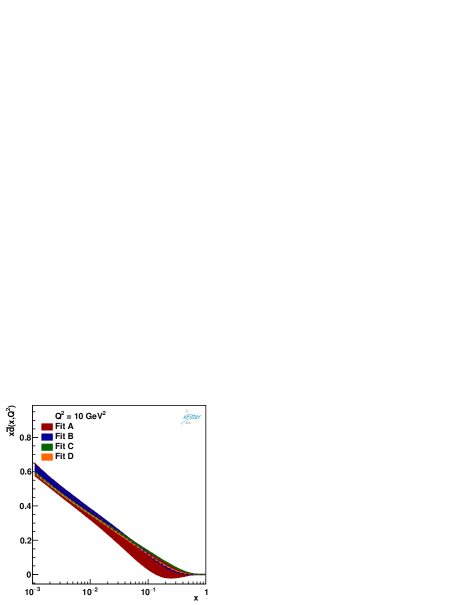
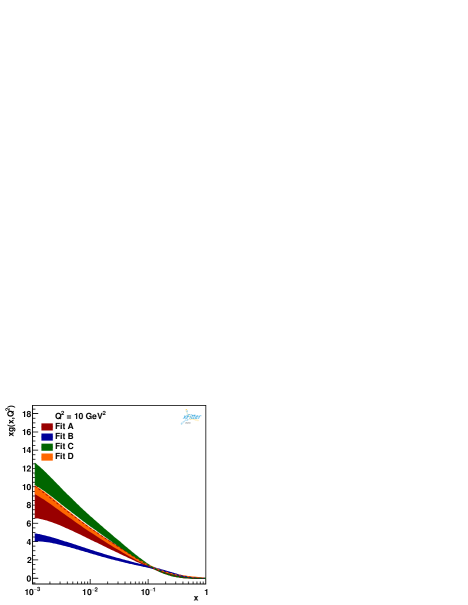
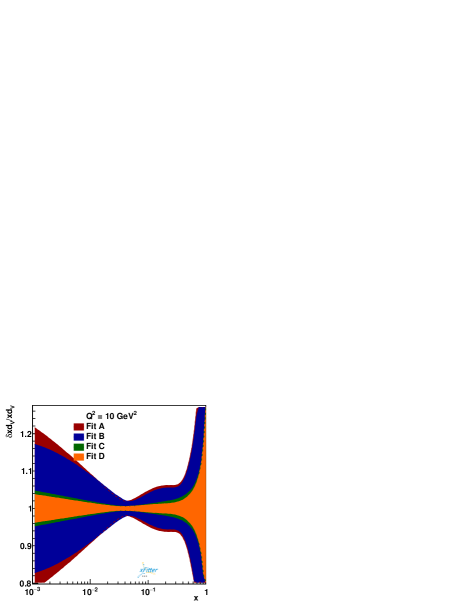
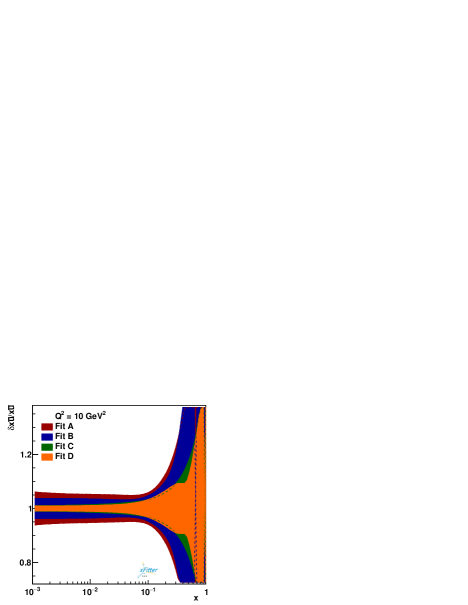
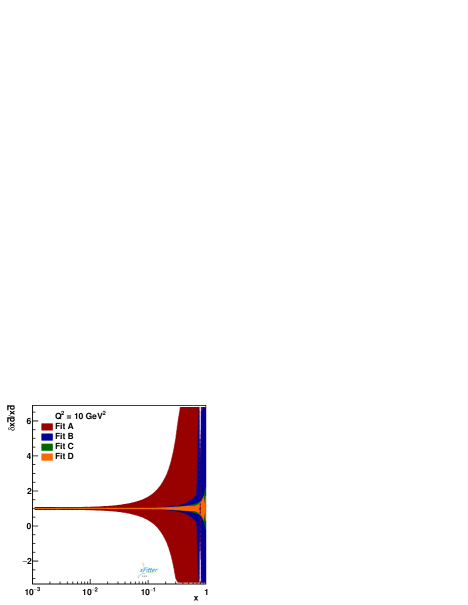
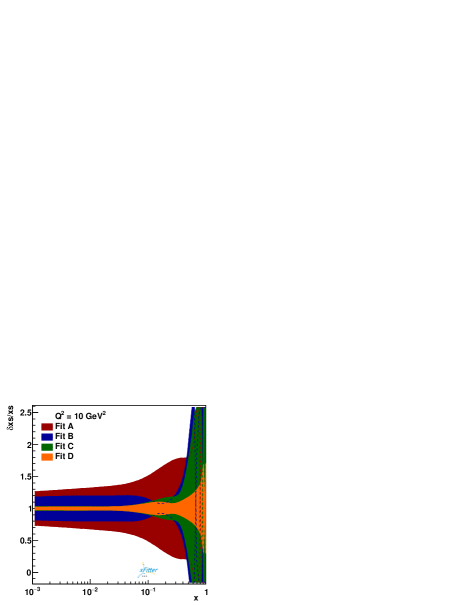
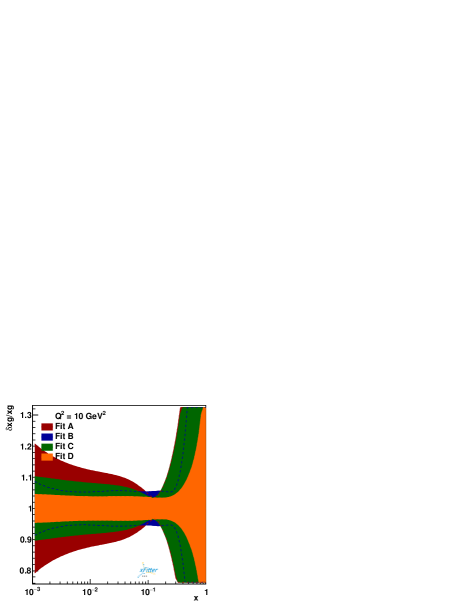
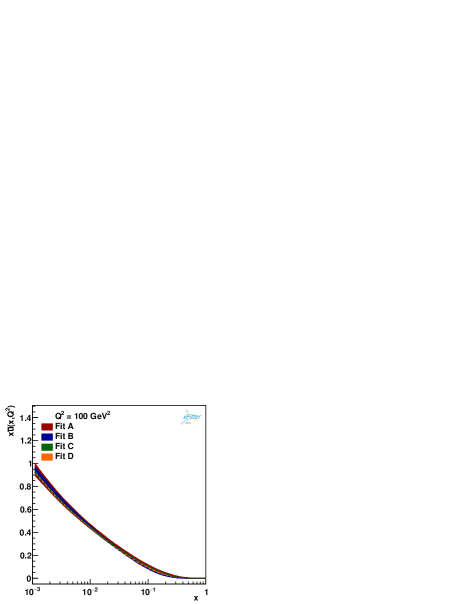
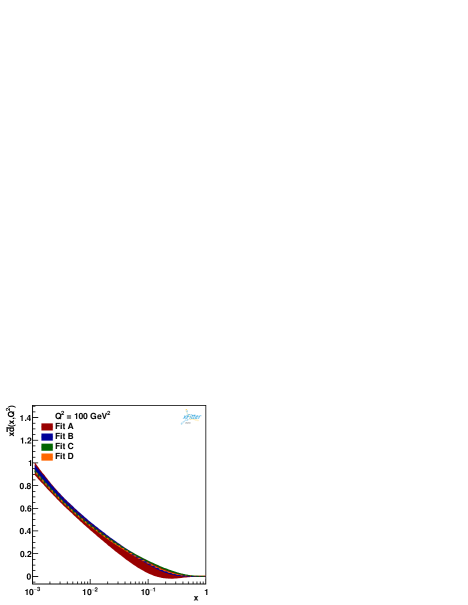
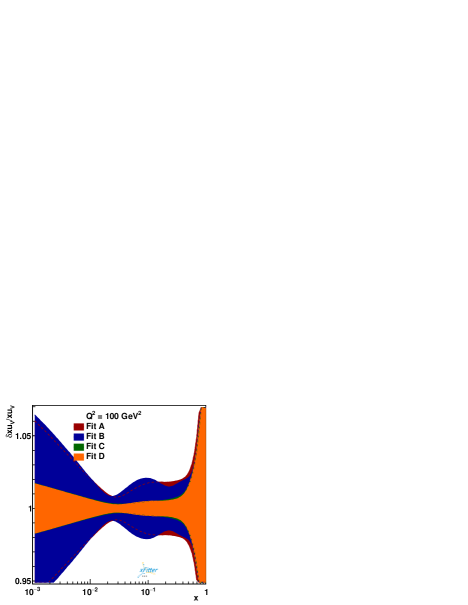
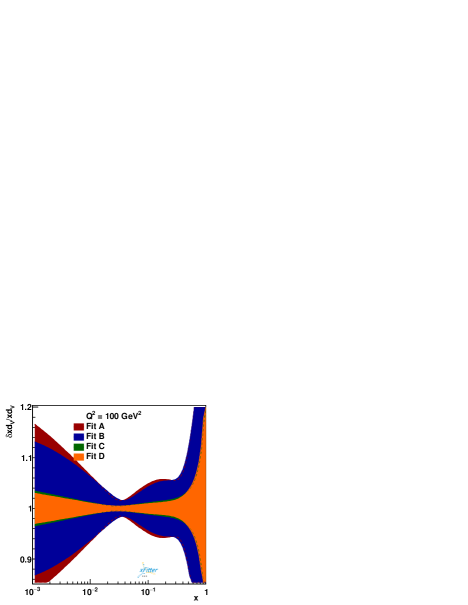
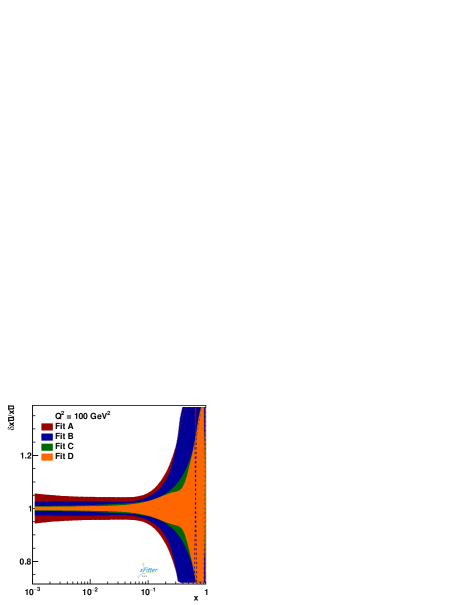
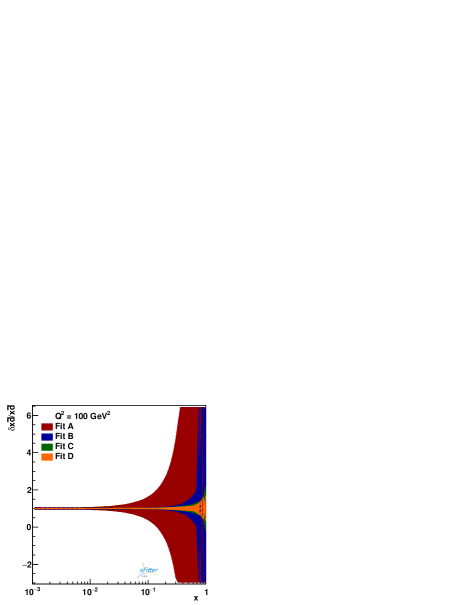
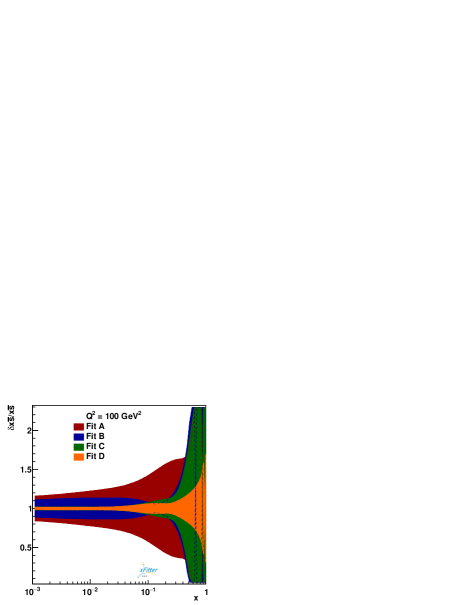
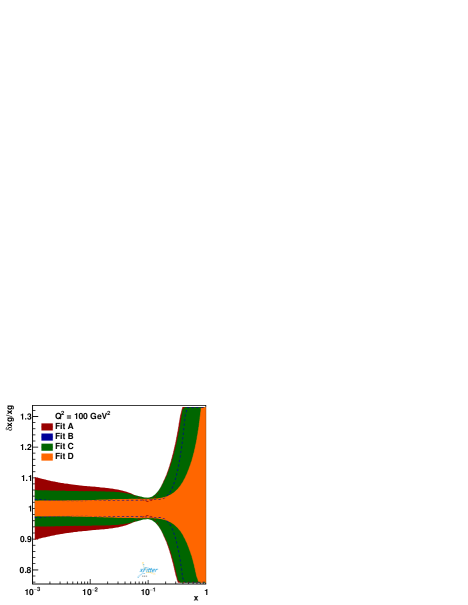
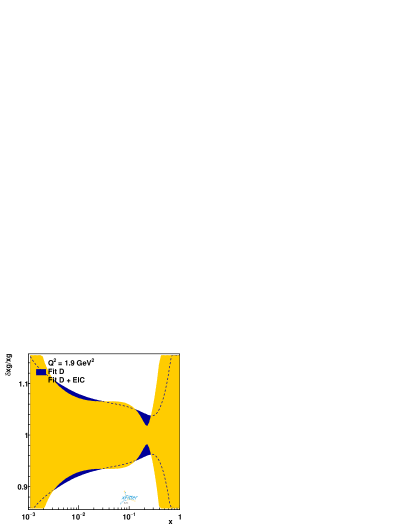
In the following discussion, we turn our attention to the obtained PDFs and their uncertainties. Detailed comparisons of the NNLO quark and gluon PDFs at the input scale GeV2 are presented in Figs. 1 and 2. To investigate the impact of including different data selections, we compare all four PDF determinations with each other. Specifically, in Fig. 2, the comparisons are displayed as ratios relative to our baseline QCD analysis, Fit A. The uncertainty bands of the PDFs are calculated using the Hessian method, as discussed earlier.
Notable differences in the shapes of the PDFs are observed, especially at small values of . These variations indicate that different data sets impose different types of constraints on the PDFs. For example, the inclusion of Drell-Yan and W/Z boson production data tends to impact the strange quark and gluon distributions more prominently at lower , demonstrating the sensitivity of the PDF shapes to the specific experimental inputs.
As can be seen, the inclusion of the Drell-Yan data in Fit B significantly affects the shape of the valence quark distributions, particularly over medium to large values of . These differences are even more pronounced for the strange quark and gluon distributions, where notable variations are observed in both the shape and the uncertainty bands across the entire range of .
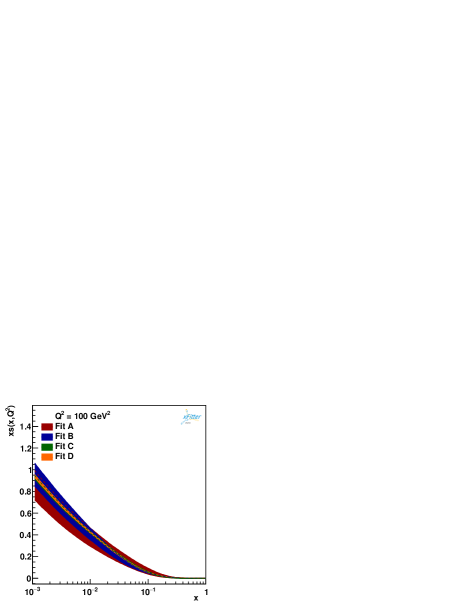
Focusing first on the strange quark PDF, it is evident that there are relatively poor constraints in Fit A, which relies solely on the HERA data. Even with the addition of Drell-Yan data sets in Fit B, the constraints on the strange quark remain limited, as reflected by the large associated uncertainty bands. However, the inclusion of LHC and Tevatron W/Z boson production cross-section data in Fit C leads to much better constraints and significantly reduced error bands for the strange quark PDF across all values.
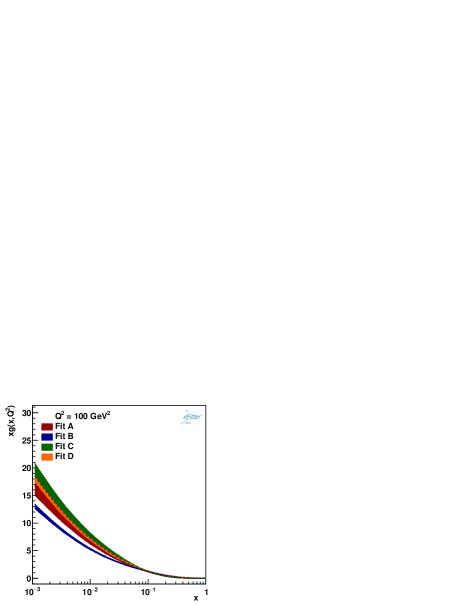
For the gluon PDFs, the differences are even more pronounced. The inclusion of additional data sets, particularly those from W/Z boson production, affects the central values; however, it does not lead to a significant reduction in the uncertainty bands. This highlights the critical role of jet production data sets from collider DIS and hadron colliders in providing stronger constraints on the gluon distribution across both small and large values of .
In our QCD fits discussed above, we chose not to include jet production data sets, as the main motivation of this work is to specifically examine the constraints on individual PDFs from HERA DIS, Drell-Yan, and W/Z boson production data sets. This approach allows us to isolate and better understand the individual contributions and the impact of these particular data sets on the determination of PDFs. The inclusion of jet and dijet production data in our QCD fits will be discussed in Sec. VII, where we will explore their effects on the extracted PDFs and the strong coupling constant.
.
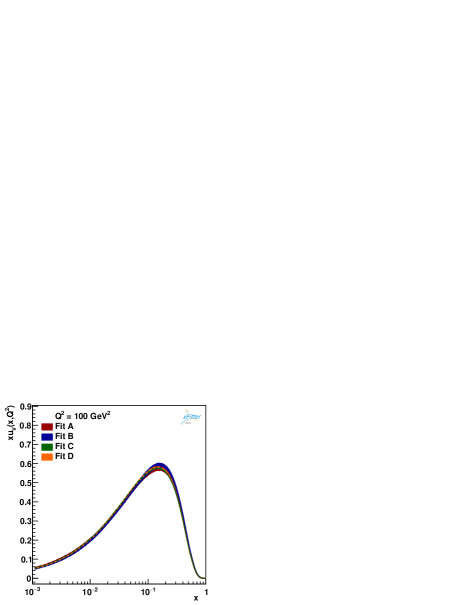
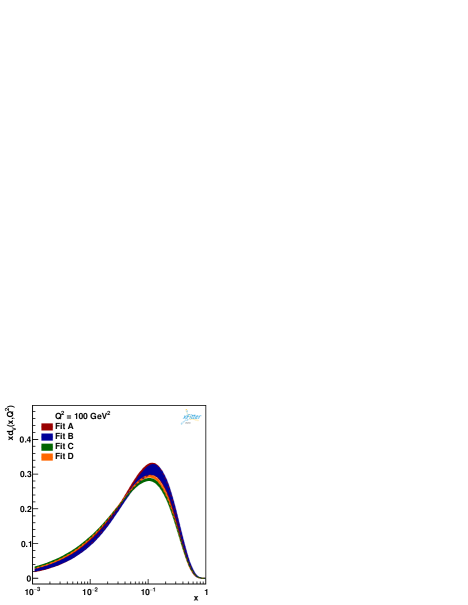
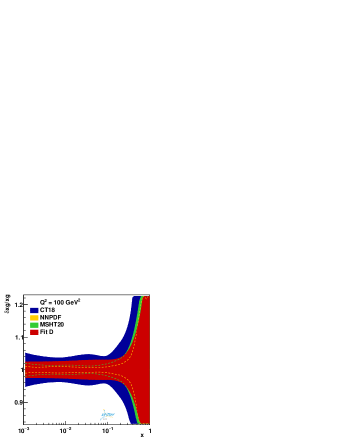
Detailed comparisons of the NNLO quark and gluon PDFs are presented in Figs. 3, 4, 5, and 6, this time at higher values of and 100 GeV2, respectively. The general observations discussed earlier remain valid for the PDFs at these higher scales as well. However, it is important to highlight a key finding apparent in these plots regarding the combined inclusion of all data sets. As shown, incorporating all the data sets together results in more significant constraints on the PDFs, which in turn leads to noticeably smaller uncertainty bands for all parton species, as illustrated in the ratio plots of Figs. 4 and 6.


V.3 Impact of higher-order QCD corrections
In this section, we discuss the effects of higher-order QCD corrections on the extracted PDFs and their associated uncertainties. As presented in Table 2, the overall fit quality remains excellent for both individual and global data sets for NNLO accuracy, indicating that the NNLO corrections result in a good description of the experimental data across a wide range of observables.
The inclusion of NNLO corrections is vital for achieving high-precision results, especially for processes such as Drell-Yan production, W/Z boson production, and jet production, which are sensitive to higher-order effects. The CT18, MSHT20, and NNPDF4.0 analyses also emphasize the importance of NNLO corrections in reducing theoretical uncertainties and improving the overall agreement between theory and experimental data. For example, the MSHT20 analysis shows improvements in the description of LHC data, particularly for gluon-sensitive processes, while NNPDF4.0 utilizes advanced machine learning techniques to incorporate NNLO corrections and reduce biases in PDF parameterizations.
In Fig. 7, we show the PDFs at both NNLO and NLO as functions of for three different values: 1.9, 10, and 100 GeV2. The uncertainty bands, calculated using the Hessian method, illustrate the effect of higher-order corrections on the PDFs. The impact of NNLO QCD corrections on the central values of the PDFs is generally modest relative to the uncertainties; however, differences can be observed in specific parton distributions. For instance, the total singlet distribution is larger at NNLO than at NLO, particularly in the small to medium range. The gluon PDF shows a slight reduction at NNLO in the small to medium region, reflecting the sensitivity of gluon-dominated processes to higher-order effects.
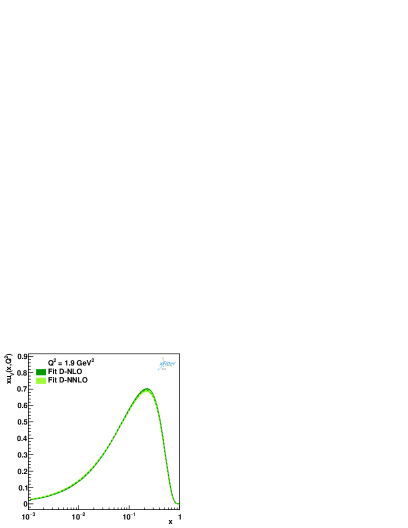

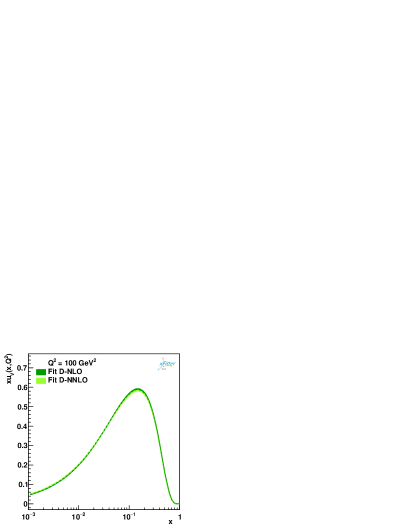


Additionally, as Fig. 8 demonstrates, the changes in the central values of the PDFs due to NNLO corrections are most pronounced at lower values of , where higher-order effects are more substantial. Both the total singlet and gluon distributions exhibit the largest deviations from their NLO counterparts.
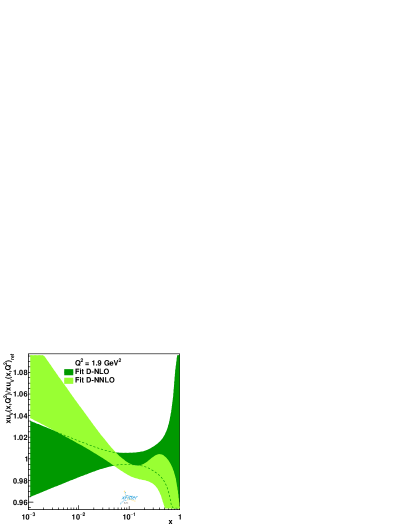
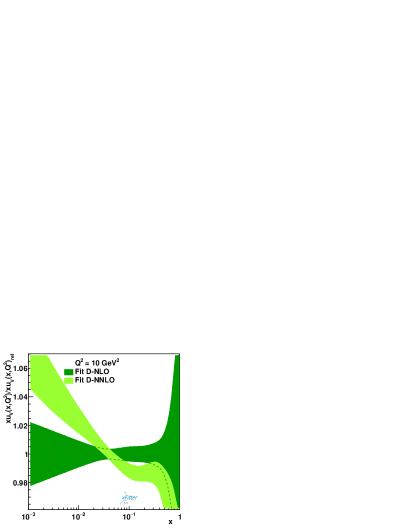
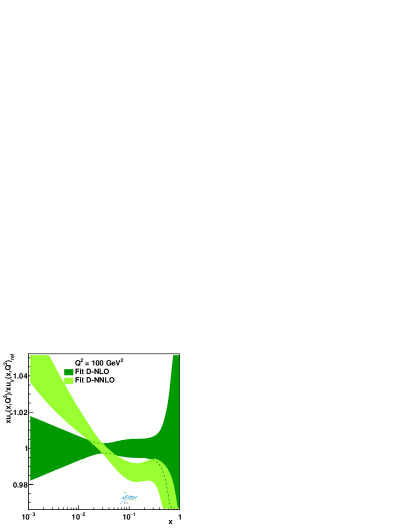
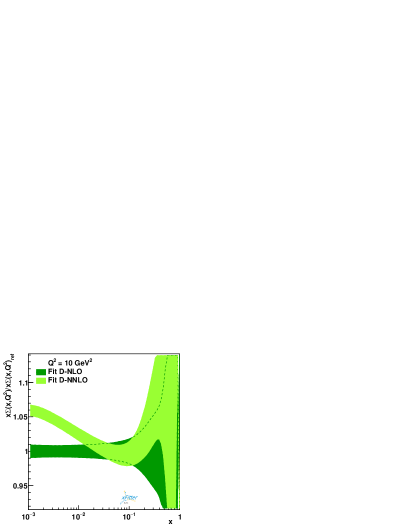

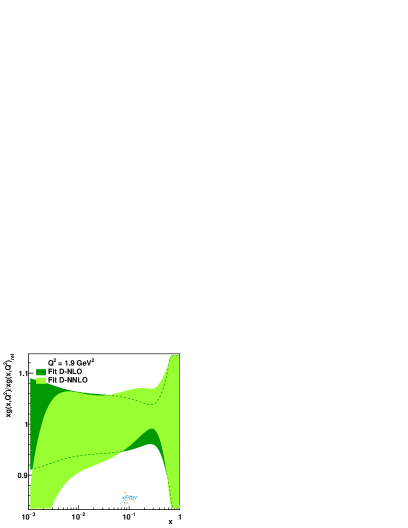
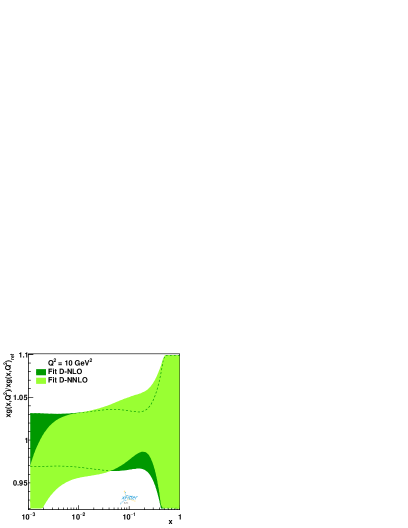
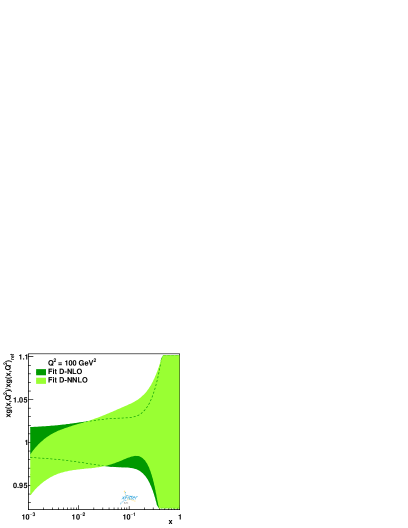
While the central values of the PDFs shift slightly due to NNLO corrections, the associated uncertainties remain largely unaffected. This stability is evident for all parton species, as the uncertainty bands at NLO and NNLO are of comparable size. The values in Table 4 confirm that the NNLO fits provide only a modest improvement in the overall uncertainty reduction. This suggests that the inclusion of NNLO corrections does not drastically reduce uncertainties but primarily leads to shifts in the central values, particularly for the singlet and gluon PDFs.
Table 4 also compares the values obtained from the NLO and NNLO fits for the different data sets analyzed in this work. As shown, the total is slightly lower at NNLO, with a total of 1678/1339 compared to 1699/1339 at NLO. This improvement is consistent with the results from the CT18 and MSHT20 studies, where NNLO corrections lead to better overall fit quality and improved agreement with experimental data.
| Experiment | NLO (Fit D) | NNLO (Fit D) |
| HERA I+II | 1155 / 1016 | 1151/ 1016 |
| CMS | 106.4 / 90 | 106.8 / 90 |
| ATLAS | 108.6 / 91 | 104.8 / 91 |
| ATLAS Drell-Yan | 26.3 / 27 | 25.3 / 27 |
| D0 | 68 / 51 | 67 / 51 |
| CDF | 73 / 41 | 75 / 41 |
| E866 Drell-Yan | 50 / 39 | 50 / 39 |
| Correlated | 114 | 113 |
| Log penalty | -1.26 | -13.22 |
| Total / dof | 1699 / 1339 | 1678 / 1339 |
Notably, the fit to the ATLAS data shows a more pronounced improvement at NNLO, with a of 104.8/91 compared to 108.6/91 at NLO. This indicates that NNLO corrections are particularly important for precision measurements of electroweak processes, where small corrections can significantly improve the fit. Similarly, the for the HERA I+II dataset shows a slight improvement at NNLO (1151/1016 vs. 1155/1016 at NLO).
Overall, the values demonstrate that the inclusion of NNLO corrections leads to modest improvements in fit quality across most data sets, confirming the necessity of higher-order corrections for precise determinations of PDFs, particularly in processes dominated by gluon-gluon or quark-gluon interactions. While NLO fits remain reasonably accurate for many applications, NNLO fits are essential for precision studies at high-energy colliders such as the LHC and future experiments like the EIC, LHeC, and FCC (he, hh).
V.4 Comparison to other PDF sets
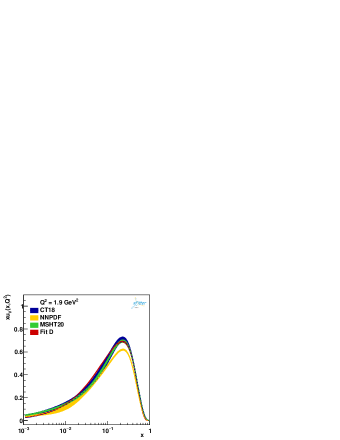
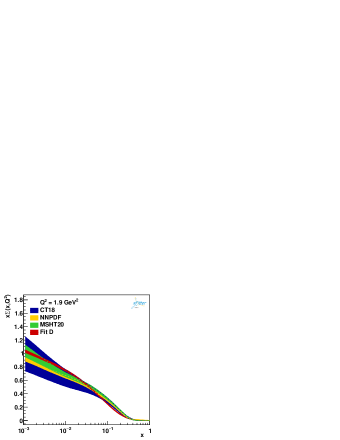
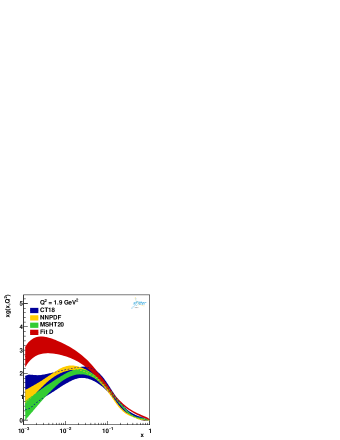
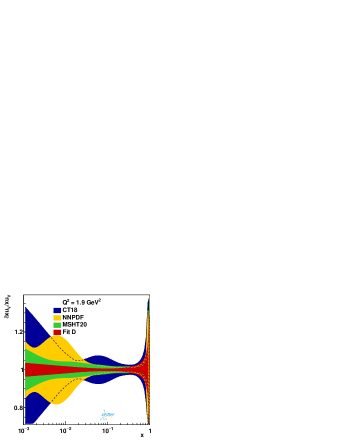
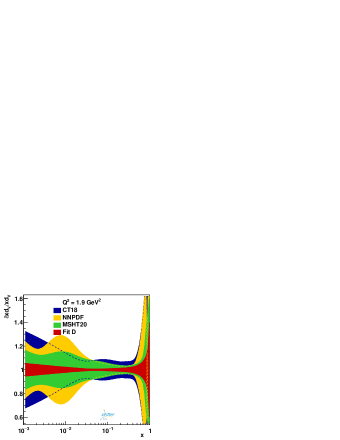
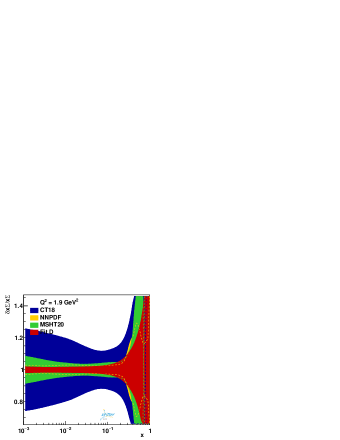
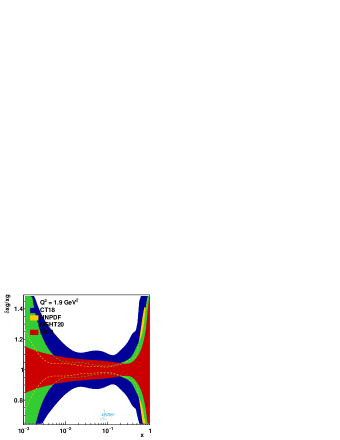
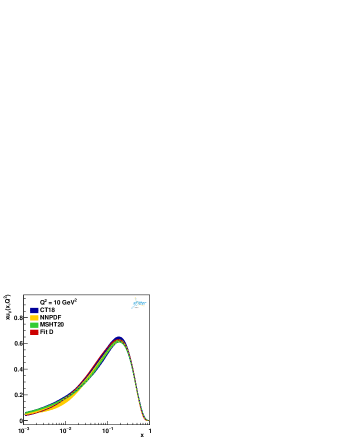
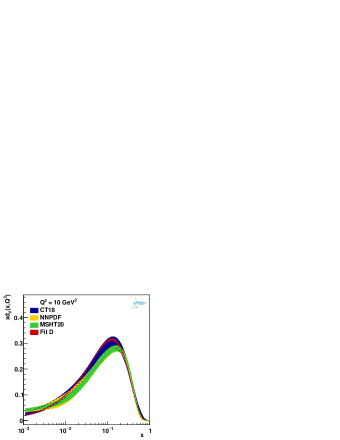
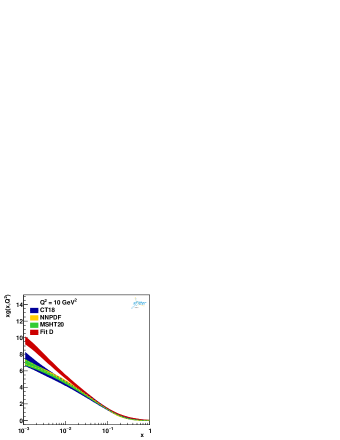
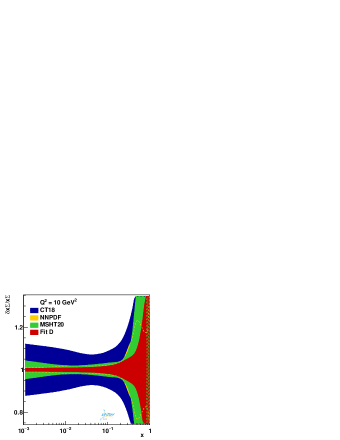
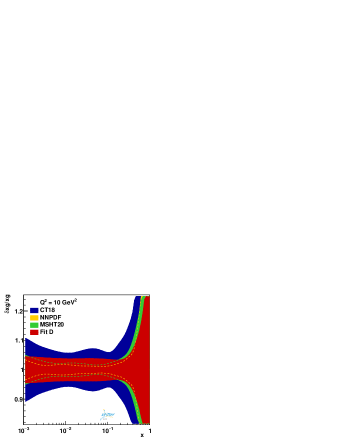
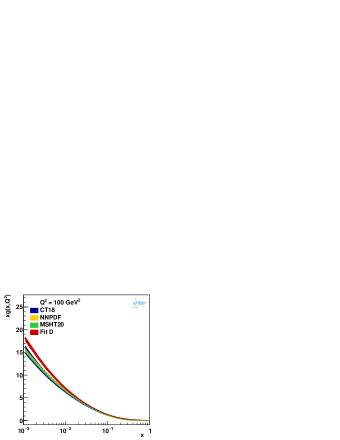
In this section, we compare our nominal NNLO PDFs (Fit D) with other recent global sets, specifically NNPDF4.0 NNPDF:2021njg , CT18 Hou:2019efy , and MSHT20 Bailey:2020ooq . All results are presented at , 10, and 100 GeV2, normalized to our nominal (Fit D) NNLO PDFs. The PDF uncertainties are consistently shown at the 68% confidence level (CL) for all sets, including those from the comparison groups, ensuring a fair basis for comparison. This consistency in uncertainty presentation is intended to provide a clear understanding of the relative uncertainties across the different PDF sets.
As discussed in Sec. IV.1, our analysis includes six independently parameterized distributions: , , , , , and . Similar to CT18 and MSHT20, we rely on a dynamically generated charm distribution through the VFNS, rather than independently parameterizing the charm quark. In contrast, NNPDF4.0 independently parameterizes eight PDFs, which include both the strange and charm distributions. It is also important to note that there are substantial differences in the underlying data sets used in these QCD analyses.
Overall, the four parton sets shown in these plots are generally in good agreement within their respective uncertainties, though some differences in shape are observed. These differences are more pronounced at the input scale, GeV2, particularly for the total singlet and gluon distributions. For the valence densities, and , NNPDF4.0 is slightly suppressed at intermediate values of compared to the others. Notably, our gluon density is larger than the others, especially at small values of . Our valence and total singlet densities are in good agreement and are consistently within the uncertainty envelopes of CT18 and MSHT20.
More pronounced differences are observed for the gluon distribution. However, it is important to note that all other PDF sets include jet data, which provide additional constraints on the gluon PDF. In contrast, our Fit D does not include any jet production data sets, as our primary goal is to investigate the impact of Drell-Yan and W/Z boson production data on the shape of different parton species and their associated uncertainties. The gluon distribution in our analysis is in fair agreement in the small region, which is relevant for dominant Higgs boson production at the LHC.
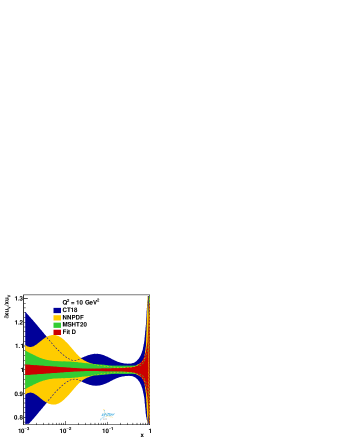
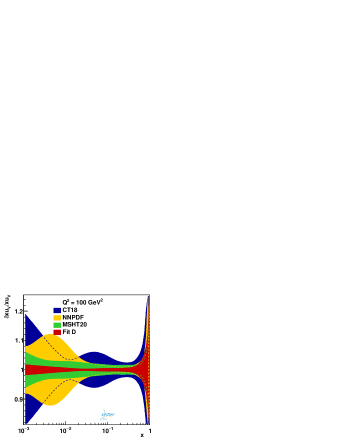
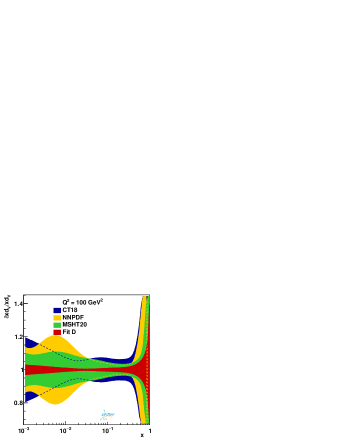
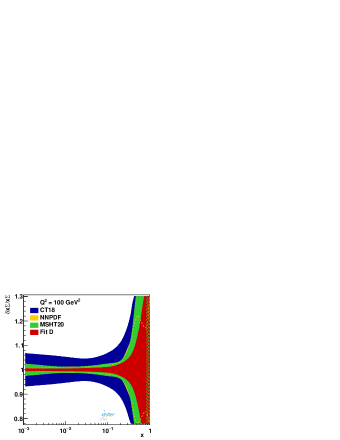
More interesting findings emerge from Fig. 9 when comparing PDF uncertainties. Our uncertainties for the valence and total singlet distributions are smaller than those of all other sets across the entire region. However, the associated uncertainty for our gluon PDF is generally larger compared to the uncertainties of NNPDF4.0 and MSHT20 for . The CT18 analysis, on the other hand, exhibits generally larger uncertainties for all parton densities shown in Fig. 9.
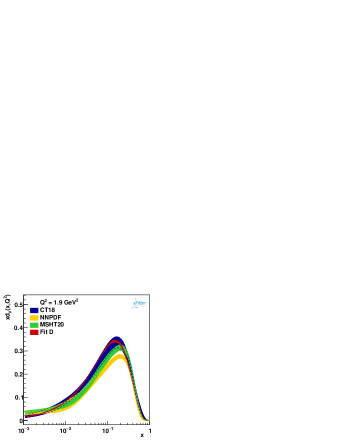
The same findings hold for higher values of and 100 GeV2, as shown in Figs. 10 and 11. As can be seen, the gluon PDF from all other groups is slightly suppressed in the smaller region () compared to our Fit D. Due to the lack of data directly constraining the gluon PDF, our uncertainty is larger than those of NNPDF4.0 and MSHT20. Once again, CT18 generally exhibits larger uncertainties for all parton densities across the entire region, as shown in Figs. 10 and 11.


V.5 Comparison to experimental data
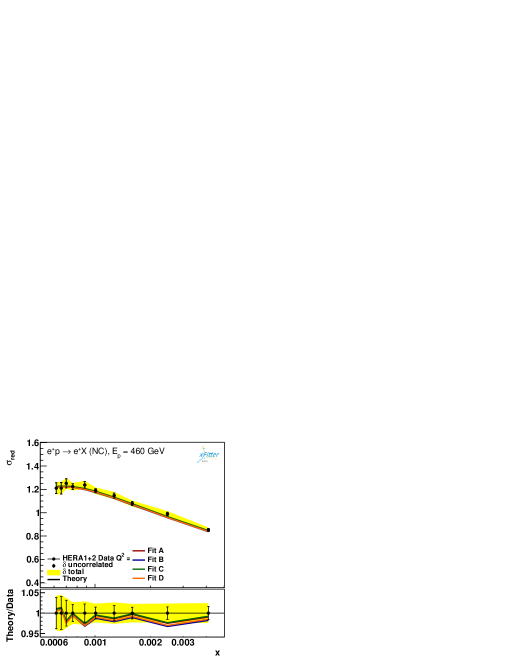
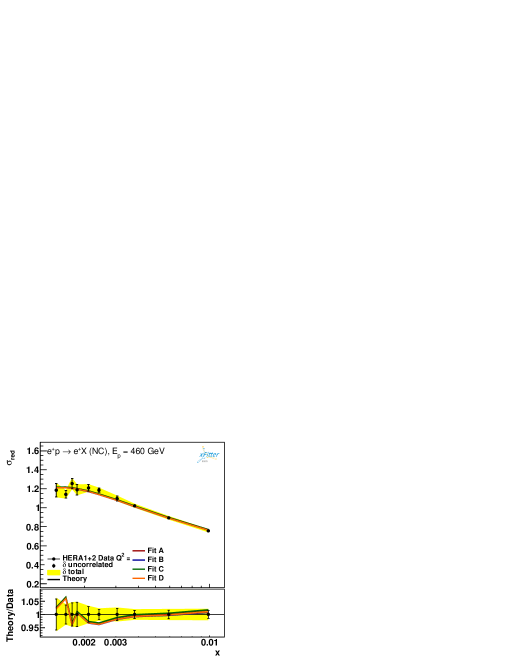
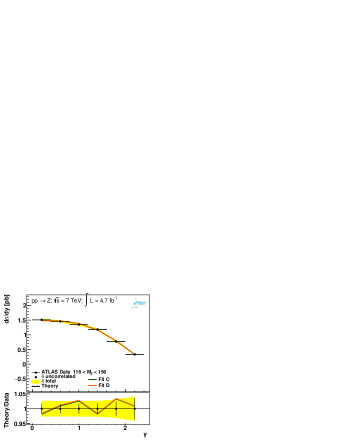
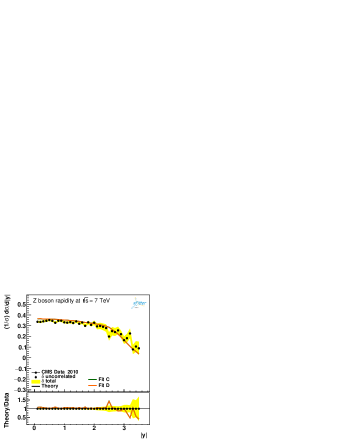
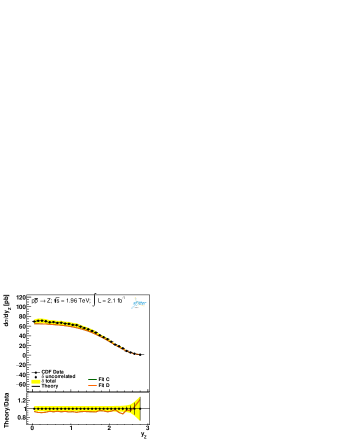
Here, we illustrate the ability of our NNLO QCD fit to describe the individual experiments included in our QCD analysis, with particular attention paid to the Drell-Yan data and W/Z boson production. We organize our data/theory discussions according to the specific physical processes.
In Figs. 12, 13, and 14, we present a comparison between a selection of data included in our QCD fits and the corresponding NNLO best-fit results. This comparison aims to visually assess the fit quality and the relative size of data and PDF uncertainties. The data shown are representative of the global dataset, starting with the H1/ZEUS combined data sets, as shown in Fig. 12. Specifically, we show the results for both NC (top panel) and CC (bottom panel) HERA combined DIS data, where the bulk of the sensitivity in our fit still arises from HERA data. The data error bars shown in this figure correspond to the sum in quadrature of all uncertainties. Quantitative assessments of these comparisons are provided by the values presented in Table 2.
Since the HERA combined DIS data sets serve as our base data set selection, we present the comparison of our NNLO theory predictions for all four sets of PDFs discussed in Sec. V. The main finding from Fig. 12 is the very good agreement of our NNLO theory predictions with the HERA data for the kinematics shown.
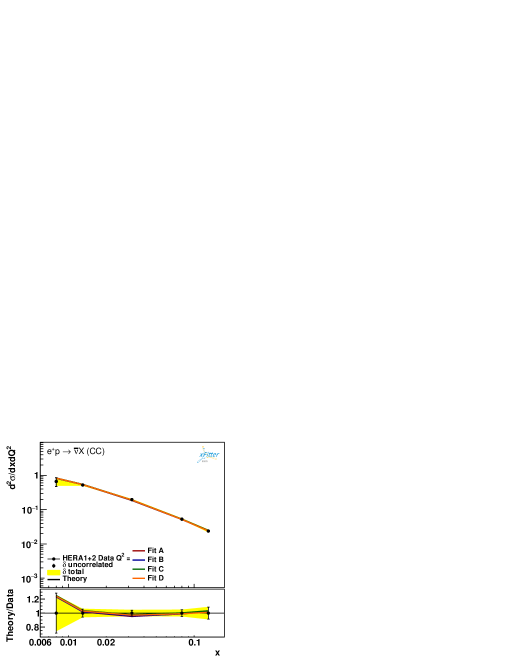

Next, we discuss the comparisons between our NNLO theory predictions and selected Drell-Yan datasets. In Fig. 13, we show comparisons for the E866 Drell-Yan data and the ATLAS low-mass Drell-Yan data. As previously discussed, Drell-Yan cross-section measurements have a significant impact on our PDFs compared to other datasets. The inclusion of these measurements allows for a clearer separation of the sea quark distributions, resulting in a notable reduction in the error bands as well.


Finally, in Fig. 14, we present a detailed comparison of our NNLO theory predictions with selected data sets from W/Z boson production measurements by CMS, ATLAS, D0, and CDF. Overall, the fit quality is satisfactory, and our nominal Fit D provides a generally good description of the data. However, some disagreements are observed in specific kinematic regions of certain datasets. As indicated by the values in Table 2, there are evident tensions between specific data sets. These tensions are particularly notable for the CDF asymmetry data CDF:2009cjw , the ATLAS low-mass data ATLAS:2016nqi , and the HERA1+2 NC 920 dataset Abramowicz:2015mha . Such inconsistencies suggest that these data sets impose conflicting constraints on the PDFs, potentially affecting the overall quality of the fit.


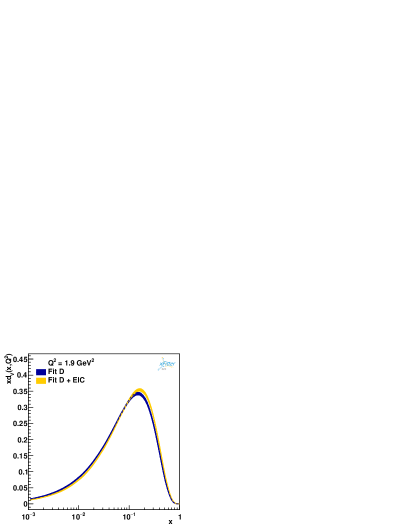
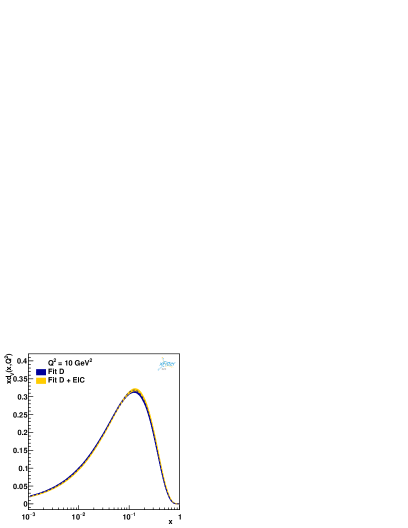
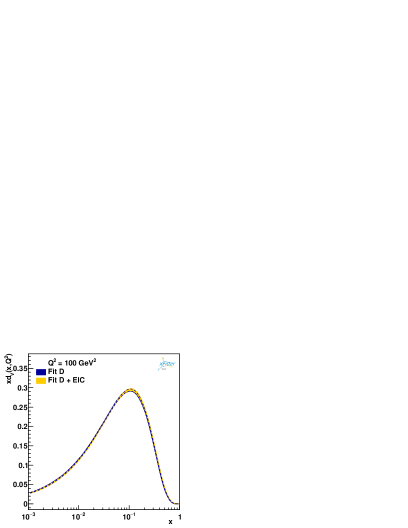
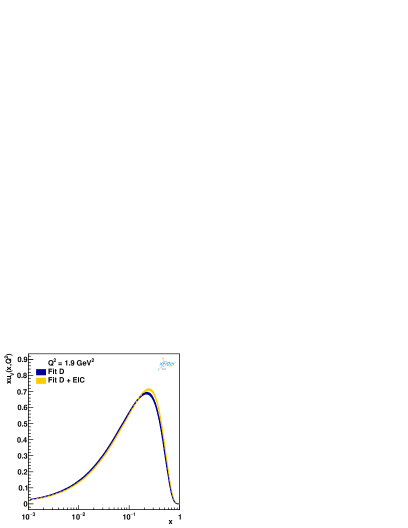
VI Impact of simulated EIC DIS data on proton PDF determination
In this section, we explore the impact of simulated inclusive DIS data from the future Electron-Ion Collider (EIC) on the determination of proton PDFs at NLO and NNLO accuracy in QCD. Comparisons are made relative to our nominal global fit, Fit D, as discussed in the previous sections. We also estimate the expected experimental uncertainty in the strong coupling constant, , when simulated EIC inclusive data are incorporated into analyses similar to those performed using HERA data.
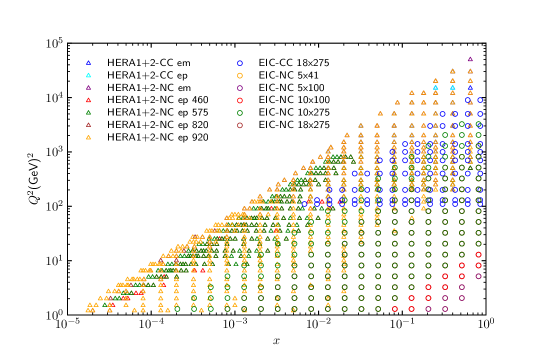
The EIC, currently being developed at Brookhaven National Laboratory (BNL) in collaboration with the Thomas Jefferson National Accelerator Facility, is expected to start collecting data around 2030 AbdulKhalek:2021gbh ; Burkert:2022hjz ; Accardi:2012qut . The EIC will collide highly polarized electrons with highly polarized protons, as well as light or heavy nuclei. In electron-proton mode, the anticipated luminosity will range from cm-2 s-1, with a center-of-mass energy spanning from 29 GeV to 141 GeV. The broad physics program of the EIC includes high-precision measurements of inclusive DIS cross sections, with a particular focus on the large Bjorken- kinematic region, complementing the measurements from H1 and ZEUS at HERA. Earlier investigations of the impact of inclusive EIC data on precision and proton PDFs can be found in Refs. Cerci:2023uhu ; Armesto:2023hnw .
Table 5 shows the different beam energy configurations and their corresponding center-of-mass energies. The EIC will operate with different beam configurations, involving both electron and proton beams at a range of energies. The main data sets we include correspond to NC DIS pseudodata generated for five different beam energy combinations, with center-of-mass energies ranging from 29 GeV to 141 GeV. The most important electron-proton beam configurations included in this study are 10275 GeV, 18275 GeV, 541 GeV, 5100 GeV, and 10100 GeV AbdulKhalek:2021gbh ; Burkert:2022hjz ; Accardi:2012qut . Each data set represents an integrated luminosity anticipated for one year of data collection at the EIC, with simulated measurements performed across a range of and values, logarithmically spaced across six orders of magnitude. The kinematic coverage of the EIC is expected to complement that of HERA, particularly by filling the high- gap that HERA could not reach. Although there will be overlap in the kinematic regions covered, the EIC will provide much higher precision, offering new opportunities to probe the proton structure in this poorly constrained region. The key advantage of the EIC lies in its ability to provide precise data at large , which remained relatively underconstrained by previous HERA DIS experiments.
| Electron beam energy (GeV) | Proton beam energy (GeV) | Center-of-mass energy (GeV) | Integrated Luminosity (fb-1) |
| 18 | 275 | 141 | 15.4 |
| 10 | 275 | 105 | 100 |
| 10 | 100 | 63 | 79 |
| 5 | 100 | 45 | 61 |
| 5 | 41 | 29 | 4.4 |
To improve our understanding of the impact of simulated EIC data on proton PDF determination, we have used NC and CC DIS cross-sections at various center-of-mass energies, as anticipated for the EIC. These simulated data sets were generated based on predictions using HERAPDF2.0NLO and HERAPDF2.0NNLO as the baselines for NLO and NNLO accuracy, respectively Cerci:2023uhu ; Armesto:2023hnw . For other inputs, such as heavy quark masses and the value of the strong coupling constant, we used the nominal values from HERAPDF2.0.
The pseudodata include statistical uncertainties and systematic errors modeled based on experience from HERA, conservatively adjusted to reflect the potential precision of the EIC. Specifically, an uncorrelated systematic uncertainty of 1.9% is applied across most data points, extending to 2.75% for the lowest inelasticity values (i.e., ), along with a normalization uncertainty of 3.4%, fully correlated for each energy configuration. These uncertainties encompass both statistical and systematic components, designed to capture the challenges expected in high-precision EIC measurements.
The pseudodata points were generated by applying random smearing based on Gaussian distributions, with standard deviations determined by the projected uncertainties estimated by the ATHENA collaboration ATHENA:2022hxb . This approach allows us to simulate realistic EIC datasets capable of significantly constraining the proton PDFs, particularly in the region of where existing data from HERA and other sources provide limited coverage. For the purposes of our QCD fits, the point-to-point systematic uncertainties were combined in quadrature with the statistical uncertainties, while the normalization uncertainties were treated as nuisance parameters, following the approach used in Ref. H1:2015ubc .
Figure 15 shows the locations of the HERA DIS datasets and EIC simulated NC and CC inclusive DIS data points in the kinematic plane used in this QCD analysis. As illustrated in the figure, the EIC pseudodata overlap with the HERA DIS data in some regions while also extending the kinematic reach to higher values of in the intermediate range. Additionally, the same cuts imposed on the HERA datasets were also applied to the EIC pseudodata, ensuring consistency in the treatment of kinematic constraints and thereby avoiding the need for additional higher twist corrections in our analysis.
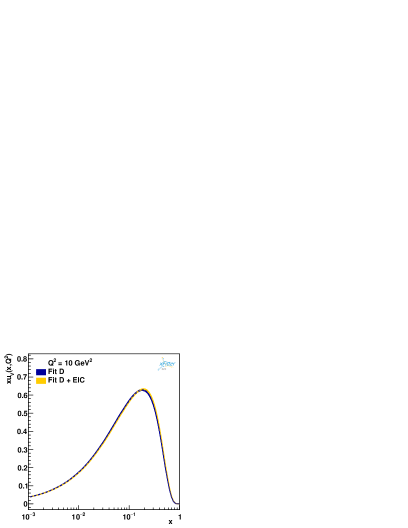
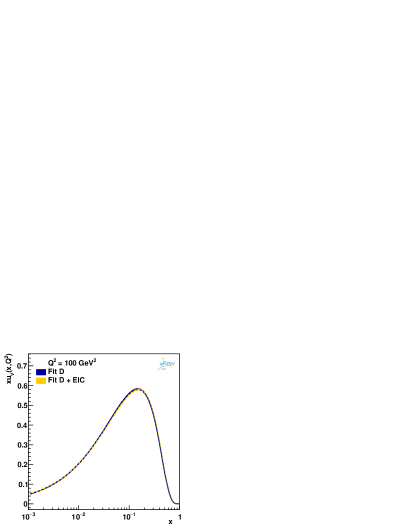
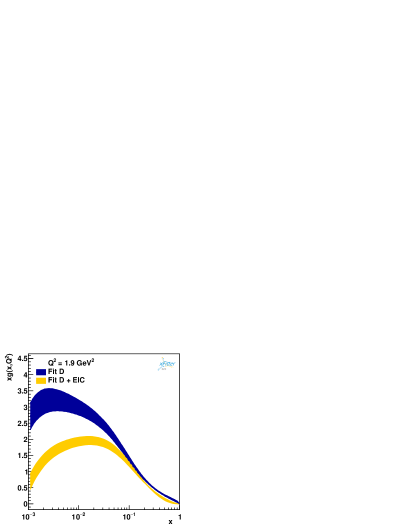
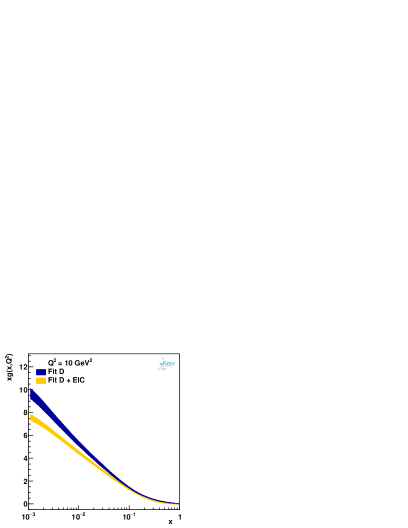
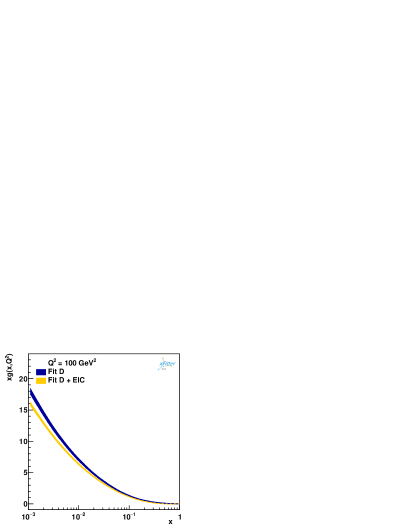
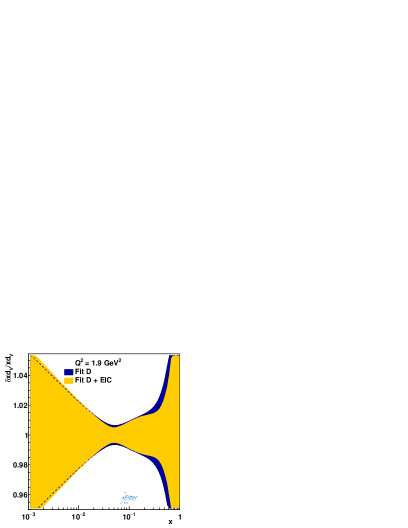
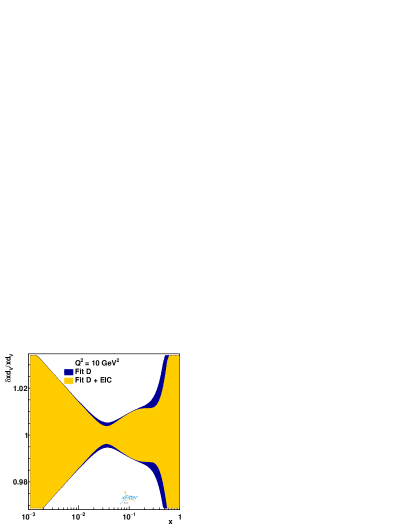
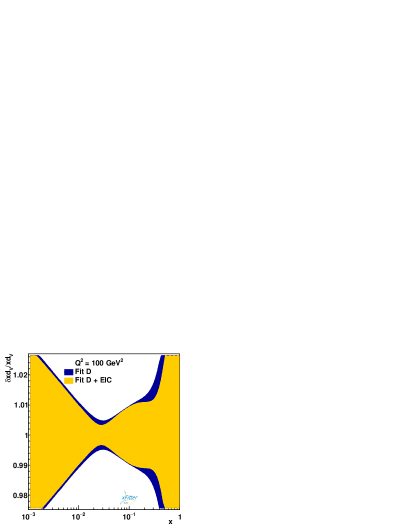
The inclusion of the simulated EIC pseudodata in our global QCD fits provides substantial improvements in constraining the gluon and sea quark distributions, especially at medium to large values of , where the precision added by the EIC data is unprecedented. As shown in Figs. 16 and 17, incorporating these data sets in our global fit (Fit D + EIC) reduces the uncertainties of gluon PDFs at for moderate-to-high . Furthermore, the impact of EIC on the determination of the strong coupling constant is also significant, which we explore in detail in the next section.
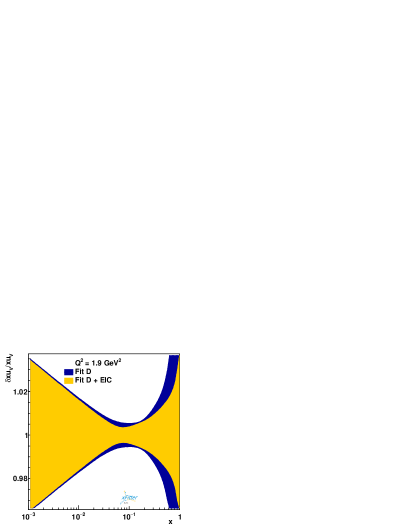
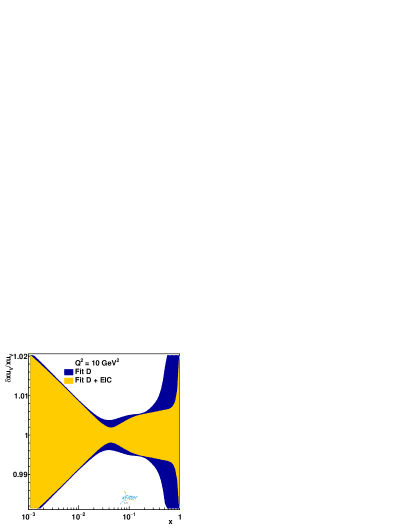
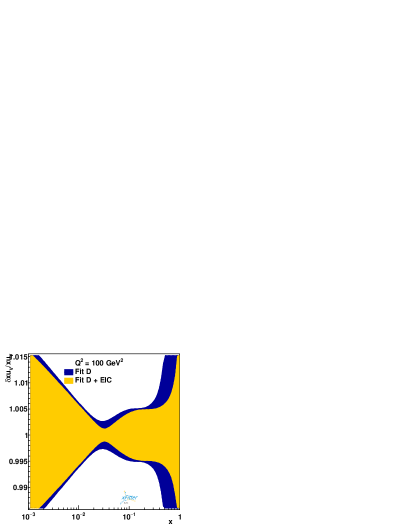
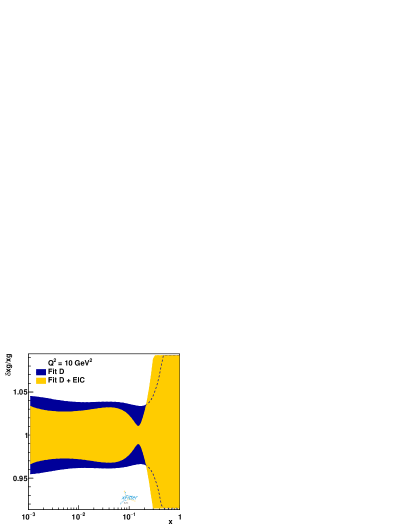
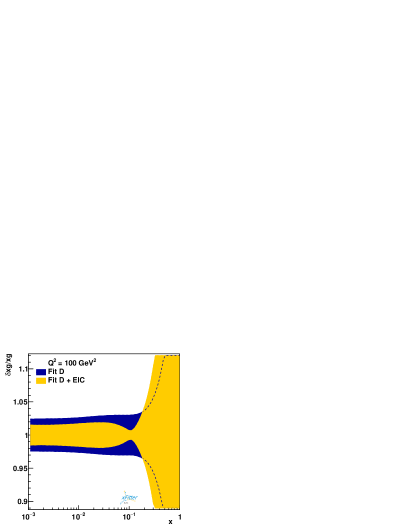
In Table 6, we present the extracted values from our global fits, comparing the baseline analysis (Fit D) with the extended analysis that includes the simulated EIC data (Fit D + EIC). These values, corresponding to different experimental data sets, provide a quantitative measure of the fit quality and illustrate the impact of incorporating EIC pseudodata in the QCD analysis.
| Experiment | Fit D | Fit D + EIC |
| HERA I+II | 1151/ 1016 | 1130/1016 |
| CMS | 106.8 / 90 | 101.8 / 90 |
| ATLAS | 104.8 / 91 | 111.3 / 91 |
| ATLAS Drell-Yan | 25.3 / 27 | 24.3 / 27 |
| D0 | 67 / 51 | 77 / 51 |
| CDF | 75 / 41 | 69 / 41 |
| E866 Drell-Yan | 50 / 39 | 70 / 39 |
| EIC NCep 10x275 | - | 117 / 103 |
| EIC NCep 18x275 | - | 113 / 116 |
| EIC NCep 5x41 | - | 31 / 36 |
| EIC CCep 18x275 | - | 112 / 88 |
| EIC NCep 5x100 | - | 33 / 55 |
| EIC NCep 10x100 | - | 64 / 66 |
| Correlated | 113 | 149 |
| Log penalty | -13.22 | -40.97 |
| Total / dof | 1678 / 1339 | 2160 / 1803 |
The addition of the EIC data results in a significant improvement in the overall fit quality, with the total per degree of freedom (dof) decreasing from 1.25 in Fit D to 1.20 in Fit D + EIC. The fit quality for HERA I+II slightly improves with the addition of EIC data, as indicated by the reduction in from 1151/1016 in Fit D to 1130/1016 in Fit D + EIC. This suggests that the EIC data are consistent with the HERA measurements and help refine the global fit. However, the values for the W/Z production data from CMS, ATLAS, D0, and CDF exhibit mixed results, with minimal changes in the for the ATLAS and E866 Drell-Yan data sets when EIC data are added.
The simulated EIC data sets show good agreement with theoretical predictions, with reasonable values across all beam energy configurations. The NC and CC EIC data sets exhibit values close to 1, indicating a good fit within the global QCD analysis. These data sets considerably improve the constraints on PDFs, particularly in regions of medium to large and moderate , where previous data provided limited constraints.
Our findings clearly demonstrate that the inclusion of EIC pseudodata in the global QCD fit significantly enhances the fit quality, as evidenced by the improved . The EIC data introduce crucial new constraints, resulting in a more precise determination of the proton PDFs. Despite minor tensions with certain data sets, the overall improvement underscores the importance of the EIC for future QCD analyses Cerci:2023uhu ; Armesto:2023hnw .
| Experiment | Fit D | Fit D + jet/dijet | Fit D + EIC | Fit D + EIC + jet/dijet |
|---|---|---|---|---|
| HERA I+II | 1151 / 1016 | 1128 / 1016 | 1130 / 1016 | 1127 / 1016 |
| CMS | 106.8 / 90 | 103 / 91 | 101.8 / 90 | 99.9 / 90 |
| ATLAS | 104.8 / 91 | 112 / 91 | 111.3 / 91 | 111/91 |
| ATLAS Drell-Yan | 25.3 / 27 | 24 / 27 | 24.3 / 27 | 24.4 / 27 |
| D0 | 67 / 51 | 77 / 51 | 77 / 51 | 68 / 51 |
| CDF | 75 / 41 | 66 / 41 | 69 / 41 | 78 / 41 |
| E866 Drell-Yan | 50 / 39 | 72 / 39 | 70 / 39 | 73 / 39 |
| H1 jet | - | 30 / 52 | - | 31 / 52 |
| ZEUS jet | - | 54 / 60 | - | 54 / 60 |
| ZEUS dijet | - | 18 / 22 | - | 17 / 22 |
| EIC NCep 5x41 | - | - | 31 / 36 | 31 / 36 |
| EIC NCep 10x275 | - | - | 117 / 103 | 117 / 103 |
| EIC NCep 18x275 | - | - | 113 / 116 | 113 / 116 |
| EIC CCep 18x275 | - | - | 112 / 88 | 112 / 88 |
| EIC NCep 5x100 | - | - | 33 / 55 | 32 / 55 |
| EIC NCep 10x100 | - | - | 64 / 66 | 64 / 66 |
| Correlated | 113 | 142 | 149 | 156 |
| Log penalty | -13.22 | -27 | -40.97 | -48.72 |
| Total / dof | 1678 / 1339 | 1799 / 1473 | 2160 / 1803 | 2259 / 1937 |
VII Impact of jet and dijet production data on proton PDF determination
This section discusses the significant role that jet and dijet production data play in determining PDFs and reducing their associated uncertainties, particularly for the gluon distribution. We also explore the effect of these data on the precision of the determination of the strong coupling constant, . Historically, inclusive jet and dijet production measurements have been crucial for constraining the gluon density, , due to the high sensitivity of these processes to the gluon PDF, especially at high-energy colliders. Early jet data from HERA and Tevatron Run-II have had a noticeable impact on global PDF fits, as demonstrated in numerous QCD analyses.
The HERA jet data used in our work include measurements of inclusive jet production in DIS at high values, ranging from 150 to 15,000 GeV2, recorded by the H1 Collaboration H1:2007xjj . Additionally, we include data from H1 on jet production in the lower range, below 100 GeV2, based on an integrated luminosity of 43.5 pb-1 H1:2010mgp . The ZEUS Collaboration inclusive jet differential cross-section measurements in DIS for GeV2 with 38.6 pb-1 ZEUS:2002nms and an expanded dataset with 82 pb-1 ZEUS:2006xvn are also included. Furthermore, inclusive dijet cross-sections in DIS measured by ZEUS with an integrated luminosity of 374 pb-1 ZEUS:2010vyw are considered as well.
In Fig. 18, we compare our nominal fit (Fit D) at NNLO accuracy with the extended fit (Fit D + jet/dijet), which includes the aforementioned HERA jet and dijet production data. The comparisons are presented for the relative uncertainties of the gluon PDFs, , at and . As can clearly be seen, the inclusion of the gluon-sensitive jet and dijet data significantly reduces the error bands, especially at moderate to very small values of . This reduction indicates the crucial role of jet and dijet production data in constraining the gluon PDF, which is inherently difficult to determine with precision in the absence of such data. The enhanced constraints provided by the HERA jet and dijet datasets are particularly impactful in reducing uncertainties in the low region, where the gluon contribution is less well-determined. In terms of the overall quality of the fit, as summarized in Table 7, the value improves from in the nominal fit (Fit D) to when the jet and dijet data are included (Fit D + jet/dijet). The reduction in demonstrates the importance of these datasets in achieving more precise proton PDF determinations.
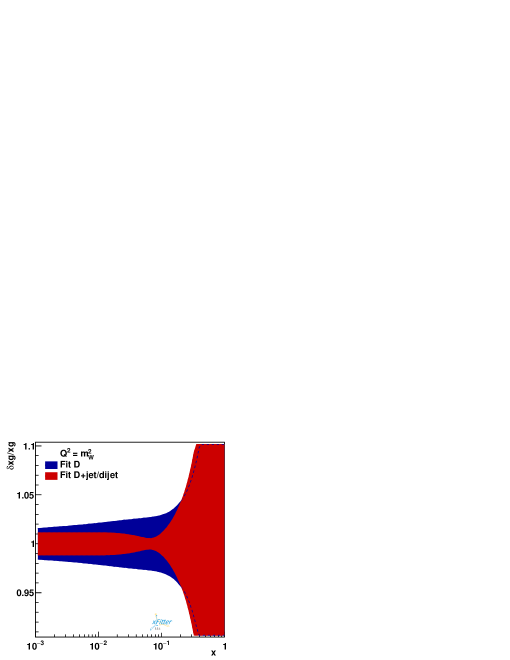

In Figs. 19 and 20, we compare the results of our nominal fit (Fit D) at NNLO accuracy with fits that include simulated EIC data (Fit D + EIC) and those that incorporate both EIC and HERA jet/dijet data (Fit D + EIC + jet/dijet). The comparisons are presented for the distributions , , and as functions of , at , 10, and 100 GeV2.
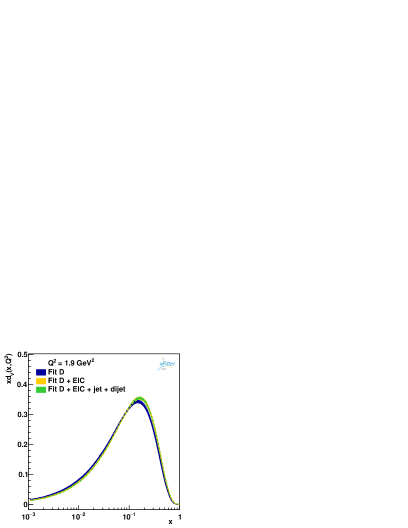
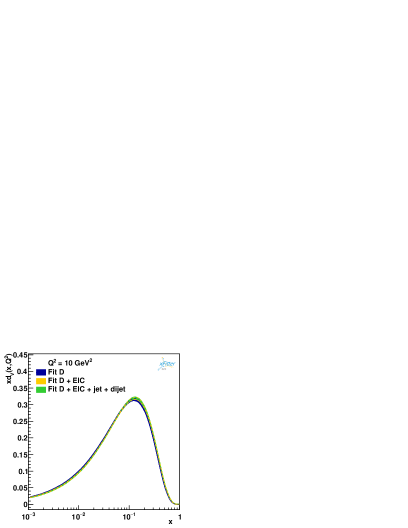
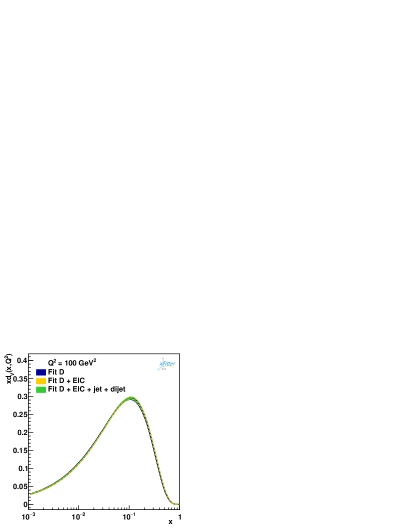
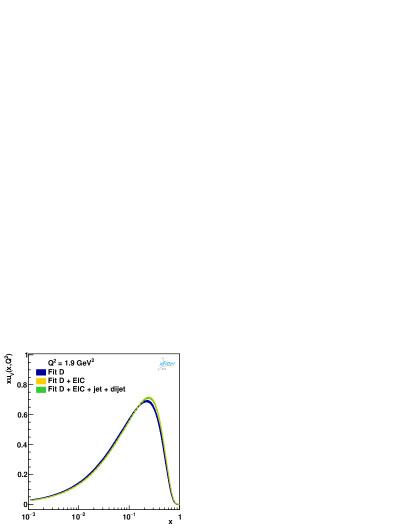
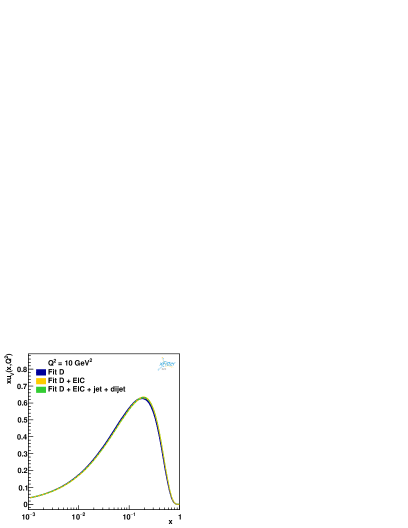
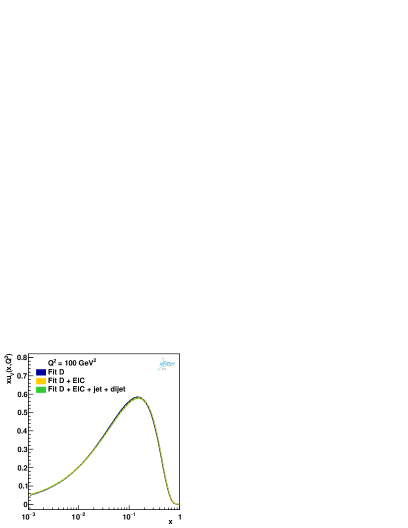
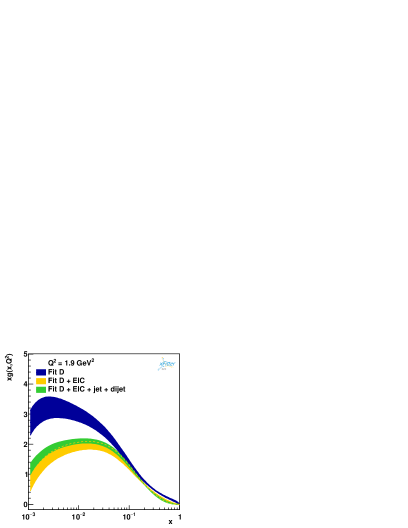
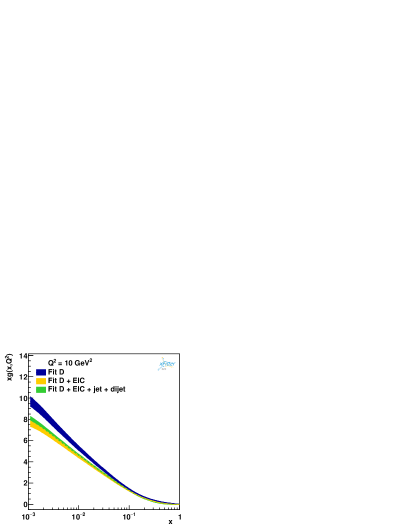
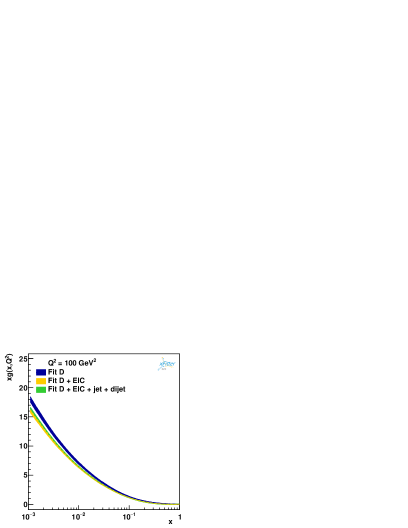

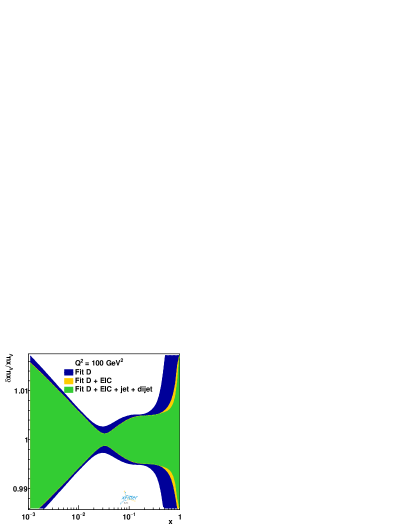
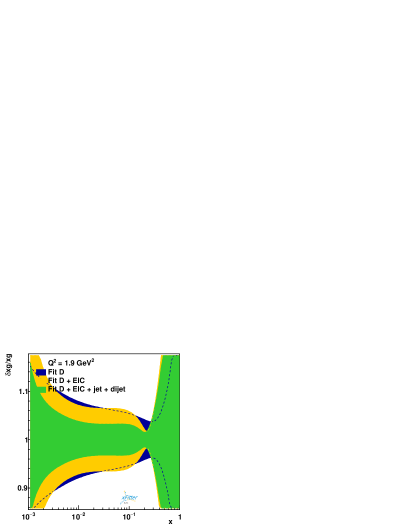
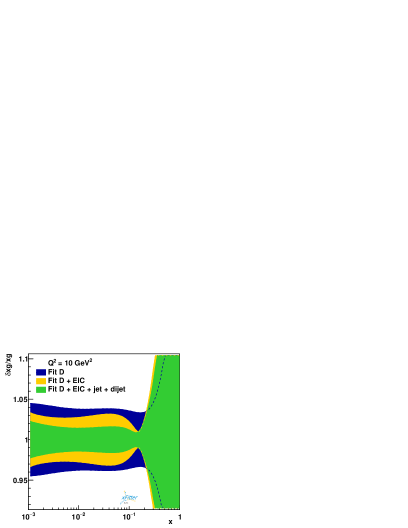
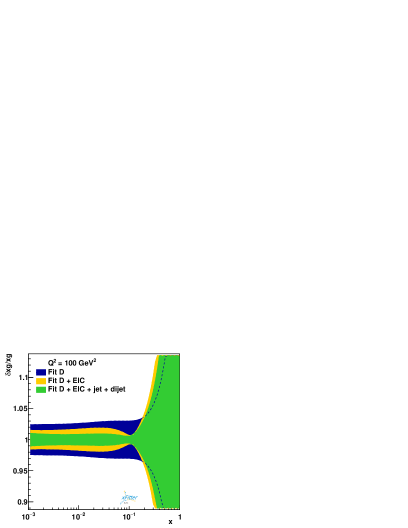
As observed in Figs. 19 and 20, the inclusion of HERA jet and dijet data significantly constrains the gluon distribution, resulting in reduced uncertainties, particularly at medium and very small values of . This is because jet production cross-sections in DIS are directly sensitive to the gluon density.
Moreover, jet production data are instrumental in determining the strong coupling constant, . Due to the sensitivity of jet production to higher-order QCD corrections, incorporating jet and dijet datasets allows for a more precise extraction of , thereby enhancing the overall fit quality of global PDF analyses.
In Table 7, we present the values for the global QCD fit both with and without the inclusion of jet and dijet production data. The for the HERA I+II data set remains stable, with a slight improvement from 1151/1016 to 1130/1016. A significant improvement is observed in the values for both CMS and ATLAS W/Z production datasets. The values for the ATLAS and E866 Drell-Yan data sets show minor changes, with the ATLAS improving slightly.
Finally, the addition of jet and dijet production data from HERA provides critical information about the gluon distribution. The values for these data sets reflect the strong constraints that these data provide, particularly in the high region, where gluon-initiated processes dominate. Including these data leads to a significant reduction in the overall uncertainty of the gluon PDF, which in turn improves the precision of predictions for processes sensitive to gluons. The improved reflects enhanced consistency between theoretical predictions and experimental measurements, further supporting the inclusion of jet data from the LHC in global QCD fits to improve the precision of proton PDFs and determinations.
Further improvements in PDF uncertainties, particularly for the gluon distribution, are anticipated when inclusive jet and dijet data from the EIC are added to the QCD analysis. These data are also expected to significantly contribute to the precision of . Future studies could employ theory grids for various EIC energies using the fastNLO framework Kluge:2006xs , although such an analysis is beyond the scope of this work. Additionally, incorporating a broader range of hadron collider jet and dijet data sets could further constrain the gluon PDFs and improve the precision of .
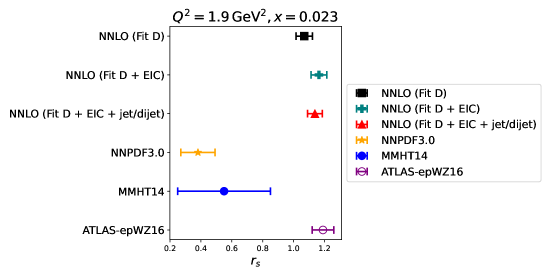
VIII Strange-quark density
The strange quark distribution in the proton plays a crucial role in understanding the quark structure of the proton. One of the key quantities characterizing the strange-quark fraction is the ratio , which is defined as the ratio of the strange-quark distribution to the down sea-quark distribution:
| (14) |
This ratio offers insight into the balance between strange and down quarks in the proton sea and is important for various QCD and electroweak processes, particularly in high-energy collider experiments.
In this analysis, we determine at and , a value selected because it lies within the region of maximum sensitivity in the ATLAS data for central rapidity at ATLAS:2016nqi .
We explore the strange-quark fraction further by examining the values of obtained under different fit scenarios. These are summarized in Table 8, which shows the extracted values of from various fits.
| Parameter | Fit D | Fit D + jet/dijet | Fit D + EIC | Fit D + EIC + jet/dijet |
|---|---|---|---|---|
The baseline fit (Fit D) yields , indicating a nearly equal strange-to-down sea-quark density, consistent with previous findings of an unsuppressed strange quark content at small . For our Fit D + EIC when projected data from the EIC are included in the fit, increases to , suggesting that the EIC will significantly enhance the precision of strange-quark density. Finally Fit D + EIC + jet/dijet in which the jet and dijet production data included to the fit, is slightly reduced to , while the uncertainty is reduced even further.
The ATLAS data, combined with future measurements from the EIC and precision jet experiments, will continue to play a crucial role in reducing the uncertainties associated with the strange quark distribution. The extracted values of in this analysis suggest that strange quarks contribute significantly to the proton sea. These findings will have a broad impact on QCD phenomenology and future high-energy physics experiments, particularly in processes involving electroweak boson production and DIS.
Our determinations of for the three different analyses mentioned above are illustrated in Fig. 21. The measurements are presented with both the experimental and PDF-fit related uncertainties. The results are also compared with recent global fit analyses, specifically ATLAS-epWZ16 ATLAS:2016nqi , NNPDF3.0 NNPDF:2014otw , and MMHT14 Harland-Lang:2014zoa . As can be seen, both NNPDF3.0 and MMHT14 analyses predict to be significantly lower than unity, with values ranging between approximately 0.3 and 0.6. However, our result from the Fit D + EIC analysis shows better agreement with the ATLAS-epWZ16 analysis, as both analyses use the same data set.
IX Strong coupling constant
The precise determination of the strong coupling constant, , relies on various experimental data sets that are sensitive to different aspects of the proton PDFs. In this section, we examine how the EIC and jet/dijet production data contribute to constraining , focusing on the complementary information these data sets provide about quark and gluon interactions. This sensitivity arises from the unique kinematic coverage and specific processes probed by the EIC and jet production measurements, making them highly valuable for reducing uncertainties in and enhancing the precision of global QCD fits. The EIC will significantly enhance the determination of the strong coupling constant, , through its extensive kinematic reach, particularly in regions where current data sets, such as those from HERA, are less effective.
The strong coupling constant, , governs the evolution of quark densities as the energy scale increases. In the large regime, quark distributions are particularly sensitive to because parton-parton interactions dominate in this region. By probing large , the EIC directly measures the evolution of quark PDFs, thereby providing precise constraints on the behavior of in this regime.
The sensitivity of EIC to also arises from the specific processes it probes and the unique kinematic overlap it offers with previous data. In DIS processes, the interaction between quarks and gluons is directly affected by . The structure functions measured in EIC experiments, such as , depend on quark-gluon interactions, which are controlled by . The quantity , which measures scaling violations, is particularly sensitive to , especially at large . In this region, the evolution is dominated by the splitting, which involves the product of and the large- quark densities. The high precision of EIC measurements leads to more accurate constraints on the quark-gluon coupling and, consequently, on , with a reduced dependence on the gluon distribution compared to lower values.
This decoupling reduces the correlation between and the gluon distribution, resulting in a more precise extraction of . The inclusion of simulated EIC data in the fits provides additional coverage of the phase space, particularly in regions where HERA data alone were limited. This unique contribution from the EIC highlights its role in providing world-leading precision for the determination of , supporting future QCD analyses and experimental research Cerci:2023uhu ; Armesto:2023hnw .
As illustrated in Table 8, the inclusion of EIC pseudodata significantly reduces the uncertainty on from 0.0014 (in the baseline Fit D) to 0.0008. This reduction is primarily due to the enhanced sensitivity to quark-gluon interactions and the broader kinematic coverage provided by the EIC. A summary of the measurements at different collaborations, including the H1, ZEUS, ATLAS and CMS. H1:2015ubc ; H1:2017bml ; ZEUS:2023zie ; ATLAS:2023tgo ; ATLAS:2023bax ; ATLAS:2015yaa ; ATLAS:2017qir ; ATLAS:2018sjf ; CMS:2021yzl ; CMS:2014mna ; CMS:2014qtp ; CMS:2016lna ; CMS:2017tvp ; CMS:2018fks ; CMS:2019esx , as well as the world average ParticleDataGroup:2024cfk , is also presented in Fig. 22. Our analyses performed at NNLO are indicated separately for comparison.
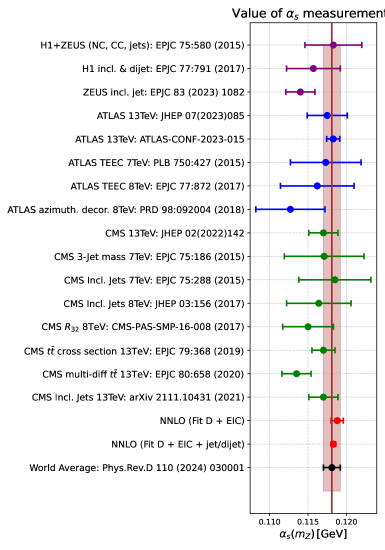
Jet and dijet production measurements offer complementary sensitivity to , primarily through their ability to probe the gluon distribution in the proton. Jet production is particularly sensitive to gluon-gluon and quark-gluon interactions, both of which are controlled by . The strong coupling constant directly enters the cross-sections for jet production, making these measurements a powerful tool for constraining . Consequently, the inclusion of jet and dijet data in the QCD fit provides direct constraints on the gluon distribution and , particularly at high energy scales.
Jet and dijet production data, particularly from the LHC and HERA, cover a broad range of high values. In this regime, gluon interactions become increasingly important, enhancing the sensitivity to . The precise measurement of jet cross-sections at large significantly reduces the uncertainty in the determination of , as evidenced by the improved results in Fit D + EIC + jet/dijet, where the uncertainty on decreases to 0.0003.
While the EIC data provide essential constraints on quark distributions at lower energy scales, jet and dijet production measurements contribute by refining our understanding of gluon distributions at higher energy scales. Together, these datasets offer complementary sensitivity to , ensuring that both quark and gluon interactions are accurately described in the global fit.
The combination of EIC and jet/dijet data leads to a significant improvement in the precision of . As seen in Table 8 and Fig. 22, the inclusion of both datasets in the global fit reduces the uncertainty on from 0.0008 (Fit D + EIC) to 0.0003 (Fit D + EIC + jet/dijet).
These results suggest that further improvements in the precision of could be achieved by incorporating inclusive jet and dijet data from the EIC into the QCD analysis. This could be facilitated by using theory grids for EIC energies within the fastNLO framework. Additionally, other observables measurable at the EIC could provide further opportunities for constraining the strong coupling constant.
Beyond a DIS-only approach, it would be valuable to explore the impact of EIC data on determinations in global QCD fits that integrate data from LHC measurements not included in this work, as well as other experimental sources. Before the EIC becomes operational, progress in understanding higher-order uncertainties will be crucial. Reaching a consensus on addressing these uncertainties in determinations based on EIC data will be essential for maximizing the precision of future measurements.
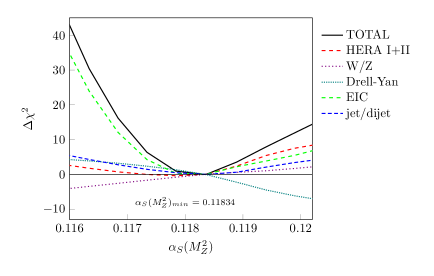
X Sensitivity of various datasets to the strong coupling constant
In every proton PDF analysis, the sensitivity of each dataset whether individually or collectively to the variation of the strong coupling constant depends on the chosen settings, such as the parameterization and the values of applied cuts. One of the most effective approaches for assessing this sensitivity is the -scan method. This method allows us to evaluate how different experimental datasets influence the fit for . The following equation is used for the -scan:
| (15) |
In this equation, is a function of the fit parameters , which, in this case, is the variation of the QCD coupling constant (). The term represents the minimum value obtained from the final fit, specifically from Fit D + EIC + jet/dijet. This value corresponds to the optimal parameter set, denoted as , which yields the lowest . In contrast, refers to the value obtained for each variation of for a specific experimental dataset () or for all datasets together.
In the -scan procedure, the value of the parameter under study, , is fixed at different specific values, while all other fit parameters are allowed to vary freely, as described in Section IV. The difference between the values obtained from these two types of calculations ( and ) provides the value. This value effectively captures the change in the goodness of fit for different fixed values of .
Figure 23 illustrates the dependence of for different experimental data sets and for the full set of data on variations of , ranging from 0.116 to 0.120. From the comparison of the different curves in the figure, it is evident that shows a strong sensitivity to the variation of , especially when is less than 0.11834. On the other hand, other data sets, such as HERA I+II, , Drell-Yan, and jet/dijet production data, exhibit lower sensitivity to the variation of the strong coupling constant. This suggests that EIC data could play a crucial role in constraining with higher precision compared to the other data sets.
The scan method used here is similar to the approach employed in the CT18 analysis, which also investigated the sensitivity of different data sets, including DIS and jet production data, to . Similar to the CT18 results, the curves for individual datasets generally exhibit a parabolic shape, consistent with the central limit theorem, indicating their respective pulls on the preferred value of . This helps identify any tensions or consistencies across different data sets, providing insights into how well each data set constrains .
XI Summary and conclusion
In this work, we have presented new proton PDFs at both NLO and NNLO accuracy, derived from a comprehensive analysis of high-precision data from the LHC, combined HERA DIS dataset, and additional crucial inputs. We have explored the impact of including data from Drell-Yan pair production, as well as W and Z boson production, on the PDFs and their associated uncertainties. Our findings demonstrate that the inclusion of these data sets significantly enhances the precision and reliability of the proton PDFs, reducing uncertainties across a wide range of kinematic regions. Specifically, the Drell-Yan, W, and Z production data provided important sensitivity to quark distributions at moderate to high values of Bjorken , thereby complementing the information obtained from DIS data. As have been shown, the inclusion of jet and dijet production data further constrained the gluon distribution, reducing the gluon uncertainties for . The resulting PDFs are accompanied by well-defined error estimates calculated using the Hessian method, ensuring a rigorous quantification of uncertainties. This approach guarantees that the uncertainties are propagated appropriately, making these PDFs highly suitable for precision physics studies. Our results highlight the importance of continuously updating PDF determinations with the latest experimental data to achieve percent-level accuracy in theoretical predictions for high-energy processes. This level of precision is crucial for interpreting measurements at the LHC, particularly in processes involving electroweak boson production, jet production, and beyond, where a precise knowledge of the partonic structure is necessary. The simulated data from the future Electron-Ion Collider (EIC) also play a significant role in improving our understanding of the partonic structure of the proton. We have shown that the inclusion of EIC simulated data, in combination with jet and dijet production data from HERA, has the potential to not only improve the determination of the gluon distribution but also enhance the precision of the determination of the strong coupling constant . These improvements underscore the critical role of future facilities like the EIC in global QCD analyses, particularly for better constraining gluon and sea-quark distributions in previously unexplored kinematic regions. Furthermore, the sensitivity study conducted on demonstrates the complementary nature of different data sets, such as DIS, Drell-Yan, W/Z boson, and jet production data, in constraining the strong coupling constant.
Availability of proton PDFs sets
Our proton PDFs, determined at NLO and NNLO in perturbative QCD, have been made available in the LHAPDF library to facilitate their use in a wide variety of high-energy physics analyses. The LHAPDF format allows easy integration of these PDFs with various Monte Carlo event generators, QCD analysis tools, and simulation software used in collider experiments. These PDF sets, corresponding to different global QCD fit scenarios (e.g., Fit D, Fit D + EIC, Fit D + EIC + jet/dijet), are intended to provide flexibility for experimental analyses requiring precise PDF information across different kinematic regions. The uncertainties in the PDFs are quantified using the Hessian method, and each PDF set includes eigenvector variations that can be used to assess the uncertainties in observables. The Hessian PDF sets are also available in the LHAPDF library, allowing users to perform detailed uncertainty propagation in their analyses. The PDF sets are formatted in compliance with the LHAPDF standard (version 6 and above) to ensure maximum compatibility with modern QCD analysis frameworks and simulation-based analyses. One can access our PDF sets via email upon request, where they are categorized based on the fit scenario (e.g., Fit D, Fit D + EIC).
Acknowledgement
The authors gratefully acknowledge the helpful discussions and insightful comments provided by Katarzyna Wichmann and Andrei Kataev, which significantly elevated and enriched the quality of this paper. The authors also thank the School of Particles and Accelerators at the Institute for Research in Fundamental Sciences (IPM) for their financial support of this project. Hamzeh Khanpour appreciates the financial support from NAWA under grant number BPN/ULM/2023/1/00160, as well as from the IDUB program at AGH University. The work of UGM was also supported in part by the Chinese Academy of Sciences (CAS) President’s International Fellowship Initiative (PIFI) (Grant No. 2025PD0022).
References
- (1) D. M. South and M. Turcato, “Review of Searches for Rare Processes and Physics Beyond the Standard Model at HERA,” Eur. Phys. J. C 76, no.6, 336 (2016) doi:10.1140/epjc/s10052-016-4152-3 [arXiv:1605.03459 [hep-ex]].
- (2) F. Gross, E. Klempt, S. J. Brodsky, A. J. Buras, V. D. Burkert, G. Heinrich, K. Jakobs, C. A. Meyer, K. Orginos and M. Strickland, et al. “50 Years of Quantum Chromodynamics,” Eur. Phys. J. C 83, 1125 (2023), [arXiv:2212.11107 [hep-ph]].
- (3) J. Blümlein, “Deep-inelastic scattering: What do we know?,” Int. J. Mod. Phys. A 39, no.09n10, 2441004 (2024), [arXiv:2306.01362 [hep-ph]].
- (4) J. Blumlein, “The Theory of Deeply Inelastic Scattering,” Prog. Part. Nucl. Phys. 69, 28-84 (2013), [arXiv:1208.6087 [hep-ph]].
- (5) J. Gao, L. Harland-Lang and J. Rojo, “The Structure of the Proton in the LHC Precision Era,” Phys. Rept. 742, 1-121 (2018), [arXiv:1709.04922 [hep-ph]].
- (6) R. Abdul Khalek, A. Accardi, J. Adam, D. Adamiak, W. Akers, M. Albaladejo, A. Al-bataineh, M. G. Alexeev, F. Ameli and P. Antonioli, et al. “Science Requirements and Detector Concepts for the Electron-Ion Collider: EIC Yellow Report,” Nucl. Phys. A 1026, 122447 (2022) doi:10.1016/j.nuclphysa.2022.122447 [arXiv:2103.05419 [physics.ins-det]].
- (7) R. Abdul Khalek, U. D’Alesio, M. Arratia, A. Bacchetta, M. Battaglieri, M. Begel, M. Boglione, R. Boughezal, R. Boussarie and G. Bozzi, et al. “Snowmass 2021 White Paper: Electron Ion Collider for High Energy Physics,” [arXiv:2203.13199 [hep-ph]].
- (8) P. Agostini et al. [LHeC and FCC-he Study Group], “The Large Hadron–Electron Collider at the HL-LHC,” J. Phys. G 48, no.11, 110501 (2021) doi:10.1088/1361-6471/abf3ba [arXiv:2007.14491 [hep-ex]].
- (9) A. Abada et al. [FCC], “FCC Physics Opportunities: Future Circular Collider Conceptual Design Report Volume 1,” Eur. Phys. J. C 79, no.6, 474 (2019) doi:10.1140/epjc/s10052-019-6904-3
- (10) A. Abada et al. [FCC], “FCC-hh: The Hadron Collider: Future Circular Collider Conceptual Design Report Volume 3,” Eur. Phys. J. ST 228, no.4, 755-1107 (2019) doi:10.1140/epjst/e2019-900087-0
- (11) A. Abada et al. [FCC], “HE-LHC: The High-Energy Large Hadron Collider: Future Circular Collider Conceptual Design Report Volume 4,” Eur. Phys. J. ST 228, no.5, 1109-1382 (2019) doi:10.1140/epjst/e2019-900088-6
- (12) T. J. Hou, J. Gao, T. J. Hobbs, K. Xie, S. Dulat, M. Guzzi, J. Huston, P. Nadolsky, J. Pumplin and C. Schmidt, et al. “New CTEQ global analysis of quantum chromodynamics with high-precision data from the LHC,” Phys. Rev. D 103, no.1, 014013 (2021), [arXiv:1912.10053 [hep-ph]].
- (13) A. Ablat, A. Courtoy, S. Dulat, M. Guzzi, T. J. Hobbs, T. J. Hou, J. Huston, K. Mohan, H. W. Lin and P. Nadolsky, et al. “New results in the CTEQ-TEA global analysis of parton distributions in the nucleon,” [arXiv:2408.04020 [hep-ph]].
- (14) R. D. Ball et al. [NNPDF], “The path to proton structure at 1% accuracy,” Eur. Phys. J. C 82, no.5, 428 (2022), [arXiv:2109.02653 [hep-ph]].
- (15) J. Cruz-Martinez, S. Forte, N. Laurenti, T. R. Rabemananjara and J. Rojo, “LO, NLO, and NNLO parton distributions for LHC event generators,” JHEP 09, 088 (2024) doi:10.1007/JHEP09(2024)088 [arXiv:2406.12961 [hep-ph]].
- (16) S. Bailey, T. Cridge, L. A. Harland-Lang, A. D. Martin and R. S. Thorne, “Parton distributions from LHC, HERA, Tevatron and fixed target data: MSHT20 PDFs,” Eur. Phys. J. C 81, no.4, 341 (2021), [arXiv:2012.04684 [hep-ph]].
- (17) I. Abt et al. [H1 and ZEUS], “Impact of jet-production data on the next-to-next-to-leading-order determination of HERAPDF2.0 parton distributions,” Eur. Phys. J. C 82, no.3, 243 (2022) [arXiv:2112.01120 [hep-ex]].
- (18) G. Aad et al. [ATLAS], “Determination of the parton distribution functions of the proton using diverse ATLAS data from collisions at , 8 and 13 TeV,” Eur. Phys. J. C 82, no.5, 438 (2022) [arXiv:2112.11266 [hep-ex]].
- (19) S. Alekhin, M. V. Garzelli, S. O. Moch and O. Zenaiev, “NNLO PDFs driven by top-quark data,” [arXiv:2407.00545 [hep-ph]].
- (20) R. D. Ball et al. [NNPDF], “Parton distributions from high-precision collider data,” Eur. Phys. J. C 77, no.10, 663 (2017), [arXiv:1706.00428 [hep-ph]].
- (21) L. A. Harland-Lang, A. D. Martin, P. Motylinski and R. S. Thorne, “Parton distributions in the LHC era: MMHT 2014 PDFs,” Eur. Phys. J. C 75, no.5, 204 (2015) doi:10.1140/epjc/s10052-015-3397-6 [arXiv:1412.3989 [hep-ph]].
- (22) L. A. Harland-Lang, T. Cridge and R. S. Thorne, “A Stress Test of Global PDF Fits: Closure Testing the MSHT PDFs and a First Direct Comparison to the Neural Net Approach,” [arXiv:2407.07944 [hep-ph]].
- (23) A. M. Cooper-Sarkar and K. Wichmann, “QCD analysis of the ATLAS and CMS and cross-section measurements and implications for the strange sea density,” Phys. Rev. D 98, no.1, 014027 (2018) doi:10.1103/PhysRevD.98.014027 [arXiv:1803.00968 [hep-ex]].
- (24) N. Sato et al. [JAM], “Strange quark suppression from a simultaneous Monte Carlo analysis of parton distributions and fragmentation functions,” Phys. Rev. D 101, no.7, 074020 (2020) doi:10.1103/PhysRevD.101.074020 [arXiv:1905.03788 [hep-ph]].
- (25) N. Armesto, T. Cridge, F. Giuli, L. Harland-Lang, P. Newman, B. Schmookler, R. Thorne and K. Wichmann, “Impact of inclusive electron ion collider data on collinear parton distributions,” Phys. Rev. D 109, no.5, 5 (2024) doi:10.1103/PhysRevD.109.054019 [arXiv:2309.11269 [hep-ph]].
- (26) S. Cerci, Z. S. Demiroglu, A. Deshpande, P. R. Newman, B. Schmookler, D. Sunar Cerci and K. Wichmann, “Extraction of the strong coupling with HERA and EIC inclusive data,” Eur. Phys. J. C 83, no.11, 1011 (2023) doi:10.1140/epjc/s10052-023-12176-5 [arXiv:2307.01183 [hep-ph]].
- (27) J. C. Collins, D. E. Soper and G. F. Sterman, “Factorization of Hard Processes in QCD,” Adv. Ser. Direct. High Energy Phys. 5, 1-91 (1989) doi:10.1142/9789814503266_0001 [arXiv:hep-ph/0409313 [hep-ph]].
- (28) A. D. Martin, W. J. Stirling, R. S. Thorne and G. Watt, “Parton distributions for the LHC,” Eur. Phys. J. C 63, 189-285 (2009) doi:10.1140/epjc/s10052-009-1072-5 [arXiv:0901.0002 [hep-ph]].
- (29) S. Alekhin, J. Blumlein and S. Moch, “Parton Distribution Functions and Benchmark Cross Sections at NNLO,” Phys. Rev. D 86, 054009 (2012) doi:10.1103/PhysRevD.86.054009 [arXiv:1202.2281 [hep-ph]].
- (30) R. S. Towell et al. [NuSea], “Improved measurement of the anti-d / anti-u asymmetry in the nucleon sea,” Phys. Rev. D 64 (2001), 052002 [arXiv:hep-ex/0103030 [hep-ex]].
- (31) R. Hamberg, W. L. van Neerven and T. Matsuura, “A complete calculation of the order correction to the Drell-Yan factor,” Nucl. Phys. B 359, 343-405 (1991) [erratum: Nucl. Phys. B 644, 403-404 (2002)] doi:10.1016/0550-3213(91)90064-5
- (32) P. M. Nadolsky, “Theory of and boson production,” AIP Conf. Proc. 753, no.1, 158-170 (2005) doi:10.1063/1.1896698 [arXiv:hep-ph/0412146 [hep-ph]].
- (33) S. Sapeta, “QCD and Jets at Hadron Colliders,” Prog. Part. Nucl. Phys. 89, 1-55 (2016) doi:10.1016/j.ppnp.2016.02.002 [arXiv:1511.09336 [hep-ph]].
- (34) S. Catani and M. H. Seymour, “A General algorithm for calculating jet cross-sections in NLO QCD,” Nucl. Phys. B 485, 291-419 (1997) [erratum: Nucl. Phys. B 510, 503-504 (1998)] doi:10.1016/S0550-3213(96)00589-5 [arXiv:hep-ph/9605323 [hep-ph]].
- (35) R. V. Harlander and W. B. Kilgore, “Next-to-next-to-leading order Higgs production at hadron colliders,” Phys. Rev. Lett. 88, 201801 (2002) doi:10.1103/PhysRevLett.88.201801 [arXiv:hep-ph/0201206 [hep-ph]].
- (36) V. Bertone and A. Karlberg, “Benchmark of deep-inelastic-scattering structure functions at ,” Eur. Phys. J. C 84, no.8, 774 (2024) doi:10.1140/epjc/s10052-024-13133-6 [arXiv:2404.15711 [hep-ph]].
- (37) R. S. Thorne, “A Variable-flavor number scheme for NNLO,” Phys. Rev. D 73, 054019 (2006) doi:10.1103/PhysRevD.73.054019 [arXiv:hep-ph/0601245 [hep-ph]].
- (38) S. Forte, L. Garrido, J. I. Latorre and A. Piccione, “Neural network parametrization of deep inelastic structure functions,” JHEP 05, 062 (2002) doi:10.1088/1126-6708/2002/05/062 [arXiv:hep-ph/0204232 [hep-ph]].
- (39) A. Barontini, A. Candido, F. Hekhorn, G. Magni and R. Stegeman, “An FONLL prescription with coexisting flavor number PDFs,” [arXiv:2408.07383 [hep-ph]].
- (40) M. A. G. Aivazis, F. I. Olness and W. K. Tung, “Leptoproduction of heavy quarks. 1. General formalism and kinematics of charged current and neutral current production processes,” Phys. Rev. D 50, 3085-3101 (1994) doi:10.1103/PhysRevD.50.3085 [arXiv:hep-ph/9312318 [hep-ph]].
- (41) J. C. Collins, “Hard scattering factorization with heavy quarks: A General treatment,” Phys. Rev. D 58, 094002 (1998) doi:10.1103/PhysRevD.58.094002 [arXiv:hep-ph/9806259 [hep-ph]].
- (42) M. Buza, Y. Matiounine, J. Smith and W. L. van Neerven, “Charm electroproduction viewed in the variable flavor number scheme versus fixed order perturbation theory,” Eur. Phys. J. C 1, 301-320 (1998) doi:10.1007/BF01245820 [arXiv:hep-ph/9612398 [hep-ph]].
- (43) R. S. Thorne and R. G. Roberts, “An Ordered analysis of heavy flavor production in deep inelastic scattering,” Phys. Rev. D 57, 6871-6898 (1998) doi:10.1103/PhysRevD.57.6871 [arXiv:hep-ph/9709442 [hep-ph]].
- (44) H. Abramowicz, Combination of measurements of inclusive deep inelastic scattering cross sections and QCD analysis of HERA data, Eur. Phys. J. C 75, no. 12, 580 (2015) [arXiv:1506.06042 [hep-ex]].
- (45) M. Aaboud et al. [ATLAS], “Precision measurement and interpretation of inclusive , and production cross sections with the ATLAS detector,” Eur. Phys. J. C 77 (2017) no.6, 367 [arXiv:1612.03016 [hep-ex]].
- (46) G. Aad et al. [ATLAS], “Measurement of the low-mass Drell-Yan differential cross section at = 7 TeV using the ATLAS detector,” JHEP 06 (2014), 112 [arXiv:1404.1212 [hep-ex]].
- (47) G. Aad et al. [ATLAS], “Measurement of the high-mass Drell–Yan differential cross-section in pp collisions at sqrt(s)=7 TeV with the ATLAS detector,” Phys. Lett. B 725 (2013), 223-242 [arXiv:1305.4192 [hep-ex]].
- (48) G. Aad et al. [ATLAS], “Determination of the strange quark density of the proton from ATLAS measurements of the and cross sections,” Phys. Rev. Lett. 109 (2012), 012001 [arXiv:1203.4051 [hep-ex]].
- (49) S. Chatrchyan et al. [CMS], “Measurement of the Electron Charge Asymmetry in Inclusive Production in Collisions at TeV,” Phys. Rev. Lett. 109 (2012), 111806 [arXiv:1206.2598 [hep-ex]].
- (50) S. Chatrchyan et al. [CMS], “Measurement of the Muon Charge Asymmetry in Inclusive Production at 7 TeV and an Improved Determination of Light Parton Distribution Functions,” Phys. Rev. D 90 (2014) no.3, 032004 [arXiv:1312.6283 [hep-ex]].
- (51) V. Khachatryan et al. [CMS], “Measurement of the differential cross section and charge asymmetry for inclusive production at TeV,” Eur. Phys. J. C 76 (2016) no.8, 469 [arXiv:1603.01803 [hep-ex]].
- (52) S. Chatrchyan et al. [CMS], “Measurement of the Rapidity and Transverse Momentum Distributions of Bosons in Collisions at TeV,” Phys. Rev. D 85, 032002 (2012), [arXiv:1110.4973 [hep-ex]].
- (53) T. Aaltonen et al. [CDF], “Direct Measurement of the Production Charge Asymmetry in Collisions at TeV,” Phys. Rev. Lett. 102, 181801 (2009) [arXiv:0901.2169 [hep-ex]].
- (54) T. A. Aaltonen et al. [CDF], “Measurement of of Drell-Yan pairs in the Mass Region from Collisions at TeV,” Phys. Lett. B 692, 232-239 (2010), [arXiv:0908.3914 [hep-ex]]
- (55) V. M. Abazov et al. [D0], “Measurement of the electron charge asymmetry in decays in collisions at TeV,” Phys. Rev. D 91, no.3, 032007 (2015) [erratum: Phys. Rev. D 91, no.7, 079901 (2015)] [arXiv:1412.2862 [hep-ex]]
- (56) V. M. Abazov et al. [D0], “Measurement of the Muon Charge Asymmetry in W+X + X Events at =1.96 TeV,” Phys. Rev. D 88, 091102 (2013) [arXiv:1309.2591 [hep-ex]].
- (57) V. M. Abazov et al. [D0], “Measurement of the Shape of the Boson Rapidity Distribution for Events Produced at of 1.96-TeV,” Phys. Rev. D 76, 012003 (2007), [arXiv:hep-ex/0702025 [hep-ex]].
- (58) H. Abdolmaleki et al. [xFitter], “xFitter: An Open Source QCD Analysis Framework. A resource and reference document for the Snowmass study,” [arXiv:2206.12465 [hep-ph]].
- (59) S. Alekhin, O. Behnke, P. Belov, S. Borroni, M. Botje, D. Britzger, S. Camarda, A. M. Cooper-Sarkar, K. Daum and C. Diaconu, et al. “HERAFitter,” Eur. Phys. J. C 75, no.7, 304 (2015) doi:10.1140/epjc/s10052-015-3480-z [arXiv:1410.4412 [hep-ph]].
- (60) G. Altarelli and G. Parisi, “Asymptotic Freedom in Parton Language,” Nucl. Phys. B 126, 298-318 (1977) doi:10.1016/0550-3213(77)90384-4
- (61) V. N. Gribov and L. N. Lipatov, “Deep inelastic e p scattering in perturbation theory,” Sov. J. Nucl. Phys. 15, 438-450 (1972) IPTI-381-71.
- (62) Y. L. Dokshitzer, “Calculation of the Structure Functions for Deep Inelastic Scattering and e+ e- Annihilation by Perturbation Theory in Quantum Chromodynamics.,” Sov. Phys. JETP 46, 641-653 (1977)
- (63) F. James and M. Roos, “Minuit: A System for Function Minimization and Analysis of the Parameter Errors and Correlations,” Comput. Phys. Commun. 10, 343-367 (1975).
- (64) F. James, “MINUIT Function Minimization and Error Analysis: Reference Manual Version 94.1,” CERN-D-506.
- (65) R. S. Thorne, “Effect of changes of variable flavor number scheme on parton distribution functions and predicted cross sections,” Phys. Rev. D 86, 074017 (2012) doi:10.1103/PhysRevD.86.074017 [arXiv:1201.6180 [hep-ph]].
- (66) H. Abramowicz et al. [H1 and ZEUS], “Combination of measurements of inclusive deep inelastic scattering cross sections and QCD analysis of HERA data,” Eur. Phys. J. C 75 (2015) no.12, 580 [arXiv:1506.06042 [hep-ex]].
- (67) A. D. Martin, R. G. Roberts, W. J. Stirling and R. S. Thorne, “MRST2001: Partons and from precise deep inelastic scattering and Tevatron jet data,” Eur. Phys. J. C 23, 73-87 (2002) doi:10.1007/s100520100842 [arXiv:hep-ph/0110215 [hep-ph]].
- (68) A. Buckley, J. Ferrando, S. Lloyd, K. Nordström, B. Page, M. Rüfenacht, M. Schönherr and G. Watt, “LHAPDF6: parton density access in the LHC precision era,” Eur. Phys. J. C 75, 132 (2015) doi:10.1140/epjc/s10052-015-3318-8 [arXiv:1412.7420 [hep-ph]].
- (69) J. Pumplin, D. Stump, R. Brock, D. Casey, J. Huston, J. Kalk, H. L. Lai and W. K. Tung, “Uncertainties of predictions from parton distribution functions. 2. The Hessian method,” Phys. Rev. D 65, 014013 (2001) doi:10.1103/PhysRevD.65.014013 [arXiv:hep-ph/0101032 [hep-ph]].
- (70) W. T. Giele, S. A. Keller and D. A. Kosower, “Parton Distribution Function Uncertainties,” [arXiv:hep-ph/0104052 [hep-ph]].
- (71) V. D. Burkert, L. Elouadrhiri, A. Afanasev, J. Arrington, M. Contalbrigo, W. Cosyn, A. Deshpande, D. I. Glazier, X. Ji and S. Liuti, et al. “Precision studies of QCD in the low energy domain of the EIC,” Prog. Part. Nucl. Phys. 131, 104032 (2023) doi:10.1016/j.ppnp.2023.104032 [arXiv:2211.15746 [nucl-ex]].
- (72) A. Accardi, J. L. Albacete, M. Anselmino, N. Armesto, E. C. Aschenauer, A. Bacchetta, D. Boer, W. K. Brooks, T. Burton and N. B. Chang, et al. “Electron Ion Collider: The Next QCD Frontier: Understanding the glue that binds us all,” Eur. Phys. J. A 52, no.9, 268 (2016) doi:10.1140/epja/i2016-16268-9 [arXiv:1212.1701 [nucl-ex]].
- (73) J. Adam et al. [ATHENA], “ATHENA detector proposal — a totally hermetic electron nucleus apparatus proposed for IP6 at the Electron-Ion Collider,” JINST 17, no.10, P10019 (2022) doi:10.1088/1748-0221/17/10/P10019 [arXiv:2210.09048 [physics.ins-det]].
- (74) A. Aktas et al. [H1], “Measurement of inclusive jet production in deep-inelastic scattering at high Q**2 and determination of the strong coupling,” Phys. Lett. B 653, 134-144 (2007) [arXiv:0706.3722 [hep-ex]].
- (75) F. D. Aaron et al. [H1], “Jet Production in ep Collisions at Low Q**2 and Determination of alpha(s),” Eur. Phys. J. C 67, 1-24 (2010) [arXiv:0911.5678 [hep-ex]].
- (76) S. Chekanov et al. [ZEUS], “Inclusive jet cross-sections in the Breit frame in neutral current deep inelastic scattering at HERA and determination of alpha(s),” Phys. Lett. B 547, 164-180 (2002) [arXiv:hep-ex/0208037 [hep-ex]].
- (77) S. Chekanov et al. [ZEUS], “Inclusive-jet and dijet cross-sections in deep inelastic scattering at HERA,” Nucl. Phys. B 765, 1-30 (2007) [arXiv:hep-ex/0608048 [hep-ex]].
- (78) H. Abramowicz et al. [ZEUS], “Inclusive dijet cross sections in neutral current deep inelastic scattering at HERA,” Eur. Phys. J. C 70, 965-982 (2010) [arXiv:1010.6167 [hep-ex]].
- (79) T. Kluge, K. Rabbertz and M. Wobisch, “FastNLO: Fast pQCD calculations for PDF fits,” doi:10.1142/9789812706706_0110 [arXiv:hep-ph/0609285 [hep-ph]].
- (80) R. D. Ball et al. [NNPDF], “Parton distributions for the LHC Run II,” JHEP 04, 040 (2015) doi:10.1007/JHEP04(2015)040 [arXiv:1410.8849 [hep-ph]].
- (81) I. Abt et al. [ZEUS], “Measurement of jet production in deep inelastic scattering and NNLO determination of the strong coupling at ZEUS,” Eur. Phys. J. C 83, no.11, 1082 (2023) doi:10.1140/epjc/s10052-023-12180-9 [arXiv:2309.02889 [hep-ex]].
- (82) G. Aad et al. [ATLAS], “Determination of the strong coupling constant from transverse energyenergy correlations in multijet events at TeV with the ATLAS detector,” JHEP 07, 085 (2023) doi:10.1007/JHEP07(2023)085 [arXiv:2301.09351 [hep-ex]].
- (83) [ATLAS], “A precise determination of the strong-coupling constant from the recoil of bosons with the ATLAS experiment at TeV,” ATLAS-CONF-2023-015.
- (84) A. Tumasyan et al. [CMS], “Measurement and QCD analysis of double-differential inclusive jet cross sections in proton-proton collisions at = 13 TeV,” JHEP 02, 142 (2022) doi:10.1007/JHEP02(2022)142 [arXiv:2111.10431 [hep-ex]].
- (85) V. Andreev et al. [H1], “Determination of the strong coupling constant in next-to-next-to-leading order QCD using H1 jet cross section measurements,” Eur. Phys. J. C 77, no.11, 791 (2017) [erratum: Eur. Phys. J. C 81, 738 (2021)] doi:10.1140/epjc/s10052-017-5314-7 [arXiv:1709.07251 [hep-ex]].
- (86) G. Aad et al. [ATLAS], “Measurement of transverse energy-energy correlations in multi-jet events in collisions at TeV using the ATLAS detector and determination of the strong coupling constant ,” Phys. Lett. B 750, 427-447 (2015) doi:10.1016/j.physletb.2015.09.050 [arXiv:1508.01579 [hep-ex]].
- (87) M. Aaboud et al. [ATLAS], “Determination of the strong coupling constant from transverse energy–energy correlations in multijet events at using the ATLAS detector,” Eur. Phys. J. C 77, no.12, 872 (2017) doi:10.1140/epjc/s10052-017-5442-0 [arXiv:1707.02562 [hep-ex]].
- (88) M. Aaboud et al. [ATLAS], “Measurement of dijet azimuthal decorrelations in collisions at TeV with the ATLAS detector and determination of the strong coupling,” Phys. Rev. D 98, no.9, 092004 (2018) doi:10.1103/PhysRevD.98.092004 [arXiv:1805.04691 [hep-ex]].
- (89) V. Khachatryan et al. [CMS], “Measurement of the inclusive 3-jet production differential cross section in proton–proton collisions at 7 TeV and determination of the strong coupling constant in the TeV range,” Eur. Phys. J. C 75, no.5, 186 (2015) doi:10.1140/epjc/s10052-015-3376-y [arXiv:1412.1633 [hep-ex]].
- (90) V. Khachatryan et al. [CMS], “Constraints on parton distribution functions and extraction of the strong coupling constant from the inclusive jet cross section in pp collisions at TeV,” Eur. Phys. J. C 75, no.6, 288 (2015) doi:10.1140/epjc/s10052-015-3499-1 [arXiv:1410.6765 [hep-ex]].
- (91) V. Khachatryan et al. [CMS], “Measurement and QCD analysis of double-differential inclusive jet cross sections in pp collisions at TeV and cross section ratios to 2.76 and 7 TeV,” JHEP 03, 156 (2017) doi:10.1007/JHEP03(2017)156 [arXiv:1609.05331 [hep-ex]].
- (92) [CMS], “Determination of the strong coupling constant from the measurement of inclusive multijet event cross sections in pp collisions at ,” CMS-PAS-SMP-16-008.
- (93) A. M. Sirunyan et al. [CMS], “Measurement of the production cross section, the top quark mass, and the strong coupling constant using dilepton events in pp collisions at 13 TeV,” Eur. Phys. J. C 79, no.5, 368 (2019) doi:10.1140/epjc/s10052-019-6863-8 [arXiv:1812.10505 [hep-ex]].
- (94) A. M. Sirunyan et al. [CMS], “Measurement of normalised multi-differential cross sections in pp collisions at TeV, and simultaneous determination of the strong coupling strength, top quark pole mass, and parton distribution functions,” Eur. Phys. J. C 80, no.7, 658 (2020) doi:10.1140/epjc/s10052-020-7917-7 [arXiv:1904.05237 [hep-ex]].
- (95) S. Navas et al. [Particle Data Group], “Review of particle physics,” Phys. Rev. D 110, no.3, 030001 (2024).