Higher Order Transformers: Enhancing Stock Movement Prediction On Multimodal Time-Series Data
Abstract.
In this paper, we tackle the challenge of predicting stock movements in financial markets by introducing Higher Order Transformers, a novel architecture designed for processing multivariate time-series data. We extend the self-attention mechanism and the transformer architecture to a higher order, effectively capturing complex market dynamics across time and variables. To manage computational complexity, we propose a low-rank approximation of the potentially large attention tensor using tensor decomposition and employ kernel attention, reducing complexity to linear with respect to the data size. Additionally, we present an encoder-decoder model that integrates technical and fundamental analysis, utilizing multimodal signals from historical prices and related tweets. Our experiments on the Stocknet dataset demonstrate the effectiveness of our method, highlighting its potential for enhancing stock movement prediction in financial markets.
1. Introduction
Predicting stock movements in financial markets is of paramount importance for investors and traders alike, as it enables informed decision-making and enhances profitability. However, this task is inherently challenging due to the stochastic nature of market dynamics, the non-stationarity of stock prices, and the influence of numerous factors beyond historical prices, such as social media sentiment and inter-stock correlations.
Traditional approaches in stock prediction have primarily focused on technical analysis (TA) and fundamental analysis (FA), leveraging historical price data and key financial metrics, respectively (Yin and Yang, 2016). While these methods have provided valuable insights, they often fail to capture the complex interdependencies and the high-dimensional structure of financial data (Bollerslev, 1986). Recent advancements in machine learning, particularly in natural language processing and graph neural networks, have begun to address these limitations by integrating multimodal data sources, such as news articles and social media sentiment, thereby offering a more nuanced understanding of market dynamics (Hu et al., 2018; Kim et al., 2019).
Despite these advancements, existing models still struggle with the sheer volume and variability of financial data, often resulting in suboptimal predictive performance when dealing with high-dimensional, multivariate time-series data. To address these challenges, we introduce a novel architecture called Higher Order Transformers. This architecture extends the traditional transformer model by incorporating higher-order data structures in the self-attention mechanism, enabling it to capture more complex interrelationships across time and variables.
The contributions of this paper can be summarized as follows:
-
•
We introduce Higher-Order Transformers, a novel architecture tailored for processing higher-order data (with more than two dimensions where the last dimension works as the feature dimension).
-
•
We propose a Multimodal Encoder-Decoder architecture based on the proposed Higher Order Transformer which integrates both news text and historical price data to provide a holistic understanding of the market dynamics.
-
•
Following a series of experiments and ablation studies, we demonstrate the effectiveness of the proposed method empirically.
2. Related Work
Predicting stock movements has traditionally utilized technical analysis (TA), focusing on historical price data and macroeconomic indicators, with common methods like GARCH and neural networks being prevalent for their ability to identify temporal patterns (Yin and Yang, 2016; Bollerslev, 1986; Yıldırım et al., 2021). However, such methods often fail to account for external factors that can significantly influence market dynamics, thus limiting their overall predictive scope.
Fundamental analysis (FA) attempts to fill this gap by integrating broader market elements such as investor sentiment and news, with the help of advancements in natural language processing (NLP). NLP has enabled more effective sentiment analysis from diverse data sources like news articles and social media, thereby enhancing the FA approaches (Kalyani et al., 2016; Ding et al., 2015; Abarbanell and Bushee, 1997; Hu et al., 2018; Xu and Cohen, 2018). Innovative models such as the Hybrid Attention Networks (HAN) and StockNet have emerged, which blend attention mechanisms and variational auto-encoders to analyze text alongside price data, though the assumption of independent stock movements often hampers their effectiveness (Hu et al., 2019; Xu and Cohen, 2018).
Graph Neural Networks (GNNs) have been introduced as a solution to address the interconnected nature of financial markets, by structuring market data into graph formats where nodes represent companies, allowing for enhanced data representation and learning through contextual inter-node relationships (Feng et al., 2019; Sawhney et al., 2020b; Matsunaga et al., 2019; Kim et al., 2019; Yangjia et al., 2022). These networks are particularly effective when combined with attention mechanisms and have been expanded upon with financial knowledge graphs to incorporate domain-specific knowledge (Kertkeidkachorn et al., 2023).
Despite progress in graph-based and NLP-enhanced stock prediction methods, fully integrated multimodal approaches that leverage both textual data and inter-stock relationships are still in their infancy. Recent proposals for such multimodal models aim to harness these diverse data sets to improve the predictive accuracy of stock movement models significantly (Daiya and Lin, 2021; Li et al., 2020; Sawhney et al., 2020a; Kim et al., 2019; Liu et al., 2019; Zhang et al., 2022; Xie et al., 2023). These efforts underscore ongoing challenges and the potential for future advancements in capturing complex market signals and correlations.
3. Problem Definition
In line with previous studies (Xu and Cohen, 2018; Sawhney et al., 2020a), we define the stock movement prediction task as a binary classification problem. For a given stock , the price movement from day to is defined as follows:
| (1) |
where represents the adjusted closing price111https://www.investopedia.com/terms/a/adjusted_closing_price.asp on day . Here, indicates that the stock price has decreased, and indicates that the stock price has increased.
The objective of this task is to predict the price movement of a stock based on its historical price data and related tweets within a time window of days.
4. Preliminary
Let us define some notations. We use lower-case letters for vectors (e.g., ), upper-case letters for matrices (e.g., ), and calligraphic letters for tensors (e.g.,). We use to denote the Kronecker product and for the tensor product along mode . The notation denotes the set for any integer .
Definition 0 (Tensor).
A -th order tensor can simply be seen as a multidimensional array.
Definition 0 (Tensor Mode and Fibers).
The mode- fibers of are vectors obtained by fixing all indices except the -th one: .
Definition 0 (Tensor slice).
A tensor slice is a two-dimensional section (fragment) of a tensor, obtained by fixing all indexes except for two indices.
Definition 0 (Tensor Matricization).
The -th mode matricization of a tensor is the matrix having its mode- fibers as columns and is denoted by , e.g., .
Definition 0 (Kronecker Product).
The Kronecker product, denoted by , is a binary operation that combines two matrices or tensors to form a larger matrix or tensor. For two matrices and , their Kronecker product is defined as:
In this paper, we consider multivariate timeseries data in the form of third-order tensors where is the number of variables, is the number of timesteps, and is the number of hidden/feature dimensions.
5. Method
5.1. Tokenization
In this section, we explain the process of tokenizing the input multivariate time-series data. Following prior work (Sawhney et al., 2020a), we construct a price vector for each stock at each day in the form of , comprising the stock’s adjusted closing price, highest price, and lowest price.
In line with the multivariate time-series forecasting literature (Rasul et al., 2024; Zhou et al., 2021), we also found it beneficial to add date features, including the day of the month, month of the year, and year. The combination of price and date features forms a six-dimensional vector for each stock on each day.
Inspired by (Darcet et al., 2024), we add stock-specific learnable tokens to the beginning of each time-series and treat them as the common CLS token in transformer encoders. Similar to BERT (Devlin et al., 2019) and ViT (Dosovitskiy et al., 2021), we used the hidden state of this special token as the stock representation over the whole time window for the classification task.
5.2. Higher Order Transformer
In this section, we first review the self-attention mechanism in Transformer layers (Vaswani et al., 2023). Then, we extend it to higher orders by tensorizing queries, keys, and values, thereby formulating higher order transformer layers. Given that computing attention on tensors is prohibitively costly, we propose a low-rank approximation using Kronecker decomposition. Additionally, we incorporate the attention kernel trick (Choromanski et al., 2022) to significantly reduce the computational complexity.
5.2.1. Standard Transformer Layer
A Transformer encoder layer comprises two primary components: a self-attention layer and an elementwise feedforward layer . For a set of input vectors , a Transformer layer computes the following222We omitted normalization after and for simplicity.:
| (2) | ||||
| (3) |
where denotes the row index of the matrix, is the number of attention heads, and is the head size. The weight matrices and are associated with each attention head. The attention coefficients are computed as:
| (4) |
where the Softmax function is applied row-wise.
5.2.2. Higher Order Transformer Layer
To generalize the formulation of scaled dot-product attention to higher-order input data , we extend the concept of attention to tensors. We define the transformer encoder layer as a function , formulated as follows:
| (5) | ||||
| (6) |
where denotes the third-mode fiber of corresponding to variable at timestep . The attention scores are computed as:
| (7) |
where denotes the attention score for variable at time attending to variable at time on head and is computed as:
| (8) |
Computing the attention tensor requires operations, which can be computationally expensive in most cases.
5.2.3. Low-Rank Approximation With Kronecker Decomposition
Consider the attention matrix as the result of reshaping the tensor by flattening the variable and time dimensions. We parameterize the attention matrix using a rank Kronecker decomposition with factor matrices and :
| (9) |
where and represent lower-order attention matrices over the variable and time dimensions, respectively. Having attention matrices acts similarly to multi-head attention with heads. In practice, we adopt the multi-head attention mechanism instead of the summation shown in Equation (9), as it uses more parameters and can be more expressive.
Theorem 5.1.
Given any fourth-order attention tensor , which can be reshaped into a matrix , there exists a rank such that matrix can be expressed as the sum of Kronecker products of matrices and . Formally:
| (10) |
for some . As approaches , the approximation becomes exact, meaning the Kronecker decomposition is capable of universally representing the original attention tensor and matrix .
Proof.
We begin by reshaping the tensor into a matrix . Consider the Singular Value Decomposition (SVD) of :
| (11) |
where and are orthogonal matrices, and is a diagonal matrix containing the non-negative singular values of . This decomposition allows to be represented as a sum of outer products of singular vectors scaled by the corresponding singular values, i.e.,
| (12) |
where are the singular values, and are the corresponding left and right singular vectors. For a low-rank approximation, only the first terms are retained:
| (13) |
Now, each product can be reshaped from vectors and into matrices. Specifically, vector is reshaped into a matrix , and into . The outer product corresponds to the Kronecker product of and when flattened:
| (14) |
The matrices and are then defined, so that simplifies to . This allows us to express the approximate decomposition of as:
| (15) |
where and . As approaches the rank of , this approximation converges to an exact representation. Thus, we verify the theorem’s claim that any attention matrix derived from tensor can be expressed in terms of Kronecker products, achieving universal representability at full rank. ∎
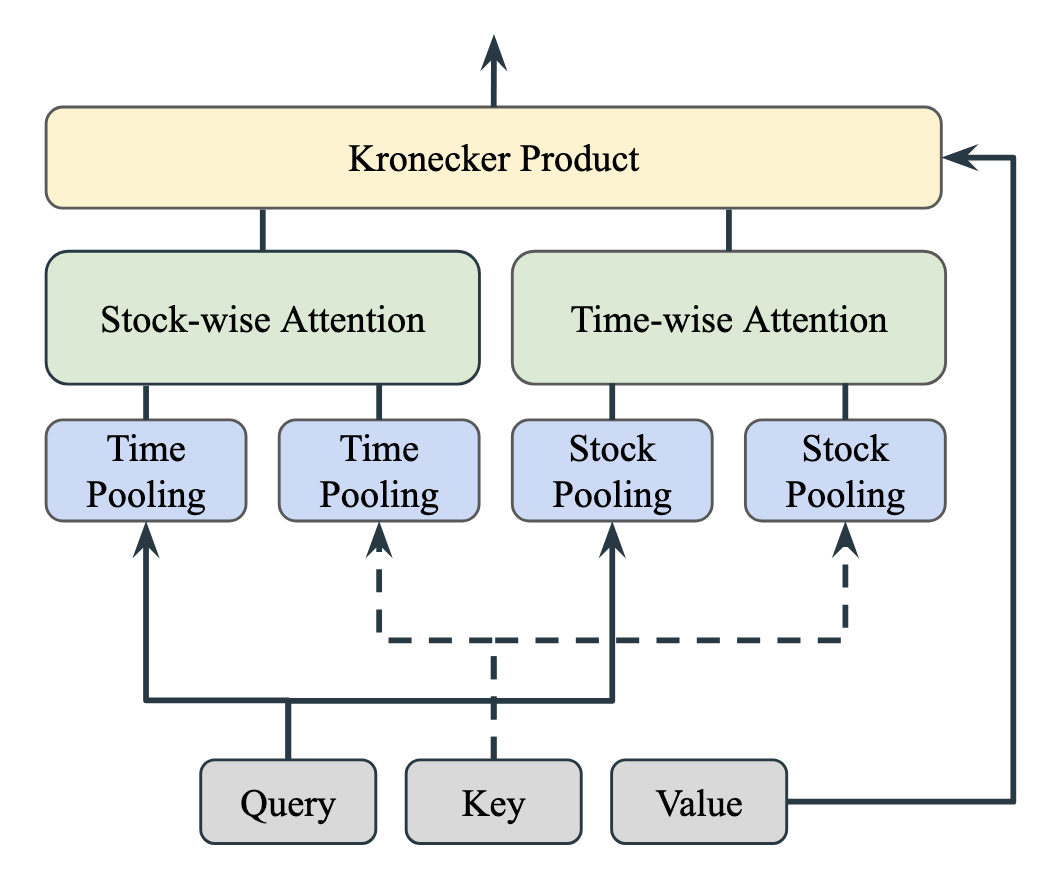
Now we delve into the computation of the lower-order attention matrices and . For simplicity, we omit the index . We project the input tensor onto the query, key, and value tensors using mode-3 tensor products: , , and respectively. Utilizing permutation-invariant pooling functions and , we define the attention matrices as:
| (16) | ||||
| (17) |
Common examples of permutation-invariant pooling functions include sum, mean, and product.
The attention matrices are then used to modulate the value tensor . To maintain computational efficiency, we apply the attention matrices sequentially as follows:
| (18) |
Computing and applying these attention matrices incurs a computational cost of , where the quadratic terms reflect the inherent computational demand of the scaled dot-product attention mechanism, which can become substantial. To mitigate these costs, we employ kernelized linear attention, which achieves linear computational complexity of .
5.2.4. Linear Attention With Kernel Trick
Following the work by (Choromanski et al., 2022), we approximate the attention matrix in equation (16) using a suitable kernel function as:
| (19) |
where is a diagonal matrix serving as a normalizing factor. The diagonal elements of are defined by:
| (20) |
Substituting into equation (18), we compute:
| (21) |
where denotes the tensor slice corresponding to the -th timestep. The computational sequence initiates by calculating followed by the subsequent operations, yielding a computational complexity of . The choice of kernel function is flexible, and we utilize the same kernel function as in (Choromanski et al., 2022), which has been validated both theoretically and empirically. Similarly, the same computational approach is applied to compute using the same kernel function .
5.3. Model Architecture
Our model’s architecture consists of a multilayer transformer network. Input tensors are transformed through a linear projection layer to align the features with the hidden dimensions required by the model and its attention modules. We adopt pre-normalization techniques, specifically RMSNorm (Zhang and Sennrich, 2019), in every layer following the approach suggested by Touvron et al. (2023). Rotary Positional Embedding (Su et al., 2023) is applied to the query and key matrices exclusively for computing the temporal attention ; stock-wise attention does not involve positional embeddings as the ordering in this dimension is not meaningful.
Inspired by (Hu and Singh, 2021; Tsai et al., 2019), our proposed multimodal model follows an encoder-decoder architecture where the modality of the data differs across encoder and decoder. More specifically, text encodings are processed by the transformer encoder, and price timeseries data by the transformer decoder as presented in figure 2. Cross-attention layers in the network facilitate information blending between these two modalities.

6. Experiments
6.1. Dataset
We demonstrate the capability of Higher Order Transformers on stock market movement classification using a multimodal dataset called Stocknet (Xu and Cohen, 2018) which comprises historical data from 88 stocks extracted from Yahoo Finance333https://finance.yahoo.com/ and related news crawled from Twitter over two years. We adopt the data processing methodology as outlined in (Sawhney et al., 2020a; Xu and Cohen, 2018), shifting a 5-day lag window along trading days to generate samples. Samples are labeled based on the movement percentage of the closing price, with movements labeled as positive and as negative. Samples lacking either prices or tweets on trading days are discarded to ensure data consistency.
Text encodings are generated using the FinBert model (Araci, 2019) by processing all tweets for each stock on each day through the transformer encoder, then averaging over tokens and tweets to produce a vector representation for each stock per day.
The dataset is temporally divided in a 70:10:20 ratio for train, validation, and test splits, spanning from 01/01/2014 to 31/07/2015 for training, 01/08/2015 to 30/09/2015 for validation, and 01/10/2015 to 01/01/2016 for testing.
6.2. Model Configuration
We configured the models using the Adam optimizer with an initial learning rate of . Tweet embeddings from FinBert are dimensioned at 768. Training extends for up to 1000 epochs with an early stopping criterion based on validation F1 performance, stopping further training when no improvement is observed. Hyperparameter tuning is conducted through a grid search with the following parameters:
-
•
Hidden dimension: [32, 64, 128]
-
•
Number of attention heads: [1, 4, 8, 16]
-
•
Number of transformer blocks: [2, 4, 6]
-
•
Dropout probability: [0, 0.2, 0.4]
Lastly, we report the performance of the best model based on validation F1 on the test set.
6.3. Metrics
In line with prior research in stock prediction (Sawhney et al., 2020a; Xu and Cohen, 2018), we evaluate classification performance using three metrics: accuracy, F1 score, and Matthew’s correlation coefficient (MCC) 444Using Torchmetrics library: https://github.com/Lightning-AI/torchmetrics. We particularly include MCC as it provides a more balanced performance measure that accounts for both positive and negative classes and adjusts for any class imbalance by incorporating True Negatives. This makes it especially valuable in contexts where the data may be skewed. MCC is defined as:
| (22) |
This formula captures the correlation between observed and predicted binary classifications and is regarded as a reliable statistical rate that can deliver a high score only if the predictor successfully predicts the majority of positive and negative instances correctly.
6.4. Baselines
We compare our results with the following baselines:
-
•
RAND: A simple predictor to make random guesses about the rise and fall.
-
•
ARIMA: AutoRegressive Integrated Moving Average, an advanced technical analysis method using only price signals. (Brown, 2004)
-
•
HAN: Hybrid Attention Networks, is a model developed to predict stock trends by analyzing sequences of recent news related to the market. It employs attention mechanisms and self-paced learning to handle the chaotic nature of online content effectively.(Hu et al., 2019)
-
•
StockNet: A Variational Auto-Encoder that jointly exploits text and price signals to predict stock movement. (Xu and Cohen, 2018)
-
•
MAN-SF: Multipronged Attention Network uses tweets, price history, and inter-stock connections to train a GAT network that captures relevant signals across modalities. (Sawhney et al., 2020a)
-
•
HATS: A hierarchical graph attention network for stock movement prediction. (Kim et al., 2019)
-
•
Yangjia et al.: An RNN-based model which uses a co-attention mechanism to capture the sufficient context information between text and prices across every day. (Yangjia et al., 2022)
-
•
ChatGPT (Zero-Shot): Using proper prompting on ChatGPT in a zero-shot setting. (Xie et al., 2023)
-
•
CapTE: A Transformer Encoder that extracts the deep semantic features of the social media and then captures the structural relationship of the texts through a capsule network. (Liu et al., 2019)
-
•
TEANet: A Transformer encoder with multiple attention mechanisms that extracts features and fuses text data from social media with stock prices. (Zhang et al., 2022)
-
•
SLOT: A self-supervised learning method that embeds stocks and tweets in a shared semantic space to predict stock price movements, overcoming tweet sparsity and noise issues. (Soun et al., 2022)
-
•
NL-LSTM: A novel model that uses neutrosophic logic for more accurate sentiment analysis of social media data, combined with LSTM for forecasting based on sentiment and historical stock data. (Abdelfattah et al., 2024)
| Method | ACC | F1 | MCC |
|---|---|---|---|
| RAND | 50.9 | 50.2 | -0.002 |
| ARIMA (2004) | 51.4 | 51.3 | -0.021 |
| (2023) | 52.1 | 51.7 | 0.038 |
| HATS (2019) | 56.02 | 56.22 | 0.117 |
| HAN (2018) | 57.6 | 57.2 | 0.052 |
| StockNet (2018) | 58.2 | 57.5 | 0.081 |
| SLOT (2022) | 58.7 | - | 0.2065 |
| MAN-SF (2020a) | 60.8 | 60.5 | 0.195 |
| Yangjia et al. (2022) | 62.6 | 61.1 | 0.228 |
| CapTE (2019) | 64.22 | - | 0.348 |
| TEANet (2022) | 65.16 | - | 0.364 |
| NL-LSTM (2024) | 78.5 | - | 0.587 |
| Ours | 72.94 | 72.23 | 0.516 |
6.5. Results
In this section, we analyze the benchmark performance of our model against various baseline models on the StockNet dataset. The results, as summarized in Table 1, demonstrate the superior performance of our model over all of the existing baselines except NL-LSTM, which significantly outperforms the rest of the methods in terms of accuracy, F1, and MCC. NL-LSTM reported the highest accuracy performance on binary stock movement prediction by incorporating fuzzy logic in sentiment analysis (Abdelfattah et al., 2024).
| Modality | Attention Type | ACC | F1 | MCC |
|---|---|---|---|---|
| Price | Standard | 52.3 | 51.8 | 0.049 |
| Kernelized | 53.6 | 53.3 | 0.063 | |
| Tweet | Standard | 69.5 | 68.0 | 0.320 |
| Kernelized | 71.0 | 70.1 | 0.402 | |
| Multimodal | Standard | 70.8 | 70.5 | 0.391 |
| Kernelized | 72.9 | 72.2 | 0.516 |
6.6. Ablation Study
We further investigate the impact of different aspects of our model through an ablation study, focusing on the types of attention mechanisms used, the data modalities, and the attention method. The results are provided in Tables 2, and 3 respectively.
The influence of data modality on performance is depicted in Table 2. The multimodal approach that integrates both price data and Twitter news significantly outperforms single-modality approaches, underscoring the benefit of leveraging diverse data sources. Moreover, the text-based models performs better than the timeseries-based models with a significant gap, showing the rich context present in the news data crawled from Twitter for the stock movement prediction task.
Table 2 also explores the effect of using linear versus standard attention mechanisms over different modalities. The results highlight the advantages of linear attention in terms of efficiency and effectiveness, particularly in multimodal settings.
| Attention Dimension | ACC | F1 | MCC |
|---|---|---|---|
| None | 53.5 | 52.4 | 0.069 |
| Stock-wise | 71.3 | 69.2 | 0.495 |
| Time-wise | 72.1 | 71.3 | 0.507 |
| Both (Higher Order) | 72.9 | 72.2 | 0.516 |
Table 3 vividly demonstrates that while applying attention in any single dimension (either stock-wise or time-wise) improves performance metrics compared to using no attention, the most significant enhancements are observed when attention is simultaneously applied across both dimensions.
7. Conclusion
In this paper, we presented the Higher Order Transformers, a novel architecture tailored to predict stock movements by processing multimodal stock data. By expanding the self-attention mechanism and transformer architecture to incorporate higher-order interactions, our model adeptly captures the intricate dynamics of financial markets over both stock and time. To address computational constraints, we implemented low-rank approximations through tensor decomposition and integrated kernel attention to achieve linear computational complexity. Extensive testing on the Stocknet dataset demonstrated that our approach significantly surpasses most of the existing models in predicting stock movements. An ablation study further validated the effectiveness of specific architectural components, highlighting their contributory value to the model’s performance. Looking ahead, we plan to train our model on other multimodal stock datasets such as ASTOCK (Zou et al., 2022) and Dhaka Stock Exchange (Muhammad et al., 2023), and perform profitability analysis on real-world stock data to further test the practical application and financial viability of our proposed method.
Acknowledgements.
References
- (1)
- Abarbanell and Bushee (1997) Jeffrey S Abarbanell and Brian J Bushee. 1997. Fundamental analysis, future earnings, and stock prices. Journal of accounting research 35, 1 (1997), 1–24.
- Abdelfattah et al. (2024) Bassant A. Abdelfattah, Saad M. Darwish, and Saleh M. Elkaffas. 2024. Enhancing the Prediction of Stock Market Movement Using Neutrosophic-Logic-Based Sentiment Analysis. Journal of Theoretical and Applied Electronic Commerce Research 19, 1 (2024), 116–134. https://doi.org/10.3390/jtaer19010007
- Araci (2019) Dogu Araci. 2019. FinBERT: Financial Sentiment Analysis with Pre-trained Language Models. arXiv:1908.10063 [cs.CL]
- Bollerslev (1986) Tim Bollerslev. 1986. Generalized autoregressive conditional heteroskedasticity. Journal of econometrics 31, 3 (1986), 307–327.
- Brown (2004) Robert Goodell Brown. 2004. Smoothing, forecasting and prediction of discrete time series. Courier Corporation.
- Choromanski et al. (2022) Krzysztof Choromanski, Valerii Likhosherstov, David Dohan, Xingyou Song, Andreea Gane, Tamas Sarlos, Peter Hawkins, Jared Davis, Afroz Mohiuddin, Lukasz Kaiser, David Belanger, Lucy Colwell, and Adrian Weller. 2022. Rethinking Attention with Performers. arXiv:2009.14794 [cs.LG]
- Daiya and Lin (2021) Divyanshu Daiya and Che Lin. 2021. Stock movement prediction and portfolio management via multimodal learning with transformer. In ICASSP 2021-2021 IEEE International Conference on Acoustics, Speech and Signal Processing (ICASSP). IEEE, 3305–3309.
- Darcet et al. (2024) Timothée Darcet, Maxime Oquab, Julien Mairal, and Piotr Bojanowski. 2024. Vision Transformers Need Registers. arXiv:2309.16588 [cs.CV]
- Devlin et al. (2019) Jacob Devlin, Ming-Wei Chang, Kenton Lee, and Kristina Toutanova. 2019. BERT: Pre-training of Deep Bidirectional Transformers for Language Understanding. arXiv:1810.04805 [cs.CL]
- Ding et al. (2015) Xiao Ding, Yue Zhang, Ting Liu, and Junwen Duan. 2015. Deep learning for event-driven stock prediction. In Twenty-fourth international joint conference on artificial intelligence.
- Dosovitskiy et al. (2021) Alexey Dosovitskiy, Lucas Beyer, Alexander Kolesnikov, Dirk Weissenborn, Xiaohua Zhai, Thomas Unterthiner, Mostafa Dehghani, Matthias Minderer, Georg Heigold, Sylvain Gelly, Jakob Uszkoreit, and Neil Houlsby. 2021. An Image is Worth 16x16 Words: Transformers for Image Recognition at Scale. arXiv:2010.11929 [cs.CV]
- Feng et al. (2019) Fuli Feng, Xiangnan He, Xiang Wang, Cheng Luo, Yiqun Liu, and Tat-Seng Chua. 2019. Temporal relational ranking for stock prediction. ACM Transactions on Information Systems (TOIS) 37, 2 (2019), 1–30.
- Hu and Singh (2021) Ronghang Hu and Amanpreet Singh. 2021. UniT: Multimodal Multitask Learning with a Unified Transformer. arXiv:2102.10772 [cs.CV]
- Hu et al. (2018) Ziniu Hu, Weiqing Liu, Jiang Bian, Xuanzhe Liu, and Tie-Yan Liu. 2018. Listening to chaotic whispers: A deep learning framework for news-oriented stock trend prediction. In Proceedings of the eleventh ACM international conference on web search and data mining. 261–269.
- Hu et al. (2019) Ziniu Hu, Weiqing Liu, Jiang Bian, Xuanzhe Liu, and Tie-Yan Liu. 2019. Listening to Chaotic Whispers: A Deep Learning Framework for News-oriented Stock Trend Prediction. arXiv:1712.02136 [cs.SI]
- Kalyani et al. (2016) Joshi Kalyani, Prof Bharathi, Prof Jyothi, et al. 2016. Stock trend prediction using news sentiment analysis. arXiv preprint arXiv:1607.01958 (2016).
- Kertkeidkachorn et al. (2023) Natthawut Kertkeidkachorn, Rungsiman Nararatwong, Ziwei Xu, and Ryutaro Ichise. 2023. FinKG: A Core Financial Knowledge Graph for Financial Analysis. In 2023 IEEE 17th International Conference on Semantic Computing (ICSC). IEEE, 90–93.
- Kim et al. (2019) Raehyun Kim, Chan Ho So, Minbyul Jeong, Sanghoon Lee, Jinkyu Kim, and Jaewoo Kang. 2019. Hats: A hierarchical graph attention network for stock movement prediction. arXiv preprint arXiv:1908.07999 (2019).
- Li et al. (2020) Qing Li, Jinghua Tan, Jun Wang, and Hsinchun Chen. 2020. A multimodal event-driven LSTM model for stock prediction using online news. IEEE Transactions on Knowledge and Data Engineering 33, 10 (2020), 3323–3337.
- Liu et al. (2019) Jintao Liu, Hongfei Lin, Xikai Liu, Bo Xu, Yuqi Ren, Yufeng Diao, and Liang Yang. 2019. Transformer-Based Capsule Network For Stock Movement Prediction. In Proceedings of the First Workshop on Financial Technology and Natural Language Processing, Chung-Chi Chen, Hen-Hsen Huang, Hiroya Takamura, and Hsin-Hsi Chen (Eds.). Macao, China, 66–73. https://aclanthology.org/W19-5511
- Matsunaga et al. (2019) Daiki Matsunaga, Toyotaro Suzumura, and Toshihiro Takahashi. 2019. Exploring graph neural networks for stock market predictions with rolling window analysis. arXiv preprint arXiv:1909.10660 (2019).
- Muhammad et al. (2023) Tashreef Muhammad, Anika Bintee Aftab, Muhammad Ibrahim, Md. Mainul Ahsan, Maishameem Meherin Muhu, Shahidul Islam Khan, and Mohammad Shafiul Alam. 2023. Transformer-Based Deep Learning Model for Stock Price Prediction: A Case Study on Bangladesh Stock Market. International Journal of Computational Intelligence and Applications 22, 03 (April 2023). https://doi.org/10.1142/s146902682350013x
- Rasul et al. (2024) Kashif Rasul, Arjun Ashok, Andrew Robert Williams, Hena Ghonia, Rishika Bhagwatkar, Arian Khorasani, Mohammad Javad Darvishi Bayazi, George Adamopoulos, Roland Riachi, Nadhir Hassen, Marin Biloš, Sahil Garg, Anderson Schneider, Nicolas Chapados, Alexandre Drouin, Valentina Zantedeschi, Yuriy Nevmyvaka, and Irina Rish. 2024. Lag-Llama: Towards Foundation Models for Probabilistic Time Series Forecasting. arXiv:2310.08278 [cs.LG]
- Sawhney et al. (2020a) Ramit Sawhney, Shivam Agarwal, Arnav Wadhwa, and Rajiv Shah. 2020a. Deep attentive learning for stock movement prediction from social media text and company correlations. In Proceedings of the 2020 Conference on Empirical Methods in Natural Language Processing (EMNLP). 8415–8426.
- Sawhney et al. (2020b) Ramit Sawhney, Shivam Agarwal, Arnav Wadhwa, and Rajiv Ratn Shah. 2020b. Spatiotemporal hypergraph convolution network for stock movement forecasting. In 2020 IEEE International Conference on Data Mining (ICDM). IEEE, 482–491.
- Soun et al. (2022) Yejun Soun, Jaemin Yoo, Minyong Cho, Jihyeong Jeon, and U Kang. 2022. Accurate Stock Movement Prediction with Self-supervised Learning from Sparse Noisy Tweets. In 2022 IEEE International Conference on Big Data (Big Data). 1691–1700. https://doi.org/10.1109/BigData55660.2022.10020720
- Su et al. (2023) Jianlin Su, Yu Lu, Shengfeng Pan, Ahmed Murtadha, Bo Wen, and Yunfeng Liu. 2023. RoFormer: Enhanced Transformer with Rotary Position Embedding. arXiv:2104.09864 [cs.CL]
- Touvron et al. (2023) Hugo Touvron, Thibaut Lavril, Gautier Izacard, Xavier Martinet, Marie-Anne Lachaux, Timothée Lacroix, Baptiste Rozière, Naman Goyal, Eric Hambro, Faisal Azhar, Aurelien Rodriguez, Armand Joulin, Edouard Grave, and Guillaume Lample. 2023. LLaMA: Open and Efficient Foundation Language Models. arXiv:2302.13971 [cs.CL]
- Tsai et al. (2019) Yao-Hung Hubert Tsai, Shaojie Bai, Paul Pu Liang, J. Zico Kolter, Louis-Philippe Morency, and Ruslan Salakhutdinov. 2019. Multimodal Transformer for Unaligned Multimodal Language Sequences. arXiv:1906.00295 [cs.CL]
- Vaswani et al. (2023) Ashish Vaswani, Noam Shazeer, Niki Parmar, Jakob Uszkoreit, Llion Jones, Aidan N. Gomez, Lukasz Kaiser, and Illia Polosukhin. 2023. Attention Is All You Need. arXiv:1706.03762 [cs.CL]
- Xie et al. (2023) Qianqian Xie, Weiguang Han, Yanzhao Lai, Min Peng, and Jimin Huang. 2023. The Wall Street Neophyte: A Zero-Shot Analysis of ChatGPT Over MultiModal Stock Movement Prediction Challenges. arXiv:2304.05351 [cs.CL]
- Xu and Cohen (2018) Yumo Xu and Shay B Cohen. 2018. Stock movement prediction from tweets and historical prices. In Proceedings of the 56th Annual Meeting of the Association for Computational Linguistics (Volume 1: Long Papers). 1970–1979.
- Yangjia et al. (2022) Zheng Yangjia, Li Xia, Ma Junteng, and Chen Yuan. 2022. Fundamental Analysis based Neural Network for Stock Movement Prediction. In Proceedings of the 21st Chinese National Conference on Computational Linguistics, Maosong Sun, Yang Liu, Wanxiang Che, Yang Feng, Xipeng Qiu, Gaoqi Rao, and Yubo Chen (Eds.). Chinese Information Processing Society of China, Nanchang, China, 973–984. https://aclanthology.org/2022.ccl-1.86
- Yıldırım et al. (2021) Deniz Can Yıldırım, Ismail Hakkı Toroslu, and Ugo Fiore. 2021. Forecasting directional movement of Forex data using LSTM with technical and macroeconomic indicators. Financial Innovation 7 (2021), 1–36.
- Yin and Yang (2016) Libo Yin and Qingyuan Yang. 2016. Predicting the oil prices: do technical indicators help? Energy Economics 56 (2016), 338–350.
- Zhang and Sennrich (2019) Biao Zhang and Rico Sennrich. 2019. Root Mean Square Layer Normalization. arXiv:1910.07467 [cs.LG]
- Zhang et al. (2022) Qiuyue Zhang, Chao Qin, Yunfeng Zhang, Fangxun Bao, Caiming Zhang, and Peide Liu. 2022. Transformer-based attention network for stock movement prediction. Expert Systems with Applications 202 (2022), 117239. https://doi.org/10.1016/j.eswa.2022.117239
- Zhou et al. (2021) Haoyi Zhou, Shanghang Zhang, Jieqi Peng, Shuai Zhang, Jianxin Li, Hui Xiong, and Wancai Zhang. 2021. Informer: Beyond Efficient Transformer for Long Sequence Time-Series Forecasting. arXiv:2012.07436 [cs.LG]
- Zou et al. (2022) Jinan Zou, Haiyao Cao, Lingqiao Liu, Yuhao Lin, Ehsan Abbasnejad, and Javen Qinfeng Shi. 2022. Astock: A New Dataset and Automated Stock Trading based on Stock-specific News Analyzing Model. arXiv:2206.06606 [cs.CL]