Vertical Shear Instability in Thermally-Stratified Protoplanetary Disks: I. A Linear Stability Analysis
Abstract
Vertical shear instability (VSI), driven by a vertical gradient of rotational angular velocity, is a promising source of turbulence in protoplanetary disks. We examine the semi-global stability of thermally stratified disks and find that the VSI consists of surface and body modes: surface modes are confined to regions of strong shear, while body modes extend perturbations across the disk, consistent with the previous findings. In thermally stratified disks, surface modes bifurcate into two branches. The branch associated with the strongest shear at mid-height exhibits a higher growth rate compared to the branch near the surfaces. Surface modes generally grow rapidly and require a high radial wave number , whereas body mode growth rates increase as decreases. Thermal stratification enhances the growth rates of both surface and body modes and boosts VSI-driven radial kinetic energy relative to vertical energy. Our results suggest that simulations will initially favor surface modes with large , followed by an increase in body modes with smaller , with faster progression in more thermal stratified disks.
- PPD
- protoplanetary disk
- ALMA
- Atacama Large Millimeter/submillimeter Array
- MRI
- magnetorotational instability
- MHD
- magnetohydrodynamic
- VSI
- vertical shear instability
- FWHM
- full-width at half maximum
1 Introduction
A protoplanetary disk (PPD) is a type of accretion disks through which gas moves radially inward slowly toward a central star. Early works of Shakura & Sunyaev (1973) and Lynden-Bell & Pringle (1974) have shown that the radial inflow of gas can be driven by turbulent viscosity responsible for an outward transport of angular momentum. Turbulence can also control the dust distribution and particle growth, greatly affecting the formation of planets (Lyra & Umurhan, 2019). Therefore, the study of turbulence inside PPD is vital to the understanding of the disk evolution and the planet formation processes.
It has long been believed that turbulence inside PPD is driven by magnetorotational instability (MRI) which operates when magnetic fields are very weak and the gas is sufficiently ionized, as in hot accretion disks surrounding compact objects such as white dwarfs and black holes (see, e.g., Balbus & Hawley 1991; Blaes & Balbus 1994). However, the low level of ionization due to strong shielding and low gas temperature in PPD provide a hostile condition for the operation of MRI (Blaes & Balbus, 1994; Gammie, 1996), forming MRI-dead zones in non-ideal magnetohydrodynamic (MHD) simulations (Bai & Stone, 2013; Simon et al., 2013; Lesur et al., 2014). Since the MRI-dead zones can occupy a significant portion of a PPD (Turner et al., 2014), it is necessary to find alternative mechanisms that drive turbulence and angular momentum transport in PPD (Lyra & Umurhan, 2019).
One possible attractive mechanism is vertical shear instability (VSI) which is a pure hydrodynamic instability. It was originally proposed in the context of gas mixing in differentially rotating stars (Goldreich & Schubert, 1967; Fricke, 1968), and has been applied to turbulence generation in PPD both analytically (Urpin & Brandenburg, 1998; Urpin, 2003) and numerically (e.g., Nelson et al. 2013). In a PPD, the VSI operates when there is a non-vanishing gradient of the rotational angular velocity along the vertical direction within the disk (Urpin, 2003; Nelson et al., 2013). Since the vertical shear in the rotational angular velocity can readily be induced by the radial temperature gradient of the disk (Urpin & Brandenburg, 1998; Nelson et al., 2013), all PPD are unstable to the VSI for practical purposes. Numerical simulations show that the VSI produces a meridional circulation pattern, a radially narrow and vertically elongated, axisymmetric structure (Nelson et al., 2013; Stoll & Kley, 2014), eventually developing anisotropic turbulence with stronger vertical motions than in the radial direction (Stoll et al., 2017). These perturbations can further evolve into non-axisymmetric flows such as vortices – a typical feature observed in full three-dimensional VSI simulations – that can persist for several hundred orbits (Richard et al., 2016; Manger & Klahr, 2018; Manger et al., 2020; Flock et al., 2020). Although vertical buoyancy and magnetic fields tend to stabilize the VSI (Nelson et al., 2013; Lin & Youdin, 2015; Latter & Papaloizou, 2018), it was shown that the instability operates even in the presence of radiative diffusion (Stoll & Kley, 2014) and non-ideal MHD effects (Cui & Bai, 2020).
On the theoretical side, several studies have attempted to explore the linear-regime behavior of the VSI. Urpin & Brandenburg (1998) and Urpin (2003) employed a local (Boussinesq) approximation to study the VSI in a small section of an isothermal disk. They derived the local dispersion relation and provided the criteria along with the expressions for the maximum growth rate (see also Latter & Papaloizou 2018). Nelson et al. (2013) extended the local analyses of Urpin & Brandenburg (1998) and Urpin (2003) to a semi-global analysis of an isothermal disk by allowing for the vertical variations of the background quantities. They found that the VSI consists of two distinct modes: (1) surface modes growing rapidly at small radial scales near the surfaces and (2) body modes growing relatively slowly at large radial scales in the main body of the disk. Barker & Latter (2015) also analyzed the semi-global modes of the VSI in polytropic disks, finding that the surface modes grow fastest in the regions where the vertical shear is maximized.
While these theoretical studies are useful for understanding the VSI operating in PPDs, most have been restricted to vertically isothermal disks. However, real PPD are thermally stratified due to stellar irradiation (Chiang & Goldreich, 1997; D’Alessio et al., 1998), which preferentially heats the disk surfaces. Due to a large optical depth, the regions close to the midplane are protected against the stellar irradiation and thus remain cold. This naturally establishes a positive temperature gradient along the vertical direction. Since the vertical shear depends on the pressure gradient, the development of the VSI and its nonlinear outcomes in thermally stratified disks may be expected to differ from those in the isothermal counterparts.
In this series of papers, we investigate the VSI in thermally stratified disks using both linear stability analysis and hydrodynamic simulations. In this initial paper, we examine the impact of thermal stratification on the VSI through semi-global analyses. Our main objective here is to explore the effects of thermal disk stratification on the growth rates of surface and body modes. The findings of the present paper will be used to interpret the results of hydrodynamic simulations, which will be detailed in the subsequent paper.
This paper is organized as follows. In Section 2, we describe our models of thermally stratified disks and their properties. In Section 3, we briefly review the local theory of the VSI. In Section 4, we present a semi-global analysis of the VSI, assuming perturbations are local in the radial direction but global in the vertical direction, and compare the resulting eigenvalues and eigenfunctions for an isothermal disk with those for thermally stratified disks. Finally, we summarize and discuss our results in Section 5.
2 Disk Models
In this study, we assume that disks are axisymmetric and utilize cylindrical coordinates . For the temperature distribution at the midplane, we adopt the model of Barraza-Alfaro et al. (2021), at the midplane, where serves as the reference radius and represents the power-law slope of the temperature distribution. Following Dartois et al. (2003), we allow the temperature to vary with as
| (1) |
where is the temperature in the disk “atmosphere” located at , with integer describing the temperature ratio. We consider a flared disk where the pressure scale height varies with as . We in this work set and examine models with , , and .
Our disks initially follow a power-law density distribution in the midplane where being the slope of the density profile and : the corresponding surface density profile is . The constant factor , weakly depending on , is chosen to ensure that the total mass of the disk equals 5% of the mass of the central star .111Since our models do not include self-gravity, the results of the present work and numerical simulations in the subsequent work are independent of the disk mass. However, the disk mass affects the optical depth of tracer elements, and consequently, synthetic ALMA images that we will produce in the next paper. The condition of hydrostatic equilibrium requires the density distribution along the vertical direction to obey
| (2) |
where is the isothermal speed of sound with the mean molecular weight and is the gravitational potential due to the central star.
The angular velocity of the disk rotation can be determined from the radial force balance
| (3) |
where is the Keplerian angular velocity, is the gas pressure, is the polar angle, and is the spherical radius. We define the vertical shear parameter as
| (4) |
Note that for a disk that is symmetric with respect to the midplane.
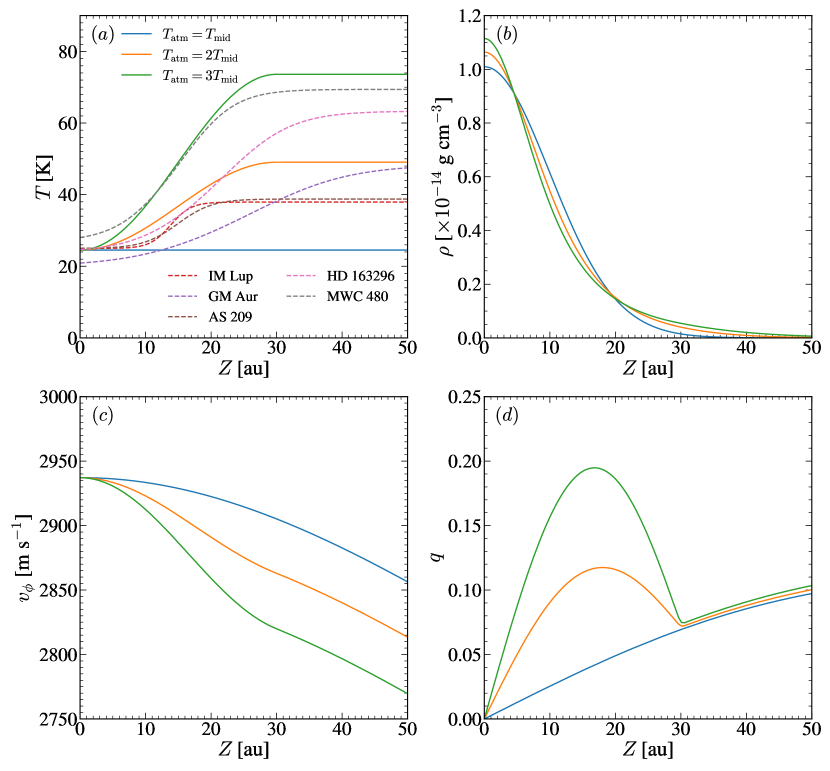
We explore three distinct disk models characterized by different values of , namely, , 2, and 3. Figure 1 illustrates the vertical profiles of various quantities at the reference radius for different . In Figure 1(), the vertical temperature distributions of our models encompass a reasonable range of values typical of PPD inferred from molecular line observations (Law et al., 2021). As shown in Figure 1(), it is evident that the rotational velocity declines more steeply with for larger . Consequently, the shear parameter increases with the thermal stratification in the regions with .
Note that exhibits an approximately linear relationship with in the isothermal disk, reaching at . However, in stratified disks, follows an approximately parabolic trend at and linear behavior at higher . This results in peak values of and at and , for the and 3 disks, respectively. The height of the peak approximately corresponds to the region with the steepest change in disk temperature. We also note that is nearly independent of in the disk atmosphere with where remains constant. The density-weighted vertically averaged shear parameter is , , and for disks with , 2, and , respectively. This is, of course, because a disk with a larger should rotate more slowly to compensate for the increased pressure gradient in Equation 3.
In this paper, we adopt an isothermal equation of state by assuming very efficient cooling. This precludes the operation of buoyancy-induced vertical motions in our disks, which is known to significantly suppress the VSI (Nelson et al., 2013; Lin & Youdin, 2015). When the cooling time is finite, Lin & Youdin (2015) showed that the criterion for the VSI can be written as
| (5) |
where
| (6) |
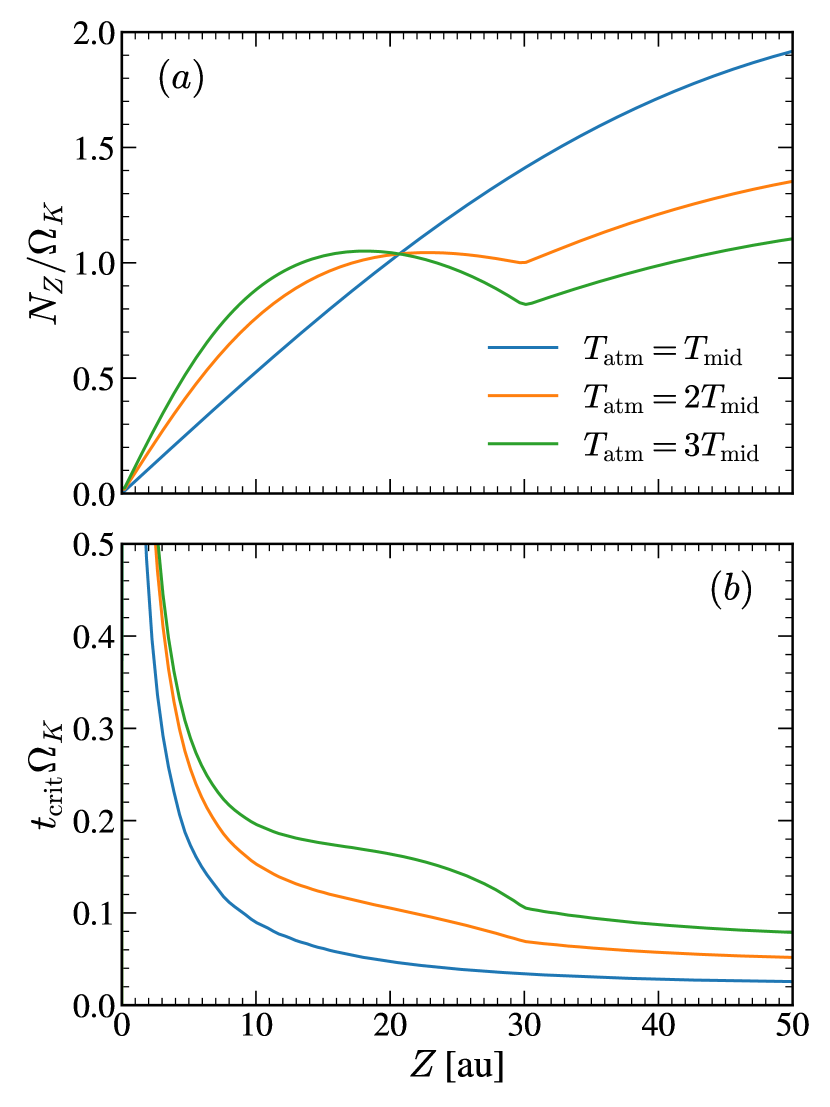
is the Brunt-Väisälä frequency with the adiabatic index and the vertical gravity (see also Urpin, 2003). Figure 2 plots the vertical distributions of and for disks with , , and . It is apparent that thermal stratification enhances buoyancy at by creating a steeper density gradient (see Figure 1), but reduces buoyancy at higher altitudes. However, the increased velocity shear extends the critical cooling time across all regions in thermally stratified disks. At low-latitude regions with at , an enhanced temperature stratification results in a larger vertical buoyancy as well as a larger vertical velocity shear. These two factors affect the development of the VSI in an opposing way: increased buoyancy stabilizes the VSI, while greater velocity shear destabilizes it. The combined effects of the two make a stratified disk a more favorable environment for the VSI to develop.
3 Local Theory
Here we provide a brief overview of the local theory of the VSI to establish a foundation for the semi-global analysis presented in Section 4. As the VSI excites inertial waves, which are essentially incompressible, the core dynamics of the VSI can be captured by incompressible or anelastic models (Goldreich & Schubert, 1967; Nelson et al., 2013; Latter & Papaloizou, 2018). However, recent works have shown that gas compressibility (Nelson et al., 2013; McNally & Pessah, 2015), vertical buoyancy (Lin & Youdin, 2015; Latter & Papaloizou, 2018), magnetic fields (Latter & Papaloizou, 2018; Latter & Kunz, 2022), vertical dust stratification (Lin & Youdin, 2017) and gas-dust drift (Lehmann & Lin, 2023) tend to stabilize the VSI, although non-ideal MHD terms reduce the stabilizing effects of magnetic fields (Latter & Kunz, 2022).
For local, axisymmetric perturbations of the form , where is the growth rate and and represent the radial and vertical wavenumber, respectively, in a rotating, shearing medium with uniform density, the dispersion relation of the VSI is given by
| (7) |
where (e.g., Latter & Papaloizou, 2018). The first term in the parentheses of Equation 7 represents the frequency of inertial-gravity waves, indicating that the VSI is inertial-gravity waves destabilized by vertical shear. Note that the condition for the VSI is
| (8) |
Since in the upper half of a PPD, the VSI-prone modes should have there, while modes with can be unstable in the lower half of the disk, where . From Equation 7, it can be shown that the fastest-growing mode for fixed satisfies
| (9) |
For , Equation 9 yields an asymptotic solution
| (10) |
with the corresponding maximum growth rate of (Latter & Papaloizou, 2018).
Latter & Papaloizou (2018) showed that the linear modes of the VSI also manifest as non-linear solutions which are in turn subject to parasitic Kelvin–Helmholtz instability, driving turbulence with the maximum amplitude of (see also Cui & Latter 2022). Since the averaged shear parameter is and for and , respectively, the local analysis predicts that the growth rate, radial wavelength, and turbulent amplitude of the VSI in the thermally stratified disk with would be 5–15 times larger than those in the isothermal disk. Since the ratio of the velocity perturbations is
| (11) |
for the most unstable modes, the ratio of the radial to vertical kinetic energy in the disk would be higher than in the disk.
4 Semi-global Analysis
To properly account for the thermal stratification in the vertical direction, we adopt the quasi-global approach of Nelson et al. (2013) and Barker & Latter (2015) in which waves are treated as axisymmetric, local in the radial direction, and global in the vertical direction. In this section, we derive the perturbation equation for the thermally stratified disks, and solve it as a boundary-value problem to calculate eigenvalues and eigenfunctions.
4.1 Perturbation Equation
The basic equations of hydrodynamics governing isothermal axisymmetric flows in cylindrical coordinates are as follows:
| (12) | |||
| (13) | |||
| (14) | |||
| (15) |
where , is the velocity in the inertial frame, , and is the gravitational potential of the central star.
We use overbars to represent the initial background states. Equations 12, 13, 14 and 15 require that
| (16) | ||||
| (17) |
and for an initial equilibrium. Note that Sections 2 and 3 are the formal solution of Equations 16 and 17.
We introduce dimensionless variables , , and , where , , and . Assuming that the perturbations have very small amplitudes, we linearize Equations 12, 13, 14 and 15 to obtain
| (18) | |||
| (19) | |||
| (20) | |||
| (21) |
where the primed quantities denote the perturbations, is the disk aspect ratio, represents the vertical dependence of the disk temperature, and .
Following Nelson et al. (2013), we consider the regions around the reference radius , and use the scaled radial and vertical distances as
| (22) |
The different normalization is to ensure that the wavenumber in the -direction is comparable to that in the -direction. In addition, we scale the perturbed density and velocities as
| (23) |
since the VSI is incompressible and the perturbed radial velocity is much smaller than the other velocities. Finally, we rescale the time variable as since the growth rates of the VSI are roughly proportional to (Urpin, 2003; Arlt & Urpin, 2004). Applying these scaled variables to Equations 18, 19, 20, 19 and 21 and dropping the terms proportional to , we obtain
| (24) | |||
| (25) | |||
| (26) | |||
| (27) |
where . Note that Equations 24, 25, 26 and 27 reduce to Equations (A15) to (A18) of Nelson et al. (2013) for a vertically isothermal disk under the condition that , , and .
We consider the perturbations of the form
| (28) |
where and denote the dimensionless frequency and radial wavenumber, respectively, for the dimensional frequency and radial wavenumber . Then, Equations 24, 25, 26 and 27 can then be combined to yield the perturbation equation
| (29) |
For a vertically isothermal disk with , , and , Equation 29 again agrees with Equation (39) of Nelson et al. (2013) or Equation (28) of Barker & Latter (2015). A different degree of thermal stratification alters , and .
Equation 29 can be solved for eigenvalues for a given wavenumber subject to boundary conditions. We impose the no-flow boundary conditions, , which is equivalent to at the vertical boundaries, as derived from Equation 27, located at . The resulting eigenvalues are generally complex numbers, indicating that the semi-global VSI is in fact overstability. The imaginary part, , of the eigenvalues represents the oscillation frequency, while the real part, , gives the growth or damping rate depending on its sign.
4.2 Eigenvalues and Eigenfunctions
We numerically solve Equation 29 using , a pseudo-spectral code developed by Burns et al. (2020), specifically designed for solving partial differential equations including linear eigenvalue problems. employs a Chebyshev collocation method on Gauss-Lobatto grid points, facilitating the transformation of Equation 29 into a matrix eigenvalue problem solvable by the QZ algorithm (Golub & van Loan, 1996; Boyd, 2001). We ensure the convergence of the eigenvalues by comparing the results with and grid points.
4.2.1 Vertically Isothermal Disk
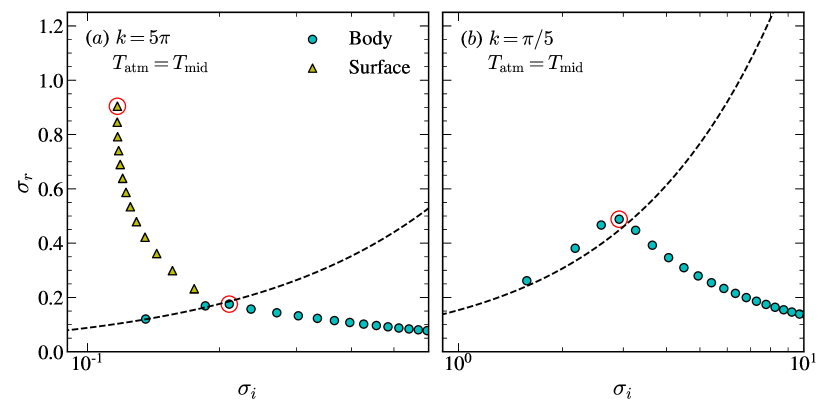
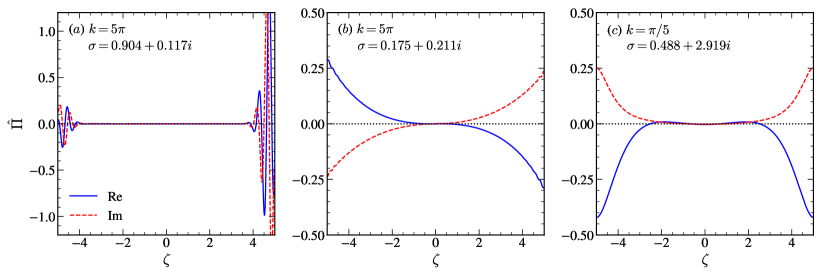
Figure 3 plots the resulting discrete eigenvalues for the VSI with and , corresponding to the dimensional radial wavelength and , respectively, in the disk. The ordinate and abscissa give the real part and imaginary part of the eigenvalues, respectively. Figure 4 plots the eigenfunctions for of the modes marked by the red circles in Figure 3.
We classify the unstable modes into surface and body modes based on the vertical dependence of . For the surface modes, the eigenfunctions exhibit significant variation near the vertical boundaries and diminish near the midplane. These modes arise in the regions where the vertical shear is strongest, and are thus analogous to the localized non-oscillatory VSI disturbances described in Section 3, modified by the imposed boundary conditions. In contrast, the eigenfunctions of the body modes maintain a finite amplitude throughout the main body of the disk. These modes are semi-global inertial-gravity waves destabilized by the vertical shear (Nelson et al., 2013; Barker & Latter, 2015).
When , Figure 3 shows that the isothermal disk possesses 13 surface modes and a number of body modes. These surface modes are further categorized into symmetric and antisymmetric modes with respect to the midplane, with equal eigenvalues. In the isothermal disk, the growth rate of the surface modes increases as the oscillation frequency decreases. The eigenfunction of the most unstable surface mode depicted in Figure 4() corresponds to an antisymmetric mode. The surface modes tend to oscillate more slowly near the surface as increases.
Body modes in general exhibit a lower growth rate compared to surface modes. Barker & Latter (2015) demonstrated that for a vertically infinite, isothermal disk with a Gaussian density distribution (i.e., ), the body modes have analytic eigenfrequencies
| (30) |
where is an integer and the term arises from the radial temperature gradient of the disk. The dashed lines in Figure 3 represent Equation 30 as a continuum. For , the three body modes with the smallest values match well with the prediction of Equation 30. Body modes can also be classified as symmetric and antisymmetric; however, unlike surface modes, they have different eigenfrequencies.222The symmetric and antisymmetric body modes are referred to as breathing and corrugation modes, respectively, in Nelson et al. (2013). The two body modes with the smallest correspond to the fundamental antisymmetric and symmetric modes (Nelson et al., 2013). The third body mode, which is most unstable for , represents the first overtone antisymmetric mode, with its eigenfunction shown in Figure 4(). The other body modes, which have a smaller growth rate with increasing , deviate from the behavior predicted by Equation 30 due to the truncated vertical boundaries in our model disks.
We find that the surface modes disappear when the radial wavenumber surpasses the threshold , as illustrated in Figure 3 for . This can be understood qualitatively through Equation 8. Local unstable modes typically exhibit the vertical wavelength
| (31) |
which is too large to be confined near the surfaces: modes with sufficiently large transform into body modes that extend globally in the -direction (see also Barker & Latter, 2015). This global effect also makes the eigenvalues at low frequencies deviate slightly from the prediction of Equation 30. The most unstable body mode in this case is the first overtone symmetric modes, plotted in Figure 4(). The body modes tend to oscillate more rapidly as increases.
4.2.2 Thermally Stratified Disks
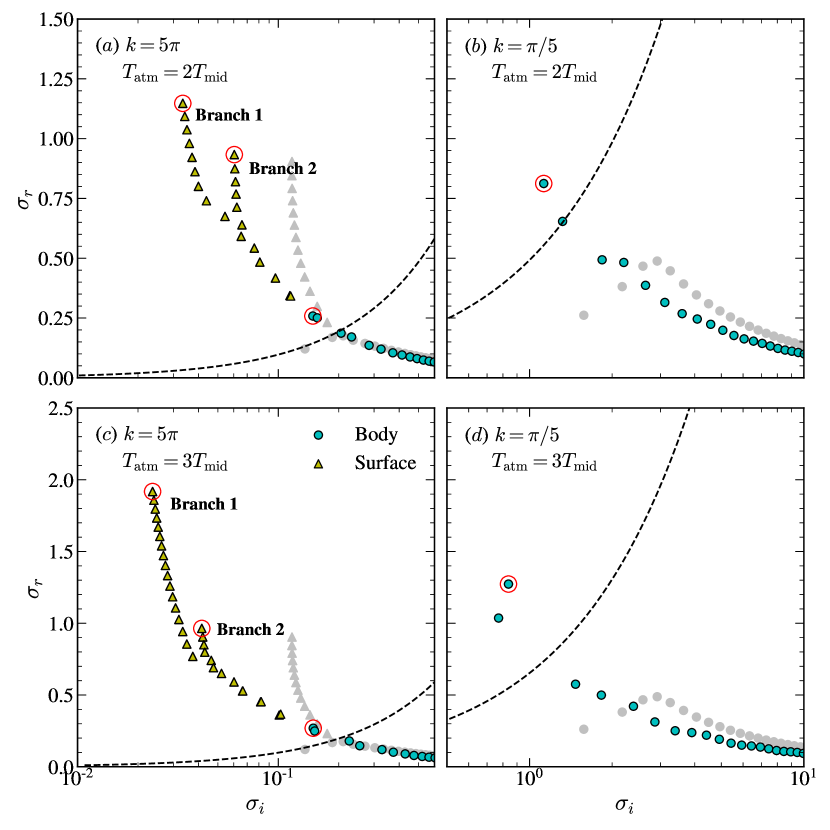
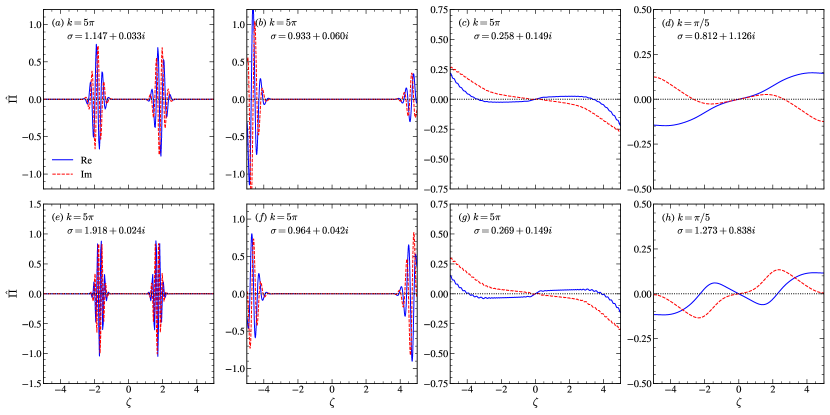
Figure 5 plots the discrete eigenfrequencies of the VSI with and in the thermally stratified disks with (upper) and (lower) . Figure 6 plots the eigenfunctions of the most unstable surface and body modes marked by the red circles in Figure 5.
In comparison with the isothermal disk, thermal stratification induces several changes. Firstly, the surface modes bifurcate into two branches due to the non-monotonic distribution of the shear rate, as shown in Figure 1(). The first branch, situated on the smaller side, is associated with the maximum shear at , resulting from the temperature gradient. In contrast, the second branch, positioned on the relatively higher side, is related to large shear at the disk surfaces, akin to the disk. The eigenfunctions of the most unstable surface modes, shown in Figure 6, clearly reveal that the first and second branches of the surface modes involve perturbations localized at and 5, respectively.
Secondly, the surface modes in the thermally stratified disks exhibit larger growth rates, by a factor of and 2.1 for the and 3 disks, respectively, when , compared to the isothermal disk. This increase is attributed to the enhanced vertical shear in the stratified disks. However, the growth rate of the most unstable surface mode in the second branch shows only a slight increase, by a factor of and 1.07 compared to the isothermal disk. This is expected since the shear at the disk boundary is almost independent of . Thirdly, Equation 30 does not accurately predict the location of the body modes in the stratified disks primarily due to significant variations of with respect to . When , there are two body modes with exceeding the prediction of Equation 30. When , in contrast, the disks exclusively host body modes whose growth rates increase with the degree of thermal stratification owing to enhanced shear. The critical radial wavenumber is and for the and 3 disks, respectively. In both the and cases, the most unstable body mode manifests as an antisymmetric mode.
4.2.3 Energy Ratio
Nelson et al. (2013) showed that in an isothermal disk, velocity perturbations induced by the VSI are dominated primarily by the vertical component. But, how does the ratio of the radial to vertical kinetic energy vary with the degree of thermal stratification. This ratio affects the observability of VSI-induced perturbations in stratified disks with modest inclinations (Barraza-Alfaro et al., 2021), which we will explore by using numerical simulations in the subsequent paper. Here, we present the energy ratio prediction from our semi-global analysis.
Once we obtain the eigenvalues and the related eigenfunctions , we use Equations 24, 27 and 29 to calculate the perturbed radial and vertical velocities as
| (32) | ||||
| (33) |
respectively. Then, the ratio of the vertically-averaged kinetic energies in the radial and vertical directions is given by
| (34) |
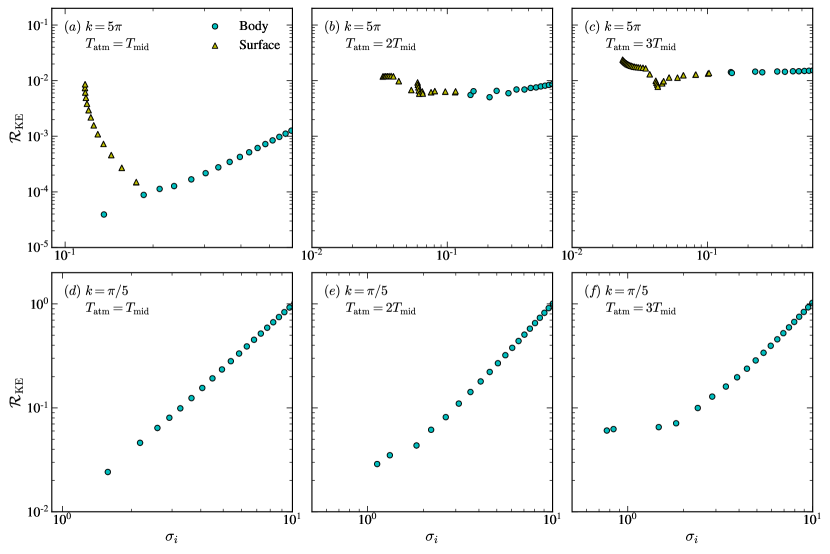
Figure 7 plots the ratio for the modes shown in Figures 3 and 5. The upper and lower panels correspond to radial wavelengths of and , respectively. Each column represents the disks with , 2, and 3 from left to right. Overall, is larger in more thermally stratified disks and for modes with smaller . It tends to decrease with increasing for the surface modes and increases for the body modes. This behavior can be qualitatively understood from Equation 11, which suggests that stronger shear induces more kinetic energy in the radial direction. Surface (body) modes with higher exhibit less (more) rapid vertical variations of the eigenfunction, corresponding to lower (higher) . For fixed , modes with smaller have larger , and hence, larger . When , the fundamental mode with smallest in the disk has that is larger by a factor of compared to that in the disk.
5 Summary and Dicussion
In this paper, we analyze the linear stability of the VSI in thermally stratified disks using semi-global approaches. To model realistic disks, where the atmospheric temperature is higher than the midplane temperature due to stellar irradiation, we consider three types of disks characterized by the ratios , and 3 (see Equation 1). Hydrostatic equilibrium dictates that a disk with higher exhibits a more rapid decrease in density and rotational angular velocity with increasing , leading to a higher vertical shear rate, defined as .
In the isothermal disk with , increases almost linearly with , reaching at . In contrast, in the thermally stratified disks, is approximately represented by a parabolic function at and a linear function at higher , resulting in maximum values and at and for the and 3 disks, respectively (see Figure 1). The local theory predicts that disks with greater thermal stratification is more prone to the VSI and have a larger radial wavelength and a larger ratio of the radial to vertical turbulence kinetic energy compared to the isothermal counterpart.
We impose small-amplitude axisymmetric perturbations to the background equilibrium state. We assume the perturbations to be semi-global, that is, the typical legnth scale of perturbations is much shorter than (comparable to) the scale over which disk properties change in the radial (vertical) direction. Using the reduced model of Nelson et al. (2013), we derive the perturbation equation relevant to the thermally stratified disk (see Equation 29). By solving the perturbation equation subject to no-flow boundary conditions, we calculate the discrete eigenvalues and associated eigenfunctions.
For the isothermal disk, our semi-global analysis recovers the results of Nelson et al. (2013) and Barker & Latter (2015). For example, the VSI is categorized into surface and body modes: surface modes are analogous to the local VSI occurring predominantly near the disk surfaces, while body modes are semi-global inertial-gravity waves with perturbations distributed over the main body of the disk, encompassing the midplane. The surface modes generally have larger growth rates than the body modes. The surface modes are discernible only when the radial wavenumber exceeds the threshold value , and disappear for small , where perturbations fail to localize effectively near the disk surfaces.
Thermal stratification not only amplifies the growth rates of both surface and body modes, but also increases the VSI-driven kinetic energy in the radial direction relative to that in the vertical direction. Moreover, the non-monotonic distribution of the shear rate leads to the bifurcation of surface modes into two branches: the first branch, associated with the strongest shear around , at the reference radius in our models, exhibits a higher growth rate compared to the second branch corresponding to the strong shear at the disk surfaces (). The surface modes exist only when the wavenumber is larger than and in the and 3 disks, respectively.
Regardless of thermal stratification, surface modes consistently exhibit larger growth rates than body modes, existing only when the radial wavenumber exceeds a certain threshold. Conversely, body modes are present across all , with larger growth rates for smaller . This suggests that numerical simulations of the VSI will first capture the most unstable surface modes with sufficiently large permitted by resolution (Nelson et al., 2013; Stoll & Kley, 2014). As the perturbations, initially concentrated in regions with the strongest shear, propagate toward the midplane, the body modes with smaller will be excited and subsequently amplify, inducing turbulence in the disk. This transition occurs earlier in disks with higher , as will be demonstrated in the forthcoming paper.
In this paper we neglect the stabilizing effect of vertical buoyancy by taking an isothermal equation of state, which can be justified only when the cooling time is sufficiently short (see e.g., Nelson et al., 2013; Lin & Youdin, 2015; Latter & Papaloizou, 2018). While thermal stratification increases the critical cooling timescale needed for the onset of the VSI (see Figure 2), the isothermal assumption may not be valid at large radii in PPD, where the gas cooling can be inefficient. For example, Pfeil et al. (2023) found that dust coagulation, which occurs when the fragmentation velocity is sufficiently high, can shrink the size of VSI-active regions by making the disk cooling inefficient at large radii (see also Fukuhara et al., 2021).
Barraza-Alfaro et al. (2021) demonstrated that the turbulence induced by the VSI in a vertically isothermal disk is observable through ALMA molecular line observations. Given the significant role turbulence plays in affecting planet formation by regulating dust distribution and particle growth (Lyra & Umurhan, 2019), it becomes imperative to investigate the characteristics of VSI-driven turbulence in more realistic disk models. In the subsequent paper, we will present results from direct hydrodynamic simulations aimed at elucidating the enhanced VSI in thermally stratified disks.
Acknowledgments
We are grateful to the referee for detailed and constructive comments. The work of H.-G.Y. was supported by the grants of Basic Science Research Program through the National Research Foundation of Korea (NRF) funded by the Ministry of Education (2022R1A6A3A13072598). The work of W.-T.K. was supported by grants of the National Research Foundation of Korea (2020R1A4A2002885 and 2022R1A2C1004810). JB acknowledges support from NASA XRP grant No. 80NSSC23K1312.
References
- Arlt & Urpin (2004) Arlt, R., & Urpin, V. 2004, A&A, 426, 755, doi: 10.1051/0004-6361:20035896
- Bai & Stone (2013) Bai, X.-N., & Stone, J. M. 2013, ApJ, 769, 76, doi: 10.1088/0004-637X/769/1/76
- Balbus & Hawley (1991) Balbus, S. A., & Hawley, J. F. 1991, ApJ, 376, 214, doi: 10.1086/170270
- Barker & Latter (2015) Barker, A. J., & Latter, H. N. 2015, MNRAS, 450, 21, doi: 10.1093/mnras/stv640
- Barraza-Alfaro et al. (2021) Barraza-Alfaro, M., Flock, M., Marino, S., & Pérez, S. 2021, A&A, 653, A113, doi: 10.1051/0004-6361/202140535
- Blaes & Balbus (1994) Blaes, O. M., & Balbus, S. A. 1994, ApJ, 421, 163, doi: 10.1086/173634
- Boyd (2001) Boyd, J. P. 2001, Chebyshev and Fourier Spectral Methods
- Burns et al. (2020) Burns, K. J., Vasil, G. M., Oishi, J. S., Lecoanet, D., & Brown, B. P. 2020, Physical Review Research, 2, 023068, doi: 10.1103/PhysRevResearch.2.023068
- Chiang & Goldreich (1997) Chiang, E. I., & Goldreich, P. 1997, ApJ, 490, 368, doi: 10.1086/304869
- Cui & Bai (2020) Cui, C., & Bai, X.-N. 2020, ApJ, 891, 30, doi: 10.3847/1538-4357/ab7194
- Cui & Latter (2022) Cui, C., & Latter, H. N. 2022, MNRAS, 512, 1639, doi: 10.1093/mnras/stac279
- D’Alessio et al. (1998) D’Alessio, P., Cantö, J., Calvet, N., & Lizano, S. 1998, ApJ, 500, 411, doi: 10.1086/305702
- Dartois et al. (2003) Dartois, E., Dutrey, A., & Guilloteau, S. 2003, A&A, 399, 773, doi: 10.1051/0004-6361:20021638
- Flock et al. (2020) Flock, M., Turner, N. J., Nelson, R. P., et al. 2020, ApJ, 897, 155, doi: 10.3847/1538-4357/ab9641
- Fricke (1968) Fricke, K. 1968, ZAp, 68, 317
- Fukuhara et al. (2021) Fukuhara, Y., Okuzumi, S., & Ono, T. 2021, ApJ, 914, 132, doi: 10.3847/1538-4357/abfe5c
- Gammie (1996) Gammie, C. F. 1996, ApJ, 457, 355, doi: 10.1086/176735
- Goldreich & Schubert (1967) Goldreich, P., & Schubert, G. 1967, ApJ, 150, 571, doi: 10.1086/149360
- Golub & van Loan (1996) Golub, G. H., & van Loan, C. F. 1996, Matrix computations
- Latter & Kunz (2022) Latter, H. N., & Kunz, M. W. 2022, MNRAS, 511, 1182, doi: 10.1093/mnras/stac107
- Latter & Papaloizou (2018) Latter, H. N., & Papaloizou, J. 2018, MNRAS, 474, 3110, doi: 10.1093/mnras/stx3031
- Law et al. (2021) Law, C. J., Teague, R., Loomis, R. A., et al. 2021, ApJS, 257, 4, doi: 10.3847/1538-4365/ac1439
- Lehmann & Lin (2023) Lehmann, M., & Lin, M.-K. 2023, MNRAS, 522, 5892, doi: 10.1093/mnras/stad1349
- Lesur et al. (2014) Lesur, G., Kunz, M. W., & Fromang, S. 2014, A&A, 566, A56, doi: 10.1051/0004-6361/201423660
- Lin & Youdin (2015) Lin, M.-K., & Youdin, A. N. 2015, ApJ, 811, 17, doi: 10.1088/0004-637X/811/1/17
- Lin & Youdin (2017) —. 2017, ApJ, 849, 129, doi: 10.3847/1538-4357/aa92cd
- Lynden-Bell & Pringle (1974) Lynden-Bell, D., & Pringle, J. E. 1974, MNRAS, 168, 603, doi: 10.1093/mnras/168.3.603
- Lyra & Umurhan (2019) Lyra, W., & Umurhan, O. M. 2019, PASP, 131, 072001, doi: 10.1088/1538-3873/aaf5ff
- Manger & Klahr (2018) Manger, N., & Klahr, H. 2018, MNRAS, 480, 2125, doi: 10.1093/mnras/sty1909
- Manger et al. (2020) Manger, N., Klahr, H., Kley, W., & Flock, M. 2020, MNRAS, 499, 1841, doi: 10.1093/mnras/staa2943
- McNally & Pessah (2015) McNally, C. P., & Pessah, M. E. 2015, ApJ, 811, 121, doi: 10.1088/0004-637X/811/2/121
- Nelson et al. (2013) Nelson, R. P., Gressel, O., & Umurhan, O. M. 2013, MNRAS, 435, 2610, doi: 10.1093/mnras/stt1475
- Pfeil et al. (2023) Pfeil, T., Birnstiel, T., & Klahr, H. 2023, ApJ, 959, 121, doi: 10.3847/1538-4357/ad00af
- Richard et al. (2016) Richard, S., Nelson, R. P., & Umurhan, O. M. 2016, MNRAS, 456, 3571, doi: 10.1093/mnras/stv2898
- Shakura & Sunyaev (1973) Shakura, N. I., & Sunyaev, R. A. 1973, A&A, 24, 337
- Simon et al. (2013) Simon, J. B., Bai, X.-N., Stone, J. M., Armitage, P. J., & Beckwith, K. 2013, ApJ, 764, 66, doi: 10.1088/0004-637X/764/1/66
- Stoll & Kley (2014) Stoll, M. H. R., & Kley, W. 2014, A&A, 572, A77, doi: 10.1051/0004-6361/201424114
- Stoll et al. (2017) Stoll, M. H. R., Kley, W., & Picogna, G. 2017, A&A, 599, L6, doi: 10.1051/0004-6361/201630226
- Turner et al. (2014) Turner, N. J., Fromang, S., Gammie, C., et al. 2014, in Protostars and Planets VI, ed. H. Beuther, R. S. Klessen, C. P. Dullemond, & T. Henning, 411–432, doi: 10.2458/azu_uapress_9780816531240-ch018
- Urpin (2003) Urpin, V. 2003, A&A, 404, 397, doi: 10.1051/0004-6361:20030513
- Urpin & Brandenburg (1998) Urpin, V., & Brandenburg, A. 1998, MNRAS, 294, 399, doi: 10.1046/j.1365-8711.1998.01118.x10.1111/j.1365-8711.1998.01118.x