Fast-rotating A- and F-type stars with emissions in NGC 3532, candidate UV-dim stars?
Abstract
Extended main-sequence stars that are dim in the ultraviolet passbands of Hubble Space Telescope (UV-dim stars) are found in several young and intermediate-age Magellanic Cloud star clusters. The obscuring of the dust in the discs of stars expelled due to fast rotation have been suggested to be responsible for the appearance of UV-dim stars, and play an important role in the formation of extended main-sequences. In this paper, we report a population of A- and F-type stars who show emission features in their spectra in a young (-old) Galactic neighboring star cluster NGC 3532. By fitting the observed absorption profiles, we found that most emitters are fast rotating stars, indicating that they form decretion discs by fast rotation like Be stars. As A- and F-type stars dominate the extended main-sequence turn-off regions of intermediate-age clusters, their appearance provides observational evidence to support the dust extinction scenario for these clusters, and might be the counterparts of UV-dim stars that are detected in remote Magellanic Cloud star clusters like NGC 1783.
1 introduction
High- resolution and precision photometric observations with the Hubble Space Telescope (HST) and Gaia Telescope revealed that star clusters younger than 2 Gyr in the Magellanic Clouds (MCs) and the Milky ways show extended main-sequence turnoffs (eMSTOs; e.g., Mackey et al., 2008; Milone et al., 2009, 2018; Cordoni et al., 2018). In star clusters younger than , additional broadened features appear in their upper MSs (Milone et al., 2015, 2016; Correnti et al., 2017; Milone et al., 2018; Li et al., 2017; Sun et al., 2019b). Extended star formation histories (eSFHs; e.g., Milone et al., 2009; Goudfrooij et al., 2009, 2011), stellar variability in the MSTOs (Salinas et al., 2016) and different stellar interior mixing (Johnston et al., 2019) were proposed to account for the extending of eMSTOs.
However, the most widely accepted explanation for the eMSTOs and broadened upper MSs 111hereafter, we call both phenomenon as extended MSs (eMSs) in some content as they are believed to be caused by similar physical mechanisms (Li et al., 2024). is the different stellar rotation of early-type stars in those regions (e.g., Bastian & de Mink, 2009; Li et al., 2014; D’Antona et al., 2015, 2017; Milone et al., 2018; Cordoni et al., 2018). This scenario has been confirmed by spectroscopic studies in some MC and Galactic clusters (Marino et al., 2018a, b; Sun et al., 2019a, b; Kamann et al., 2020, 2023) where they all found that stars on the redder sides of the eMSs have larger mean projected rotation rates () than those of stars on the bluer sides. Rotation may contribute to the formation of the eMS through two ways: First, the centrifugal force from rotation distorts stars and causes temperature inhomogeneity (known as the gravity-darkening effect; von Zeipel, 1924; Espinosa Lara & Rieutord, 2011; Paxton et al., 2013, 2019). Therefore, the projected temperatures and luminosities are scattered with different stellar inclinations, leading to the phenomenon of the eMS. Second, internal rotation affects the equilibrium of stellar structure and induces different extents of element transport inside stars. As a result, it significantly modifies the lifetime and evolutionary tracks of stars (Maeder & Meynet, 2000; Heger & Langer, 2000; Heger et al., 2005; Paxton et al., 2019; Mombarg et al., 2022), providing a possible explanation of the eMS formation. Early-type stars in both the field (Zorec & Royer, 2012; Dufton et al., 2013; Sun et al., 2021b) and star clusters (e.g., Marino et al., 2018a, b; Sun et al., 2019a, b; Kamann et al., 2020, 2023; He et al., 2022; Bu et al., 2024b) show a wide range of rotation rates, spanning from several to hundreds of kilometers per second based on spectroscopic studies. Asteroseismic measurement also revealed their rotation periods to be from hundreds of days to as short as eight hours with a median rotation period of approximately one day (Li et al., 2020b, 2024; Mombarg et al., 2024). Bimodal distributions of rotation rates were observed in the stars of both the field (Zorec & Royer, 2012; Dufton et al., 2013; Sun et al., 2021b) and star clusters (e.g., Marino et al., 2018a, b; Sun et al., 2019b). To explain the slow rotation of early-type field stars, tidal interactions and disc-locking during the pre-main-sequence phase have been suggested (Zorec & Royer, 2012). Tidal interactions (D’Antona et al., 2015) and disc-locking (Bastian et al., 2020) were then proposed to account for the formation of slowly-rotating stars in star clusters. A kind of tidal interactions between stars and binary orbits, so-called ‘inverse tides’, which transfer angular momentum from the stars to the binary orbitals, were found to also contribute to the different rotation rates of early-type stars (Li et al., 2020a; Fuller, 2021). Binary mergers were suggested as another possible path to form slowly rotating blue MS stars (Wang et al., 2022). Some works (e.g., Kamann et al., 2021; Yang et al., 2021; Sun et al., 2021a; Wang et al., 2023; He et al., 2023; Muratore et al., 2024; Bu et al., 2024a) have been conducted to test these scenarios. For a comprehensive description for the researches of eMSs, we suggested the review of Li et al. (2024).
A population of eMSTO stars that was dim in the ultraviolet (UV) filter (F275W) of the HST passbands was recently found in the intermediate-age ( 1.8 Gyr; Mackey et al., 2008) Large MC (LMC) cluster NGC 1783 (Milone et al., 2023a). Five MC clusters younger than were later found to harbor stars that are dim in the HST F225W and F275W bands (Milone et al., 2023b), indicating that UV-dim stars are common in star clusters. These stars are much redder than the bulk of stars when the color index includes UV bands, while well mixed with other stars for the colors made of optical bands. They are called ‘UV-dim’ stars (Milone et al., 2023a). To explain the UV-dim stars in NGC 1783, D’Antona et al. (2023) carefully studied the effect of dust extinction of the circumstellar discs on the morphology of the MSTO. They found that the model with dusty stars can exclusively reproduce the entire eMSTO stellar distribution including that of UV-dim stars. UV-dim stars were proposed to be fast-rotating stars obscured by dust in the discs along the line of sight, which is expelled due to fast stellar rotation (D’Antona et al., 2023). Then, they correspond to large , which is consistent with the observations (e.g., Kamann et al., 2020) where stars with larger are located in the redder part (D’Antona et al., 2023). Their work indicates that dust self-extinction of stars may also play a significant role in the formation of the eMSTOs besides different stellar ages and rotation rates (D’Antona et al., 2023). If this scenario is on the right track, the influence of dust self-extinction would be not negligible when determining the parameters (e.g., the ages) of clusters using CMDs and stellar models, and studying the effect of rotation on stars for stellar models.
Since A- and F- type stars dominate the MSTOs of intermediate-age clusters like NGC 1783, the dust self-extinction scenario indicates that star clusters should harbor a population of fast-rotating A- or F-type stars with excretion discs. Be stars, who are fast-rotating B-type stars exhibiting emissions in their spectra, have been widely found in many young star clusters (Bastian et al., 2017; Milone et al., 2018). Their emissions are thought to be the result of the ionization of the gas in the decretion discs that are expelled due to very rapid rotation (Rivinius et al., 2013). They provide the observational evidence for eMSs to have a population of fast rotating stars (Bastian et al., 2017), and are found to be located in the red parts of eMSs, in favour of that different rotation of stars causes eMSs (Milone et al., 2018). Shell stars are stars obscured by discs along the light of sight whose spectra show broadened photospheric lines from the stars and narrow absorption lines from the discs (Rivinius et al., 2006). The shell stars in the Be population of the LMC star cluster NGC 1850 () are found to be redder than other normal Be stars (Kamann et al., 2023). This indicates that self-extinction of the discs indeed introduces additional reddening other than stellar rotation (Kamann et al., 2023). However, a large population of A- and F-type stars with emissions has not been detected in star clusters yet. Since the weak ionization radiation of A- and F-type stars (Rivinius et al., 2013), it is hard to detect both types of stars with discs using emissions. The field A- and F-type with discs were generally detected as shell stars through the absorption profiles of discs in the near-infrared spectra (e.g., Slettebak, 1986). Some of them show weak emissions, however, they disappear quickly for later subtypes(Rivinius et al., 2013).
In this paper, we report a population of A- and early F-type stars who show emission features in a young () Galactic neighboring () star cluster NGC 3532, using the high-resolution public spectra from the European Southern Observatory (ESO) archive. This cluster was one of the clusters in the Milky Way who were detected to show evident eMSs by Cordoni et al. (2018). The emitters account for of the spectroscopic samples, and have masses (1.4–) close to that ( D’Antona et al., 2023) of the eMSTO stars of NGC 1783. By fitting the observed absorption profiles in their spectra, we found that most emitters are rapidly rotating stars. These results imply that a fraction of A- and F-type stars with discs expelled due to fast rotation appear in star clusters. They might provide vital observational support for the dust self-extinction scenario for the eMSs, and be the counterparts of the UV-dim stars found in remote MC clusters, in particular of those found in intermediate-age clusters like NGC 1783.
2 Data Reduction
2.1 Isochrone fitting
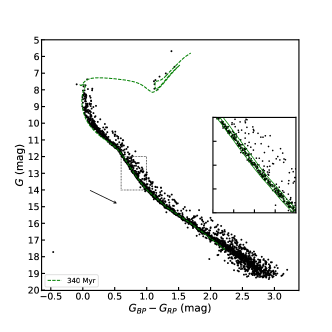
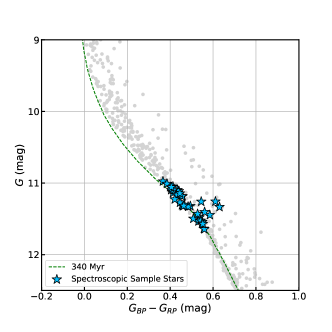
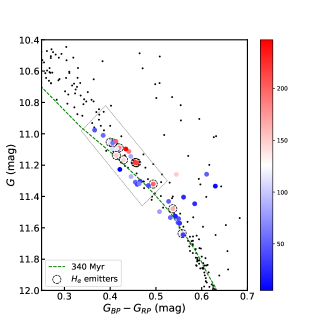
We adopted the catalog of NGC 3532 member stars provided by Pang et al. (2022). The CMD of the cluster is shown in Figure 1. In this Figure, the photometric data are from Gaia Early Data Release 3 (EDR3; Gaia Collaboration et al., 2016, 2021). We used the isochrones from the PARSEC model (version 2.0S, Nguyen et al., 2022) to fit the CMD of this cluster. The adopted isochrones correspond to stellar models with no rotation rates. The extinction coefficients for the Gaia bands were derived with the extinction curves from Cardelli et al. (1989) and O’Donnell (1994). The best-fitting isochrone for the blue edge of the eMSTO is shown in Figure 1. It has an age of , metallicity and a distance modulus . The distribution of the post-MS stars is well consistent with the position of the best-fitting isochrone. The distance modulus corresponds to a distance of , which is close to the distance () inferred from the average parallax of the cluster provided by Gaia Collaboration et al. (2018). The age of the best-fitting isochrone is different from those provided by Gaia Collaboration et al. (2018), Tarricq et al. (2021) and Pang et al. (2022) ( from these references). This may be caused by the extending of the MSTO. The extinction of the cluster , corresponding to , which is much smaller than the median (0.13) of 324 neighboring open clusters within 500 pc reported by Qin et al. (2023). To explore the effect of differential reddening on the cluster CMD, we inspected the distribution of stars with and (within the dotted rectangle in Figure 1), which is shown in the inset. The solid green lines in the inset represent the shifted best-fitting isochrones by in color, which magnitude corresponds to the average measurement error of of the stars with . Most stars that reside on the MS ridgeline in the inset are located between the shifted best-fitting isochrones, indicating that the effect of differential reddening on the CMD of NGC 3532 is not significant. This implied that differential reddening, which was suggested to be responsible for the eMSTO in Trumpler 20 (Platais et al., 2012), contribute little to the eMS in NGC 3532.
 |
 |
2.2 Spectrum Fitting
We obtained public spectra of 39 A- and early-F stars of NGC 3532 with who have spectra in wavelength range of 644– from the archive of European Southern Observatory (ESO). These spectra were observed by the program 193.B–0936 (PI: Gilmore; Gilmore et al., 2012). The minimum magnitude of the spectroscopic sample stars is . Their mass range is 1.39– inferred from the best-fitting isocrhone. The spectra were observed with the GIRAFFE spectrograph mounted on the Very Large Telescope (VLT) with a resolution of and signal-to-noise ratios (SNRs) of from 136 to 397. The loci of these spectroscopic sample stars in the CMD are shown in the left panel of Figure 2.
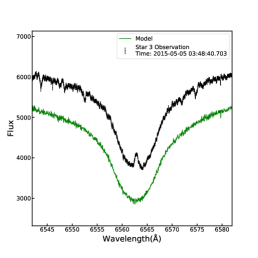
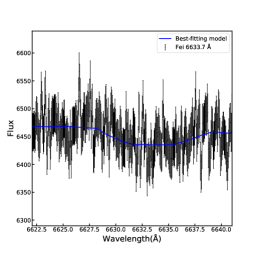
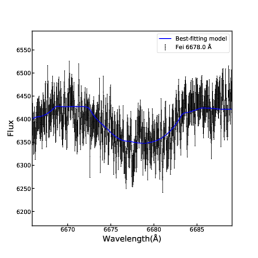
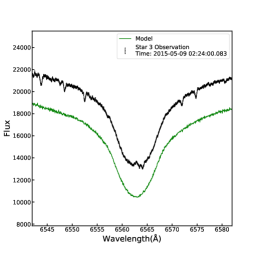
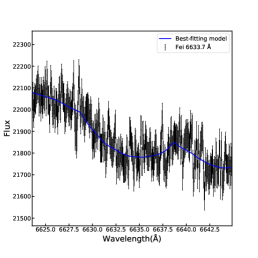
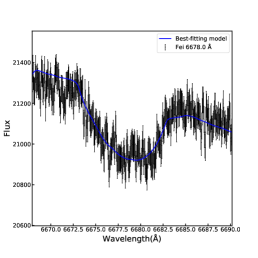
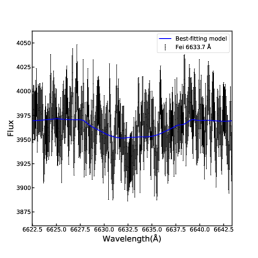
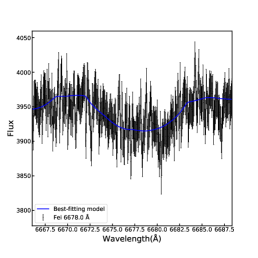
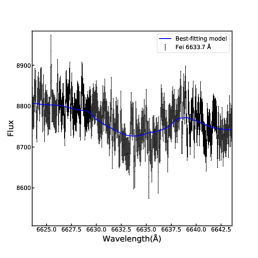
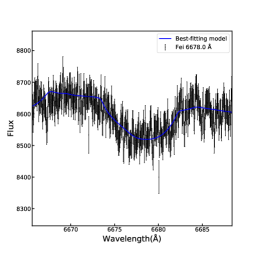
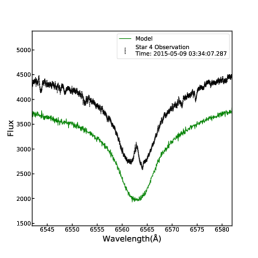
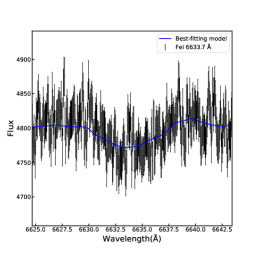
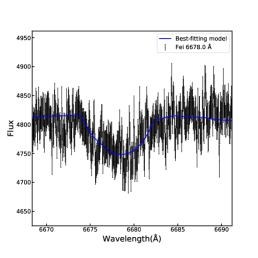
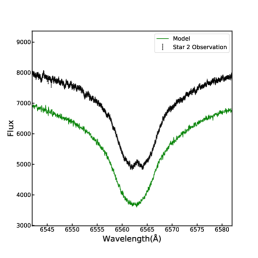
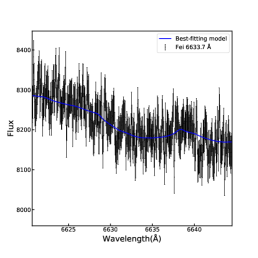
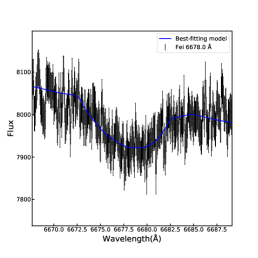
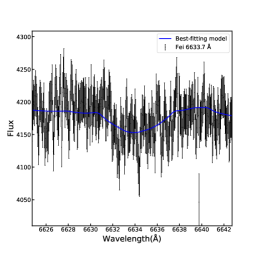
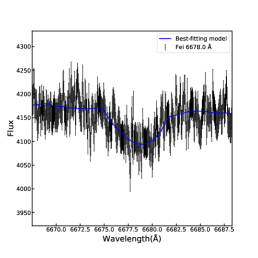
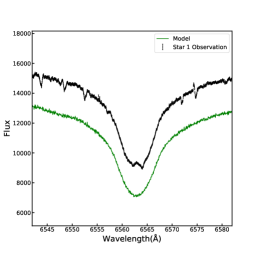
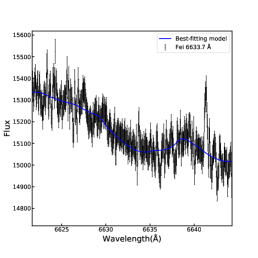
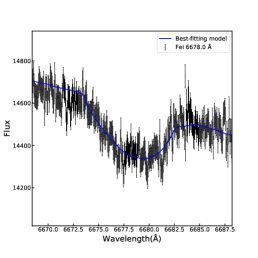
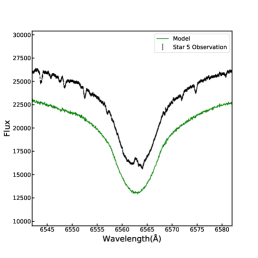
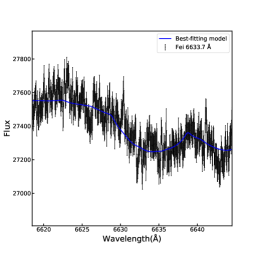
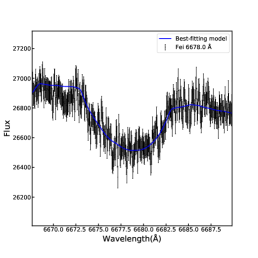
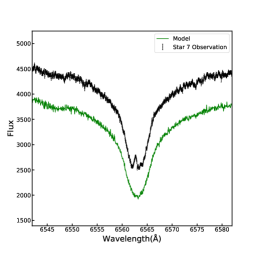
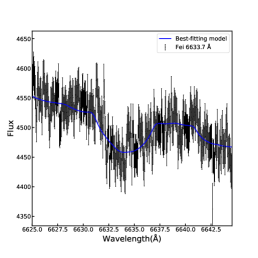
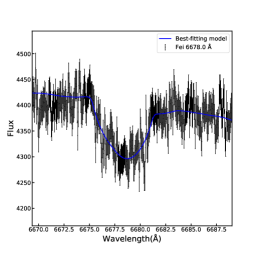
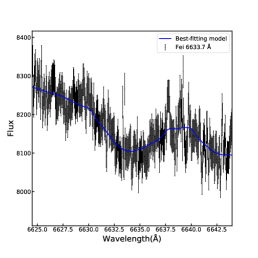
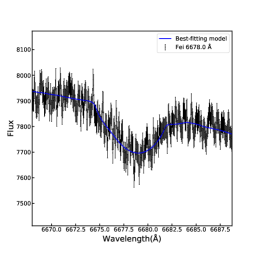
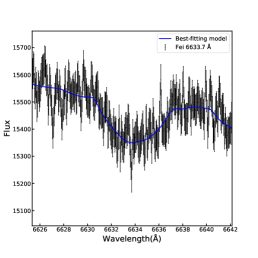
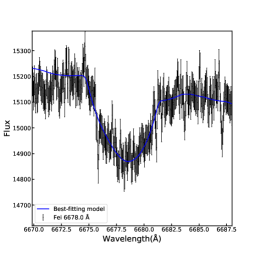
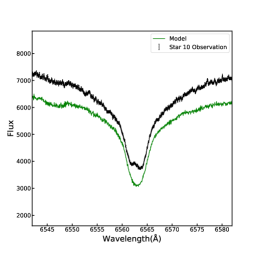
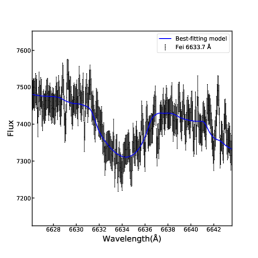
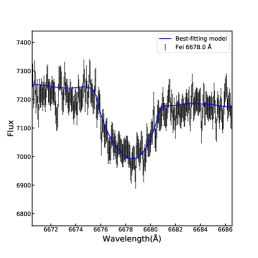
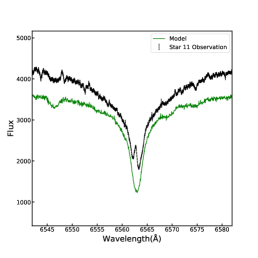
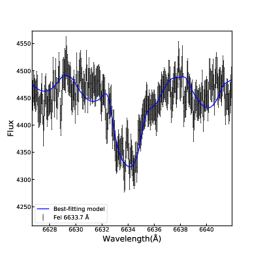
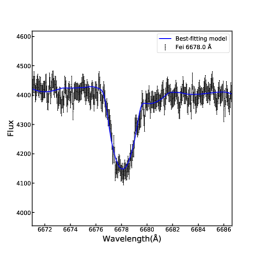
To get the of these stars, we fitted the observed absorption profiles of the Fe I 6633.7Å and 6678.0Å lines in the observed spectra. We obtained theoretical stellar spectra with different surface effective temperatures , surface gravity , and metallicity [Fe/H] from the Pollux database (Palacios et al., 2010). These spectra were derived based on the Plane-parallel ATLAS12 model atmospheres in local thermodynamic equilibrium (Kurucz, 2005), using the SYNSPEC tool (Hubeny & Lanz, 1992). Their were set to be 5800–10,000 K in steps of 100 K. The were set to be 3.5–5.0 dex in steps of 0.1 dex. In all the synthetic spectra, a fixed microturblulent velocity of was introduced. The metallicity of the synthetic spectra was set to be solar based on the metallicity of the best-fitting isochrone. We used the tool PyAstronomy (Czesla et al., 2019) to convolve the synthetic spectra with the effects of instrumental and rotating () broadening, and shift the wavelengths based on the input radial velocities (RVs). The range of was set to be 5– in steps of . The RVs were set to be within and in steps of based on the average RVs (5–) of NGC 3532 members reported by Tarricq et al. (2021) and Pang et al. (2022) 222We noted that the best-fitting RVs of some stars were close to the upper or lower limits of the RV fitting range. These stars might be in close binaries that show large RV differences from most cluster members. For their spectra, we extended their RV fitting ranges.. Then we used the tool Astrolib PySynphot (STScI Development Team, 2013) to derive the flux corresponding to each wavelength of the observed spectra. We compared the absorption profiles of the Fe I 6633.7Å and 6678.0Å lines in the model spectra with those of the observed spectra, and determined the best-fitting model using a minimum- method. The uncertainty of the measurement was determined by combining the values corresponding to different input parameters (Avni, 1976; Wall, 1996; de Grijs et al., 2013). We fitted the correlation of the values with the values for the best-fitting , and RVs. Then the 1 uncertainty of is the difference between the best-fitting value and the values corresponding to +1. In the middle and right panels of Figure 3, we show the observed spectra with the best-fitting models for two spectroscopic samples.
3 Main Results
Table 1 shows the measured of the 39 stars along with their Gaia passband information. For each star who has spectra observed at multiple epochs, the listed in Table 1 is the average value of the of the multiple-epoch spectra. Based on Table 1, the sample stars have a wide range of of 5–. In the left panel of Figure 5, we plot the loci of these spectroscopic samples color-coded based on their measured . For stars near the MS ridgeline, stars with larger are located in the redder side. This is consistent with the positive correlation of and stellar colors observed in many young star clusters (e.g., Marino et al., 2018a; Sun et al., 2019b; Kamann et al., 2023).
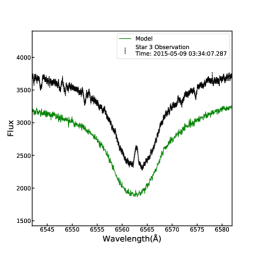
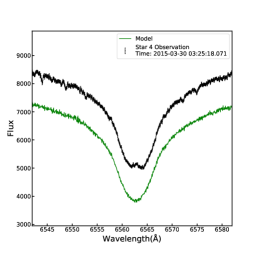
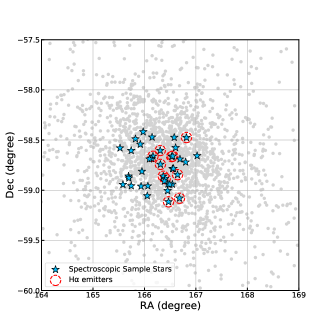
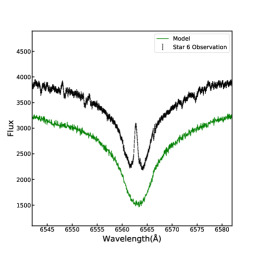
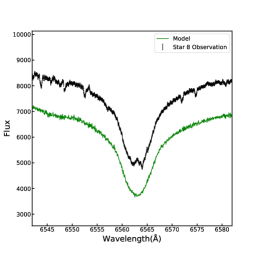
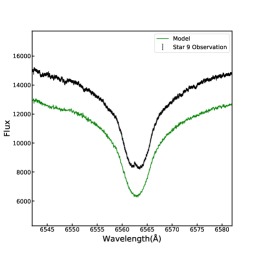
We carefully inspected the spectra of all the spectroscopic sample stars, and found that 11 out of the 39 stars show emission features. In Table 1, we denote these stars as Star 1–11. They account for of the whole spectroscopic sample stars. Their spectra for the , Fe I 6633.7Å and 6678.0Å lines, along with the best-fitting models for Fe I 6633.7Å and Fe I 6678.0Å lines are shown in Figure 3, and Figure 6 to 7 in the Appendix. Based on these figures, the emission features are evident compared with the best-fitting models, and are not the results of the observational errors of flux. The right panel of Figure 2 shows their positions in the field of the cluster. In Figure 2, the stars with emissions disperse in the cluster field. Therefore, their emission features are not likely caused by the light contamination from a strong emitter.
| Gaia ID | G | labels | Gaia ID | G | labels | ||||
|---|---|---|---|---|---|---|---|---|---|
| (1) | (mag) (2) | (mag) (3) | () (4) | (5) | (1) | (mag) (2) | (mag) (3) | () (4) | (5) |
| 5338651637541468032 | 10.98 | 0.37 | – | 5338676853241853312 | 11.45 | 0.58 | – | ||
| 5338659265404154880 | 11.01 | 0.38 | – | 5338657783587036032 | 11.50 | 0.51 | – | ||
| 5340218097982590976 | 11.05 | 0.41 | – | 5340160992121127168 | 11.53 | 0.54 | – | ||
| 5338679778169530880 | 11.09 | 0.41 | – | 5338630162702473728 | 11.53 | 0.53 | – | ||
| 5338674211891232640 | 11.10 | 0.43 | – | 5338682011552542848 | 11.54 | 0.55 | – | ||
| 5338650744188318848 | 11.10 | 0.40 | – | 5338709224455685888 | 11.57 | 0.55 | – | ||
| 5338714653294510464 | 11.11 | 0.44 | – | 5338627890614688384 | 11.57 | 0.55 | – | ||
| 5340214112272818176 | 11.14 | 0.45 | – | 5340165149649780992 | 11.64 | 0.56 | – | ||
| 5338651362663550720 | 11.23 | 0.42 | – | 5338652118577887616 | 11.32 | 0.49 | Star 1 | ||
| 5338709705490314624 | 11.26 | 0.54 | – | 5338624390266300416 | 11.18 | 0.46 | Star 2 | ||
| 5340164153217132928 | 11.26 | 0.61 | – | 5338665067851545600 | 11.18 | 0.45 | Star 3∗ | ||
| 5338715782825371008 | 11.27 | 0.45 | – | 5338710083450233216 | 11.09 | 0.42 | Star 4∗ | ||
| 5338702421228391936 | 11.30 | 0.47 | – | 5338661636226329216 | 11.18 | 0.46 | Star 5 | ||
| 5338648854402511232 | 11.31 | 0.45 | – | 5338660807243993216 | 11.14 | 0.41 | Star 6 | ||
| 5338709808571831808 | 11.32 | 0.46 | – | 5338635758994803456 | 11.64 | 0.56 | Star 7 | ||
| 5338678949185892864 | 11.32 | 0.46 | – | 5338652045510742016 | 11.48 | 0.54 | Star 8 | ||
| 5338650602401738112 | 11.33 | 0.63 | – | 5340158586938781440 | 11.17 | 0.43 | Star 9 | ||
| 5340147557462156544 | 11.33 | 0.48 | – | 5338645654599400704 | 11.05 | 0.40 | Star 10 | ||
| 5338720116492694272 | 11.40 | 0.56 | – | 5340161954193782784 | 11.06 | 0.41 | Star 11 | ||
| 5340149309808437888 | 11.43 | 0.53 | – |
 |
 |
 |
 |
 |
 |
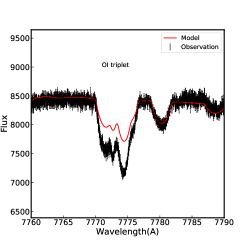
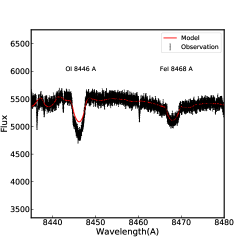
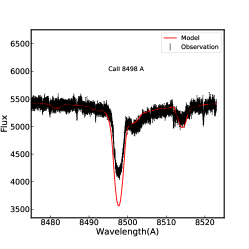
The emission features indicate that these stars may have gaseous material that is optically thin around them that emit light due to the heating of the central stars. As shell star have additional absorption than normal stars in the O I 7774 Å triplet (7772 Å, 7774 Å and 7775 Å), O I 8446 Å line, and Ca II triplet (8498 Å, 8542 Å and 8662 Å) due to the absorption of discs (Slettebak, 1986), we explored whether there are shell stars in the emitters through these near-infrared absorption features. In the ESO archive, only Star 11 has been spectroscopically observed in the corresponding infrared wavelengths. This spectrum was observed using the UVE spectrograph equipped on the VLT ( Program ID: 074.C-0399; PI: Jeffries), which has a wavelength range of 665–1043 nm, and SNR of . Like the measurement of the in Section 2, we fitted the observed absorption profile of Fe I 8498 Å of this spectrum to get the best-fitting spectrum model. Figure 4 shows the observed O I 7774 Å triplet, O I 8446 Å and Ca II 8498 Å lines of Star 11, along with the best-fitting model for the Fe I 8498 Å. The spectrum of Star 11 exhibits evident additional absorption in the O I 7774 Å triplet and O I 8446 Å line compared with the synthetic spectrum, indicating the appearance of a disc around it. However, this star has weaker absorption profile in the Ca II 8498 Å compared with that of the model. One possible reason might be that Star 11 is a chemically peculiar star who has an underabundance of light elements such as Ca and O (Casamiquela et al., 2022). Chemically peculiar stars are characterised with slow rotation rates (Preston, 1974), which the () of Star 11 is consistent with. If this is on the right track, the photospheric lines of Star 11 may show both weaker O I 7774 Å triplet and O I 8446 absorption profiles than the model when it also has an underabundance of O. It indicates that the decreasing of the flux due to absorption of the disc might be larger than that shown in Figure 4. Since to test whether this star is chemically peculiar is beyond the topic of this paper, we leave it in the future work. We noted that the measured RV () of this spectrum has large difference with that () of the spectrum measured in Section 2.2 for the same star. This implies that Star 11 might be in a close binary. However, we did not find evident split patterns and additional absorption in other lines of both spectrum with wavelengths of 644– and 665–1043 nm. Therefore, the contribution of flux from the companion should be small if it is a close binary system.
 |
 |
 |
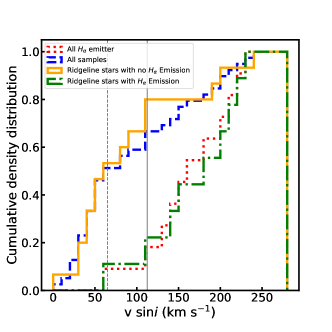
To check whether these emitters are fast-rotating stars, we plot the cumulative number distribution of the of all the spectroscopic sample stars and that of the stars with emissions in the right panel of Figure 5. Since the stars around the kink of the eMSs (corresponding to 11.6 mag), which corresponds to the mass where the magnetic braking on stellar rotation start to be effective (Kraft, 1967; Milone et al., 2018), are generally slow rotators, we also compare the distributions of stars with and without emissions above the kink (within the grey dashed parallelogram in the left panel). Figure 5 shows that most (10/11) emitters are fast rotators among the spectroscopic samples, with larger than the median value of the whole spectroscopic samples. For the stars above the eMS kink, 9 out of 11 emitters have larger than the median value of the population, and the of of stars without emissions.
 |
 |
4 Discussion
4.1 emissions from the sky background
One fact that may influence the result of our work is the flux from the sky background. We note that the sky background spectra of the observation show weak emissions based on the files provided by ESO archive. Although the flux from the sky background have been substracted from the final public spectra, the shapes of the lines in the public spectra of single targets may be influenced, as the sky background spectra used in the substraction are the mean of those obtained for a field using multiple fibres, not designed for the neighboring of single targets (Gilmore et al., 2022). However, we argue that the light contamination from the sky background could not dominate the formation of the emissions detected in this paper, as the appearance of the emissions should not be strongly correlated with fast rotation (see Figure 5) if they are mainly caused by background light contamination. The emission features of most emitters should be intrinsic.
4.2 Implication for dust extinction scenario
The spectrum fitting results in Section 3 indicate that A- and early F-type stars in NGC 3532 may have decretion discs which are formed due to fast rotation. As the radiation ionization of A and F stars for discs is thought to be weak (Rivinius et al., 2013), the fraction of the A- and F-type stars who have expelled discs may be higher than . This indicates that star clusters can harbor a significant population of fast-rotating A-type and F-type stars with excretion discs, thus, provide observational evidence to support the dust self-extinction scenario for the UV-dim stars that appear in intermediate-age clusters. NGC 1783 is a typical intermediate-age cluster where a large population of UV-dim stars was detected (Milone et al., 2023a). The distribution of the UV-dim star was well reproduced by dusty star models (D’Antona et al., 2023). The masses of of the eMSTO stars of NGC 1783 is (D’Antona et al., 2023), with which the masses of the emitters (1.4–) are well consistent. The emitters found in NGC 3532 might be the counterparts of the UV-dim stars detected in the intermediate-age MC cluster NGC 1783, if the discs can survive more than .
4.3 Other mechanisms of excretion discs formation
In the 39 spectroscopic sample stars, some fast rotating stars do not show emissions. The Star 11 have emission and the absorption profile of shell stars, meanwhile, a small value. As the discs of shell stars are along the line of sight, their spin axis should tend to be vertical to the line of sight, assuming that the spin axis align with the normal of the discs. Therefore, the inclination angle of the rotation axis of Star 11 should be large, implying its small should be caused by intrinsic slow rotation. In the young LMC cluster NGC 1850, the of the Be stars did not extend to higher values than normal MSTO stars, and the Be stars did not rotate at rates close to the break-up rotation velocities, implying that fast rotation might not be the exclusive mechanism to form the excretion discs (Kamann et al., 2023). The shell and slowly rotating features of Star 11 also imply that other mechanism may play a role in the formation of excretion discs.
The formation of excretion discs may be linked to stellar pulsation. With the advent of space-based photometry missions such as CoRoT (Auvergne et al., 2009), Kepler (Borucki et al., 2010), and TESS (Ricker et al., 2015), nearly all Be stars have been found to exhibit multiperiodic light variations (Rivinius et al., 2013), which are attributed to stellar pulsations caused by internal waves. The amplitudes of certain pulsation modes vary over time and correlate with outbursts (e.g., Rivinius et al., 2003; Huat et al., 2009; Goss et al., 2011; Pápics et al., 2017), supporting the hypothesis that stellar pulsations and the Be phenomenon are interconnected (e.g., Baade, 1988). However, whether outbursts trigger the pulsations or the pulsations expel material to form circumstellar disks remains under debate.
In particular, Huat et al. (2009) discovered that for HD 49330, observed by CoRoT, the amplitudes of its gravity modes (restored by gravity) peaked during the outburst phase and remained weak during the quiescent phase. Conversely, the amplitudes of pressure modes (restored by pressure) showed the opposite trend. Neiner et al. (2020) successfully explained these anti-correlated amplitude variations, suggesting that the gravity modes were stochastically excited and transported angular momentum to the surface, thereby increasing the surface rotation rate and triggering the outburst. The outburst, in turn, broke the pressure mode cavity, leading to the suppression of pressure modes.
Following the simulation by Neiner et al. (2020), we sought to identify such anti-correlated amplitude variations in NGC 3532. Using TESS photometric data and following the steps similar to Li et al. (2024), we conducted aperture photometry and Fourier analysis on early-type stars in NGC 3532, which included two months of consecutive observations in 2019, one month in 2021, and another two months in 2023. While we observed some amplitude variations, we found no clear evidence of outbursts or anti-correlated amplitude variations. Data quality may be the main limiting factor, as TESS data are sporadically covered, and contamination from nearby stars’ light, as well as scattered light from Earth and the Moon, is unavoidable and significantly impacts amplitude measurements. We emphasize that continuous, high-precision photometric data (such as archived Kepler data or TESS data in the continuous viewing zone) are essential for revealing the pulsation-driven shell star phenomenon.
The high fraction of the A- and F-type emitters in NGC 3532 also gives some puzzling on the fraction of A and F stars to have excretion discs, and the mechanism to drive emissions in circumstellar discs. The radiation ionization for the gases in the discs of A and F stars are thought to be weak (Rivinius et al., 2013), therefore, discs surrounding A and F type stars are more easier to be detected through the absorption features of discs in near-infrared spectra (e.g., Slettebak, 1986) when they are shell stars. Whether the high fraction of A and F stars with emissions is common in young star clusters is not clear. Searching for such stars in more star clusters would be essential to test it. It would also help constrain the models of star-disc interactions of high-mass MS rotating stars, which is important for the planetary formation theory around early-type stars.
4.4 Challenge for the dust extinction scenario
The CMD positions of the UV-dim stars found in young MC star clusters may challenge the dust extinction scenario (Milone et al., 2023b). In these clusters, the stars with most evident UV-dim features were found to be located in the blue MSs, while blue MSs are thought to be populated by slowly rotating stars (Milone et al., 2023b). Additionally, Be stars identified through their high flux in the HST band (Milone et al., 2018) were found to have different color distributions from those of UV-dim stars (Milone et al., 2023b, for details, please refer to this reference) 333It should be noted that A- and F-type emitters may not be able to be separated from other normal stars using narrow filters centered on the line like Be stars, since their emissions are generally weak. Therefore, they may not be classified into the population which have strong emissions like Be stars. They may have different color features from those of Be stars identified using narrow filters centered on the line.. These results imply that the correlation between the UV-dim phenomenon and fast stellar rotation still needs to be explored.
Future UV-band photometry for A- and F-type emitters, and spectroscopic measurements for UV-dim stars in young star clusters would be helpful. If most emitters are found not dim in the UV-bands, the UV-dim phenomenon may not be caused by circumstellar dust extinction. If the A- and F-type emitters are found indeed UV-dim, and the spectroscopic observations reveal that UV-dim stars in young star clusters are slow rotators with circumstellar gas, the stellar discs in young and intermediate-age clusters may be formed through different mechanisms. For young star clusters, recent intense mass-loss events and gas remnant after recent binary merging were suggested to account for the formation of UV-dim stars (Milone et al., 2023b). For Star 11, the discrepancy between the wavelengths corresponding to the peak of the emission and the minimum of the absorption of the best-fitting model (see the bottom panels of Figure 7) possibly indicates a strong mass-loss event which takes a lot of angular momentum away from the star and makes the star rotate slowly. This star may be an example to form UV-dim stars through intense mass lose which results in slow rotation suggested by Milone et al. (2023b). We also note that UV-dim stars are rare for stars later than B type in those young MC clusters (Milone et al., 2023b), while the intermediate-age cluster NGC 1783 were found to harbor a large population of A- and F-type UV-dim stars (Milone et al., 2023a). It seems that the number of UV-dim stars with different spectral types may change as the clusters evolve, in particular for the stars later than B type. A- and F-type stars may lose masses more easily when they expand during MS time. In summary, the mechanisms to cause the UV-dim phenomenon in early-type stars may be complicated. The dust extinction model may be improved in the future.
5 Conclusions
In this paper, we report the detection of a population of A and F stars whose spectra show emission features in the young Galactic star cluster NGC 3532, which account for of the spectroscopic samples explored in this paper. We found that most of these stars are fast rotating stars, implying that they have excretion discs that are formed due to fast rotation. Their appearance supports the scenario of dust extinction for eMSs, that a significant fraction of A and F stars in star clusters may rotate fast with expelled discs, which introduce extending of MSs and perform as UV-dim stars in photometric observations. They might be the counterparts of the UV-dim stars detected in the MC star clusters, in particular those in the intermediate-age cluster NGC 1783 (Milone et al., 2023a; D’Antona et al., 2023). Future UV photometric observations would help explore whether they are indeed dim in UV passbands, and shed more light on the star-disc models for early-type stars.
References
- Astropy Collaboration et al. (2013) Astropy Collaboration, Robitaille, T. P., Tollerud, E. J., et al. 2013, A&A, 558, A33, doi: 10.1051/0004-6361/201322068
- Astropy Collaboration et al. (2018) Astropy Collaboration, Price-Whelan, A. M., Sipőcz, B. M., et al. 2018, AJ, 156, 123, doi: 10.3847/1538-3881/aabc4f
- Astropy Collaboration et al. (2022) Astropy Collaboration, Price-Whelan, A. M., Lim, P. L., et al. 2022, ApJ, 935, 167, doi: 10.3847/1538-4357/ac7c74
- Auvergne et al. (2009) Auvergne, M., Bodin, P., Boisnard, L., et al. 2009, A&A, 506, 411, doi: 10.1051/0004-6361/200810860
- Avni (1976) Avni, Y. 1976, ApJ, 210, 642, doi: 10.1086/154870
- Baade (1988) Baade, D. 1988, in IAU Symposium, Vol. 132, The Impact of Very High S/N Spectroscopy on Stellar Physics, ed. G. Cayrel de Strobel & M. Spite, 217
- Bastian & de Mink (2009) Bastian, N., & de Mink, S. E. 2009, MNRAS, 398, L11, doi: 10.1111/j.1745-3933.2009.00696.x
- Bastian et al. (2020) Bastian, N., Kamann, S., Amard, L., et al. 2020, MNRAS, 495, 1978, doi: 10.1093/mnras/staa1332
- Bastian et al. (2017) Bastian, N., Cabrera-Ziri, I., Niederhofer, F., et al. 2017, MNRAS, 465, 4795, doi: 10.1093/mnras/stw3042
- Borucki et al. (2010) Borucki, W. J., Koch, D., Basri, G., et al. 2010, Science, 327, 977, doi: 10.1126/science.1185402
- Bu et al. (2024a) Bu, Y., He, C., Fang, M., & Li, C. 2024a, arXiv e-prints, arXiv:2412.00520, doi: 10.48550/arXiv.2412.00520
- Bu et al. (2024b) Bu, Y., He, C., Wang, L., Lin, J., & Li, C. 2024b, ApJ, 968, 22, doi: 10.3847/1538-4357/ad3e6e
- Cardelli et al. (1989) Cardelli, J. A., Clayton, G. C., & Mathis, J. S. 1989, ApJ, 345, 245, doi: 10.1086/167900
- Casamiquela et al. (2022) Casamiquela, L., Gebran, M., Agüeros, M. A., Bouy, H., & Soubiran, C. 2022, AJ, 164, 255, doi: 10.3847/1538-3881/ac9c56
- Cordoni et al. (2018) Cordoni, G., Milone, A. P., Marino, A. F., et al. 2018, ApJ, 869, 139, doi: 10.3847/1538-4357/aaedc1
- Correnti et al. (2017) Correnti, M., Goudfrooij, P., Bellini, A., Kalirai, J. S., & Puzia, T. H. 2017, MNRAS, 467, 3628, doi: 10.1093/mnras/stx010
- Czesla et al. (2019) Czesla, S., Schröter, S., Schneider, C. P., et al. 2019, PyA: Python astronomy-related packages. http://ascl.net/1906.010
- D’Antona et al. (2015) D’Antona, F., Di Criscienzo, M., Decressin, T., et al. 2015, MNRAS, 453, 2637, doi: 10.1093/mnras/stv1794
- D’Antona et al. (2017) D’Antona, F., Milone, A. P., Tailo, M., et al. 2017, Nature Astronomy, 1, 0186, doi: 10.1038/s41550-017-0186
- D’Antona et al. (2023) D’Antona, F., Dell’Agli, F., Tailo, M., et al. 2023, MNRAS, 521, 4462, doi: 10.1093/mnras/stad851
- de Grijs et al. (2013) de Grijs, R., Li, C., Zheng, Y., et al. 2013, ApJ, 765, 4, doi: 10.1088/0004-637X/765/1/4
- Dufton et al. (2013) Dufton, P. L., Langer, N., Dunstall, P. R., et al. 2013, A&A, 550, A109, doi: 10.1051/0004-6361/201220273
- Espinosa Lara & Rieutord (2011) Espinosa Lara, F., & Rieutord, M. 2011, A&A, 533, A43, doi: 10.1051/0004-6361/201117252
- Fuller (2021) Fuller, J. 2021, MNRAS, 501, 483, doi: 10.1093/mnras/staa3636
- Gaia Collaboration et al. (2016) Gaia Collaboration, Prusti, T., de Bruijne, J. H. J., et al. 2016, A&A, 595, A1, doi: 10.1051/0004-6361/201629272
- Gaia Collaboration et al. (2018) Gaia Collaboration, Babusiaux, C., van Leeuwen, F., et al. 2018, A&A, 616, A10, doi: 10.1051/0004-6361/201832843
- Gaia Collaboration et al. (2021) Gaia Collaboration, Brown, A. G. A., Vallenari, A., et al. 2021, A&A, 649, A1, doi: 10.1051/0004-6361/202039657
- Gilmore & Randich (2015) Gilmore, G., & Randich, S. 2015, Gaia-ESO spectroscopic survey, European Southern Observatory, doi: 10.18727/archive/25
- Gilmore et al. (2012) Gilmore, G., Randich, S., Asplund, M., et al. 2012, The Messenger, 147, 25
- Gilmore et al. (2022) Gilmore, G., Randich, S., Worley, C. C., et al. 2022, A&A, 666, A120, doi: 10.1051/0004-6361/202243134
- Goss et al. (2011) Goss, K. J. F., Karoff, C., Chaplin, W. J., Elsworth, Y., & Stevens, I. R. 2011, MNRAS, 411, 162, doi: 10.1111/j.1365-2966.2010.17665.x
- Goudfrooij et al. (2011) Goudfrooij, P., Puzia, T. H., Chandar, R., & Kozhurina-Platais, V. 2011, ApJ, 737, 4, doi: 10.1088/0004-637X/737/1/4
- Goudfrooij et al. (2009) Goudfrooij, P., Puzia, T. H., Kozhurina-Platais, V., & Chandar, R. 2009, AJ, 137, 4988, doi: 10.1088/0004-6256/137/6/4988
- He et al. (2022) He, C., Sun, W., Li, C., et al. 2022, ApJ, 938, 42, doi: 10.3847/1538-4357/ac8b08
- He et al. (2023) He, C., Li, C., Sun, W., et al. 2023, MNRAS, 525, 5880, doi: 10.1093/mnras/stad2674
- Heger & Langer (2000) Heger, A., & Langer, N. 2000, ApJ, 544, 1016, doi: 10.1086/317239
- Heger et al. (2005) Heger, A., Woosley, S. E., & Spruit, H. C. 2005, ApJ, 626, 350, doi: 10.1086/429868
- Huat et al. (2009) Huat, A. L., Hubert, A. M., Baudin, F., et al. 2009, A&A, 506, 95, doi: 10.1051/0004-6361/200911928
- Hubeny & Lanz (1992) Hubeny, I., & Lanz, T. 1992, A&A, 262, 501
- Hunter (2007) Hunter, J. D. 2007, Computing in Science and Engineering, 9, 90, doi: 10.1109/MCSE.2007.55
- Johnston et al. (2019) Johnston, C., Aerts, C., Pedersen, M. G., & Bastian, N. 2019, A&A, 632, A74, doi: 10.1051/0004-6361/201936549
- Kamann et al. (2021) Kamann, S., Bastian, N., Usher, C., Cabrera-Ziri, I., & Saracino, S. 2021, MNRAS, 508, 2302, doi: 10.1093/mnras/stab2643
- Kamann et al. (2020) Kamann, S., Bastian, N., Gossage, S., et al. 2020, MNRAS, 492, 2177, doi: 10.1093/mnras/stz3583
- Kamann et al. (2023) Kamann, S., Saracino, S., Bastian, N., et al. 2023, MNRAS, 518, 1505, doi: 10.1093/mnras/stac3170
- Kraft (1967) Kraft, R. P. 1967, ApJ, 150, 551, doi: 10.1086/149359
- Kurucz (2005) Kurucz, R. L. 2005, Memorie della Societa Astronomica Italiana Supplementi, 8, 14
- Li et al. (2014) Li, C., de Grijs, R., & Deng, L. 2014, Nature, 516, 367, doi: 10.1038/nature13969
- Li et al. (2017) Li, C., de Grijs, R., Deng, L., & Milone, A. P. 2017, ApJ, 844, 119, doi: 10.3847/1538-4357/aa7b36
- Li et al. (2024) Li, C., Milone, A. P., Sun, W., & de Grijs, R. 2024, Fundamental Research, doi: https://doi.org/10.1016/j.fmre.2023.12.007
- Li et al. (2020a) Li, G., Guo, Z., Fuller, J., et al. 2020a, MNRAS, 497, 4363, doi: 10.1093/mnras/staa2266
- Li et al. (2020b) Li, G., Van Reeth, T., Bedding, T. R., et al. 2020b, MNRAS, 491, 3586, doi: 10.1093/mnras/stz2906
- Li et al. (2024) Li, G., Aerts, C., Bedding, T. R., et al. 2024, A&A, 686, A142, doi: 10.1051/0004-6361/202348901
- Mackey et al. (2008) Mackey, A. D., Broby Nielsen, P., Ferguson, A. M. N., & Richardson, J. C. 2008, ApJ, 681, L17, doi: 10.1086/590343
- Maeder & Meynet (2000) Maeder, A., & Meynet, G. 2000, ARA&A, 38, 143, doi: 10.1146/annurev.astro.38.1.143
- Marigo et al. (2017) Marigo, P., Girardi, L., Bressan, A., et al. 2017, ApJ, 835, 77, doi: 10.3847/1538-4357/835/1/77
- Marino et al. (2018a) Marino, A. F., Milone, A. P., Casagrande, L., et al. 2018a, ApJ, 863, L33, doi: 10.3847/2041-8213/aad868
- Marino et al. (2018b) Marino, A. F., Przybilla, N., Milone, A. P., et al. 2018b, AJ, 156, 116, doi: 10.3847/1538-3881/aad3cd
- Milone et al. (2009) Milone, A. P., Bedin, L. R., Piotto, G., & Anderson, J. 2009, A&A, 497, 755, doi: 10.1051/0004-6361/200810870
- Milone et al. (2016) Milone, A. P., Marino, A. F., D’Antona, F., et al. 2016, MNRAS, 458, 4368, doi: 10.1093/mnras/stw608
- Milone et al. (2015) Milone, A. P., Bedin, L. R., Piotto, G., et al. 2015, MNRAS, 450, 3750, doi: 10.1093/mnras/stv829
- Milone et al. (2018) Milone, A. P., Marino, A. F., Di Criscienzo, M., et al. 2018, MNRAS, 477, 2640, doi: 10.1093/mnras/sty661
- Milone et al. (2023a) Milone, A. P., Cordoni, G., Marino, A. F., et al. 2023a, A&A, 672, A161, doi: 10.1051/0004-6361/202244798
- Milone et al. (2023b) —. 2023b, MNRAS, 524, 6149, doi: 10.1093/mnras/stad2242
- Mombarg et al. (2024) Mombarg, J. S. G., Aerts, C., & Molenberghs, G. 2024, A&A, 685, A21, doi: 10.1051/0004-6361/202449213
- Mombarg et al. (2022) Mombarg, J. S. G., Dotter, A., Rieutord, M., et al. 2022, ApJ, 925, 154, doi: 10.3847/1538-4357/ac3dfb
- Muratore et al. (2024) Muratore, F., Milone, A. P., D’Antona, F., et al. 2024, arXiv e-prints, arXiv:2411.02508, doi: 10.48550/arXiv.2411.02508
- Neiner et al. (2020) Neiner, C., Lee, U., Mathis, S., et al. 2020, A&A, 644, A9, doi: 10.1051/0004-6361/201935858
- Nguyen et al. (2022) Nguyen, C. T., Costa, G., Girardi, L., et al. 2022, A&A, 665, A126, doi: 10.1051/0004-6361/202244166
- Observatory (2015) Observatory, E. S. 2015, GIRAFFE/MEDUSA reduced data obtained by standard ESO pipeline processing, European Southern Observatory, doi: 10.18727/archive/27
- Observatory (2020) —. 2020, UVES reduced data obtained by standard ESO pipeline processing, European Southern Observatory, doi: 10.18727/archive/50
- O’Donnell (1994) O’Donnell, J. E. 1994, ApJ, 422, 158, doi: 10.1086/173713
- Palacios et al. (2010) Palacios, A., Gebran, M., Josselin, E., et al. 2010, A&A, 516, A13, doi: 10.1051/0004-6361/200913932
- Pang et al. (2022) Pang, X., Tang, S.-Y., Li, Y., et al. 2022, ApJ, 931, 156, doi: 10.3847/1538-4357/ac674e
- Pápics et al. (2017) Pápics, P. I., Tkachenko, A., Van Reeth, T., et al. 2017, A&A, 598, A74, doi: 10.1051/0004-6361/201629814
- Paxton et al. (2013) Paxton, B., Cantiello, M., Arras, P., et al. 2013, ApJS, 208, 4, doi: 10.1088/0067-0049/208/1/4
- Paxton et al. (2019) Paxton, B., Smolec, R., Schwab, J., et al. 2019, ApJS, 243, 10, doi: 10.3847/1538-4365/ab2241
- Platais et al. (2012) Platais, I., Melo, C., Quinn, S. N., et al. 2012, ApJ, 751, L8, doi: 10.1088/2041-8205/751/1/L8
- Preston (1974) Preston, G. W. 1974, ARA&A, 12, 257, doi: 10.1146/annurev.aa.12.090174.001353
- Qin et al. (2023) Qin, S., Zhong, J., Tang, T., & Chen, L. 2023, ApJS, 265, 12, doi: 10.3847/1538-4365/acadd6
- Ricker et al. (2015) Ricker, G. R., Winn, J. N., Vanderspek, R., et al. 2015, Journal of Astronomical Telescopes, Instruments, and Systems, 1, 014003, doi: 10.1117/1.JATIS.1.1.014003
- Rivinius et al. (2003) Rivinius, T., Baade, D., & Štefl, S. 2003, A&A, 411, 229, doi: 10.1051/0004-6361:20031285
- Rivinius et al. (2013) Rivinius, T., Carciofi, A. C., & Martayan, C. 2013, A&A Rev., 21, 69, doi: 10.1007/s00159-013-0069-0
- Rivinius et al. (2006) Rivinius, T., Štefl, S., & Baade, D. 2006, A&A, 459, 137, doi: 10.1051/0004-6361:20053008
- Salinas et al. (2016) Salinas, R., Pajkos, M. A., Strader, J., Vivas, A. K., & Contreras Ramos, R. 2016, ApJ, 832, L14, doi: 10.3847/2041-8205/832/1/L14
- Slettebak (1986) Slettebak, A. 1986, PASP, 98, 867, doi: 10.1086/131836
- STScI Development Team (2013) STScI Development Team. 2013, pysynphot: Synthetic photometry software package, Astrophysics Source Code Library, record ascl:1303.023. http://ascl.net/1303.023
- Sun et al. (2019a) Sun, W., de Grijs, R., Deng, L., & Albrow, M. D. 2019a, ApJ, 876, 113, doi: 10.3847/1538-4357/ab16e4
- Sun et al. (2021a) —. 2021a, MNRAS, 502, 4350, doi: 10.1093/mnras/stab347
- Sun et al. (2021b) Sun, W., Duan, X.-W., Deng, L., & de Grijs, R. 2021b, ApJ, 921, 145, doi: 10.3847/1538-4357/ac1ad0
- Sun et al. (2019b) Sun, W., Li, C., Deng, L., & de Grijs, R. 2019b, ApJ, 883, 182, doi: 10.3847/1538-4357/ab3cd0
- Tarricq et al. (2021) Tarricq, Y., Soubiran, C., Casamiquela, L., et al. 2021, A&A, 647, A19, doi: 10.1051/0004-6361/202039388
- Taylor (2005) Taylor, M. B. 2005, in Astronomical Society of the Pacific Conference Series, Vol. 347, Astronomical Data Analysis Software and Systems XIV, ed. P. Shopbell, M. Britton, & R. Ebert, 29
- Virtanen et al. (2020) Virtanen, P., Gommers, R., Oliphant, T. E., et al. 2020, Nature Methods, 17, 261, doi: 10.1038/s41592-019-0686-2
- von Zeipel (1924) von Zeipel, H. 1924, MNRAS, 84, 665, doi: 10.1093/mnras/84.9.665
- Wall (1996) Wall, J. V. 1996, Quarterly Journal of the Royal Astronomical Society, 37, 519
- Wang et al. (2022) Wang, C., Langer, N., Schootemeijer, A., et al. 2022, Nature Astronomy, 6, 480, doi: 10.1038/s41550-021-01597-5
- Wang et al. (2023) Wang, L., Li, C., Wang, L., He, C., & Wang, C. 2023, The Astrophysical Journal, 949, 53, doi: 10.3847/1538-4357/accae0
- Yang et al. (2021) Yang, Y., Li, C., de Grijs, R., & Deng, L. 2021, ApJ, 912, 27, doi: 10.3847/1538-4357/abec4b
- Zorec & Royer (2012) Zorec, J., & Royer, F. 2012, A&A, 537, A120, doi: 10.1051/0004-6361/201117691
 |
 |
 |
 |
 |
 |
 |
 |
 |
 |
 |
 |
 |
 |
 |
 |
 |
 |
 |
 |
 |