Multidimensional Territorial Attractiveness: an Application to European Flows
Abstract
In Regional Economics, the attractiveness of regions for capital, migrants, tourists, and other kinds of flows is a relevant topic. Usually, studies in this field have mainly explored single flows, characterizing the dimensions of territorial attractiveness separately, rarely considering the interwoven effect of flows. Here we investigate attractiveness from a multi-dimensional perspective (i.e., dealing with different flows), asking how various types of regional flows collectively shape the attractiveness dynamics of European regions. We analyze eight distinct flow types across NUTS2 regions from 2010 to 2018, employing a multilayer network approach. Notably, the multilayer approach unveils insights that would be missed in single-layer analyses. Community detection reveals complex structures that demonstrate the cohesive power of national borders and the existence of strong cross-border ties in specific regions. Our study contributes to a more nuanced understanding of regional attractiveness, with implications for targeted policy interventions in regional development and European cohesion.
Keywords:
Regional Attractiveness Multilayer Networks.1 Introduction
Territorial attractiveness is a key component in the economic status of a region, facilitating the integration of regional development strategies with the overarching goal of territorial cohesion. This concept is crucial for formulating policies that enhance the socio-economic prosperity of regions. Authors and government bodies have explored this topic with different methods and focusing on different regions. By example, [23, 24] explored the attraction of residents and visitors at the NUTS2 EU regions level, aiming to identify key determinants of regional appeal. Territorial attractiveness is often conceptualized in various ways: it can be seen as perceived, real, or revealed [14]. Perceived attractiveness pertains to how people view and assess a geographical area. Real attractiveness pertains to the factors, such as infrastructure, institutions, services, etc., that enhance a region’s appeal. Revealed attractiveness, the subject of this study, concerns inflows into a geographical area, which reveal the inherent attractiveness of a region. Much literature has focused on single flows, such as tourism [6] and migration [27]. However, there is a growing recognition of the importance of adopting a multidimensional approach to understanding territorial attractiveness. For instance, [15] has significantly contributed to the multidimensional analysis of territorial attractiveness by creating an indicator for Italian regions. Another example is the tool created by the OECD [4] to measure and assess the drivers of regional attractiveness, generating multidimensional profiles to better understand their attractiveness to investors, talent and visitors, and to align their development strategies with evolving global megatrends. Territorial attractiveness can be examined at different spatial scales, ranging from macro-scale (e.g., countries [13]) to micro-geographical (e.g., neighborhoods [17] or cities [21]). Regions, particularly at the NUTS2 scale, provide a good compromise for analysis since they are neither too large to hide local dynamics nor too small to miss broader patterns.
Here we address the following research questions:
-
R1 -
To what extent does a comprehensive analysis of diverse flows reveal patterns of regional attractiveness and importance that differ from those identified through individual flow analyses?
-
R2 -
How do the interconnections and structural patterns formed by multiple types of flows reveal functional relationships and attractiveness dynamics among European regions?
To address these questions, we by employ network science tools [16] to examine origin-destination matrices at the NUTS 2 level that encompass eight flows: tourism, migration, freight transport, foreign direct investment (FDI), Erasmus student exchanges, passenger transport, remittances, and Horizon 2020 collaborations. Network science offers a powerful framework for analyzing complex systems of interconnected entities, making it particularly well-suited for studying the multi-faceted nature of regional attractiveness in Europe. Previous studies have already collected or examined territorial flow data [11, 21]. In some cases, network science has also been employed [20].
Our approach, however, brings several novel contributions to the field. Firstly, we integrate multiple types of flows into a comprehensive multilayer network [5], providing a more holistic view of regional interactions than previous single-flow analyses. In our approach, each layer is a weighted directed network representing a different flow type, allowing us to investigate multi-dimensional aspects of regional attractiveness. Multilayer networks, consisting of multiple interrelated networks interacting with each other, can encompass various domains such as social networks, financial markets, and multimodal transportation systems. The multilayer structure significantly influences the dynamics within them, often leading to unexpected behaviors. For example, diffusion on multilayer transportation networks can significantly speed up with respect to diffusion on single layers [9]. Secondly, we apply advanced network science techniques, such as multilayer PageRank centrality [18] and community detection using Infomap [22], to uncover patterns and structures that traditional economic or econometric methods (e.g., gravity models, regression analysis) may overlook. This is particularly innovative in the context of European regional studies, where such data have typically been analyzed using more conventional approaches [3, 12]. Our application of Infomap for community detection on multilayer networks represents an advanced technique that, to our knowledge, has not been previously applied to this type of data, potentially revealing new insights into regional clustering across multiple dimensions of attractiveness. As a further element of novelty, we make use of null models for validating results, adding a robust statistical foundation to our findings, and enhancing the reliability and interpretability of the observed network structures. This comprehensive network science approach not only provides new insights into regional attractiveness but also contributes to the broader field of network science by demonstrating its applicability and value in regional studies and policy analysis.
Our study of European regional flow networks reveals several important insights. We observe heavy-tailed distributions across all layers, indicating that a few regions dominate connectivity, a common characteristic in complex networks. The multiplex PageRank analysis reveals substantial changes in regional importance with respect to the single layers, emphasizing the advantages of the multilayer approach. Our analysis enabled us to generate a ranking of European regions according to a centrality measure, both for the single-layer and multi-layer cases. Furthermore, rankings are computed over time, thereby revealing the evolution of regional performance over the period 2010-2018. Notably, regions like Bratislava and Leipzig show dramatic increases in ranking that align with their economic growth trajectories. Furthermore, community detection reveals unexpected linkages that transcend traditional national boundaries, suggesting that functional economic ties may not always align with geographic divisions. These findings emphasize the need for a multidimensional perspective in analyzing regional networks, providing valuable insights for policymakers aiming to enhance regional development and cooperation within Europe.
2 Data and Methods
2.1 Data: ESPON Database
ESPON is an EU-funded program providing territorial analyses, data, and maps. The dataset utilized in this study is derived from the IRiE ESPON project [2] and can be downloaded from the ESPON Database Portal [1]. It specifically includes region-to-region (NUTS 2 level, version of 2016) origin-destination (OD) matrices covering various domains such as People Tourism, People Migration, Freight of Goods by transport mode, Capital Foreign Direct Investment (FDI), Knowledge (Erasmus students), People Passengers by transport mode, Capital Remittances, and Knowledge (Horizon 2020). The data encompasses the flows between 297 European regions recorded annually. Different periods are covered for each flow type: i.e., 2010-2014 for Erasmus, 2015-2020 for Horizon 2020, and 2010-2018 for all other categories.
Distinct methodologies were employed by the researchers who collected and processed each type of OD dataset. They gathered and harmonized various data sources at both European and national levels, initially focusing on country-to-country flows. While most of the data was raw, some flows were estimated using specific techniques (for further technical details, refer to the online documentation). These country-level flows were then decomposed to the regional level for more detailed analysis. In Table 14, we present an overview of the data used in this study. It is important to note that the column Methodology describes the procedures employed by the original data collectors, while the column Our Analysis outlines the additional steps we performed for our specific analysis.
2.2 Methods: Single-layer Networks
We represent each flow type as a weighted directed network, where nodes correspond to regions, links represent flows between regions within a given year, and link weights denote the magnitude of these flows. Detailed information on the number of nodes, links, and density for each layer and year can be found in the Supplementary Information (subsection 3.1).
2.2.1 Network Properties
We analyze first-order properties through node strengths. The out-strength () and in-strength () of node are defined as:
| (1) |
where represents the weight of the directed edge from node to node . We examine the complementary cumulative distribution function (CCDF) for in-strength, out-strength, and total strength.
For second-order properties, we focus on the Weighted Average Nearest Neighbors Strength (WANNS), specifically , defined as:
| (2) |
which calculates the weighted mean of the strengths of a node’s neighbors.
2.2.2 Null Models
We compare our results with the CReMA null model [19]. This model reconstructs the network topology and assigns weights to established links by maximizing entropy under given constraints. As long as these constraints are met (on average), all possible configurations are equally likely. A specific instance of this model is the Directed Enhanced Configuration Model [25], which constrains the sequences of in-degrees, out-degrees, in-strengths, and out-strengths. We use the NEMtropy package [26] to solve the model, employing the Newton method for both binary and weighted reconstructions and the dcm-exp model for binary reconstruction to generate an ensemble.
2.3 Methods: Multilayer Networks
To analyze the complex interactions between different types of flows, we construct multilayer networks by integrating all flow layers from each given year. The same nodes are present across all layers with only intra-layer links and no inter-layer links, the resulting structure is thus a multiplex [5]. Fig. 1 provides a pictorial representation of this structure, illustrating the concept with three layers for clarity, although our analysis encompasses all available flow types.
2.3.1 Centrality Measure: PageRank
We compute PageRank for the multiplex using the muxViz R package [8].
2.3.2 Community Detection: Infomap
For community detection in our multiplex network, we employ the Infomap algorithm, which can detect hierarchical community structures within and across layers. Infomap optimizes a quality function related to the random walker’s trajectory, revealing both broad and granular communities. Key parameters include the two level setting for nested module detection and the multilayer relaxation rate for inter-layer movements. We conducted a sensitivity analysis on the relaxation rate to understand its impact on community detection. Detailed information on parameter selection and sensitivity analysis results are provided in section 2 and subsection 3.3 of the Supplementary Information.
3 Results
We focus initially on single layers by analyzing first-order properties, such as the strength distribution, which helps us understand the basic structure of the networks by examining how strongly regions are connected. Studying first-order properties is important because it provides fundamental insights into the connectivity and flow patterns within the network. Next, we move on to second-order properties, such as assortativity, which measures the tendency of nodes to connect to others that are similar or different in some way. By comparing assortativity to a null model, we can discern whether the observed connections are due to underlying structural patterns or are random. This step is essential as it reveals deeper relational dynamics within the networks, better highlighting those topological aspects that are not immediately captured from first-order analysis. Then, we examine the PageRank centrality measure. Centrality measures are vital for identifying the network’s most important or influential nodes. They help us understand the roles different regions play in the network, whether key hubs or peripheral nodes.
In a second time, once we have understood the basic one-dimensional features of the flow networks, we study the flows in a multi-dimensional perspective. To this aim, we study the PageRank centrality measure for the entire multilayer network. This comprehensive approach allows us to capture the complex interactions between different types of flows, providing a wide perspective of regional dynamics and their broader implications. Finally, we apply community detection using the Infomap algorithm to the multilayer network, revealing clusters of regions across multiple types of flows. This methodical progression from single-layer to multilayer analysis, and from basic structural properties to complex community structures, allows us to comprehensively map the multifaceted nature of regional attractiveness and interconnectedness in Europe.
3.1 Single-layer Properties
3.1.1 First Order Properties
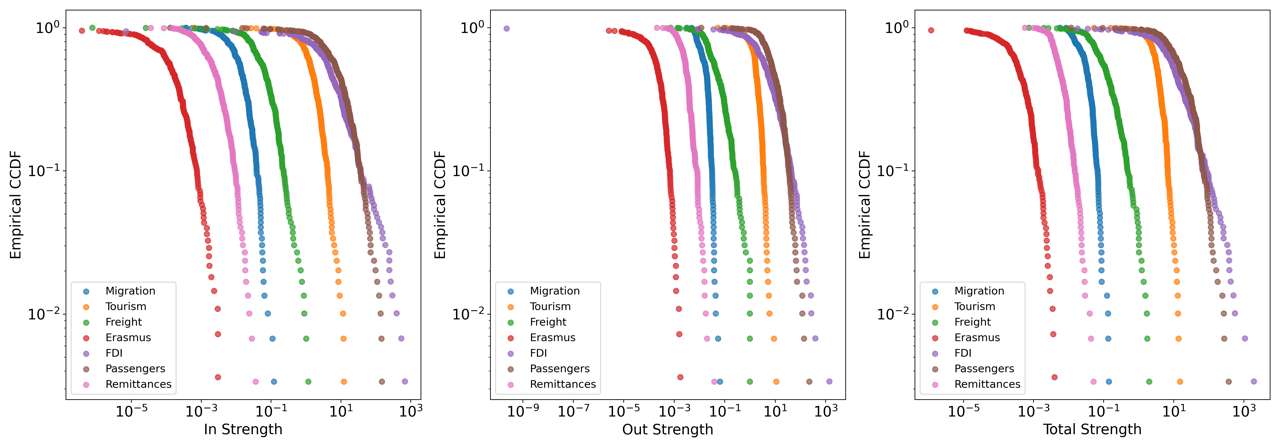
One key feature of real-world networks is the power-law (or generally heavy-tailed) degree distribution. This indicates the presence of a few hubs, i.e., nodes that are very (or strongly, in the weighted case) connected and many nodes that are poorly (or weakly) connected. In Fig. 2, we present the networks’ complementary cumulative distribution function (CCDF) of the strengths for 2010. The heavy-tailed nature is visible, although it cannot be classified as a power-law distribution due to insufficient orders of magnitude of variation. This pattern persists in the 2018 data, as demonstrated in the Supplementary Information, which includes further analyses depicting the relationship between in-strength and out-strength for all flow types in 2010 and 2018.
3.1.2 Second Order Properties
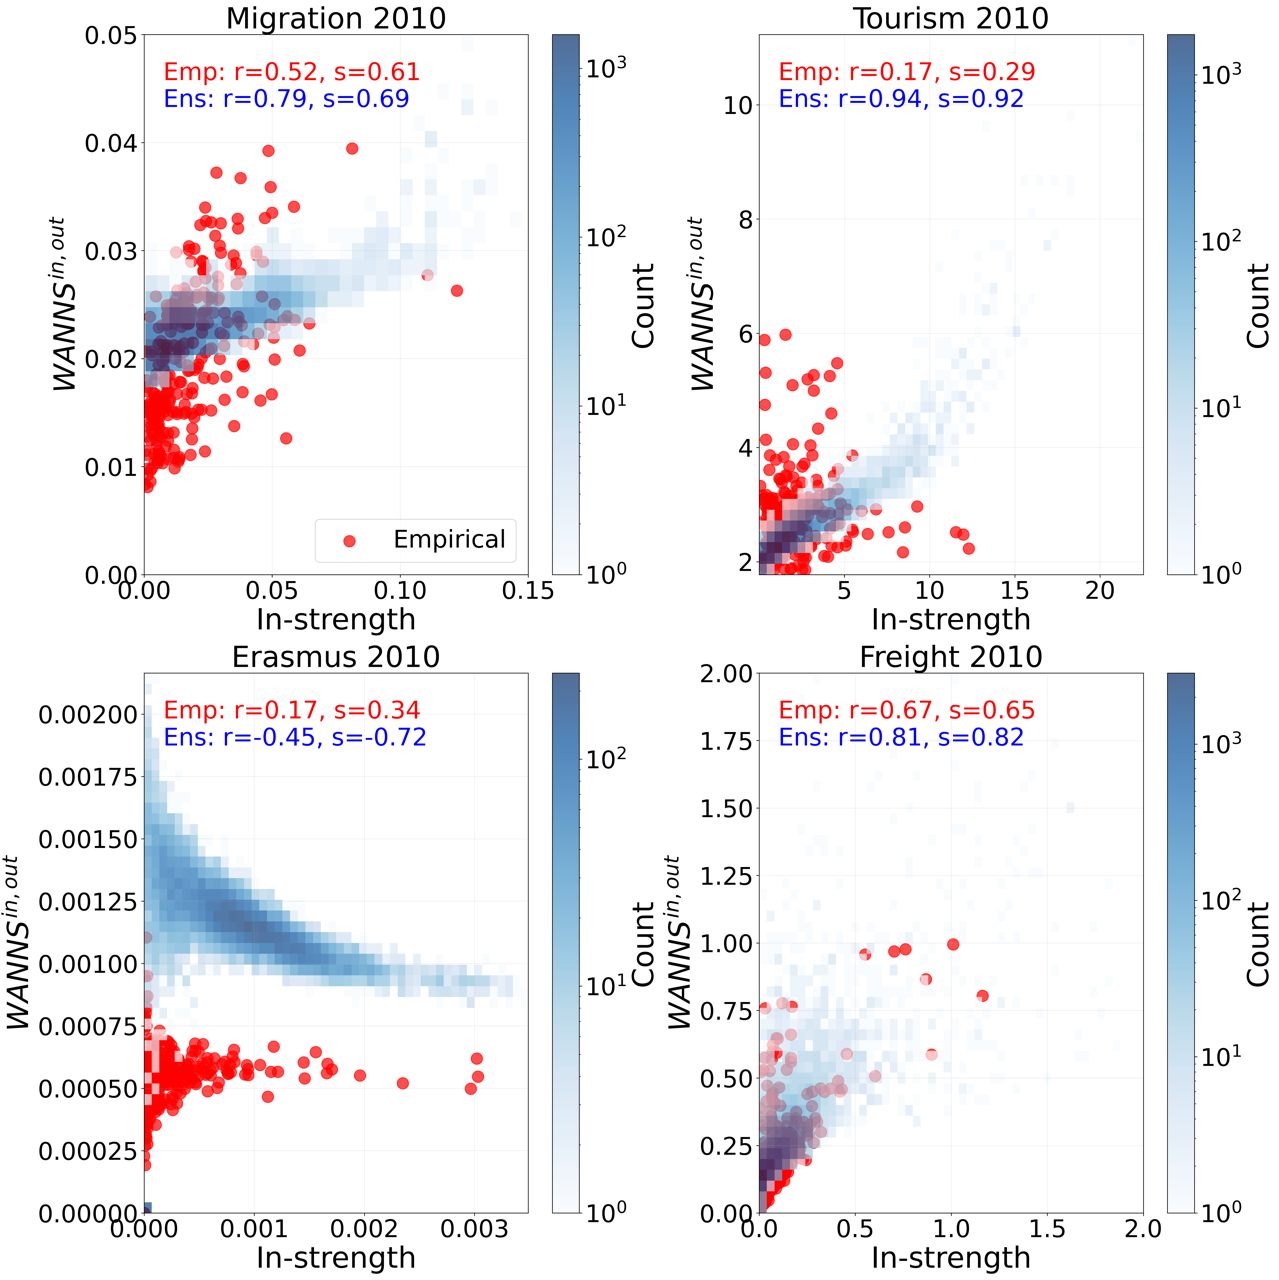
Fig. 3 presents the Weighted Average Nearest Neighbor Strength (WANNS) for the empirical networks alongside 50 realizations drawn from the null model ensembles for Migration, Tourism, Erasmus, and Freight. In the Supplementary Information, we present the remaining three layers. The analysis reveals a predominantly assortative trend across all flow types except for Erasmus student mobility. This assortative behavior indicates a positive correlation between node strengths and their neighbors’ strengths, suggesting that regions with strong connectivity tend to connect with other strongly connected regions. This analysis reveals the presence of a core-periphery structure, whereby the core is comprised of regions that demonstrate a high level of interaction and exchange, while the periphery is constituted by regions with limited engagement in these flows. Comparing the empirical results with the null model predictions, we observe that the null model consistently anticipates a stronger correlation between and in-strength. This pattern holds true for all flow types except passenger transport, where both Pearson and Spearman correlations are lower in the null model, deviating from the trend observed in other flow types. Similarly, for FDI, we note that Spearman’s correlation coefficient of the null model is smaller than the empirical one.
3.2 Centrality Measure: PageRank
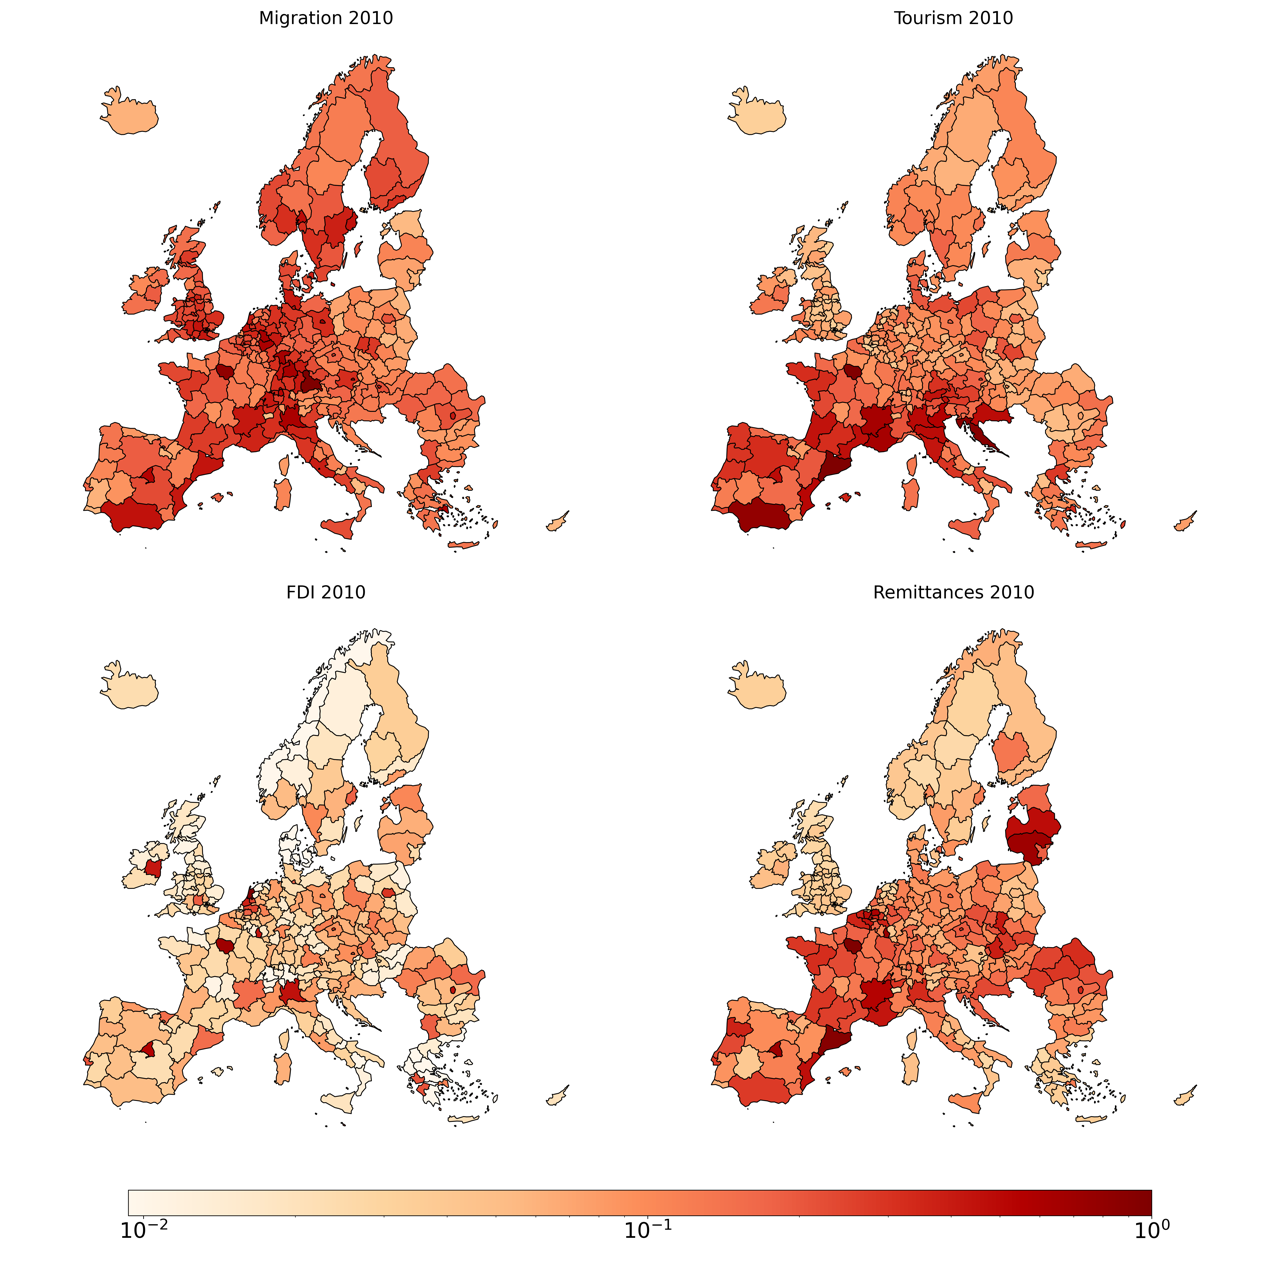
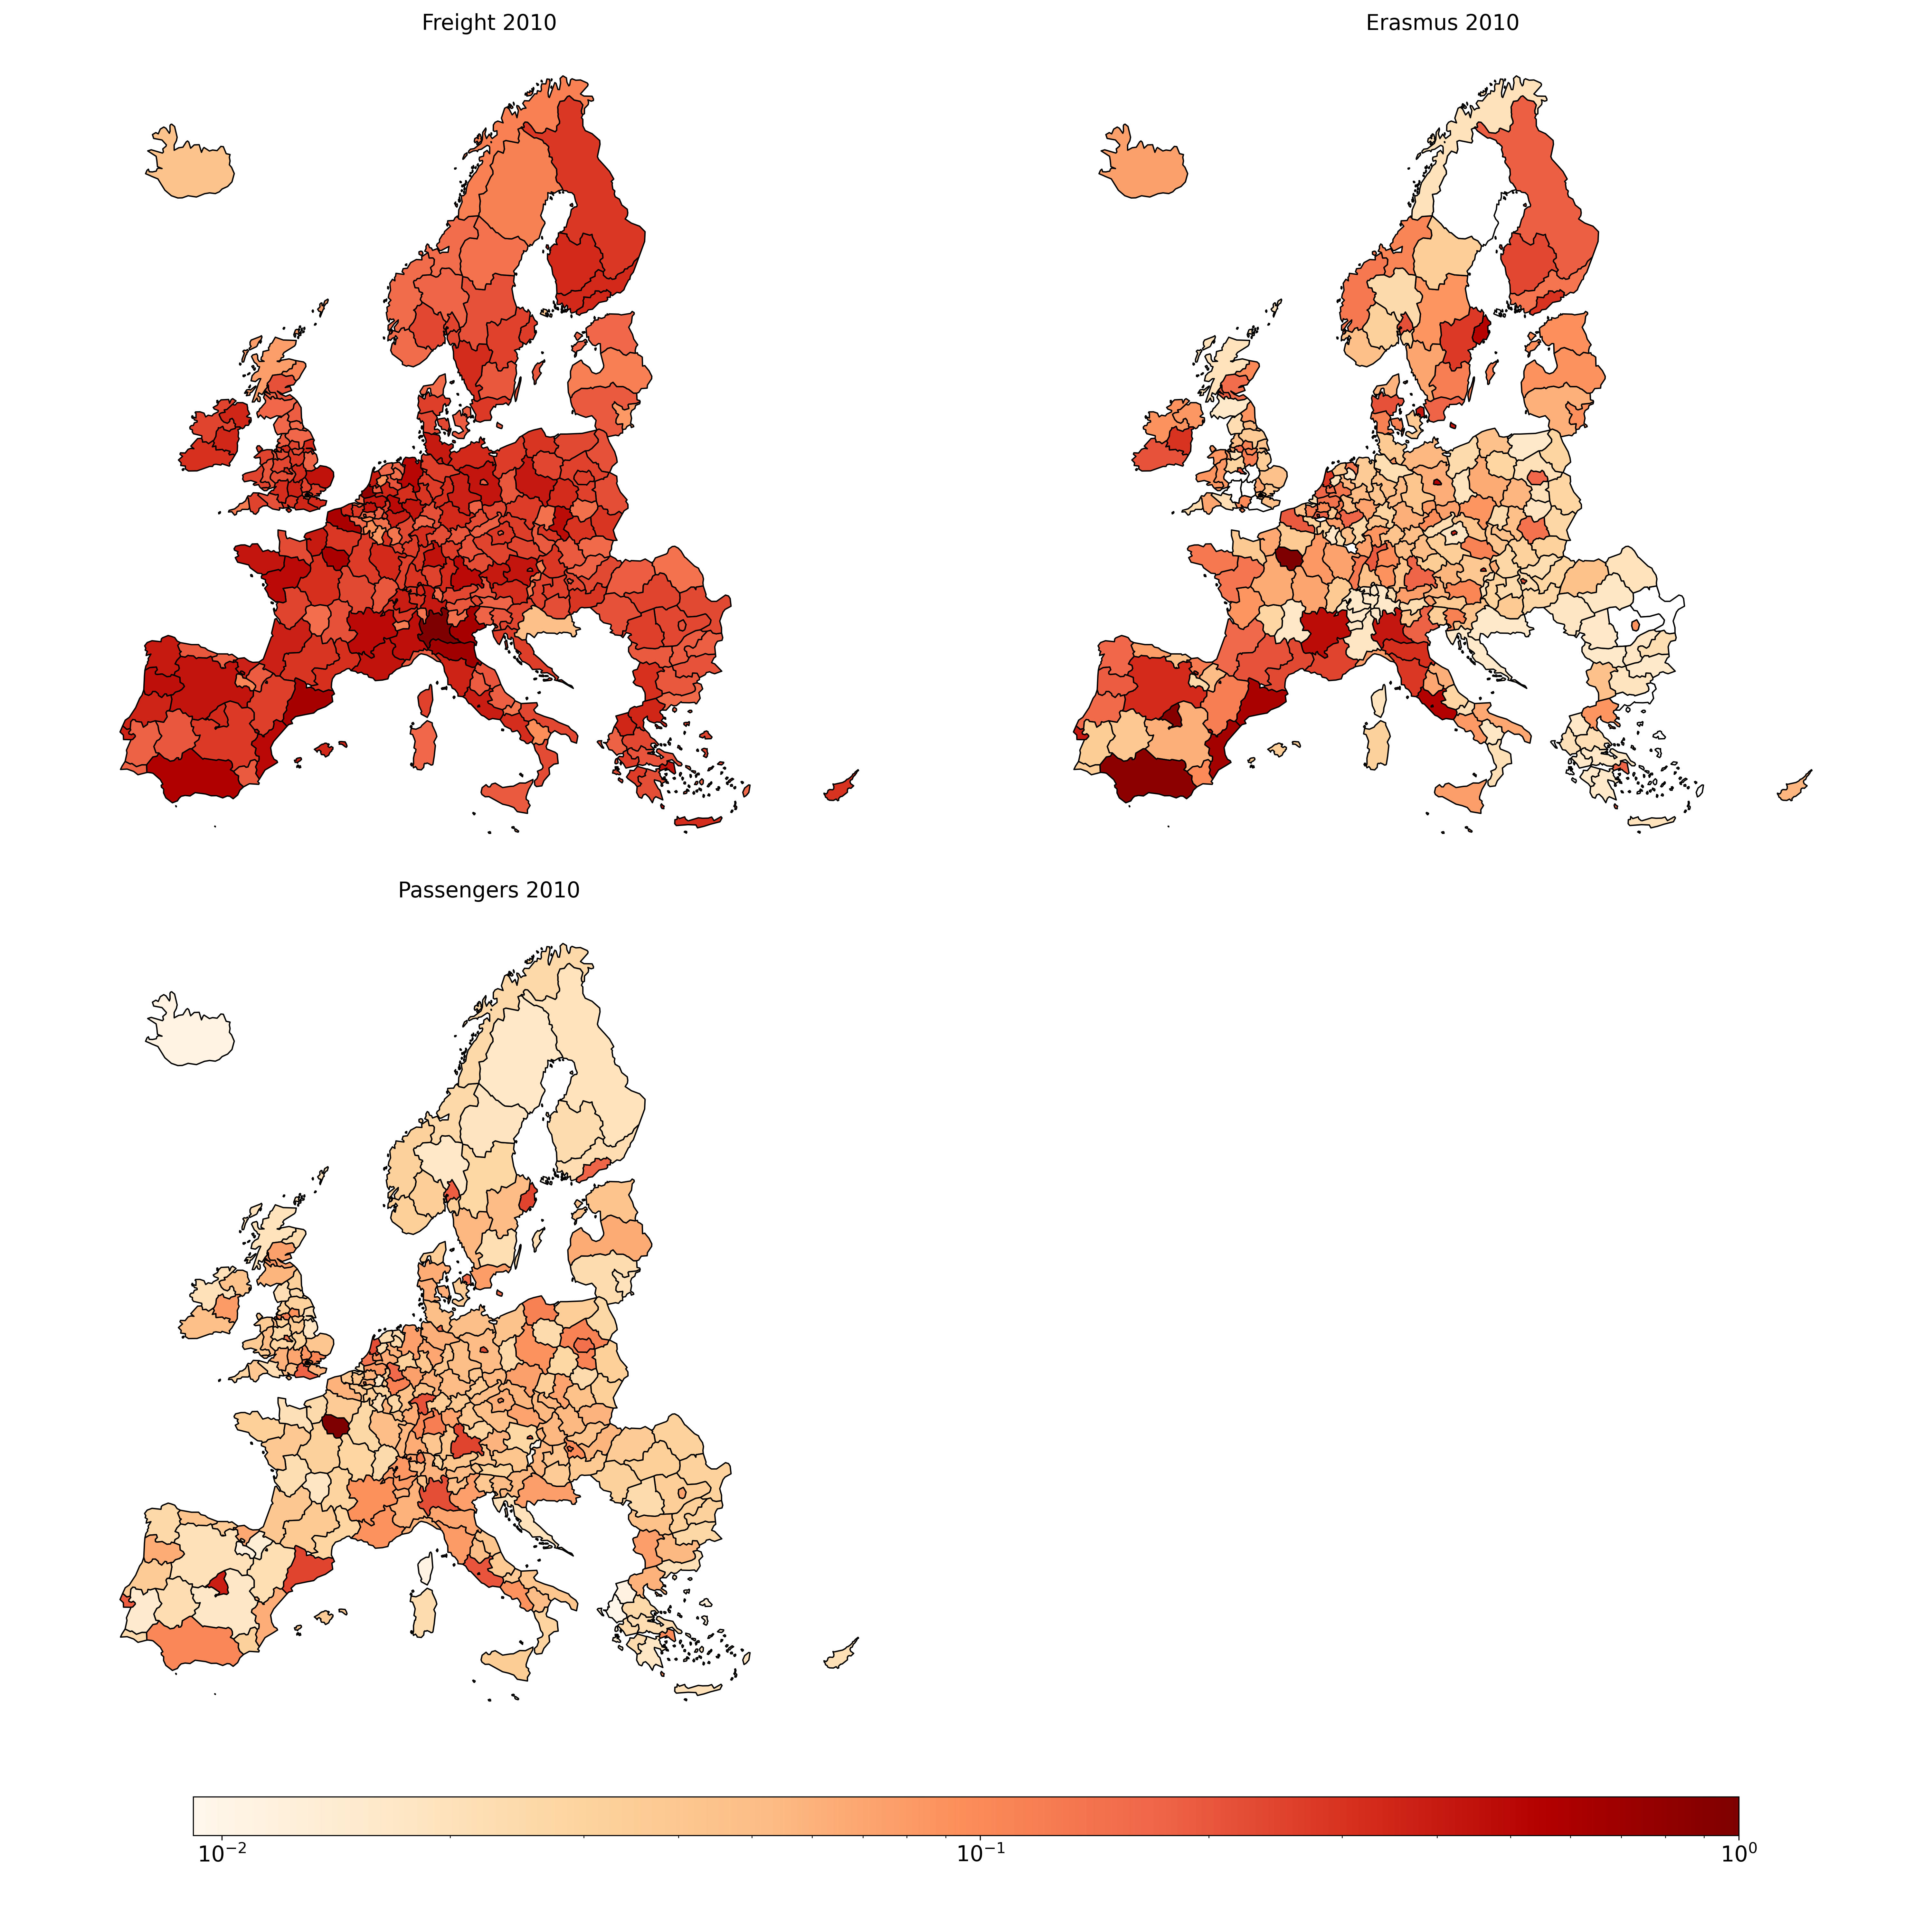
Fig. 4 illustrates the spatial distribution of PageRank centrality values across European regions for Migration, Tourism, FDI, and Remittances in 2010. This visualization provides insights into the relative importance of regions within various flow networks, emphasizing the heterogeneity of regional centrality across different types of flows. In the Supplementary Information, we present the remaining three layers and detailed tables showcasing the top 10 regions ranked by PageRank for all flow types in 2010. Moreover, we include further analyses on the relationship between PageRank and in-strength.
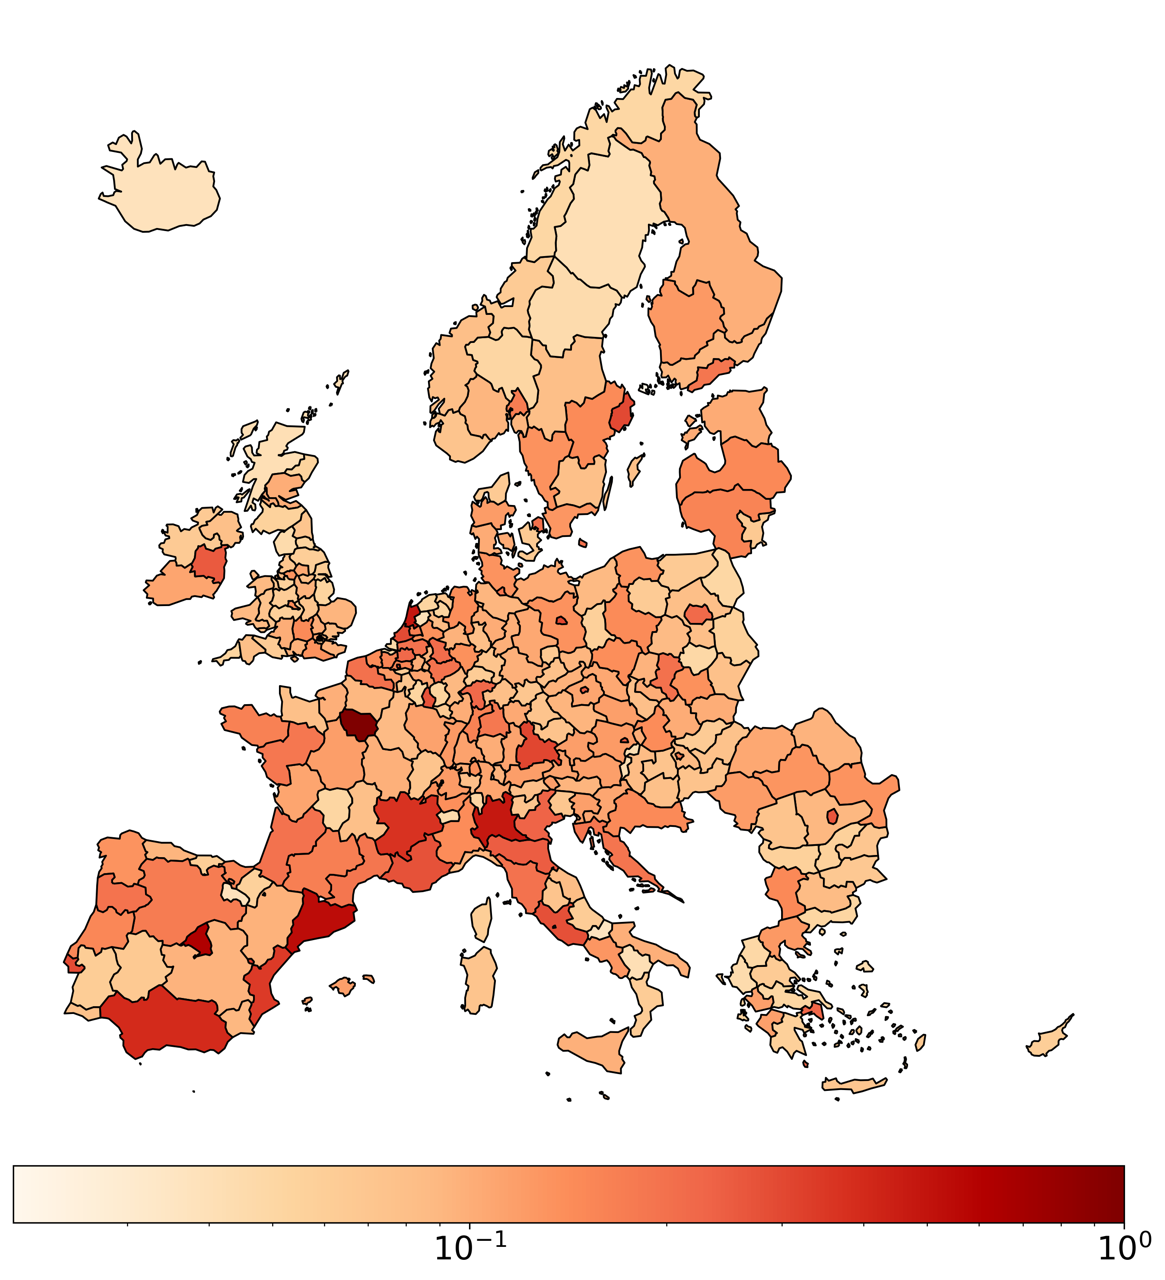
In contrast, Fig. 5 depicts the spatial distribution of multiplex PageRank centrality values for the same year, offering a comprehensive view of regional significance within the interconnected multilayer network structure by integrating information from all flow types.
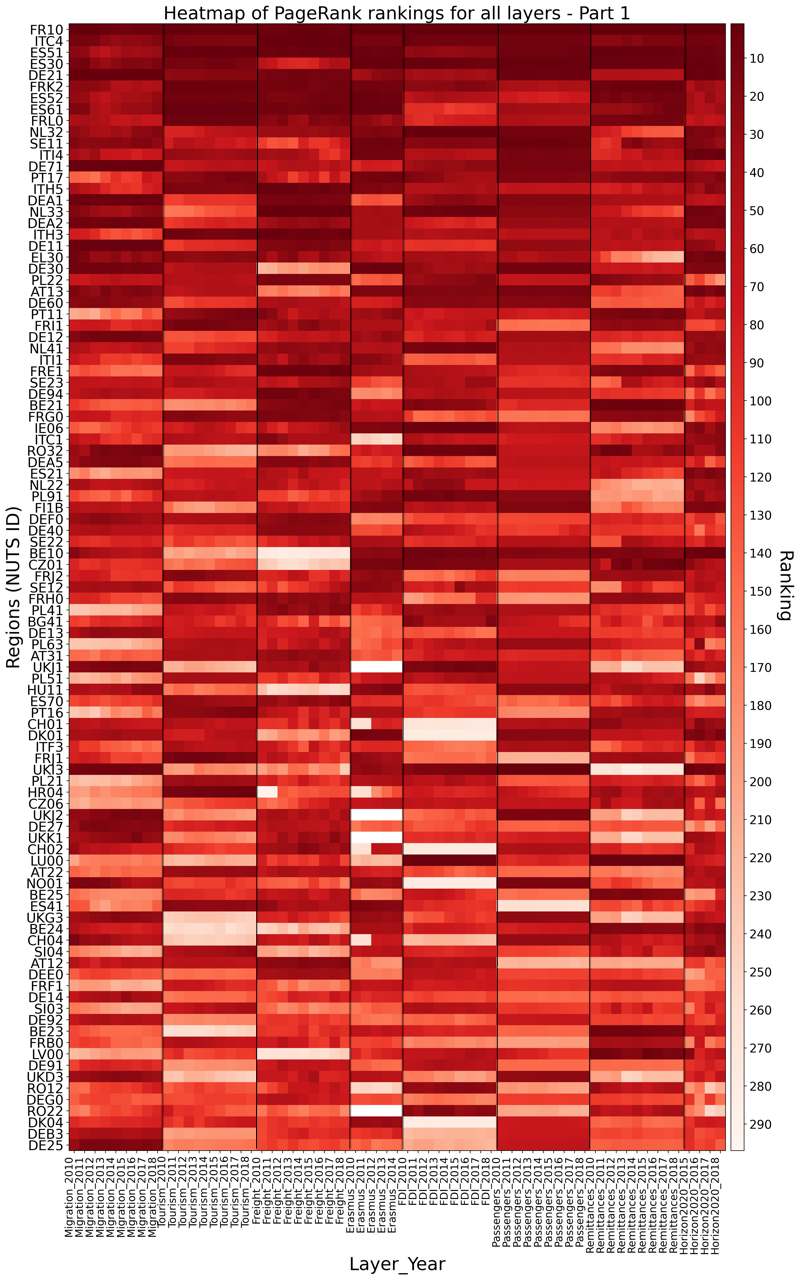
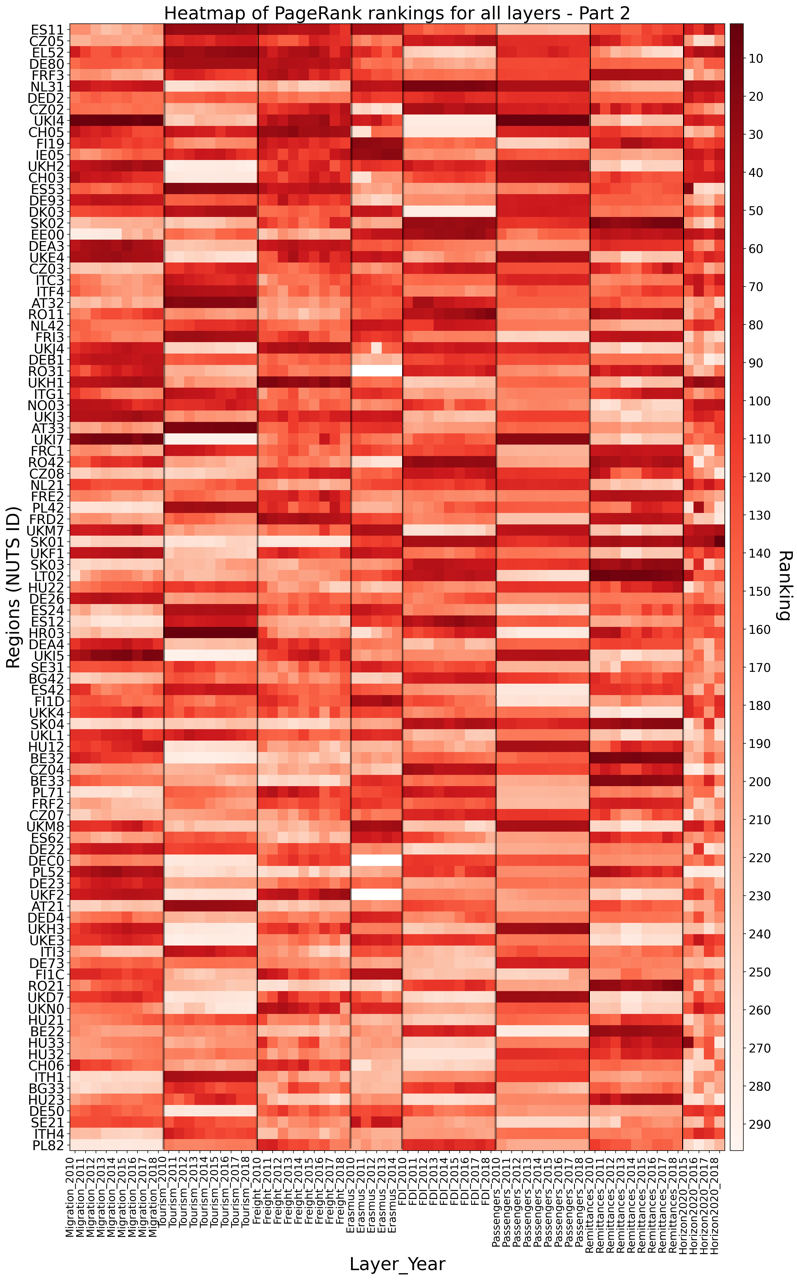
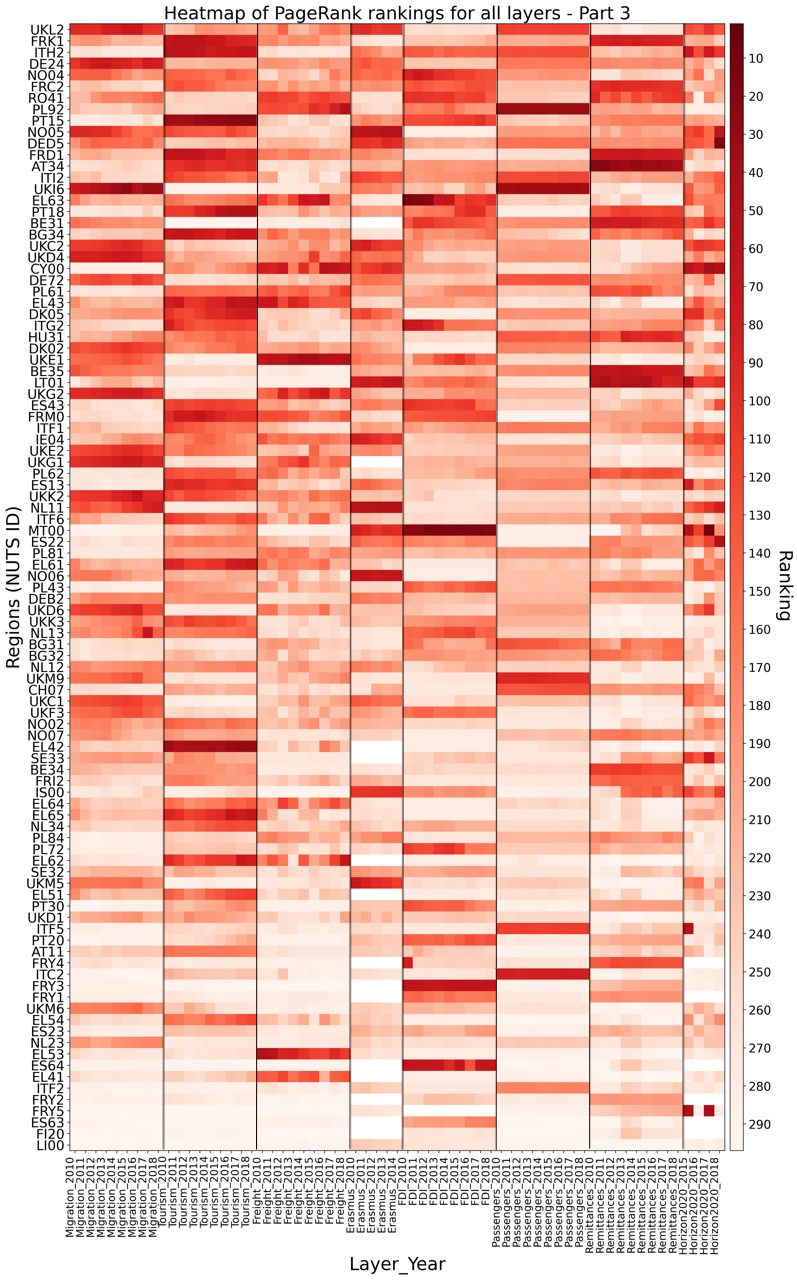
To capture the temporal evolution of PageRank rankings, Fig. 8 to 10 display a heatmap of these rankings for each layer, with regions ordered according to their average position across all layers and years. The figures present a series of heatmaps organized in columns. Each column represents a specific type of flow, while the vertical axis provides the identifying name of the corresponding region. The width of each column is proportional to the number of temporal observations. The ranking’s position is represented by shades of red, with higher saturation indicating a higher ranking position. This comprehensive visualization reveals a general trend of rank stability, particularly among top-ranked regions, which tend to maintain their positions across various flow types and years. However, we observe notable exceptions to this pattern, with certain regions demonstrating high centrality only in specific layers. Middle-ranked regions exhibit greater heterogeneity in their rankings across different flow types and years, indicating more dynamic centrality patterns in this tier.
| Category | Region |
|---|---|
| Highest Average: 1 | Ile-de-France (FR) |
| Highest Average: 2 | Comunidad de Madrid (ES) |
| Highest Average: 3 | Noord-Holland (NL) |
| Highest Average: 4 | Cataluña (ES) |
| Highest Average: 5 | Lombardia (IT) |
| Lowest Average: 1 | Liechtenstein (LI) |
| Lowest Average: 2 | Molise (IT) |
| Lowest Average: 3 | La Rioja (ES) |
| Lowest Average: 4 | Flevoland (NL) |
| Lowest Average: 5 | Voreio Aigaio (EL) |
| Largest Increase: 1 | Bratislavský kraj (SK) |
| Largest Increase: 2 | Leipzig (DE) |
| Largest Increase: 3 | Alentejo (PT) |
| Largest Increase: 4 | Kypros (CY) |
| Largest Increase: 5 | Nord-Vest (RO) |
| Largest Decrease: 1 | Dytiki Ellada (EL) |
| Largest Decrease: 2 | Pohjois- ja Itä-Suomi (FI) |
| Largest Decrease: 3 | West Central Scotland (UK) |
| Largest Decrease: 4 | Northern Ireland (UK) |
| Largest Decrease: 5 | Länsi-Suomi (FI) |
Further analysis of PageRank trends (in the specific instance of the Migration layer) reveals that London maintains a strong upward trajectory in centrality through time, despite a temporary decline in 2016 likely due to the Brexit referendum, highlighting the city’s resilience as a key migration hub (see Supplementary Information for details).
To distill key information from these temporal trends, Tables 3 and 4 present a focused analysis of PageRank ranking dynamics. We highlight regions with the highest and lowest average rankings, as well as those experiencing the most significant increases and decreases in ranking positions across layers. This analysis uncovers that certain regions, such as Ile-de-France, consistently maintain high centrality across multiple flow types, demonstrating their multifaceted importance in European networks. Conversely, other regions, like Lazio, exhibit exceptional centrality in specific domains, suggesting specialized roles within particular flow networks.
Table 1 presents an analysis of the multiplex PageRank ranking across regions. It highlights regions with the highest and lowest average rankings, as well as those experiencing the most substantial positive and negative shifts in their ranking positions. The analysis reveals that Ile-de-France, Comunidad de Madrid, Noord-Holland, Cataluña, and Lombardia consistently maintain the highest average rankings in the multiplex network. This suggests these regions play central roles across multiple types of flows within the European network. Conversely, we observe significant upward mobility in the rankings for regions such as Bratislava and Leipzig. These regions demonstrate the most substantial improvements in their multiplex PageRank positions, indicating an increase in their overall importance within the interconnected flow networks over time.
3.2.1 Single-layer VS Multiplex
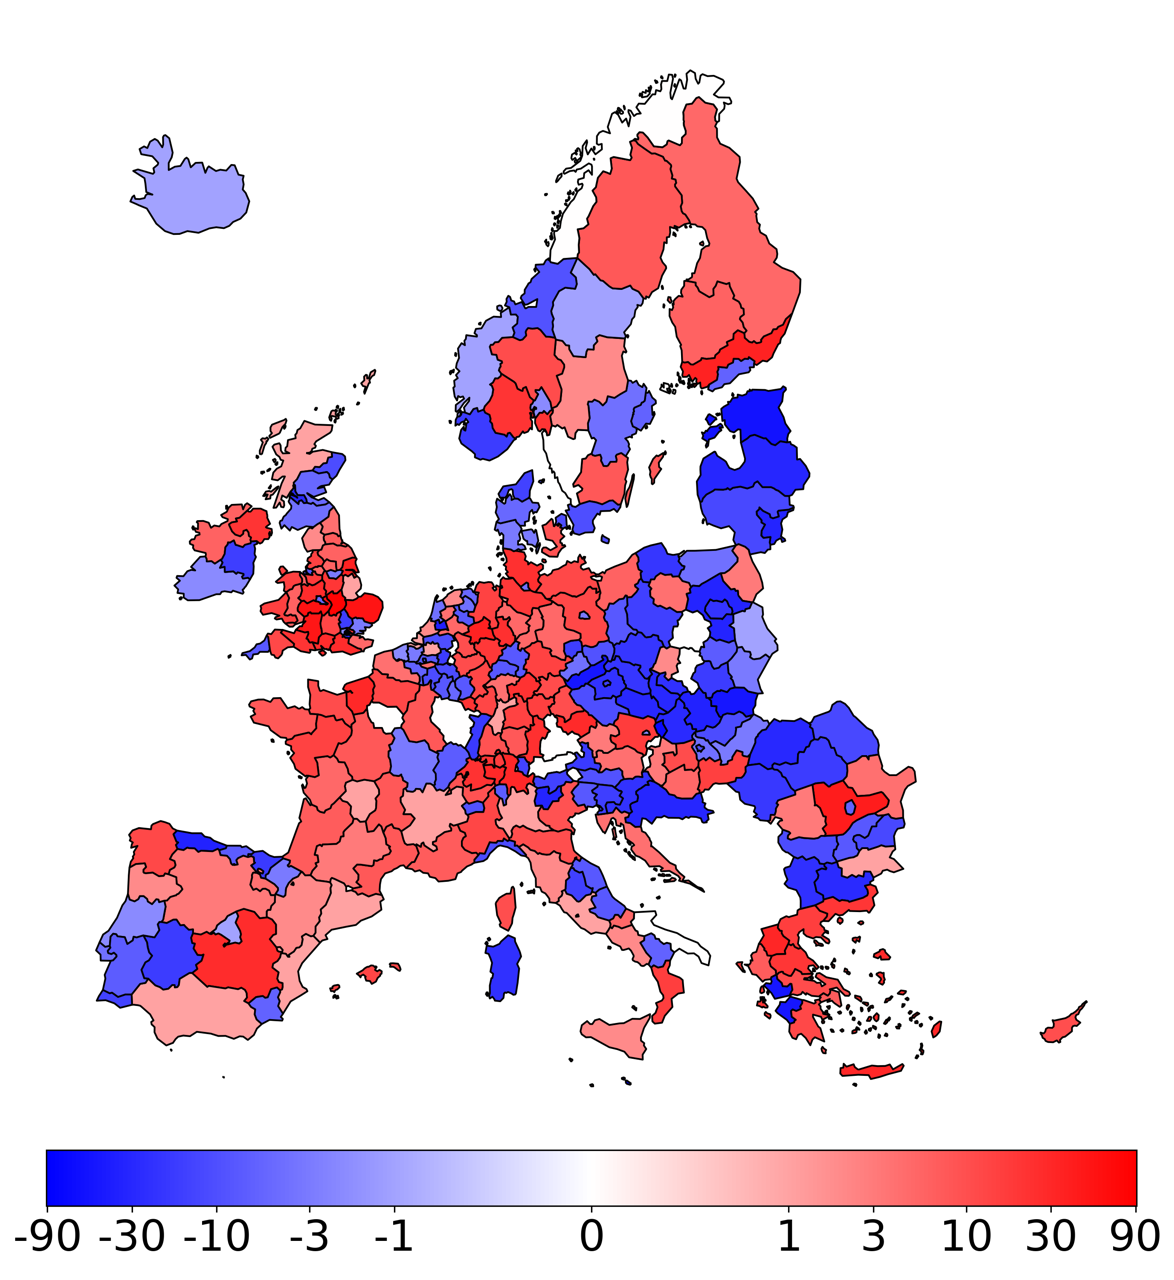
Fig. 6 illustrates the changes in node ranking when comparing the multilayer PageRank to the average of single-layer PageRanks. A comprehensive explanation is provided below. The single-layer PageRank rankings were averaged to obtain a composite ranking, representing each node’s average importance across all layers. The positions of nodes in the multilayer PageRank ranking were compared to their positions in the average single-layer PageRank ranking. The difference in ranking positions was calculated for each node. Nodes exhibiting an increase in ranking are indicated by positive values (red). This denotes an increase in the node’s ranking in the multilayer PageRank relative to the average single-layer PageRank. That is, the node is more important in the multilayer analysis. Negative values (blue) indicate a reduction in the node’s ranking within the multilayer PageRank relative to the average single-layer PageRank. This suggests that the node is of less importance in the multilayer analysis.
This visualization reveals substantial variations, underscoring the importance of considering multiplex centrality measures to obtain comprehensive information not discernible from individual layer analyses and revealing a heterogeneous pattern of ranking shifts. Notably, within individual countries, we observe both positive and negative shifts in regional rankings. The most consistent shift is observed for Malta, with a remarkable change of 91 positions, underscoring the potential for significant discrepancies between single-layer and multiplex centrality measures.
Analysis of correlations between single-layer and multiplex PageRank values (see Supplementary Information) reveals moderate positive relationships, suggesting that while individual layers contribute to overall centrality, the multiplex approach captures additional structural information not fully represented in any single layer.
3.3 Community Detection: Infomap
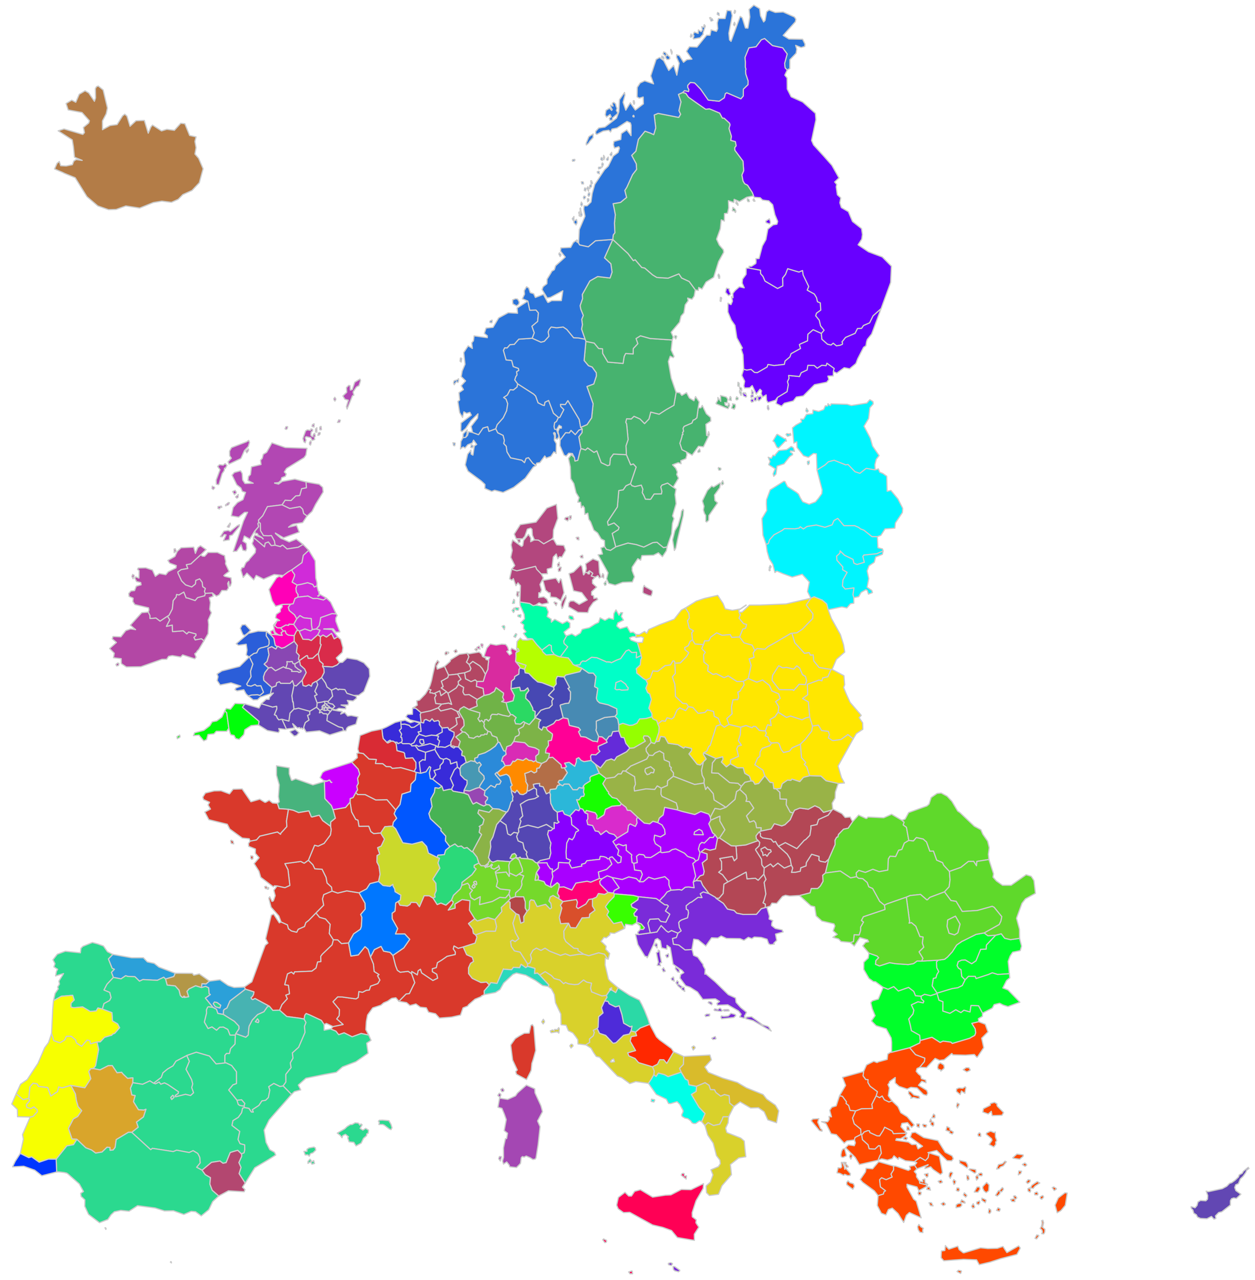
The application of the Infomap algorithm to our multiplex network revealed a complex community structure across European regions (Fig. 7). A total of 82 communities were identified, which appears to be a reasonable number given that the total number of regions and countries involved is approximately 300 and 30, respectively. This equates to an average of approximately two and a half communities per country. These communities exhibit a mix of national cohesion and cross-border associations. Notable cases that emerged are the following:
-
•
Belgium forms a community with Luxembourg and a neighboring Dutch region, suggesting strong economic and social ties in this cross-border area.
-
•
The Czech Republic and Slovakia form a single community, reflecting their historical and ongoing close relations.
-
•
A community comprises many English regions and Cyprus, indicating strong connections despite geographical distance.
-
•
Several countries form predominantly self-contained communities, including Romania, Austria, Poland, Greece, Portugal, Hungary, Denmark, the Netherlands, Norway, Bulgaria, Finland, Malta, and Iceland. This suggests these nations have stronger internal than external flows across the analyzed dimensions.
-
•
Spain, France, and Italy each display a core community of multiple regions, with additional smaller communities, indicating complex internal structures.
-
•
Cross-border communities are observed between Åland (Finland) and Sweden, and between Liechtenstein and Switzerland, highlighting strong regional ties that transcend national borders.
-
•
The Baltic states (Lithuania, Estonia, and Latvia) form a cohesive community, reflecting their geographical proximity and shared historical background.
-
•
Germany and the United Kingdom exhibit highly fragmented community structures, suggesting complex and diverse flow patterns within these countries.
-
•
Slovenia, Croatia, and Malta form an unexpected community, potentially indicating strong economic or social ties among these Mediterranean and Adriatic regions.
-
•
Northern Ireland and Ireland constitute a single community, aligning with their geographical proximity and historical connections.
Having 82 communities poses a set of challenges for their representation on a colored map. For a better and detailed information, we reported in Table (10) of the Supplementary Information the full listing of the communities.
4 Discussion
Our analysis of the European regional flow networks reveals complex patterns of connectivity and centrality across multiple dimensions. The first-order properties, particularly the Complementary Cumulative Distribution Function (CCDF), demonstrate heavy-tailed distributions across all layers, indicative of a network structure where a small number of regions dominate in terms of connectivity while the majority exhibit sparse connections. This pattern, common in real-world networks, underscores the heterogeneous nature of regional interactions within Europe. The Weighted Average Nearest Neighbors Strength (WANNS) analysis provides further insights into the network’s structure. The observed tendency for regions with high to receive flows from regions with high out-strength suggests the presence of a densely interconnected core. However, the lower-than-expected correlation compared to the null model indicates that while a core-periphery structure may exist, it is not as pronounced as one might anticipate. This nuanced finding highlights the complex interplay between regional strengths and their neighbors’ characteristics, revealing patterns of connectivity that go beyond simple random interactions.
A key finding of our study is the significant difference between single-layer and multiplex centrality analyses. While single-layer analysis remains crucial for understanding specific types of interactions, the multiplex approach provides a more comprehensive view of regional importance. The single-layer PageRank results demonstrate that some regions maintain consistent centrality across various flow networks, while others display specialized importance within specific domains. For instance, German regions show a particularly strong attractive power in migration flows. The multiplex analysis reveals how regional importance shifts when considering the entire network structure. Interestingly, regions in Eastern Europe demonstrate the largest absolute values in ranking changes. This finding may reflect the economic transformation and integration of Eastern European countries into the EU market. The observed changes in rankings between single-layer and multiplex PageRank underscore the added value of the multiplex centrality measure. These shifts emphasize the necessity of a holistic approach when evaluating regional centrality in multi-dimensional flow systems, as the multiplex perspective uncovers insights that would be overlooked if only examining individual layers.
Notably, Bratislava and Leipzig demonstrate the most significant increases in multiplex ranking from 2010 to 2018. This finding aligns with their documented economic trajectories during this period. Bratislava, despite a relatively stagnant population, experienced remarkable economic growth [10]. Its GDP per capita at purchasing power parity surpassed that of Vienna, placing it among Europe’s top 10 leading regions. This economic surge was primarily driven by substantial foreign direct investment, particularly in the automotive sector, leading to full employment in the region. Similarly, Leipzig emerged as Germany’s fastest-growing city in the 2010s [7]. Its remarkable growth can be attributed to massive public investments, subsidies, and support programs across various policy fields and sectors. These public initiatives were instrumental in mobilizing significant private capital investments across all urban sectors, fueling the city’s rapid development. These case studies of Bratislava and Leipzig illustrate how the multiplex analysis captures complex regional dynamics that might be missed in single-layer examinations. The multiplex approach effectively reflects the multifaceted nature of regional development, encompassing factors such as foreign investment, economic growth, and policy interventions, which collectively influence a region’s centrality within the European network of flows.
Our community detection analysis further supports the complexity of inter-regional connections. The identified community structures often transcend national boundaries, revealing both expected connections based on geographical or historical ties and unexpected linkages. The community structure revealed by the Infomap algorithm presents a mix of expected and unexpected patterns. The formation of communities along national lines for countries like Romania, Austria, Poland, and others is not surprising, as it aligns with the expectation of stronger internal connections within nations. Similarly, the close ties between historically connected regions, such as the Czech Republic and Slovakia, or Ireland and Northern Ireland, are unsurprising. However, several findings are more unexpected. For instance, the community linking English regions with Cyprus is particularly interesting, reflecting strong commercial and financial ties. Another surprising finding is the community comprising Slovenia, Croatia, and Malta is unexpected, as while they share a Mediterranean connection, their economic and social ties are not typically considered strong. This finding underscores the intricate nature of European regional interactions and suggests that traditional geographic or political boundaries may not always align with functional economic and social networks.
In conclusion, our analysis reveals a complex interplay of expected and novel insights into European regional networks. While we observe anticipated patterns such as heavy-tailed distributions and some community formations along national lines, our multiplex approach unveils significant shifts in regional importance that might be overlooked in single-layer examinations. The cases of Bratislava and Leipzig exemplify how multiplex ranking can align with documented economic trajectories, offering a more comprehensive view of regional dynamics. The community detection analysis reveals both expected and unexpected regional connections, highlighting the complexity of European interactions. Our multiplex approach uncovers non-obvious patterns of regional attractiveness and interconnectedness, demonstrating that functional networks often transcend traditional boundaries. This holistic perspective offers valuable insights for policymakers and researchers working on regional development and cooperation in Europe. Future research could further explore the temporal dynamics of these multiplex networks and investigate how external shocks or policy interventions might influence the observed patterns of regional connectivity and centrality.
4.0.1 Acknowledgements
AF is supported by the European Union – Horizon 2020 Program under the scheme “INFRAIA-01-2018-2019 – Integrating Activities for Advanced Communities”, Grant Agreement n.871042, “SoBigData++: European Integrated Infrastructure for Social Mining and Big Data Analytics”. We thank the IMT Lucca Networks research unit, Leonardo Ialongo, Simone Daniotti, Davide Fiaschi, Angela Parenti, and Cristiano Ricci for providing insightful discussions.
4.0.2 \discintname
The authors have no competing interests to declare that are relevant to the content of this article.
Flow Type Description Sources Methodology Our Analysis Migration Number of people migrating between NUTS 2 regions EUROSTAT and NSI Multi-step process: Base Data, Stock Gain estimation, In-Out-Cross estimation. Country-to-country matrices created, gaps filled using stock-gain method and linear models. Region-to-region flows estimated by decomposing country-level data Applied floor function to ensure whole numbers. Divided by origin region population (see SI) Tourism Number of tourists traveling between NUTS 2 regions EUROSTAT and UNWTO for country-to-country; EUROSTAT for regional domestic arrivals Completed gaps in country-to-country and disaggregated country-to-country to region-to-region. Methods include cross-referencing UNWTO indexes, interpolation/extrapolation, and gravity model analysis using GDP, arrivals, and distance data Applied floor function. Divided by origin region population FDI Shareholders’ funds (thousand euros) in foreign-owned companies AMADEUS database (Bureau van Dijk) Aggregated firm-level data. Included intraregional and interregional intra-national flows Summed FDI across all sectors. Divided by origin region GDP (see SI) Remittances Regionalized bilateral remittance estimates (thousand euros) EUROSTAT and World Bank Estimated regional-level flows by regionalizing national-level data using ratio of regional to national migration flows Divided by origin region GDP Freight Transport Total freight flow between NUTS-2 regions (thousand tons) Various, for road, rail, maritime, and air transport Performed consistency and plausibility checks. Developed disaggregation procedures where regionalized data unavailable Divided by total outgoing flows from each region, multiplied by region’s relative economic importance Erasmus Student Mobility Higher education student mobility between partner countries European Commission datasets Geocoded individual movements to NUTS-2 regions based on sending and receiving institutions Divided by origin region population Horizon 2020 Partnerships Number of H2020 partnerships between NUTS-2 regions CORDIS project and participant organization lists Geocoded organizations to NUTS-2 regions. Counted partnerships with coordinating partners as senders and other partners as receivers. No additional processing Passenger Transport Passenger flows between NUTS-2 regions for air, maritime, and rail transport Various Eurostat datasets Implemented appropriate disaggregation procedures where regionalized data unavailable Summed air, maritime, and rail (×1000) passenger flows. Divided by origin region population
| Category | Erasmus | FDI | Freight | Horizon2020 |
|---|---|---|---|---|
| Highest Average: 1 | Comunidad de Madrid (ES) | Noord-Holland (NL) | Lombardia (IT) | Ile-de-France (FR) |
| Highest Average: 2 | Ile-de-France (FR) | Ile-de-France (FR) | Zuid-Holland (NL) | Comunidad de Madrid (ES) |
| Highest Average: 3 | Andalucía (ES) | Luxembourg (LU) | Cataluña (ES) | Oberbayern (DE) |
| Highest Average: 4 | Cataluña (ES) | Eastern and Midland (IE) | Ile-de-France (FR) | Région de Bruxelles (BE) |
| Highest Average: 5 | Berlin (DE) | Comunidad de Madrid (ES) | Nord-Pas de Calais (FR) | Lazio (IT) |
| Lowest Average: 1 | Sterea Ellada (EL) | Hovedstaden (DK) | Liechtenstein (LI) | Liechtenstein (LI) |
| Lowest Average: 2 | Yugoiztochen (BG) | Thessalia (EL) | Ísland (IS) | Valle d’Aosta (IT) |
| Lowest Average: 3 | Dytiki Makedonia (EL) | Espace Mittelland (CH) | Malta (MT) | Warmińsko-mazurskie (PL) |
| Lowest Average: 4 | Valle d’Aosta (IT) | Ticino (CH) | Sostinės regionas (LT) | Cumbria (UK) |
| Lowest Average: 5 | Warmińsko-mazurskie (PL) | Molise (IT) | Highlands and Islands (UK) | Opolskie (PL) |
| Largest Increase: 1 | Kontinentalna Hrvatska (HR) | Bretagne (FR) | Kontinentalna Hrvatska (HR) | Extremadura (ES) |
| Largest Increase: 2 | Jadranska Hrvatska (HR) | East Yorkshire (UK) | Ionia Nisia (EL) | Leipzig (DE) |
| Largest Increase: 3 | Wielkopolskie (PL) | Zachodniopomorskie (PL) | Střední Morava (CZ) | Zentralschweiz (CH) |
| Largest Increase: 4 | Podlaskie (PL) | Midi-Pyrénées (FR) | Jihovýchod (CZ) | Prov. West-Vlaanderen (BE) |
| Largest Increase: 5 | Pomorskie (PL) | Yugoiztochen (BG) | Östra Mellansverige (SE) | Nord-Vest (RO) |
| Largest Decrease: 1 | Nordjylland (DK) | Región de Murcia (ES) | N Ireland (UK) | Dél-Alföld (HU) |
| Largest Decrease: 2 | Inner London E (UK) | Sardegna (IT) | Nyugat-Dunántúl (HU) | Basilicata (IT) |
| Largest Decrease: 3 | Trentino (IT) | Dytiki Ellada (EL) | Peloponnisos (EL) | Moravskoslezsko (CZ) |
| Largest Decrease: 4 | Sjælland (DK) | Lancashire (UK) | Dél-Alföld (HU) | Malta (MT) |
| Largest Decrease: 5 | Liguria (IT) | Brandenburg (DE) | Etelä-Suomi (FI) | Jihovýchod (CZ) |
| Category | Migration | Passengers | Remittances | Tourism |
|---|---|---|---|---|
| Highest Average: 1 | Oberbayern (DE) | Ile-de-France (FR) | Ile-de-France (FR) | Jadranska Hrvatska (HR) |
| Highest Average: 2 | Stuttgart (DE) | Inner London W (UK) | Cataluña (ES) | Cataluña (ES) |
| Highest Average: 3 | Inner London E (UK) | Comunidad de Madrid (ES) | Luxembourg (LU) | Ile-de-France (FR) |
| Highest Average: 4 | Darmstadt (DE) | Inner London E (UK) | Comunidad de Madrid (ES) | Andalucía (ES) |
| Highest Average: 5 | Ile-de-France (FR) | Oberbayern (DE) | Rhône-Alpes (FR) | Rhône-Alpes (FR) |
| Lowest Average: 1 | Liechtenstein (LI) | Liechtenstein (LI) | Liechtenstein (LI) | Liechtenstein (LI) |
| Lowest Average: 2 | Valle d’Aosta (IT) | Ipeiros (EL) | Voreio Aigaio (EL) | Prov. Brabant Wallon (BE) |
| Lowest Average: 3 | Molise (IT) | Burgenland (AT) | Ionia Nisia (EL) | Outer London W-NW (UK) |
| Lowest Average: 4 | Malta (MT) | Corse (FR) | Highlands and Islands (UK) | Molise (IT) |
| Lowest Average: 5 | Basilicata (IT) | Dytiki Makedonia (EL) | NE Scotland (UK) | Outer London E-NE (UK) |
| Largest Increase: 1 | Vidurio ir vakarų Lietuvos (LT) | Etelä-Suomi (FI) | Ísland (IS) | Alentejo (PT) |
| Largest Increase: 2 | Sud-Vest Oltenia (RO) | Brandenburg (DE) | Nyugat-Dunántúl (HU) | Zuid-Holland (NL) |
| Largest Increase: 3 | Nord-Vest (RO) | Notio Aigaio (EL) | Pest (HU) | Jihovýchod (CZ) |
| Largest Increase: 4 | Sud-Est (RO) | Leicestershire (UK) | Västsverige (SE) | Overijssel (NL) |
| Largest Increase: 5 | Centru (RO) | Prov. Hainaut (BE) | Östra Mellansverige (SE) | Ísland (IS) |
| Largest Decrease: 1 | Zentralschweiz (CH) | Yugozapaden (BG) | Attiki (EL) | Sud-Est (RO) |
| Largest Decrease: 2 | Sicilia (IT) | Kontinentalna Hrvatska (HR) | Kentriki Makedonia (EL) | Lubuskie (PL) |
| Largest Decrease: 3 | Campania (IT) | Yugoiztochen (BG) | Zuid-Holland (NL) | Dorset and Somerset (UK) |
| Largest Decrease: 4 | Ostschweiz (CH) | Severoiztochen (BG) | Noord-Holland (NL) | Champagne-Ardenne (FR) |
| Largest Decrease: 5 | Calabria (IT) | Latvija (LV) | Jadranska Hrvatska (HR) | Bourgogne (FR) |
References
- [1] Espon database portal. https://database.espon.eu/, accessed: 2024-06-17
- [2] Irie. https://gis-portal.espon.eu/arcgis/apps/sites/#/irie-hub?, accessed: 2024-10-29
- [3] Irie final report. https://gis-portal.espon.eu/arcgis/sharing/rest/content/items/5d1239c0336041fdb87ef00454f61bb9/data, accessed: 2024-12-05
- [4] Measuring the attractiveness of regions. https://doi.org/10.1787/fbe44086-en, accessed: 2024-12-05
- [5] Bianconi, G.: Multilayer networks: structure and function. Oxford university press (2018)
- [6] Cracolici, M.F., Nijkamp, P.: The attractiveness and competitiveness of tourist destinations: A study of southern italian regions. Tourism management 30(3), 336–344 (2009)
- [7] Cudny, W., Kunc, J.: Growth and change in post-socialist cities of Central Europe. Routledge, Taylor & Francis Group (2022)
- [8] De Domenico, M., Porter, M.A., Arenas, A.: Muxviz: a tool for multilayer analysis and visualization of networks. Journal of Complex Networks 3(2), 159–176 (2015)
- [9] Gomez, S., Diaz-Guilera, A., Gomez-Gardenes, J., Perez-Vicente, C.J., Moreno, Y., Arenas, A.: Diffusion dynamics on multiplex networks. Physical review letters 110(2), 028701 (2013)
- [10] Hanzl-Weiss, D., Holzner, M., Römisch, R.: Bratislava and vienna: Twin cities with big development potentials (2018), https://api.semanticscholar.org/CorpusID:169227102
- [11] Kang, Y., Gao, S., Liang, Y., Li, M., Rao, J., Kruse, J.: Multiscale dynamic human mobility flow dataset in the us during the covid-19 epidemic. Scientific data 7(1), 390 (2020)
- [12] Komornicki, T., Rosik, P., Mazur, M.: A multilayer vision of regional integration (2023), https://coilink.org/20.500.12592/m7czwk, retrieved on 09 Dec 2024. COI: 20.500.12592/m7czwk
- [13] Lee, K.H.: The conceptualization of country attractiveness: a review of research. International Review of Administrative Sciences 82(4), 807–826 (2016)
- [14] Musolino, D.: L’attrattività percepita di regioni e province del mezzogiorno per gli investimenti produttivi. Rivista economica del Mezzogiorno 30(1), 45–70 (2016)
- [15] Musolino, D., Kotosz, B.: A new territorial attractiveness index at the international scale: design, application and patterns in italy. The Annals of Regional Science 72(4), 1159–1187 (2024)
- [16] Newman, M.: Networks. Oxford university press (2018)
- [17] Öner, Ö.: Retail city: the relationship between place attractiveness and accessibility to shops. Spatial Economic Analysis 12(1), 72–91 (2017)
- [18] Page, L., Brin, S., Motwani, R., Winograd, T., et al.: The pagerank citation ranking: Bringing order to the web (1999)
- [19] Parisi, F., Squartini, T., Garlaschelli, D.: A faster horse on a safer trail: generalized inference for the efficient reconstruction of weighted networks. New Journal of Physics 22(5), 053053 (2020)
- [20] Provenzano, D., Hawelka, B., Baggio, R.: The mobility network of european tourists: a longitudinal study and a comparison with geo-located twitter data. Tourism Review 73(1), 28–43 (2018)
- [21] Reiner, C., Meyer, S., Sardadvar, S.: Urban attraction policies for international academic talent: Munich and vienna in comparison. Cities 61, 27–35 (2017)
- [22] Rosvall, M., Axelsson, D., Bergstrom, C.T.: The map equation. The European Physical Journal Special Topics 178(1), 13–23 (2009)
- [23] Russo, A., Smith, I., Atkinson, R., Servillo, L., Madsen, B., Van der Borg, J., et al.: Attreg-the attractiveness of european regions and cities for residents and visitors. Applied Research 1(7) (2013)
- [24] Servillo, L., Atkinson, R., Russo, A.P.: Territorial attractiveness in eu urban and spatial policy: A critical review and future research agenda. European urban and regional studies 19(4), 349–365 (2012)
- [25] Squartini, T., Mastrandrea, R., Garlaschelli, D.: Unbiased sampling of network ensembles. New Journal of Physics 17(2), 023052 (2015)
- [26] Vallarano, N., Bruno, M., Marchese, E., Trapani, G., Saracco, F., Cimini, G., Zanon, M., Squartini, T.: Fast and scalable likelihood maximization for exponential random graph models with local constraints. Scientific Reports 11(1), 15227 (2021)
- [27] Waltert, F., Schläpfer, F.: Landscape amenities and local development: A review of migration, regional economic and hedonic pricing studies. Ecological Economics 70(2), 141–152 (2010)
Supplementary Information
S1 Data
Detailed information on the data sources and processing methodologies used for harmonization and estimation of missing values can be found in [2].
S1.1 Population
Total population on January 1st, sourced from [1]. Manual additions were made for Mariotte (France) and Ireland for specific years.
We normalize the migration flows by dividing them by the population of the origin region to address a potential bias. According to the gravity model in migration studies, regions with larger populations tend to have higher absolute numbers of incoming and outgoing migrants. By normalizing the flows, we eliminate this population size bias, allowing for a more accurate comparison of regions’ relative contributions to migration patterns. This approach is also applied to other types of flows in our study, ensuring consistent analysis across different flow categories.
S1.2 GDP
Gross Domestic Product at current market prices (million euros), sourced from [1]. 2011 values were used for regions lacking 2010 data. Manual additions were made for Iceland and Liechtenstein.
S2 Methods
We configure the Infomap algorithm with the following parameters:
-
•
two_level=False: Clusters the optimal number of nested modules, accommodating both country-level clusters and single-region clusters.
-
•
num_trials=100: Number of outer-most loops to run before selecting the best solution.
-
•
flow_model=’rawdir’: Determines node visitation rates based on the given direction and weight of edges, without using a PageRank algorithm.
-
•
entropy_corrected=True: Corrects for negative entropy bias in small samples (many modules).
-
•
multilayer_relax_rate=0.15: Probability of relaxing the constraint to move only within the current layer (default value).
We applied the Infomap algorithm to the multiplex network structure to identify communities. In this analysis, it is possible for a region to be assigned to multiple communities across different layers. To resolve such cases and provide a definitive community assignment, we employed a frequency-based approach. Specifically, each region was ultimately assigned to the community in which it appeared most frequently across all layers.
S3 Results
S3.1 Network properties
| Layer | Year | Nodes | Edges | Density (%) |
|---|---|---|---|---|
| Migration | 2010 | 297 | 70797 | 80.53 |
| Migration | 2011 | 297 | 71535 | 81.37 |
| Migration | 2012 | 297 | 72459 | 82.42 |
| Migration | 2013 | 297 | 74502 | 84.75 |
| Migration | 2014 | 297 | 75342 | 85.70 |
| Migration | 2015 | 297 | 75580 | 85.97 |
| Migration | 2016 | 297 | 75955 | 86.40 |
| Migration | 2017 | 297 | 76044 | 86.50 |
| Migration | 2018 | 297 | 76281 | 86.77 |
| Tourism | 2010 | 297 | 87635 | 99.68 |
| Tourism | 2011 | 297 | 87649 | 99.70 |
| Tourism | 2012 | 297 | 87652 | 99.70 |
| Tourism | 2013 | 297 | 87665 | 99.72 |
| Tourism | 2014 | 297 | 87662 | 99.72 |
| Tourism | 2015 | 297 | 87669 | 99.72 |
| Tourism | 2016 | 297 | 87686 | 99.74 |
| Tourism | 2017 | 297 | 87682 | 99.74 |
| Tourism | 2018 | 297 | 87692 | 99.75 |
| Freight | 2010 | 297 | 46695 | 53.12 |
| Freight | 2011 | 297 | 47315 | 53.82 |
| Freight | 2012 | 297 | 46820 | 53.26 |
| Freight | 2013 | 297 | 46663 | 53.08 |
| Freight | 2014 | 297 | 46703 | 53.12 |
| Freight | 2015 | 297 | 44742 | 50.89 |
| Freight | 2016 | 297 | 43628 | 49.63 |
| Freight | 2017 | 297 | 43326 | 49.28 |
| Freight | 2018 | 297 | 42587 | 48.44 |
| Erasmus | 2010 | 265 | 21551 | 30.80 |
| Erasmus | 2011 | 264 | 22094 | 31.82 |
| Erasmus | 2012 | 270 | 23405 | 32.22 |
| Erasmus | 2013 | 272 | 24027 | 32.60 |
| Erasmus | 2014 | 274 | 24576 | 32.85 |
| Layer | Year | Nodes | Edges | Density (%) |
|---|---|---|---|---|
| FDI | 2010 | 292 | 24872 | 29.27 |
| FDI | 2011 | 292 | 25028 | 29.45 |
| FDI | 2012 | 292 | 25178 | 29.63 |
| FDI | 2013 | 292 | 25309 | 29.79 |
| FDI | 2014 | 292 | 25360 | 29.85 |
| FDI | 2015 | 292 | 25422 | 29.92 |
| FDI | 2016 | 292 | 25483 | 29.99 |
| FDI | 2017 | 292 | 25521 | 30.03 |
| FDI | 2018 | 292 | 25441 | 29.94 |
| Passengers | 2010 | 297 | 12144 | 13.81 |
| Passengers | 2011 | 297 | 12486 | 14.20 |
| Passengers | 2012 | 297 | 12547 | 14.27 |
| Passengers | 2013 | 297 | 12604 | 14.34 |
| Passengers | 2014 | 297 | 12649 | 14.39 |
| Passengers | 2015 | 297 | 12588 | 14.32 |
| Passengers | 2016 | 297 | 12716 | 14.46 |
| Passengers | 2017 | 297 | 12849 | 14.62 |
| Passengers | 2018 | 297 | 12998 | 14.79 |
| Remittances | 2010 | 297 | 81375 | 92.56 |
| Remittances | 2011 | 297 | 81355 | 92.54 |
| Remittances | 2012 | 297 | 81410 | 92.60 |
| Remittances | 2013 | 297 | 81243 | 92.41 |
| Remittances | 2014 | 297 | 81172 | 92.33 |
| Remittances | 2015 | 297 | 81016 | 92.16 |
| Remittances | 2016 | 297 | 81236 | 92.41 |
| Remittances | 2017 | 297 | 81250 | 92.42 |
| Remittances | 2018 | 297 | 81250 | 92.42 |
| Horizon2020 | 2015 | 287 | 7482 | 9.12 |
| Horizon2020 | 2016 | 284 | 7135 | 8.88 |
| Horizon2020 | 2017 | 288 | 6899 | 8.35 |
| Horizon2020 | 2018 | 279 | 6475 | 8.35 |
Table 5 and Table 6 present the network statistics across European NUTS-2 regions from 2010 to 2018. For each flow type, we report the number of nodes, which indicates the participating NUTS-2 regions in the network, as well as the number of edges, representing the connections between these regions where a connection signifies a non-zero flow. Additionally, we calculate the density of each network as the ratio of actual connections to the total possible connections, providing insight into how interconnected the regions are within each flow type.
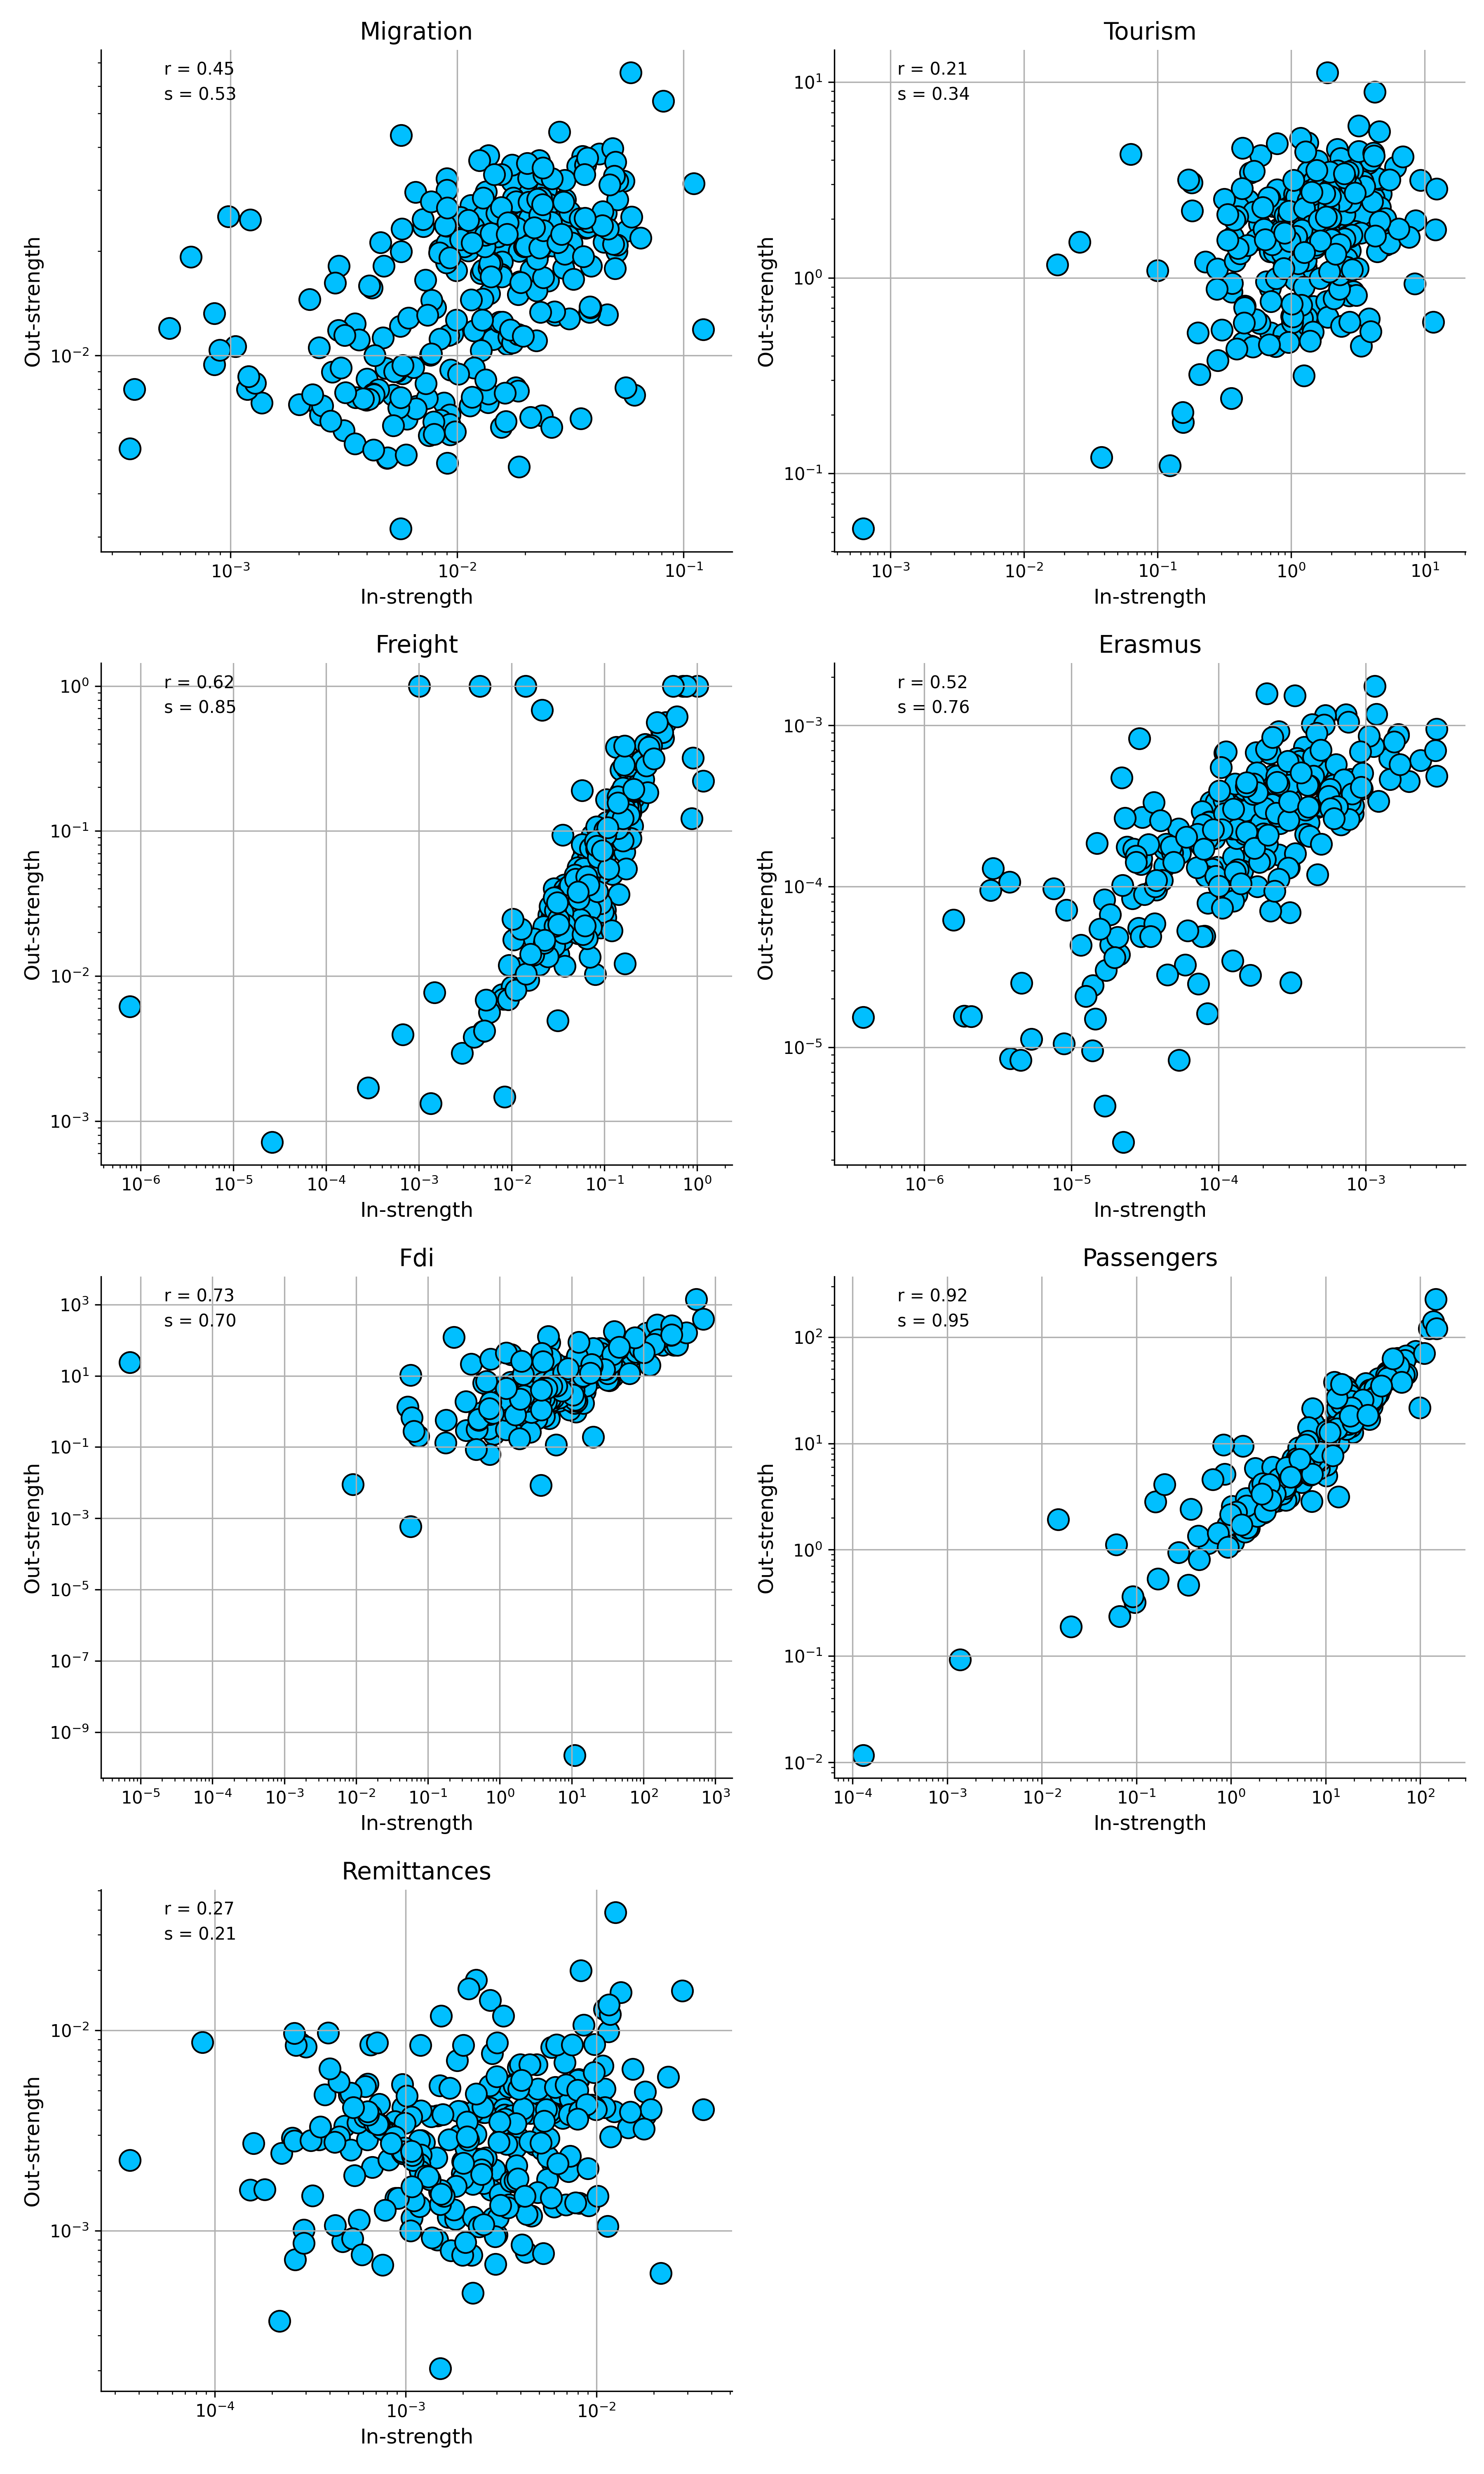
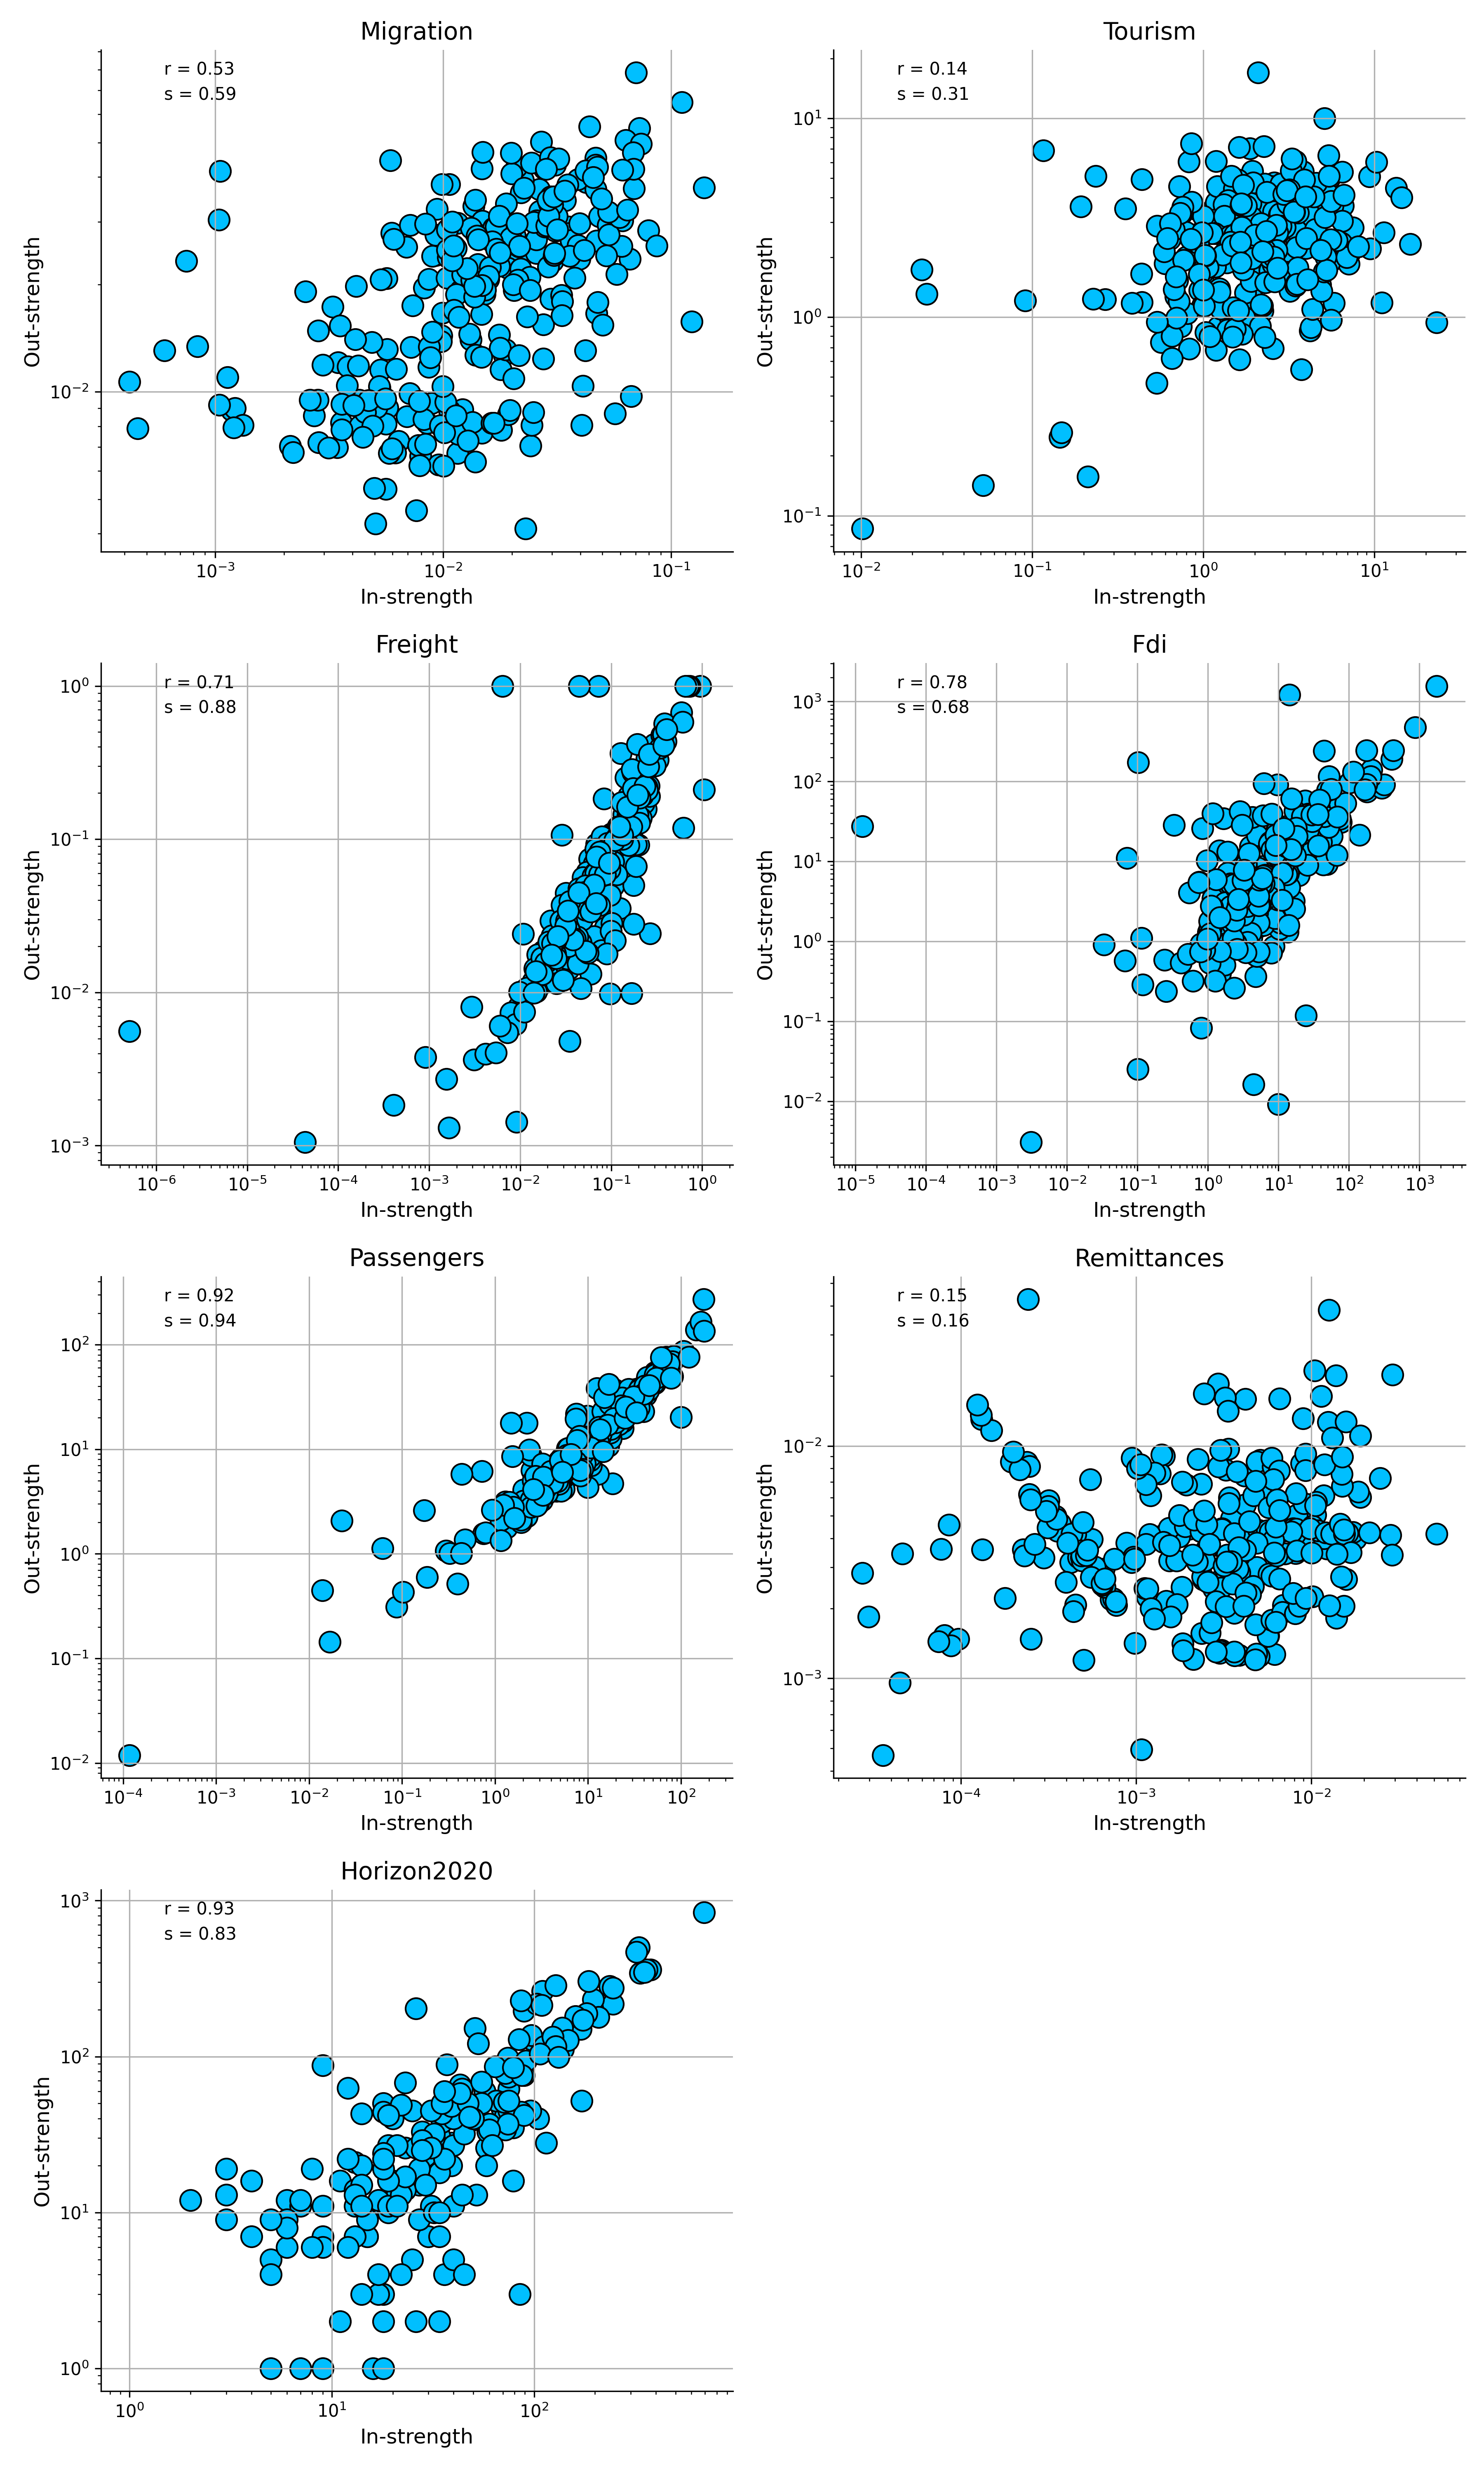
Fig. 11 and 12 depict the relationship between in-strength and out-strength for all flow types in 2010 and 2018, respectively. These scatter plots reveal notable differences in correlations between various flow types, which remain consistent across both years. For instance, in 2010, the Spearman correlation coefficients range widely from 0.16 to 0.94, indicating diverse patterns of association between inflows and outflows across different domains. This substantial variation in correlations persists in 2018, suggesting that the underlying structures of these regional flow networks maintain their distinct characteristics over time.
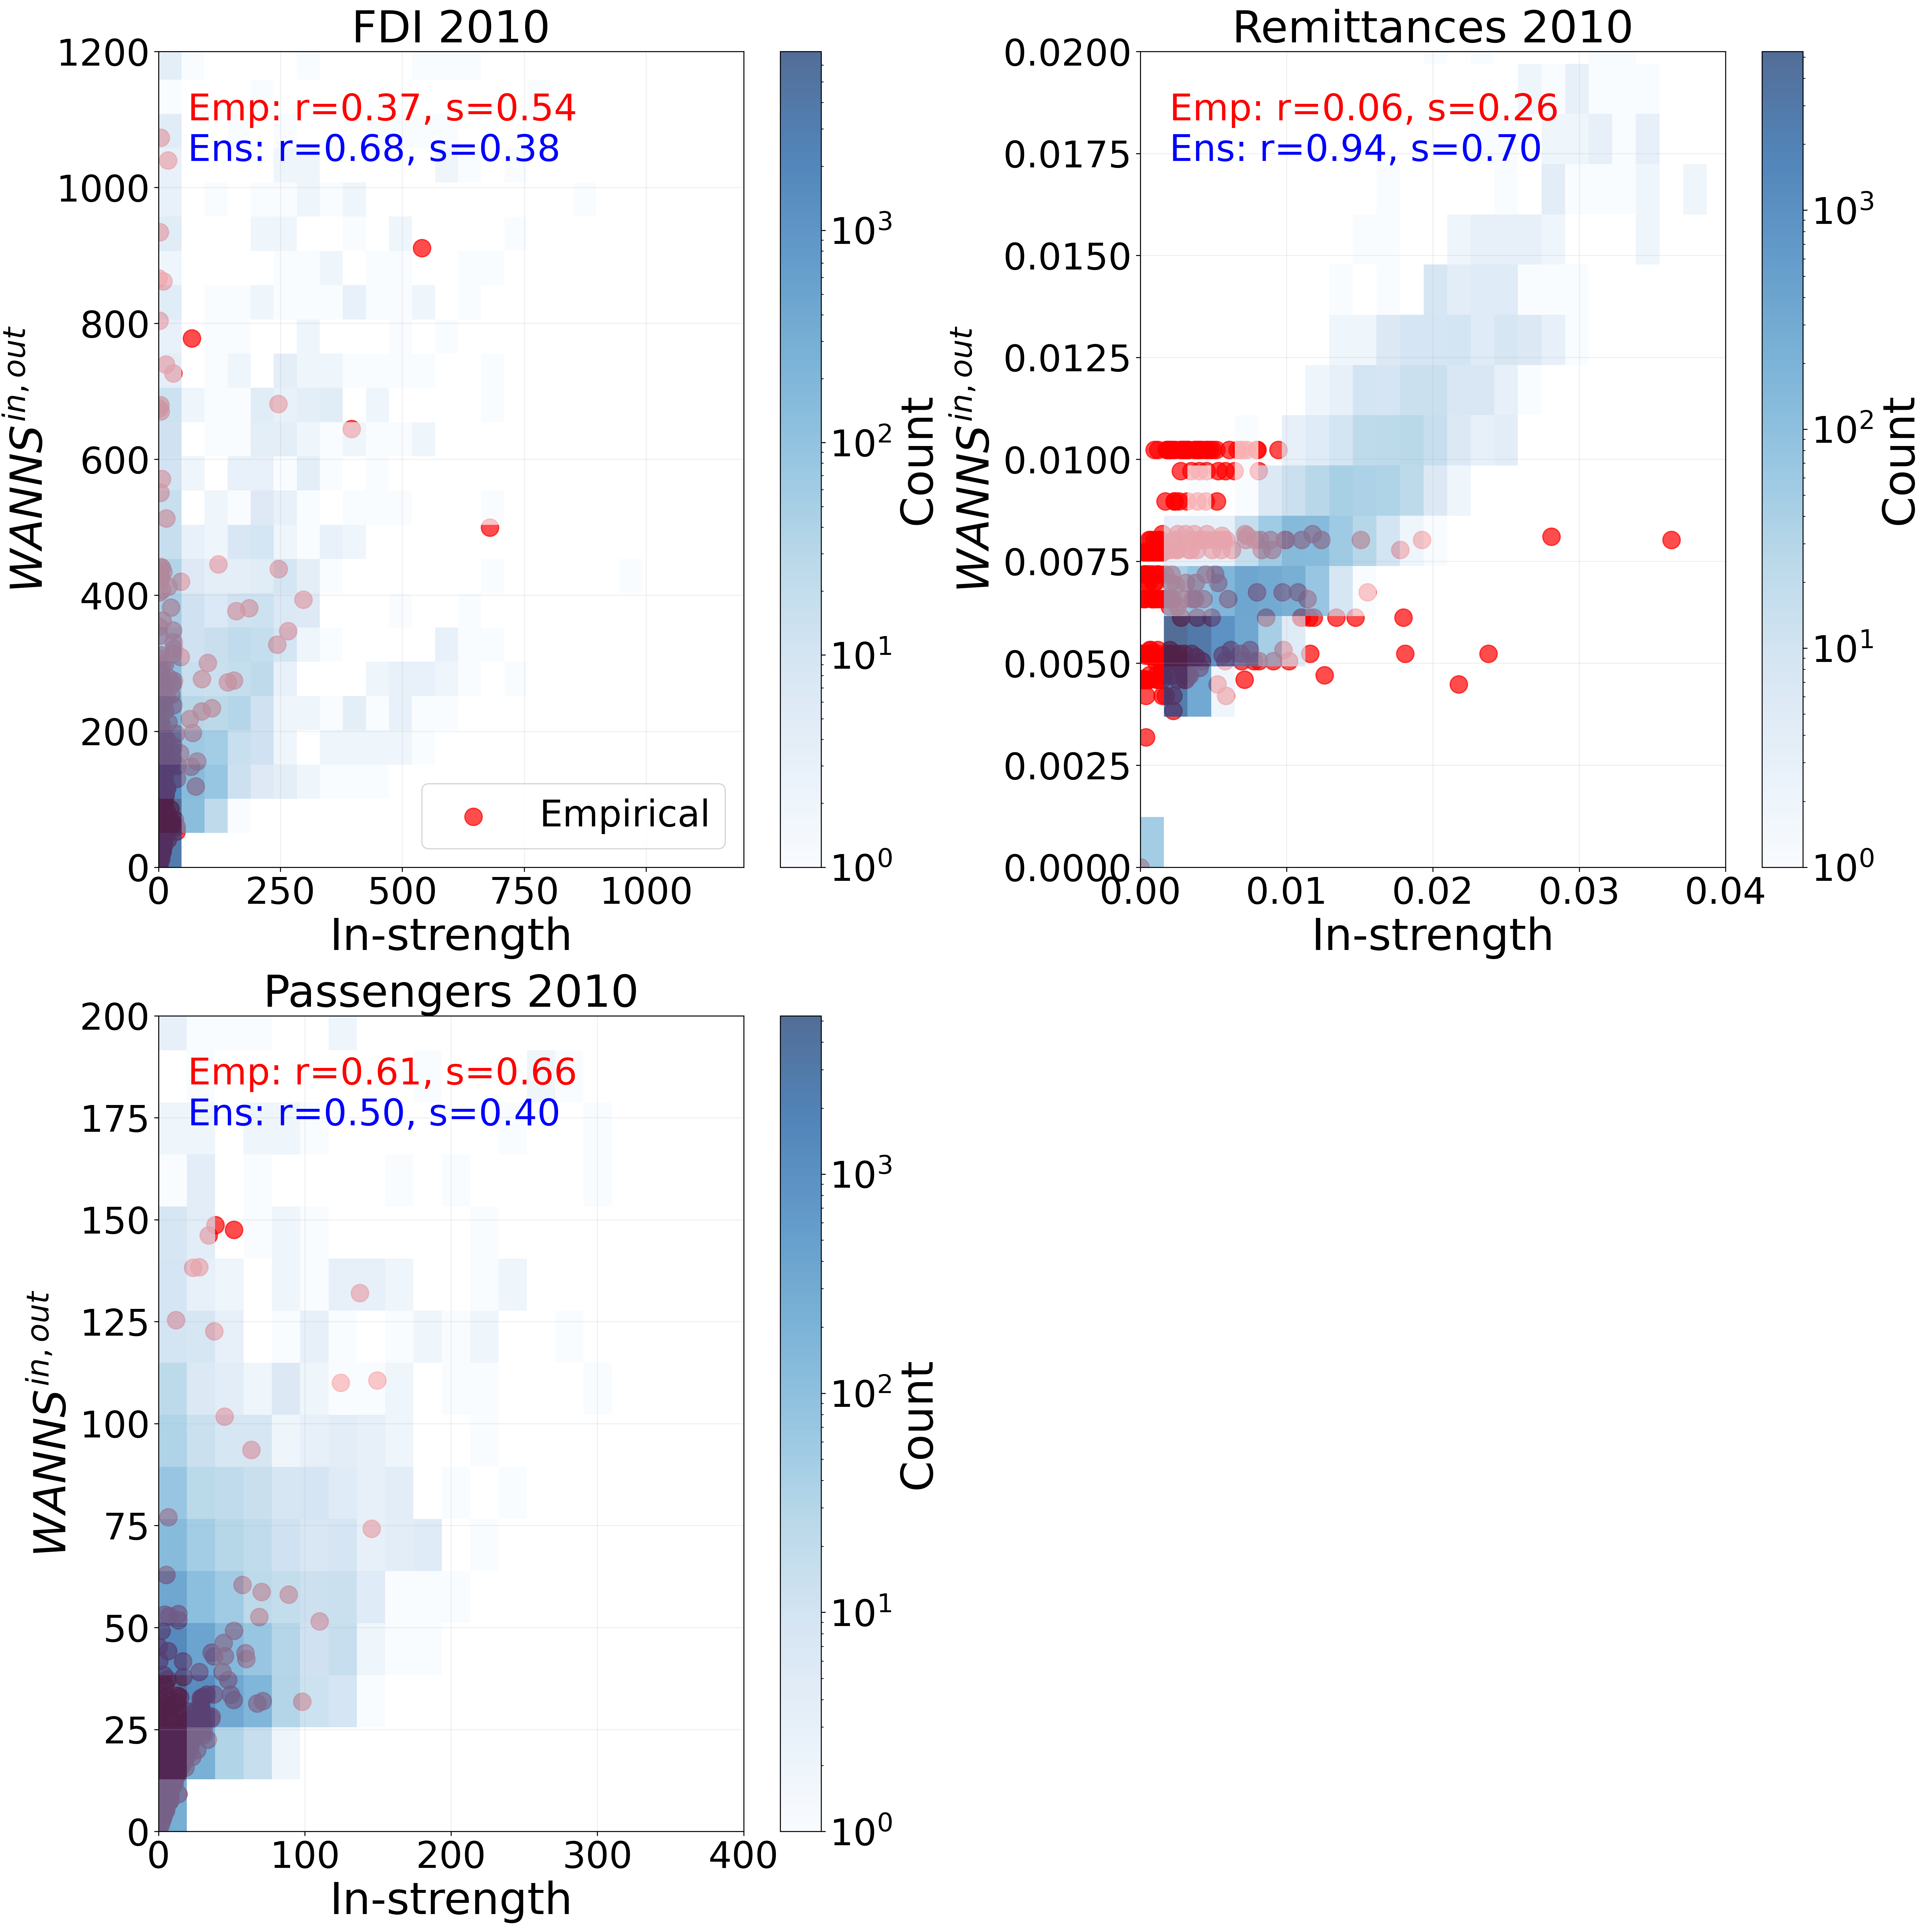
Fig. 13 presents the for the empirical networks alongside 50 realizations drawn from the null model ensembles for FDI, Remittances, and Passengers in 2010.
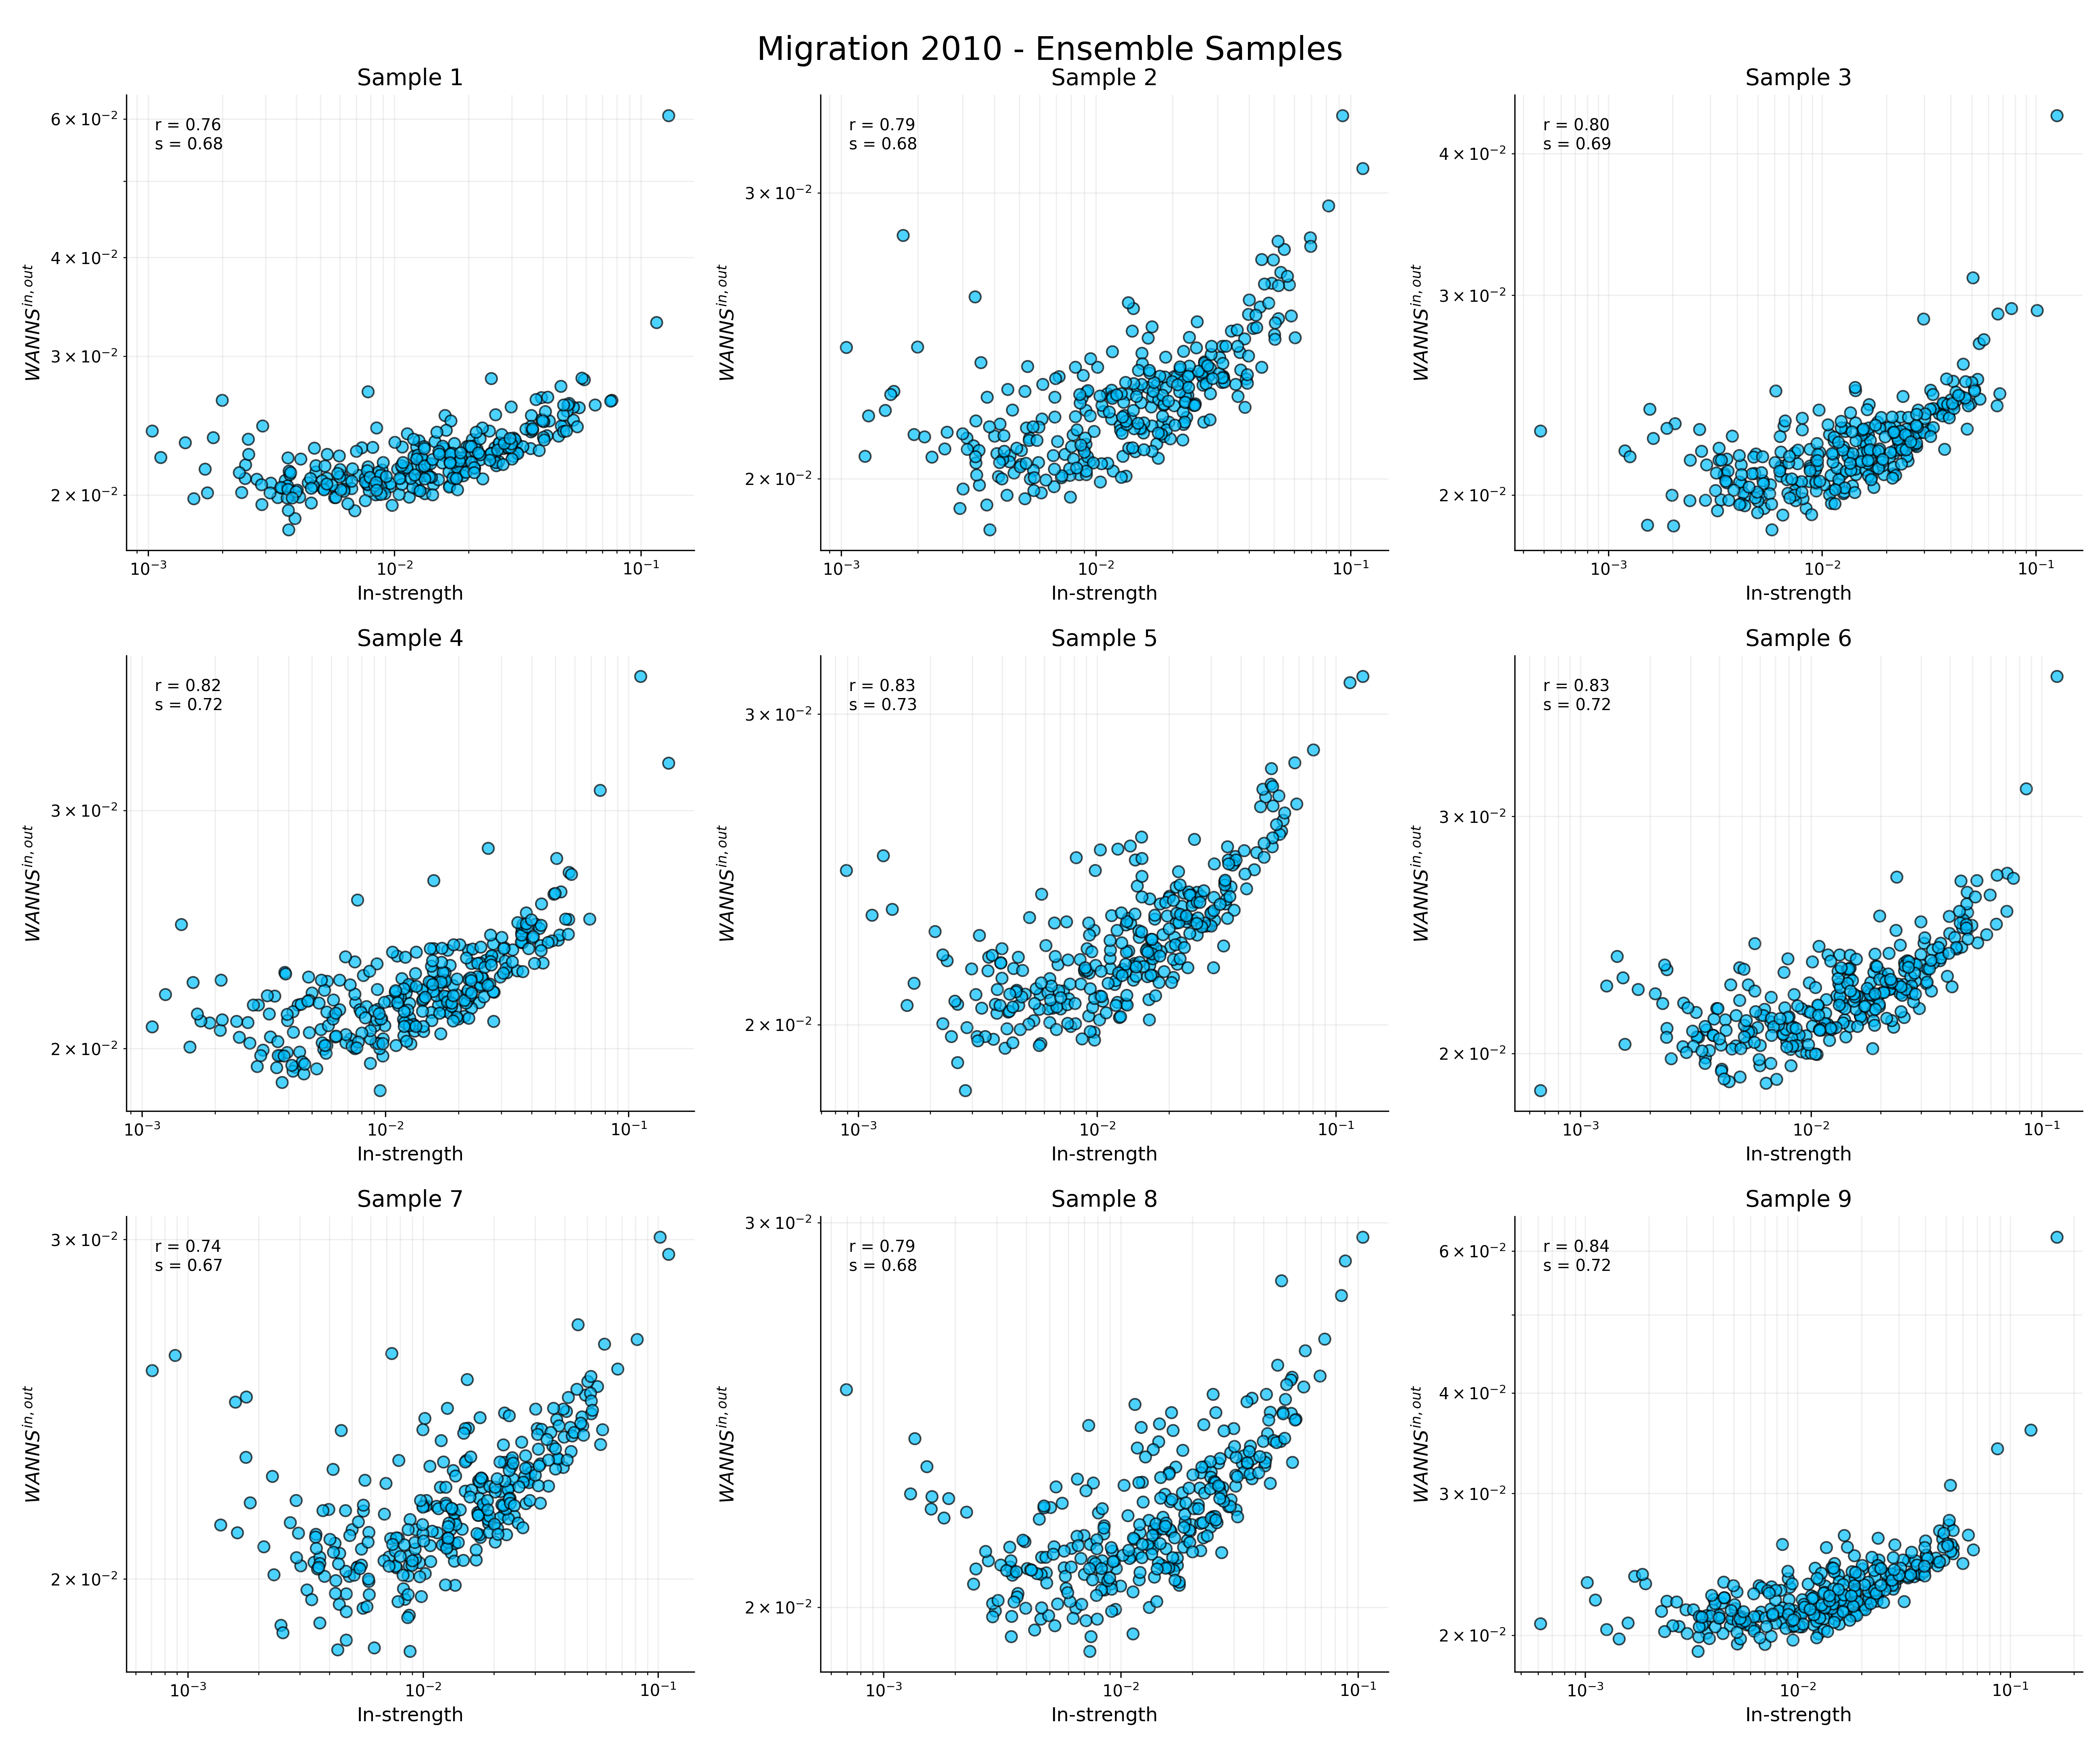
Fig. 14 focuses specifically on the Migration flow type in 2010, showing the relationship between the and the in-strength for ensemble copies. This visualization helps to understand the assortativity patterns in the migration network, revealing how regions with higher in-strength tend to receive flows from regions with higher out-strength.
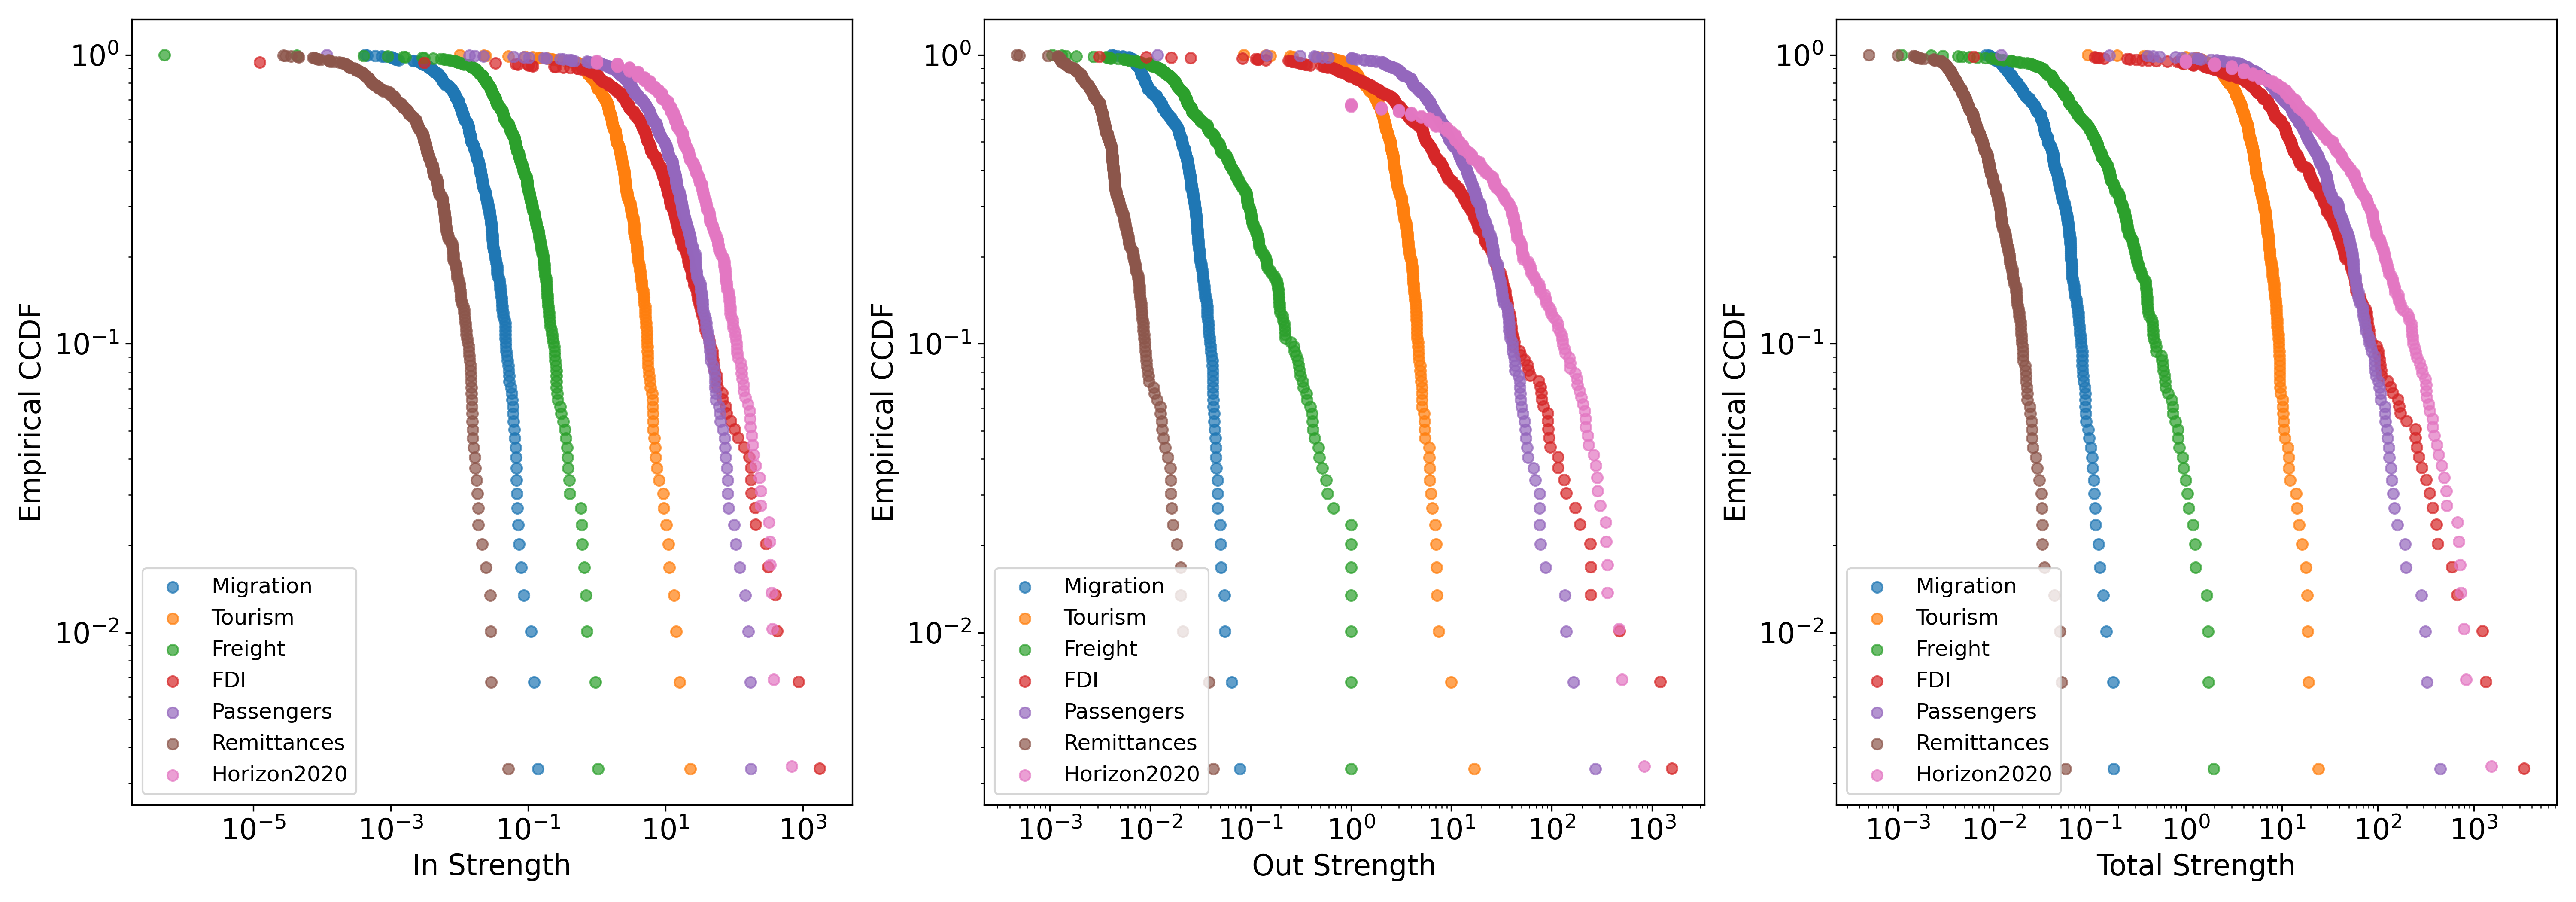
Fig. 15 presents the CCDF for all flow types in 2018. This plot closely resembles the CCDF for 2010 shown in the main paper, indicating a remarkable stability in the strength distributions over time. The consistent tail behavior across both years suggests that the potential heavy-tailed relationships and distribution characteristics for different flow types remain largely unchanged. This similarity underscores the persistent nature of the network structure and flow patterns in the European regional system, with minimal alterations in the relative strengths of connections across various domains between 2010 and 2018.
S3.2 Pagerank
| Region | PageRank |
|---|---|
| Oberbayern | 1.0000 |
| Ile-de-France | 0.8087 |
| Inner London - East | 0.6598 |
| Darmstadt | 0.6441 |
| Stuttgart | 0.6259 |
| Düsseldorf | 0.6252 |
| Berlin | 0.6167 |
| Köln | 0.6105 |
| Attiki | 0.6045 |
| Lombardia | 0.6024 |
| Region | PageRank |
|---|---|
| Cataluña | 1.0000 |
| Ile-de-France | 0.9793 |
| Jadranska Hrvatska | 0.9237 |
| Andalucía | 0.7983 |
| Rhône-Alpes | 0.6389 |
| Provence-Alpes-Côte d’Azur | 0.6367 |
| Veneto | 0.5567 |
| Comunidad Valenciana | 0.5176 |
| Lombardia | 0.4910 |
| Comunidad de Madrid | 0.4865 |
| Region | PageRank |
|---|---|
| Lombardia | 1.0000 |
| Zuid-Holland | 0.7975 |
| Emilia-Romagna | 0.6890 |
| Veneto | 0.6428 |
| Cataluña | 0.6336 |
| Ile-de-France | 0.6021 |
| Nord-Pas de Calais | 0.5995 |
| Andalucía | 0.5737 |
| Weser-Ems | 0.5091 |
| Comunidad Valenciana | 0.5006 |
| Region | PageRank |
|---|---|
| Ile-de-France | 1.0000 |
| Comunidad de Madrid | 0.9202 |
| Andalucía | 0.8484 |
| Comunidad Valenciana | 0.6656 |
| Cataluña | 0.6186 |
| Berlin | 0.5657 |
| Lazio | 0.5479 |
| Stockholm | 0.5269 |
| Rhône-Alpes | 0.4794 |
| Hovedstaden | 0.4272 |
| Region | PageRank |
|---|---|
| Noord-Holland | 1.0000 |
| Ile-de-France | 0.6988 |
| Comunidad de Madrid | 0.5451 |
| Lombardia | 0.4559 |
| Bucureşti - Ilfov | 0.4537 |
| Luxembourg | 0.4333 |
| Eastern and Midland | 0.4220 |
| Région de Bruxelles-Capitale | 0.3791 |
| Zuid-Holland | 0.3750 |
| Warszawski stołeczny | 0.2924 |
| Region | PageRank |
|---|---|
| Ile-de-France | 1.0000 |
| Comunidad de Madrid | 0.3822 |
| Inner London - West | 0.3775 |
| Inner London - East | 0.3187 |
| Stockholm | 0.2466 |
| Oberbayern | 0.2449 |
| Cataluña | 0.2446 |
| Berlin | 0.2232 |
| Noord-Holland | 0.2197 |
| Lombardia | 0.2186 |
| Region | PageRank |
|---|---|
| Ile-de-France | 1.0000 |
| Cataluña | 0.9165 |
| Luxembourg | 0.7257 |
| Comunidad de Madrid | 0.7015 |
| Vidurio ir vakarų Lietuvos regionas | 0.6988 |
| Prov. Antwerpen | 0.5824 |
| Rhône-Alpes | 0.5389 |
| Latvija | 0.4810 |
| Prov. Oost-Vlaanderen | 0.4793 |
| Comunidad Valenciana | 0.4563 |
Fig. 16 illustrates the spatial distribution of PageRank centrality values across European regions for Freight, Erasmus, and Passengers in 2010.
Tables 7 through 13 present the top 10 regions ranked by PageRank for various flow types in 2010. For migration flows (Table 7), Oberbayern emerges as the most central region, followed closely by Ile-de-France and Inner London - East. The list is dominated by German regions, highlighting Germany’s significance in European migration patterns. Tourism flows (Table 8) show Cataluña as the top-ranked region, with Ile-de-France and Jadranska Hrvatska following closely. This ranking reflects the popularity of Mediterranean coastal regions for tourism. In freight transport (Table 9), Lombardia leads, followed by Zuid-Holland and Emilia-Romagna, underscoring the importance of industrial and port regions in goods movement. For Erasmus student exchanges (Table 10), Ile-de-France ranks first, followed by Comunidad de Madrid and Andalucía, indicating the attractiveness of these regions for international students. In Foreign Direct Investment (FDI) flows (Table 11), Noord-Holland tops the list, with Ile-de-France and Comunidad de Madrid following, reflecting the financial importance of these regions. Passenger flows (Table 12) are dominated by Ile-de-France, with a significant lead over Comunidad de Madrid and Inner London - West, highlighting Paris’s role as a major transportation hub. Finally, for remittance flows (Table 13), Ile-de-France again leads, followed by Cataluña and Luxembourg, indicating the economic significance of these regions for international money transfers. These rankings collectively demonstrate the varied roles that different regions play in different types of flows, with some regions, particularly Ile-de-France, showing high centrality across multiple networks.
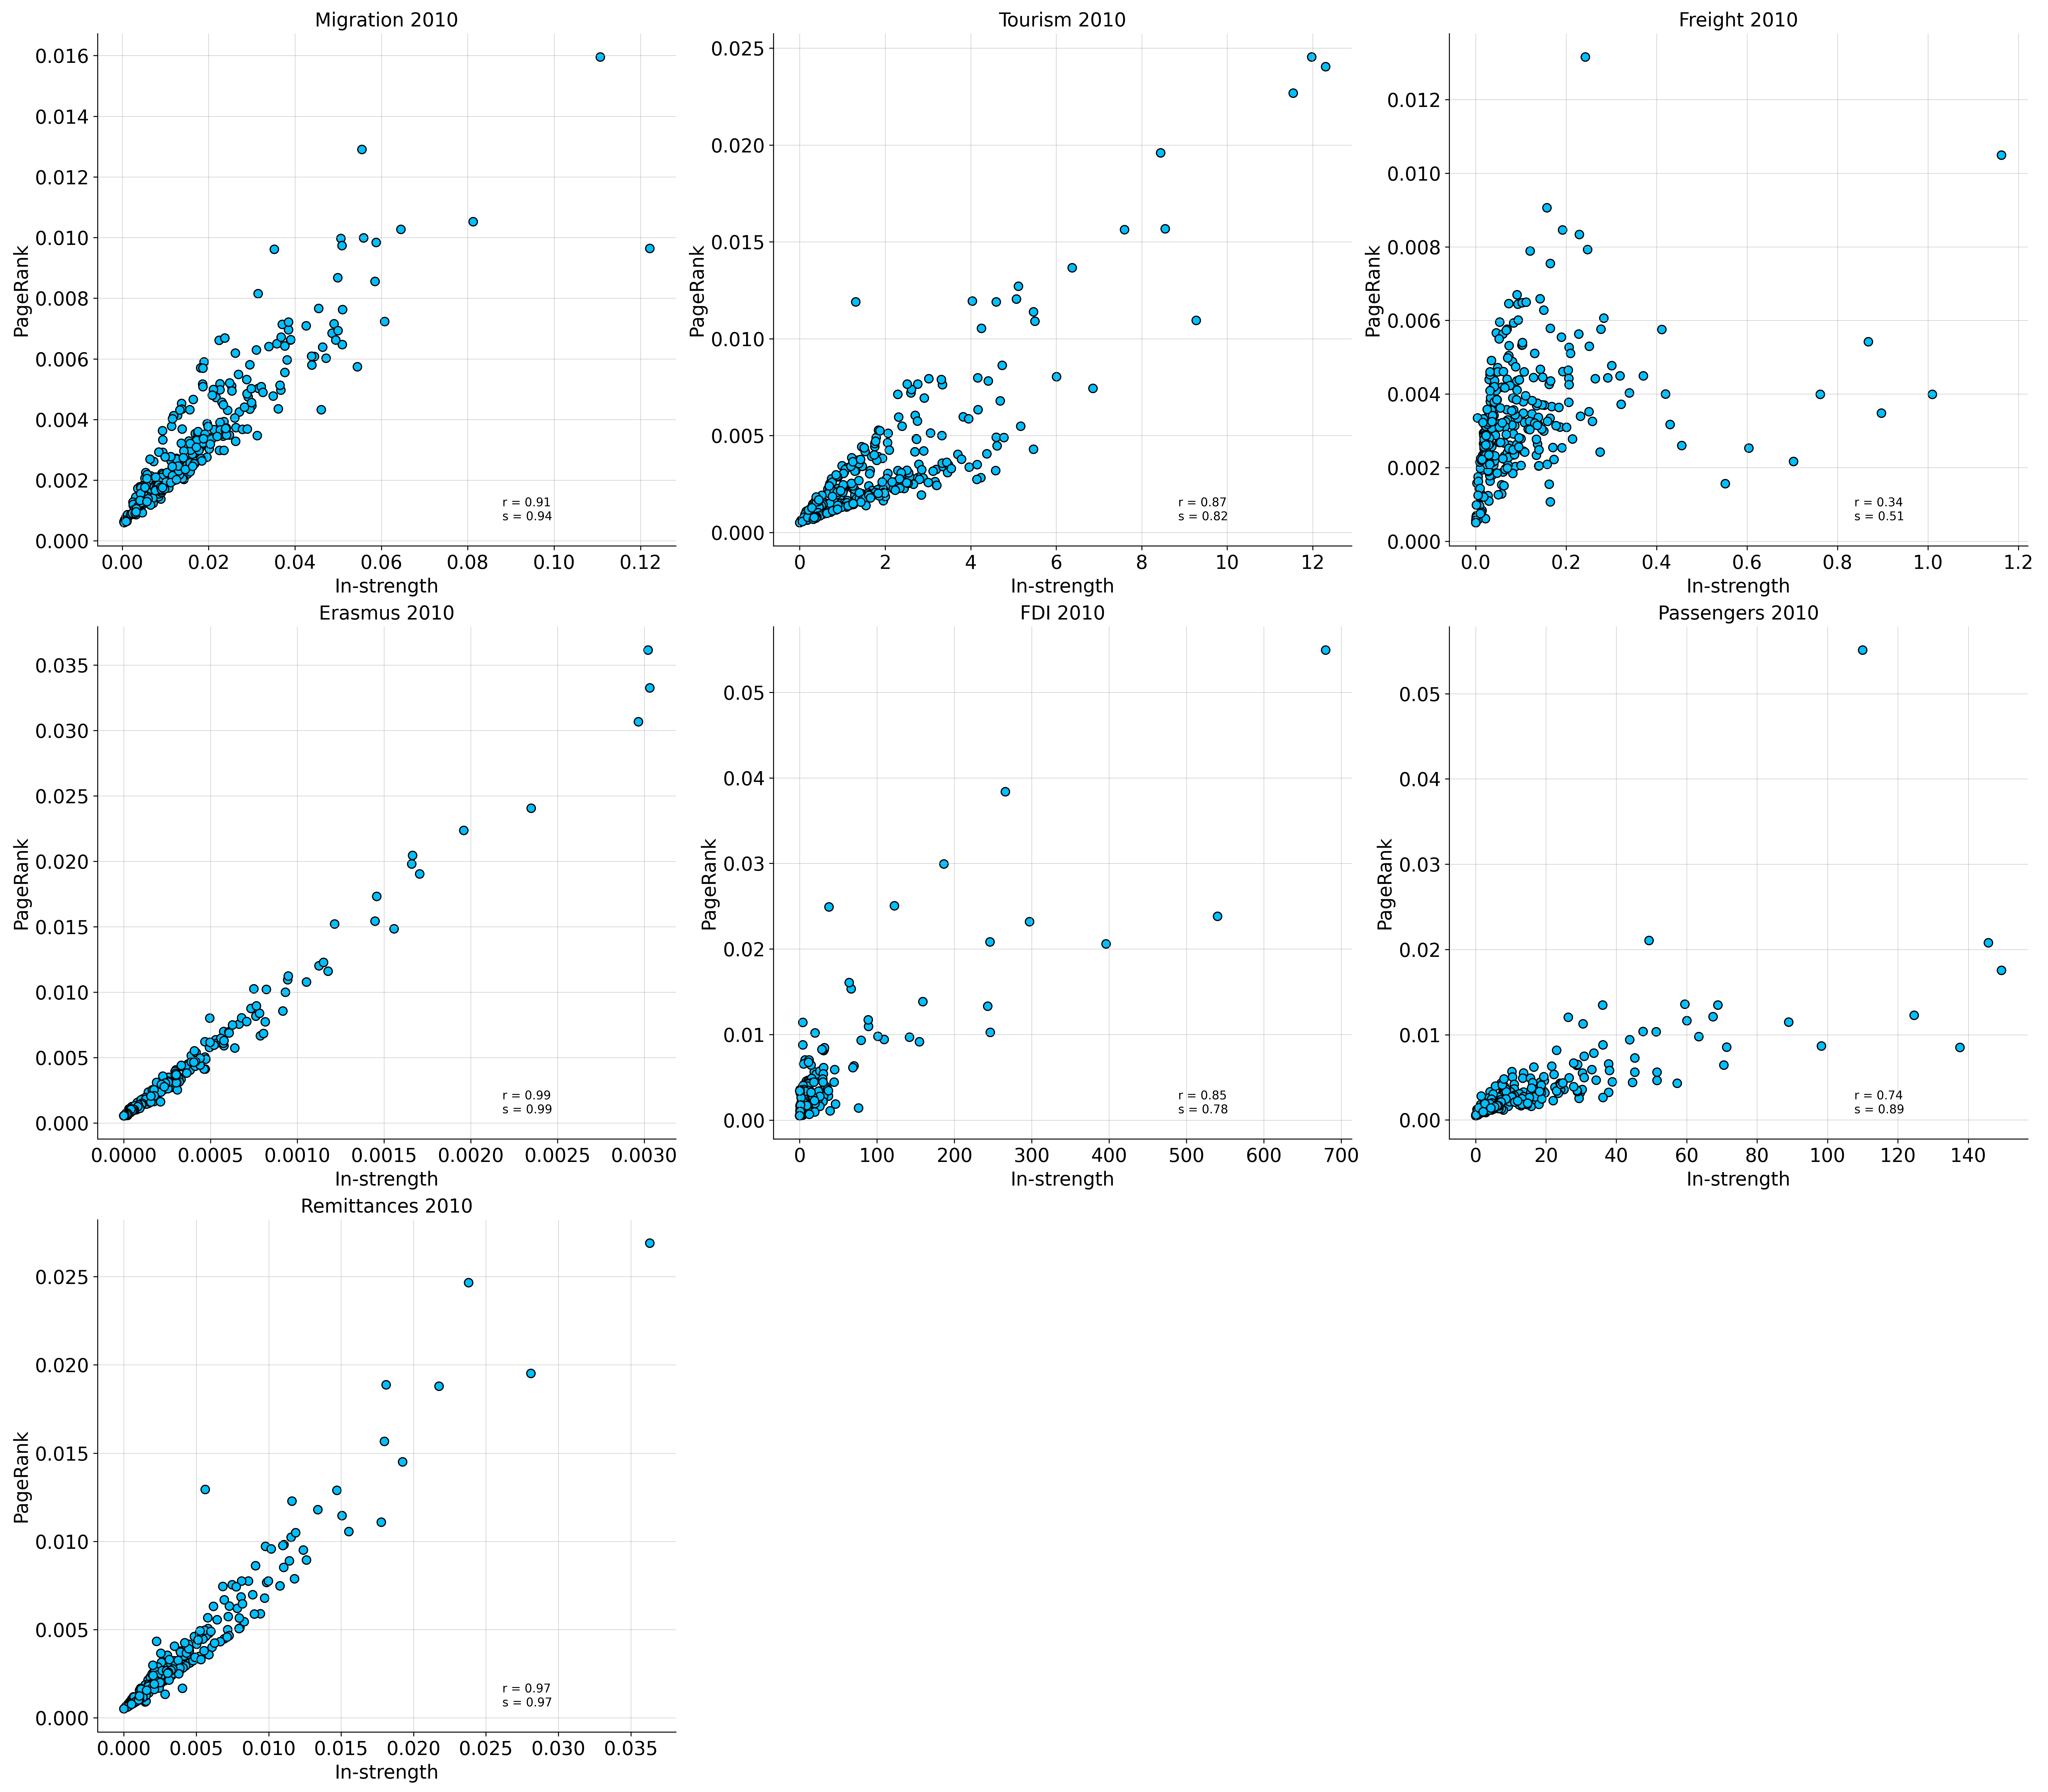
Fig. 17 demonstrates the relationship between PageRank and in-strength across all flow types in 2010. The analysis reveals strong correlations for most flow types, with both Pearson and Spearman correlation coefficients exceeding 0.74. This indicates a robust association between a region’s centrality and the volume of incoming flows for most networks. However, the Freight network stands out as an exception, exhibiting a notably weaker correlation.
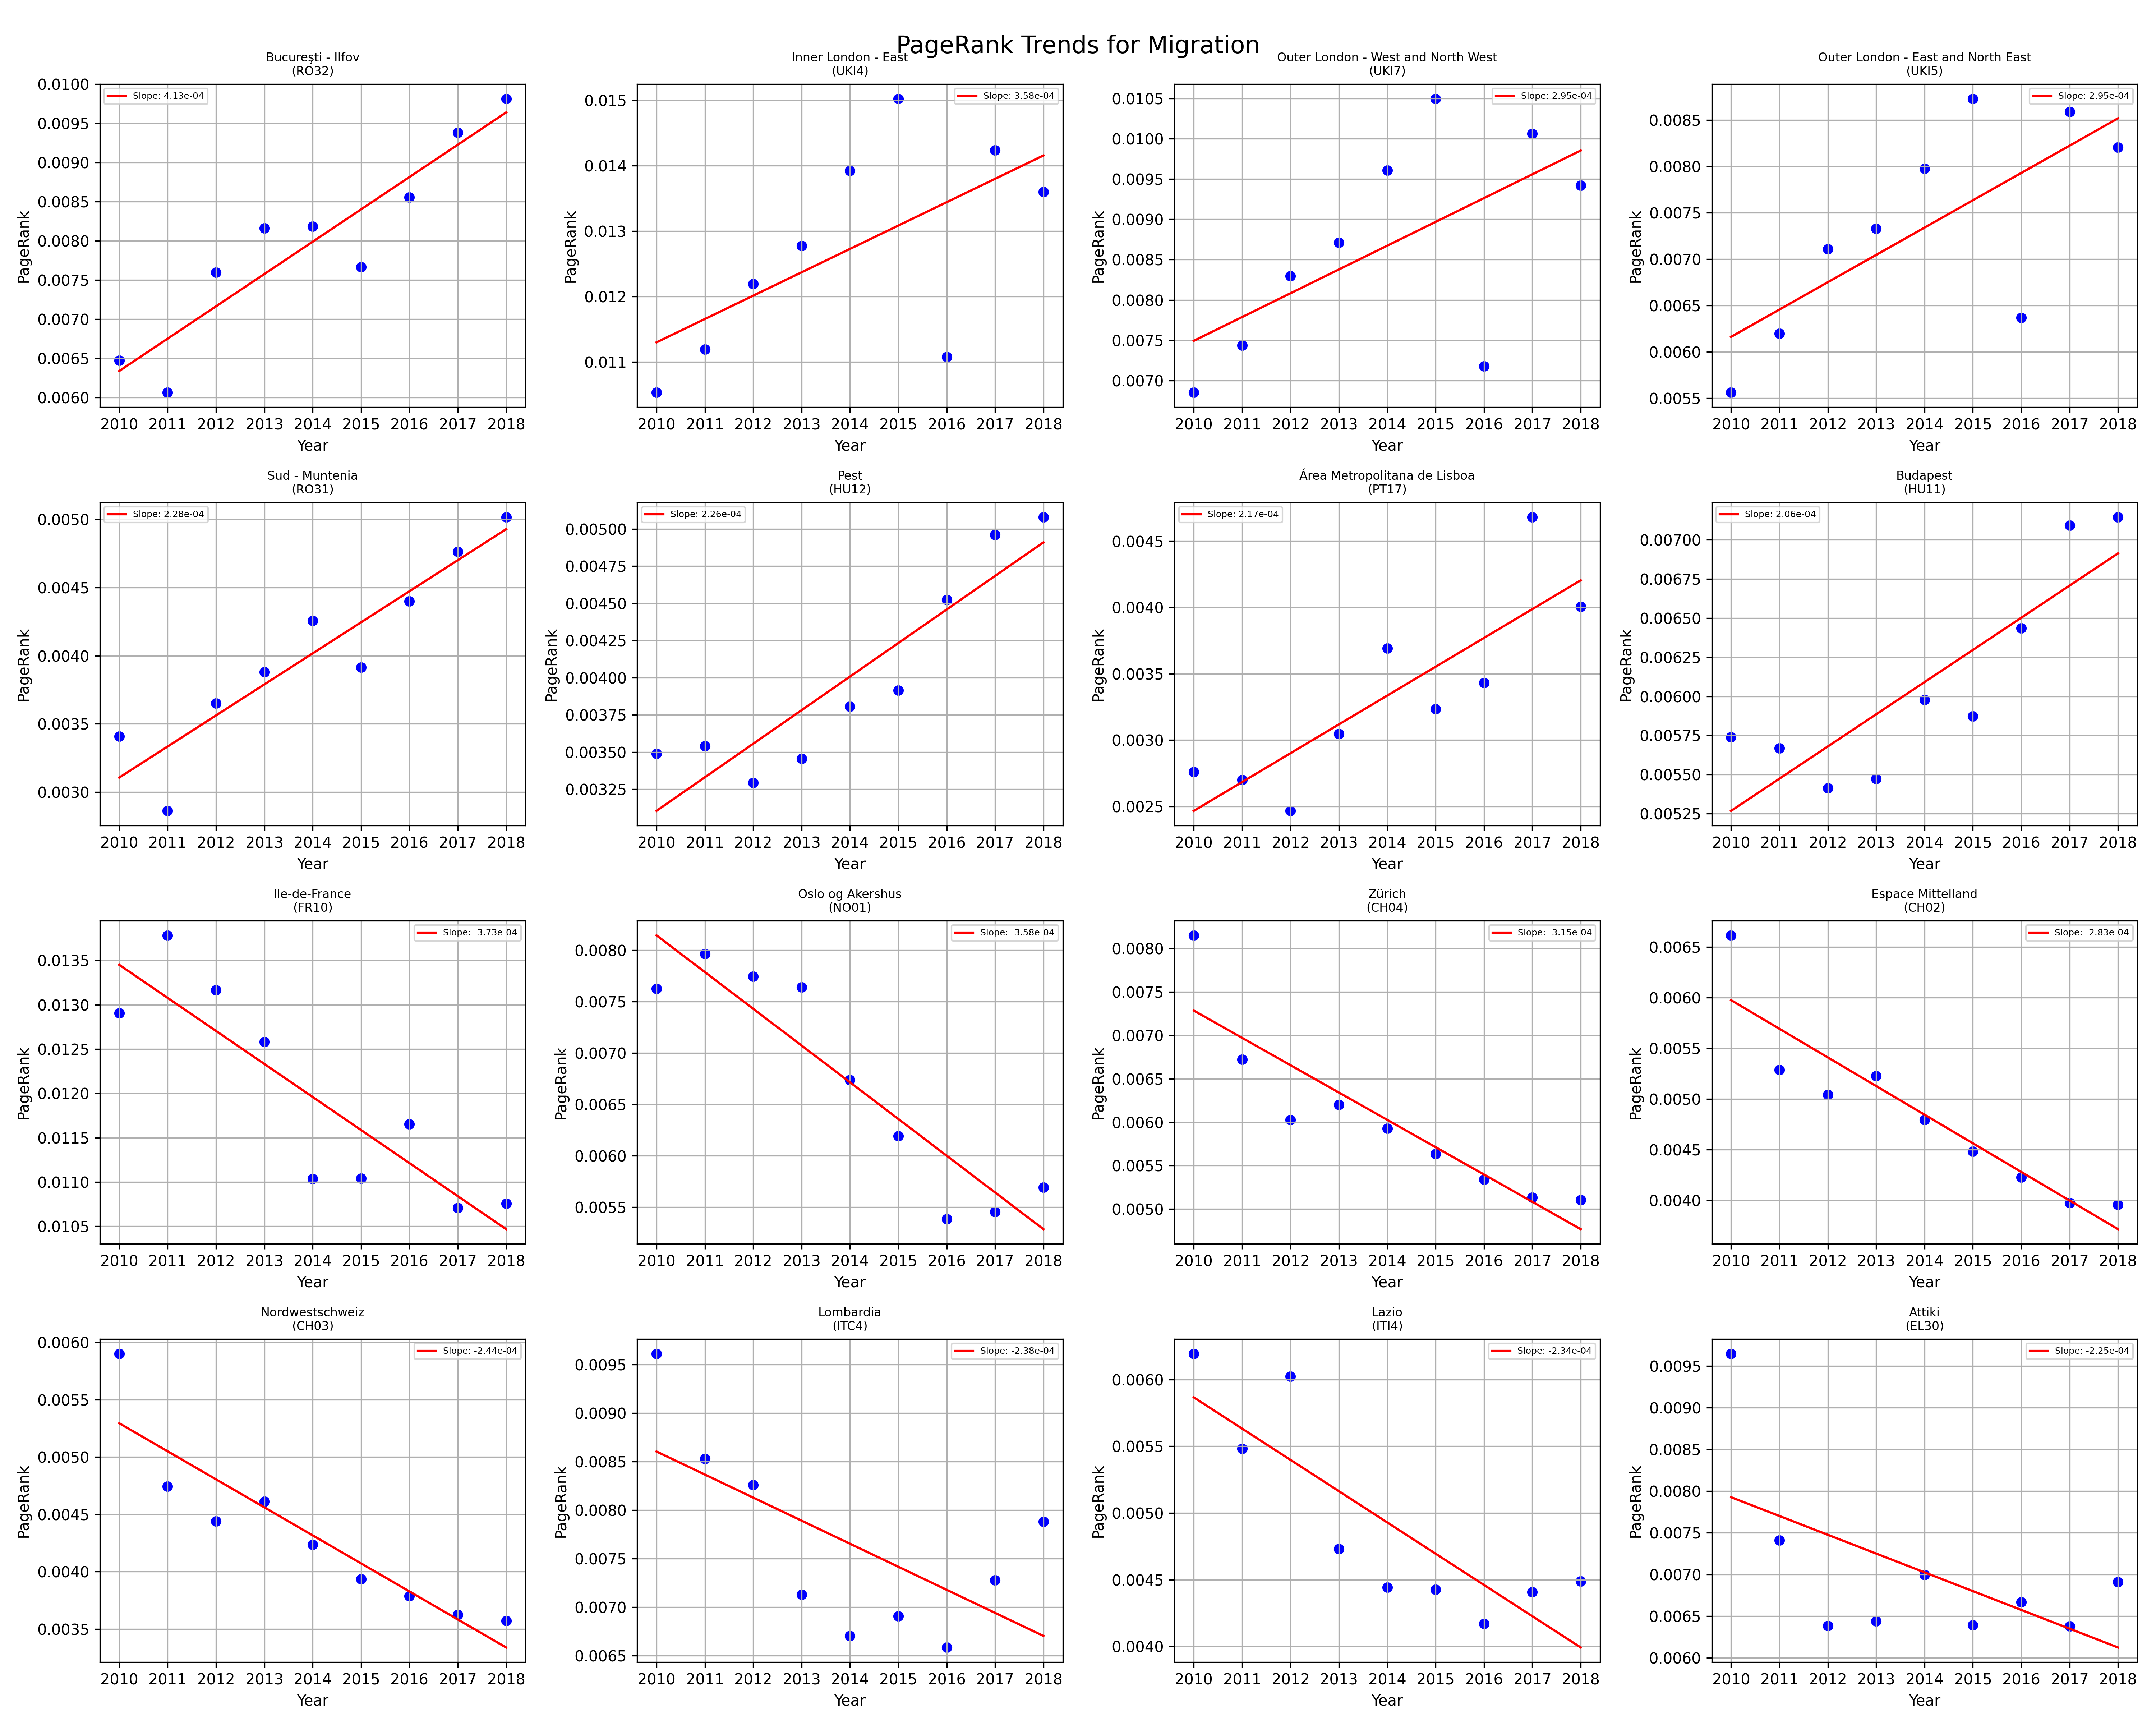
Fig. 18 illustrates the top 8 and bottom 8 slopes of PageRank trends for Migration, highlighting regions with notably increasing or decreasing centrality. Interestingly, London stands out among the top increasing trends, despite experiencing a noticeable dip in 2016, likely attributable to the Brexit referendum. This overall upward trajectory, even in the face of such a significant political event, underscores London’s resilience and enduring importance as a migration hub.
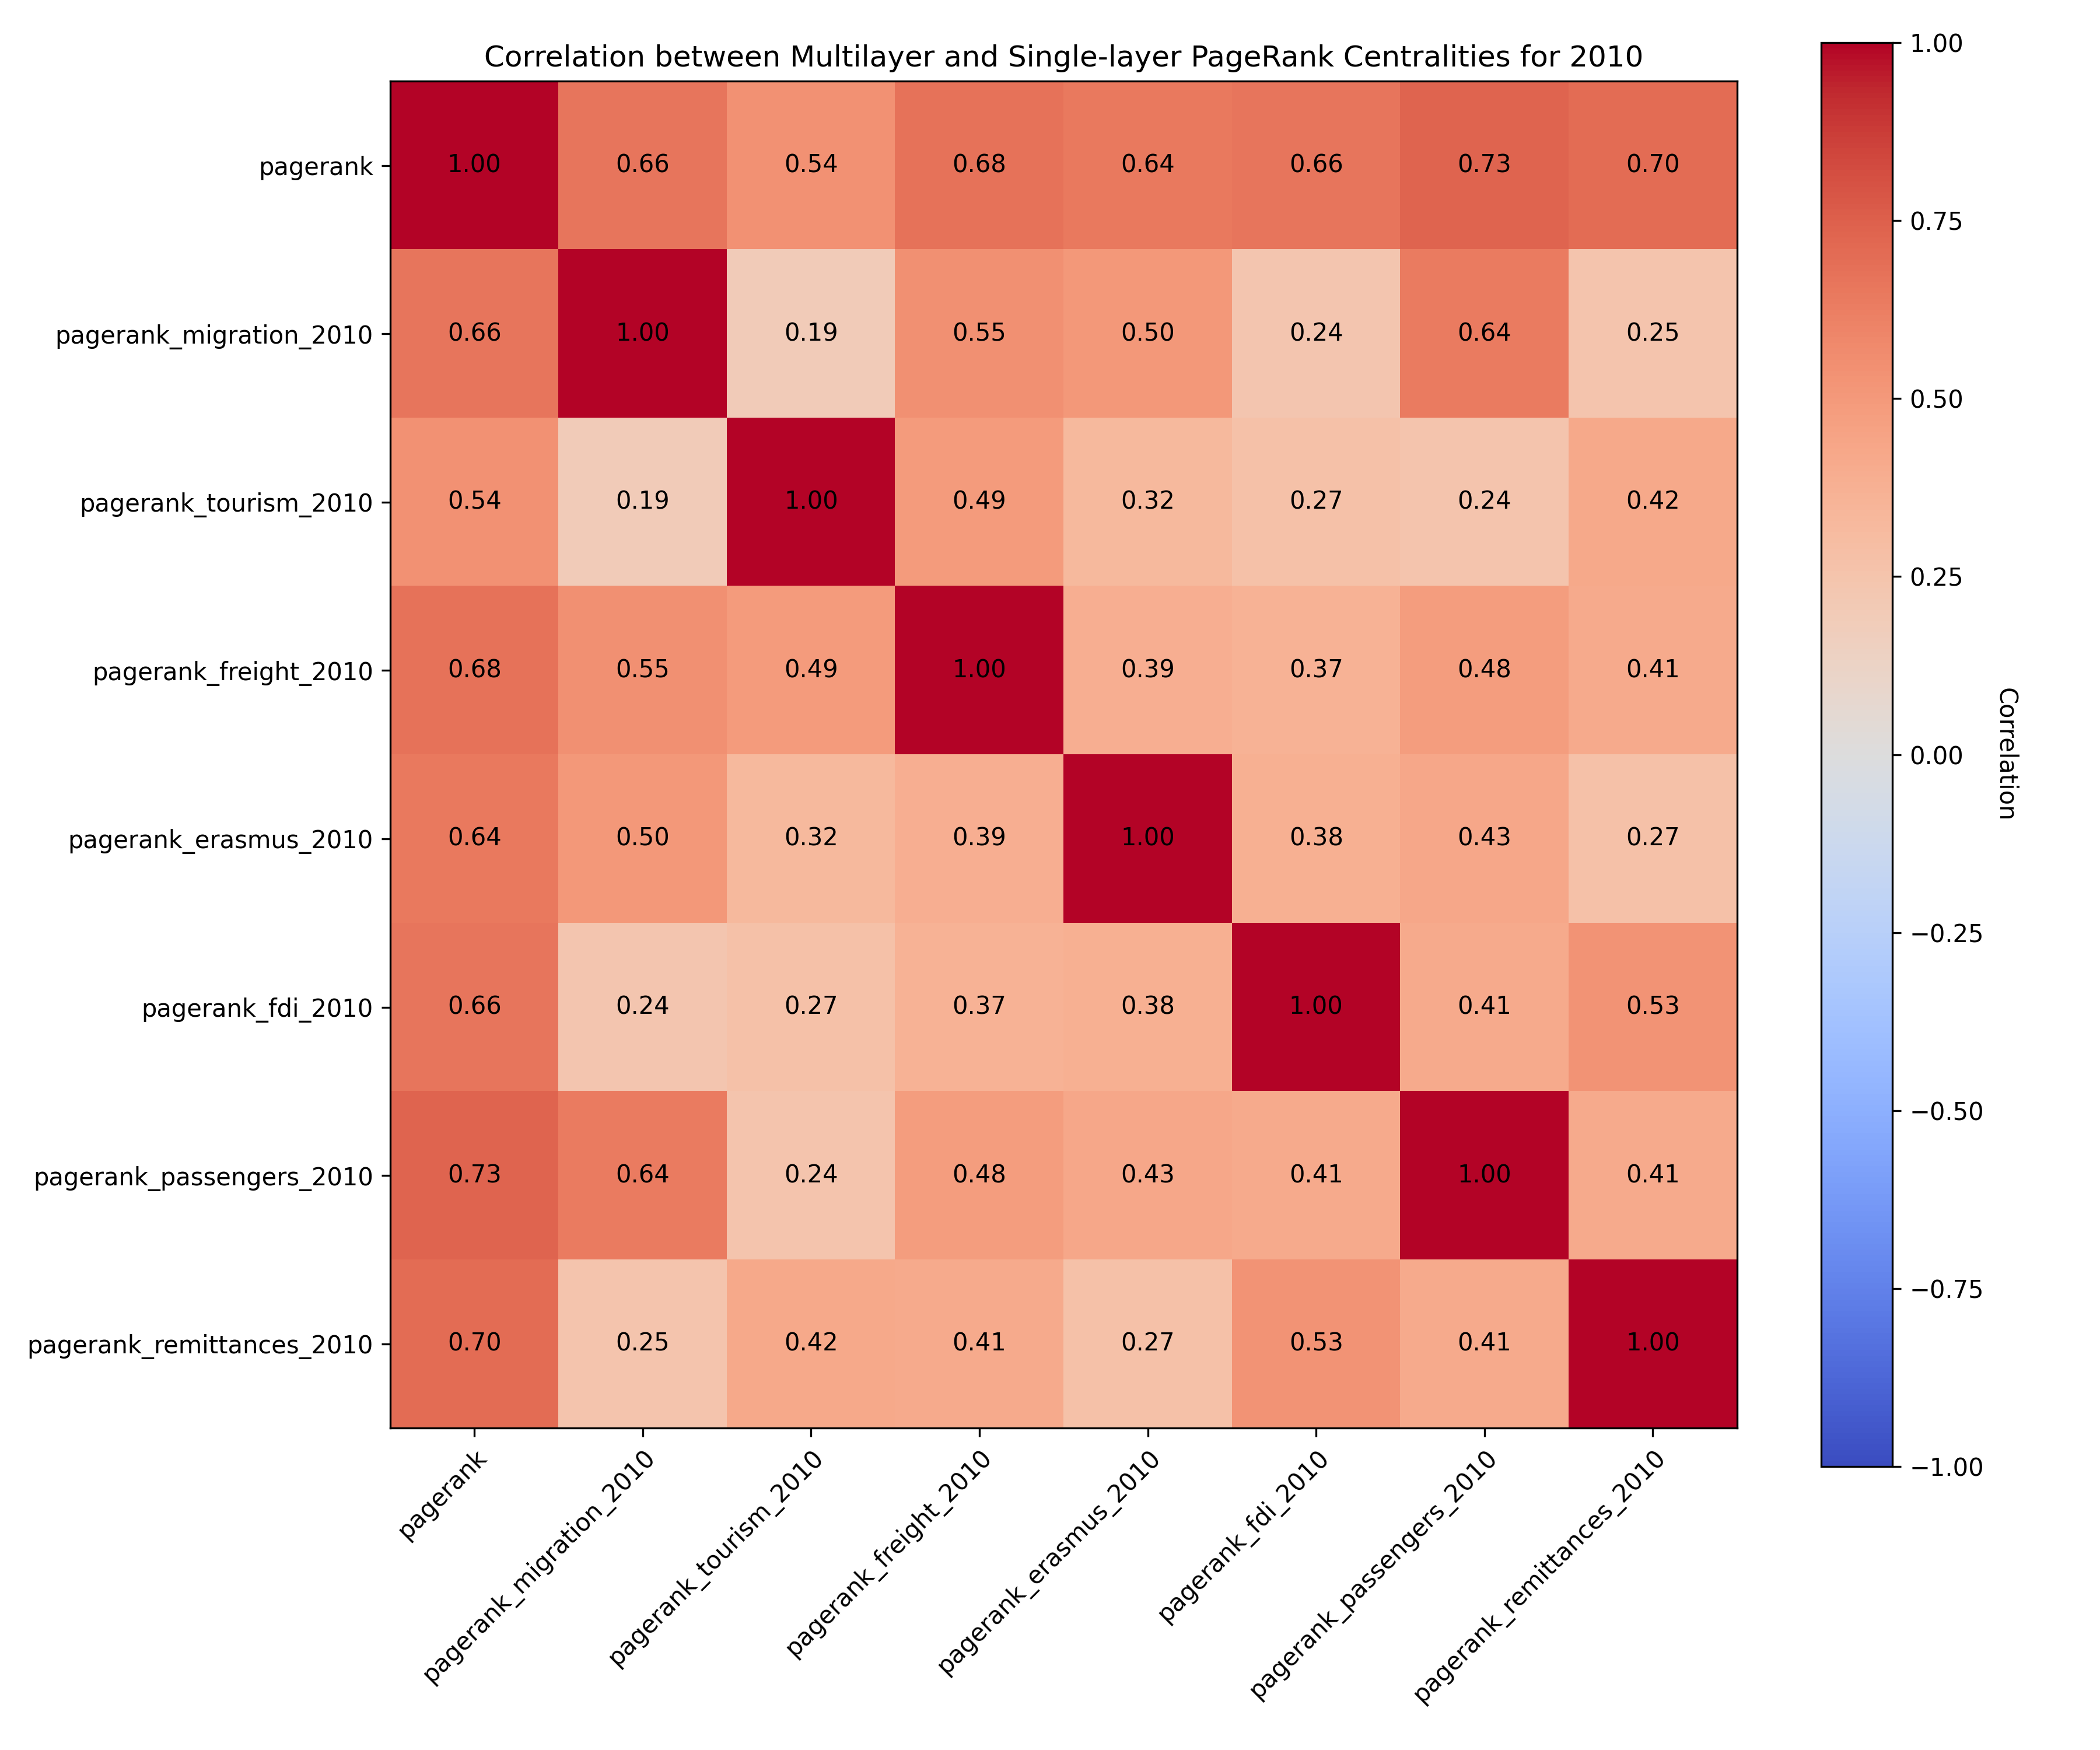
Fig. 19 displays the correlations between single-layer PageRank values and the multiplex PageRank for various flow types in 2010. The Spearman correlation coefficients range from 0.54 to 0.73, indicating moderate positive relationships between individual layer centralities and the overall multiplex centrality.
S3.3 Community Detection
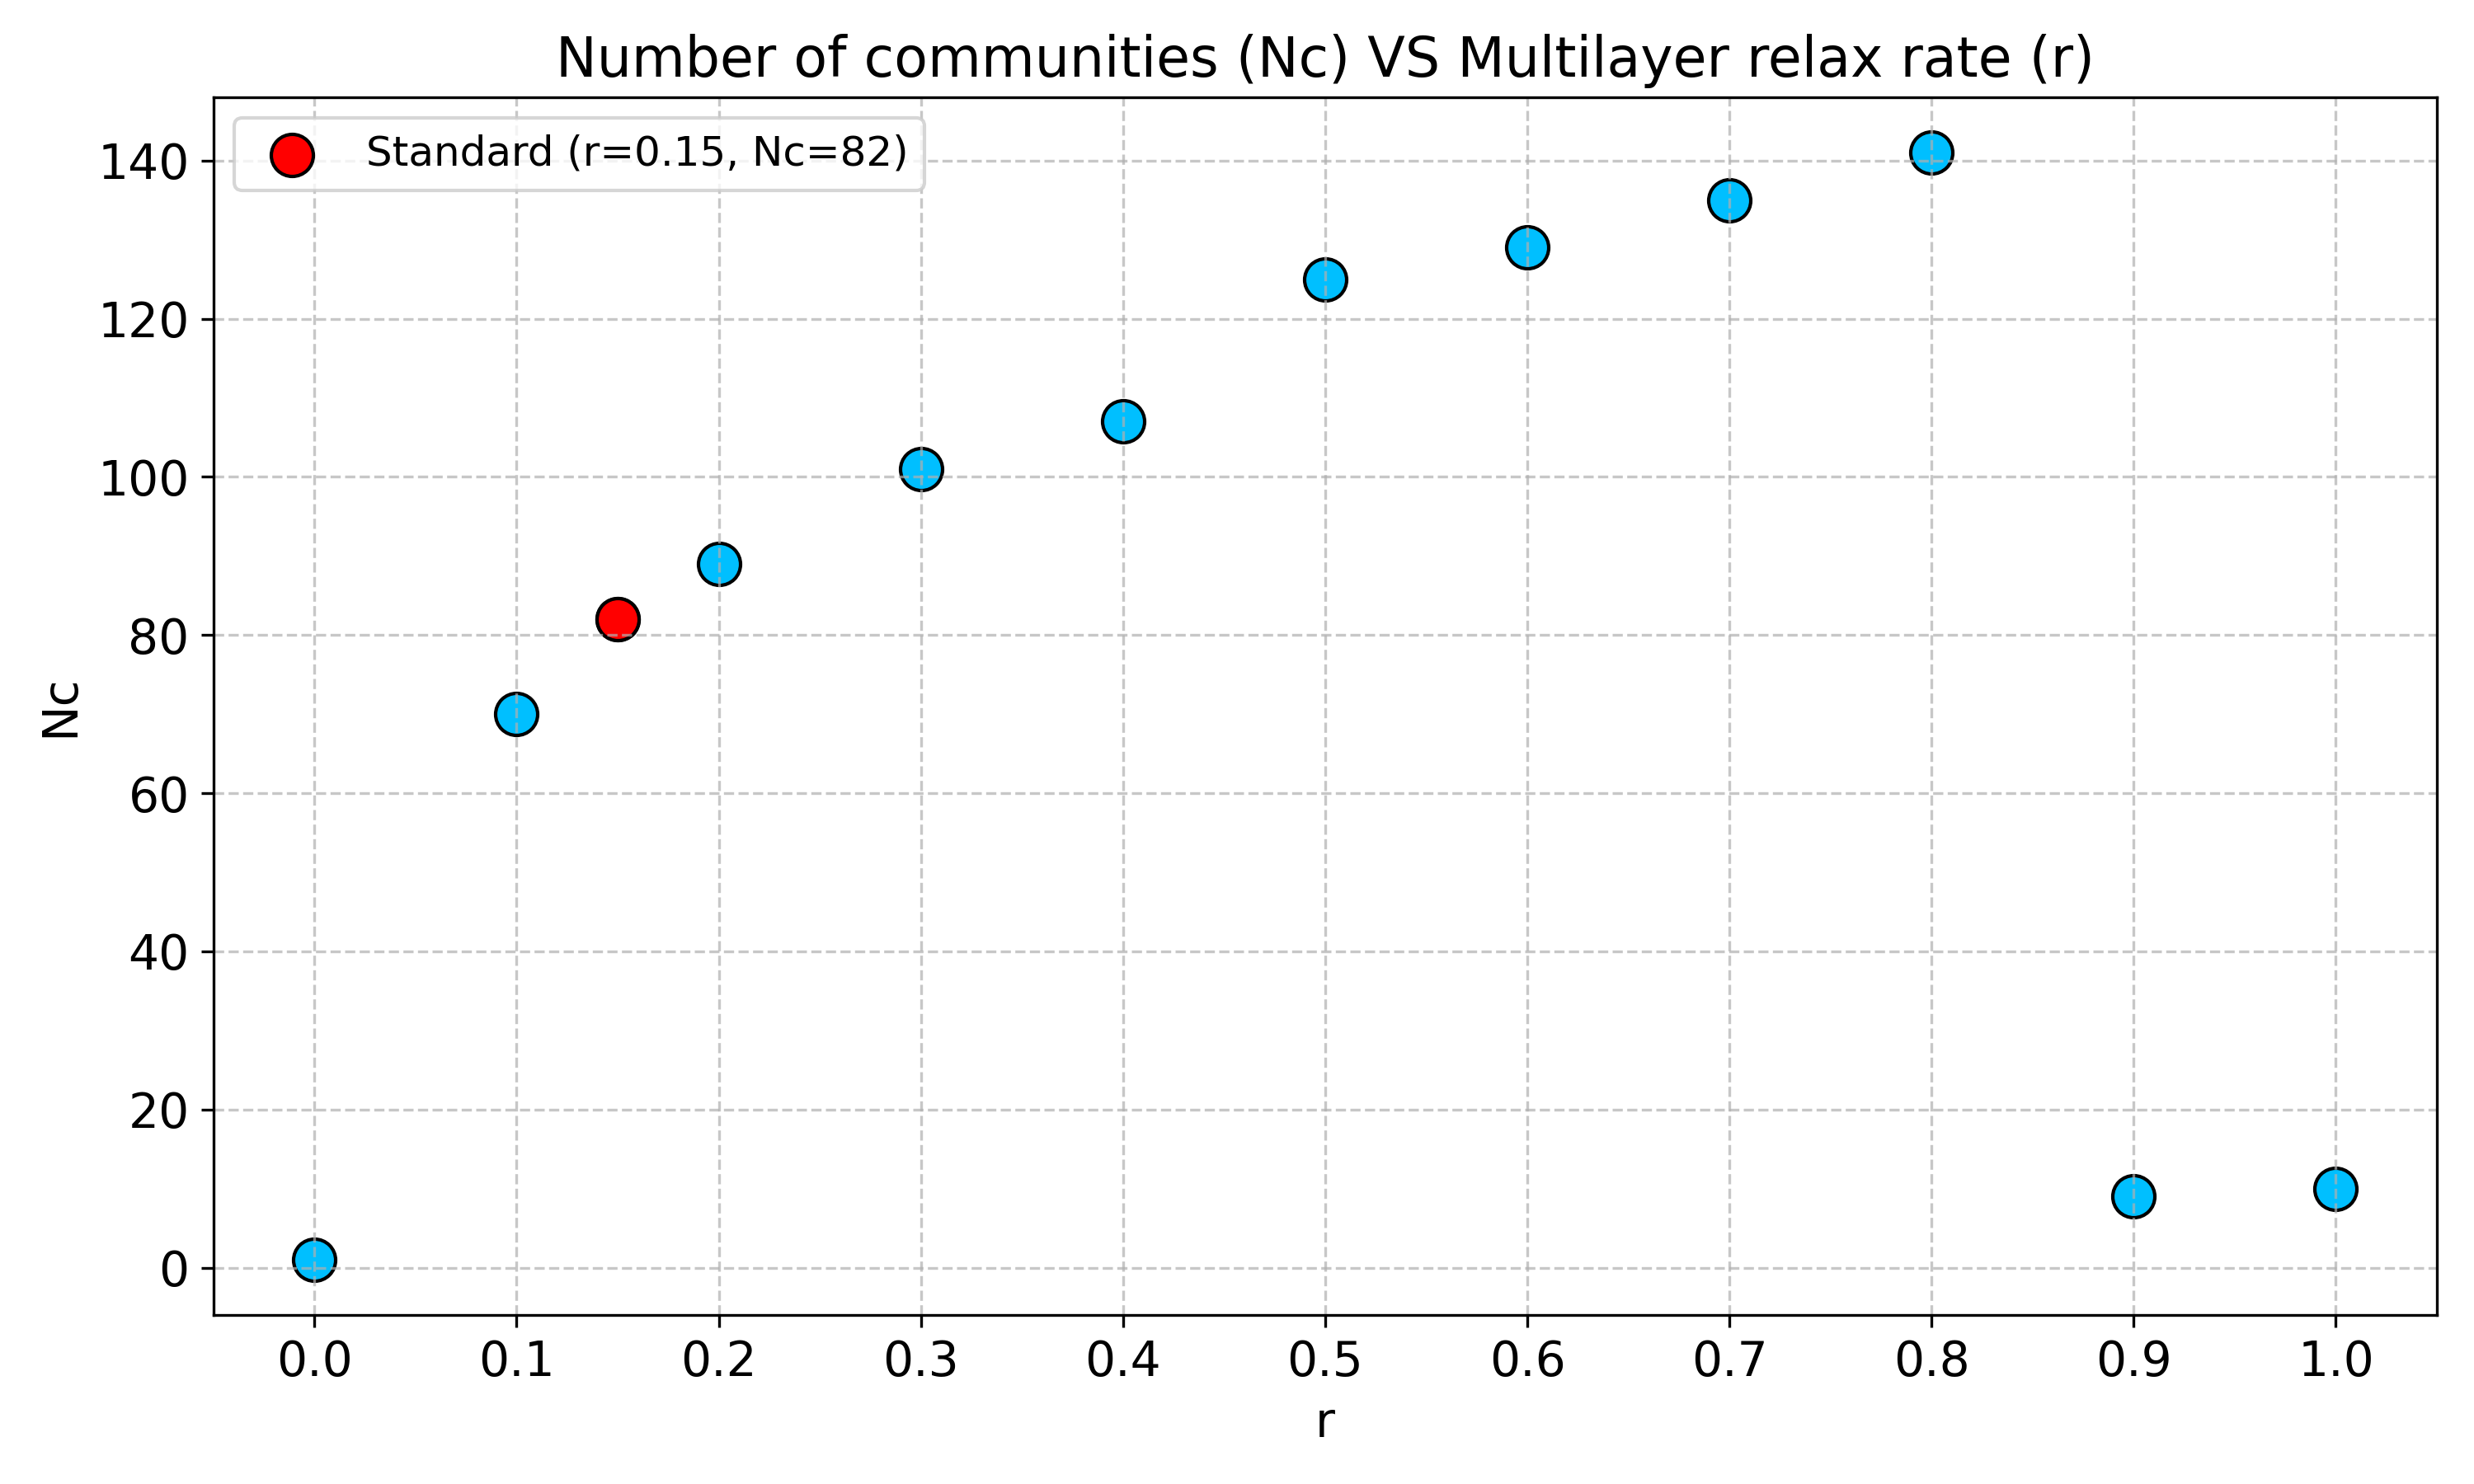
Fig. 20 illustrates the relationship between the number of communities and the multilayer relax rate for 2010, showing that the range around the standard value (from 0.1 to 0.2) yields a relatively stable number of communities, varying from 70 to 89. Generally, increasing the relax rate r leads to a higher number of communities, until it reaches an extremely high value (0.9), at which point the number of communities sharply decreases to around 10.
NUTS ID Community NUTS ID Community NUTS ID Community NUTS ID Community NUTS ID Community NUTS ID Community FRM0 1 BE23 4 CY00 8 HU23 14 DE11 23 DE93 40 FR10 1 BE22 4 UKK1 8 HU31 14 DE12 23 UKK4 41 FRL0 1 BE21 4 UKJ4 8 HU33 14 DE14 23 UKK3 41 FRE2 1 BE10 4 UKJ2 8 HU22 14 DE13 23 DE24 42 FRY3 1 NL34 4 UKJ3 8 HU32 14 UKN0 24 DE25 42 FRB0 1 BE25 4 RO11 9 HU12 14 IE04 24 DE94 43 FRK2 1 LU00 4 RO41 9 HU11 14 IE05 24 DED2 44 FRJ1 1 ITC2 5 RO21 9 HU21 14 IE06 24 DEG0 45 FRI3 1 ITC1 5 RO32 9 DK04 15 UKE2 25 FRF1 46 FRI2 1 ITH3 5 RO31 9 DK02 15 UKE3 25 FRY1 47 FRI1 1 ITC4 5 RO42 9 DK03 15 UKE4 25 FRY2 47 FRH0 1 ITI4 5 RO12 9 DK01 15 UKC2 25 DED4 48 FRJ2 1 ITF5 5 RO22 9 DK05 15 UKC1 25 FRF3 49 FRG0 1 ITF6 5 AT11 10 HR03 16 UKE1 25 ES62 50 ES70 2 ITF2 5 AT34 10 MT00 16 DE60 26 FRD2 51 ES64 2 ITI1 5 AT33 10 SI03 16 DE80 26 FRF2 52 ES63 2 ITH5 5 AT12 10 SI04 16 DEF0 26 ITF3 53 ES61 2 NL32 6 AT13 10 HR04 16 DE27 27 DE73 54 ES53 2 NL11 6 AT21 10 NO06 17 DE21 27 DEA4 55 ES51 2 NL12 6 AT22 10 NO02 17 UKD1 28 ITC3 56 ES42 2 NL13 6 AT32 10 NO03 17 UKD6 28 FRC1 57 ES23 2 NL21 6 AT31 10 NO05 17 UKD3 28 DEC0 58 ES24 2 NL33 6 SE23 11 NO07 17 UKD4 28 FRY4 59 ES30 2 NL42 6 SE33 11 NO04 17 UKD7 28 FRY5 59 ES41 2 NL31 6 SE21 11 NO01 17 UKM9 29 ITF4 60 ES11 2 NL23 6 SE22 11 EE00 18 UKM5 29 DE23 61 ES52 2 NL22 6 SE12 11 LV00 18 UKM6 29 DE72 62 PL62 3 NL41 6 SE11 11 LT02 18 UKM7 29 DE26 63 PL51 3 CZ06 7 SE32 11 LT01 18 UKM8 29 FRC2 64 PL52 3 SK04 7 FI20 11 CH04 19 DE30 30 DE22 65 PL61 3 CZ02 7 SE31 11 LI00 19 DE40 30 ITG1 66 PL63 3 CZ04 7 EL65 12 CH03 19 UKG3 31 ITI3 67 PL71 3 CZ03 7 EL53 12 CH05 19 UKG1 31 ITH2 68 PL72 3 CZ01 7 EL52 12 CH01 19 UKG2 31 ES22 69 PL81 3 CZ07 7 EL51 12 CH02 19 UKF1 32 ITI2 70 PL92 3 SK01 7 EL54 12 CH06 19 UKF2 32 DEB2 71 PL91 3 SK02 7 EL42 12 BG32 20 UKF3 32 ITH1 72 PL82 3 SK03 7 EL41 12 BG31 20 DE91 33 ITH4 73 PL43 3 CZ05 7 EL30 12 BG42 20 DE92 33 ITG2 74 PL41 3 CZ08 7 EL61 12 BG33 20 DE71 34 FRK1 75 PL42 3 UKH3 8 EL62 12 BG34 20 DEB1 35 PT15 76 PL84 3 UKJ1 8 EL63 12 BG41 20 DEB3 35 FRD1 77 PL21 3 UKK2 8 EL64 12 DEA2 21 DED5 36 ITF1 78 PL22 3 UKH1 8 EL43 12 DEA3 21 DEE0 36 ES43 79 BE35 4 UKH2 8 PT30 13 DEA5 21 ES12 37 ES13 80 BE34 4 UKI3 8 PT11 13 DEA1 21 ES21 37 CH07 81 BE33 4 UKI4 8 PT16 13 FI1D 22 UKL2 38 IS00 82 BE32 4 UKI5 8 PT17 13 FI1C 22 UKL1 38 BE31 4 UKI6 8 PT18 13 FI1B 22 FRE1 39 BE24 4 UKI7 8 PT20 13 FI19 22 DE50 40
Table 14 presents the results of the Infomap community detection analysis.