GaGA: Towards Interactive Global Geolocation Assistant
Abstract
Global geolocation, which seeks to predict the geographical location of images captured anywhere in the world, is one of the most challenging tasks in the field of computer vision. In this paper, we introduce an innovative interactive global geolocation assistant named GaGA, built upon the flourishing large vision-language models (LVLMs). GaGA uncovers geographical clues within images and combines them with the extensive world knowledge embedded in LVLMs to determine the geolocations while also providing justifications and explanations for the prediction results. We further designed a novel interactive geolocation method that surpasses traditional static inference approaches. It allows users to intervene, correct, or provide clues for the predictions, making the model more flexible and practical. The development of GaGA relies on the newly proposed Multi-modal Global Geolocation (MG-Geo) dataset, a comprehensive collection of 5 million high-quality image-text pairs. GaGA achieves state-of-the-art performance on the GWS15k dataset, improving accuracy by 4.57% at the country level and 2.92% at the city level, setting a new benchmark. These advancements represent a significant leap forward in developing highly accurate, interactive geolocation systems with global applicability.
1 Introduction
Global geolocation aims to predict the exact location of any street-view image. It is widely applicable in security surveillance, emergency response, environmental monitoring, and tourism navigation. This process requires integrating visual cues from the image with geographic knowledge, including road signs, architectural styles, climate, and vegetation, to accurately predict GPS coordinates or location labels. For images featuring landmarks or stylized architecture, judgments can be made by combining rich visual features with relevant contextual knowledge. In contrast, the challenge increases for highways or homogenous natural environments that lack distinctive features, requiring reliance on subtle geographic clues like road markings, license plate types and signage to determine the geolocation.
Existing street view geographic localization methods can be broadly categorized into two types: retrieval-based and classification-based. Retrieval-based methods (Zhang, Sultani, and Wshah 2023; Zhu, Shah, and Chen 2022) determine location by matching the input image with similar images in a geotagged database, but they rely heavily on the diversity and completeness of the database, posing challenges in data curation. Classification-based methods (Seo et al. 2018; Vivanco Cepeda, Nayak, and Shah 2024) divide the Earth’s surface into regions and classify images based on their visual features, assigning them to specific regions, but they fail to provide explicit visual cues as justification. Traditional localization methods typically yield a single GPS coordinate or location label, lacking interpretability and interactivity, often leading to results that do not align with the user’s understanding and creating a poor user experience.
Large vision-language models (LVLMs) (Liu et al. 2023; Chen et al. 2023b; Peng et al. 2023) have demonstrated exceptional capabilities in tasks such as visual question answering or grounding text to the visual world. They are able to handle multi-modal inputs and integrate cross-domain information, particularly excelling in natural language interactions. We believe that LVLMs have the potential to be applied to geolocation task, leveraging their ability to fuse multi-modal information with natural language interaction to move beyond mere numerical or label outputs, thereby enhancing the credibility and flexibility of location. However, current LVLMs still face significant challenges in global geolocation, particularly in result interpretability, where there is considerable room for improvement.
A major contributing factor to this limitation is the scarcity of high-quality, geography-related image-text pairs: (i) Current datasets, such as OpenStreetView-5M (OSV-5M) (Astruc et al. 2024a), provide only basic, mechanical descriptions such as country, region, and city, without delving into the intricate geographic details necessary for accurate localization; (ii) Moreover, existing LVLMs datasets (Chen et al. 2023a; Gadre et al. 2023; Li et al. 2023) lack detailed descriptions of administrative boundaries, geographic coordinates, and other location-specific elements. They typically focus on general scene descriptions rather than the specific geographic cues critical for localization. Furthermore, these datasets do not employ a question-answer format that could help explore and clarify geographic elements within images, leading to a failure to capture the nuanced information necessary for deep insight and precise localization. To address these challenges, we introduce the Multi-modal Global Geolocation (MG-Geo) dataset, a comprehensive and high-quality dataset composed of 5 million geographic dialogue data, divided into 3 key parts. Leveraging this dataset, we develop Global Geo-location Assistant (GaGA), a novel Large Visual Language Model (LVLM) designed to overcome the limitations of poor explainability and low insight in geographic localization tasks. GaGA aims to enhance both the credibility and accuracy of localization results.
The training of GaGA is carried out in two distinct phases: Geographic Classification Enhancement and Interactive Correction Enhancement. In the first phase, we pretrain an LVLM using 4.87 million image-location pairs from the Global Geolocation Dataset. This pretraining phase injects geographic knowledge into the model, strengthening its ability to understand and classify geographic locations. In the second phase, we fine-tune the LVLM using a curated subset of more than 70k image-clue location pairs and more than 73k image-clue multi-turn Q&A pairs. This phase, facilitated by the QLoRA (Dettmers et al. 2024) technique, focuses on enhancing the model’s ability to interactively correct and refine its localization outputs through dialogue, thereby addressing the shortcomings in explainability and insight observed in previous models. Experimental results demonstrate that GaGA not only significantly outperforms similar LVLMs on the GWS15k dataset but also surpasses the current state-of-the-art model, OSV-5M-Baseline, in predicting administrative boundaries, with improvements of 4.57% and 2.92% at the country and city levels, respectively. In terms of latitude and longitude coordinate predictions, GaGA achieves comparable performance. Notably, GaGA possesses the capability to refine its responses in interactive scenarios. When users provide effective guidance or correct priors, its localization accuracy improves substantially.Our work makes several key contributions:
-
•
We present MG-Geo, a 5-million image-text pair dataset designed to bridge the gap in geography-related data for LVLMs. This dataset enhances explainability and interactive correction in geographic localization, setting a new standard for LLM applications in this field.
-
•
We introduce GaGA, a groundbreaking global geolocation assistant built on an advanced LVLM. GaGA offers exceptional interpretability and enhances performance through interactive dialogue. It marks a significant advance in using LVLMs for geographic localization, delivering more accurate and reliable results.
-
•
We leverage the vast geographical knowledge of Large Vision-Language Models (LVLMs) for global geolocation and propose a new paradigm of interactive reasoning to enhance geolocation accuracy.
2 Related Work
2.1 Geolocation Dataset
In the domain of geolocation, the localizability of images within datasets is of paramount importance. Existing datasets, such as Im2GPS3k (Hays and Efros 2008a), YFCC4K (Vo, Jacobs, and Hays 2017), and MP-16 (Theiner, Müller-Budack, and Ewerth 2022), though composed of a wealth of geotagged images, contain many unlocatable images and exhibit distribution biases. GWS15k (Clark et al. 2023) mitigates distribution differences, and ensures that the images are authentic, localizable street views; however, this dataset is not open-source. OSV-5M (Astruc et al. 2024a) is the largest open-source collection of planet-scale, localizable street view images. The Google Landmark V2 (Weyand et al. 2020) dataset contains globally distributed human-made and natural landmarks, showcasing iconic landscapes.
We propose MG-Geo, the first open-source multimodal geolocation dataset. Curated from OSV-5M and Google Landmark V2, MG-Geo offers a clean, evenly distributed resource. It also incorporates well-structured global language knowledge, providing a dataset that better reflects the complexity and diversity of real-world geolocation challenges.
2.2 Geolocation Models
Mainstream geolocation methods can be broadly categorized into two approaches: image-based retrieval methods and classification-based methods. Image-to-image retrieval techniques rely on dense image retrieval libraries, performing well for localization tasks within small areas, but the cost of constructing such retrieval libraries on a global scale is prohibitively high. When geolocation is treated as a classification task, categories can be defined based on administrative regions, divided into geocells according to specific rules, or discretized into latitude and longitude coordinates. TransLocator (Wu et al. 2020) employs both images and their semantic segmentation maps as inputs, facilitating interaction between two parallel branches after each Transformer layer, enabling multitask geolocation and scene recognition. GeoCLIP (Vivanco Cepeda, Nayak, and Shah 2024) introduces a location encoder, applying random Fourier feature representations to latitude and longitude coordinates, utilizing the pretrained CLIP (Radford et al. 2021) visual encoder to represent images and align them with corresponding location features for localization. Pigeon (Haas et al. 2024) is a method that classifies within self-created geocell and retrieves locations within clusters.
In recent years, some works have begun to explore the potential of natural language in geolocation tasks. G3 (Luo et al. 2022) predicts the country of an image by automatically extracting clues from human-written guidebooks. StreetCLIP (Haas, Alberti, and Skreta 2023) employs captions containing geolocation information for contrastive learning, enabling the use of natural language to ground CLIP in the context of image geolocalization. GeoReasoner (Li et al. 2024) is the first work to fine-tune a Vision-Language Model (VLM) for street view image localization. Unlike GeoReasoner, our model is fine-tuned on a planet-scale, multimodal dataset of localizable images, which is not confined to narrow distributions and also proposes an interactive approach to accomplish the localization task.
3 Multi-modal Global Geolocation Dataset
We aim to build a Multi-modal Global Geolocation (MG-Geo) dataset to support more VLMs in acquiring the ability to identify where the image was taken. In this section, we provide a detailed exposition of the process involved in creating the MG-Geo dataset, which consists of three parts: the Meta Part, the Clue Part and the Dialog Part. We present a more detailed comparison and analysis of the Clue Part and Dialog Part in appendix.
3.1 Meta Part
In the Meta Part, images and meta-geographic information are taken from the OSV-5M, which inherits its characteristics of good distribution, wide scope, and high quality. After removing a small number of samples with incomplete location annotations, we organize each sample into JSON format using three levels of administrative boundaries—country, region, and city. This results in a total of 4.87 million entries, covering 70k cities, 2.7k regions, and 210 countries.
3.2 Clue Part
We designed our model to generate textual clues from geographical features in images, enhancing output interpretability. Users can assess and correct these clues during interactions, providing additional information to improve the model’s accuracy.
To the best of our current knowledge, no work has attempted to construct large-scale image-textual clue pair datasets. To this end, we use the guidelines of the interactive geolocalization game GeoGuessr as a clue repository for street view images, and propose a pipeline to obtain textual clues for each image, which can guarantee a high degree of correlation between the image content and textual clues, as is illustrated in Fig. 2.
GeoGuessr Database. Textual clues are crucial in geolocation tasks, helping to quickly identify the general country or region within images. Derived from community insights, these clues aid in rapid location determination. GeoGuessr, a popular geolocation game, challenges players to analyze street scene clues to predict GPS coordinates or countries. The game’s global popularity has led to the formation of communities where players share strategies, such as noting that “The central region of Argentina is flat with grass fields, while the south becomes drier and rockier.”
Leveraging this vibrant community resource, we extracted over 3,000 well-structured and information-rich visual clues from the website, encompassing 132 countries.
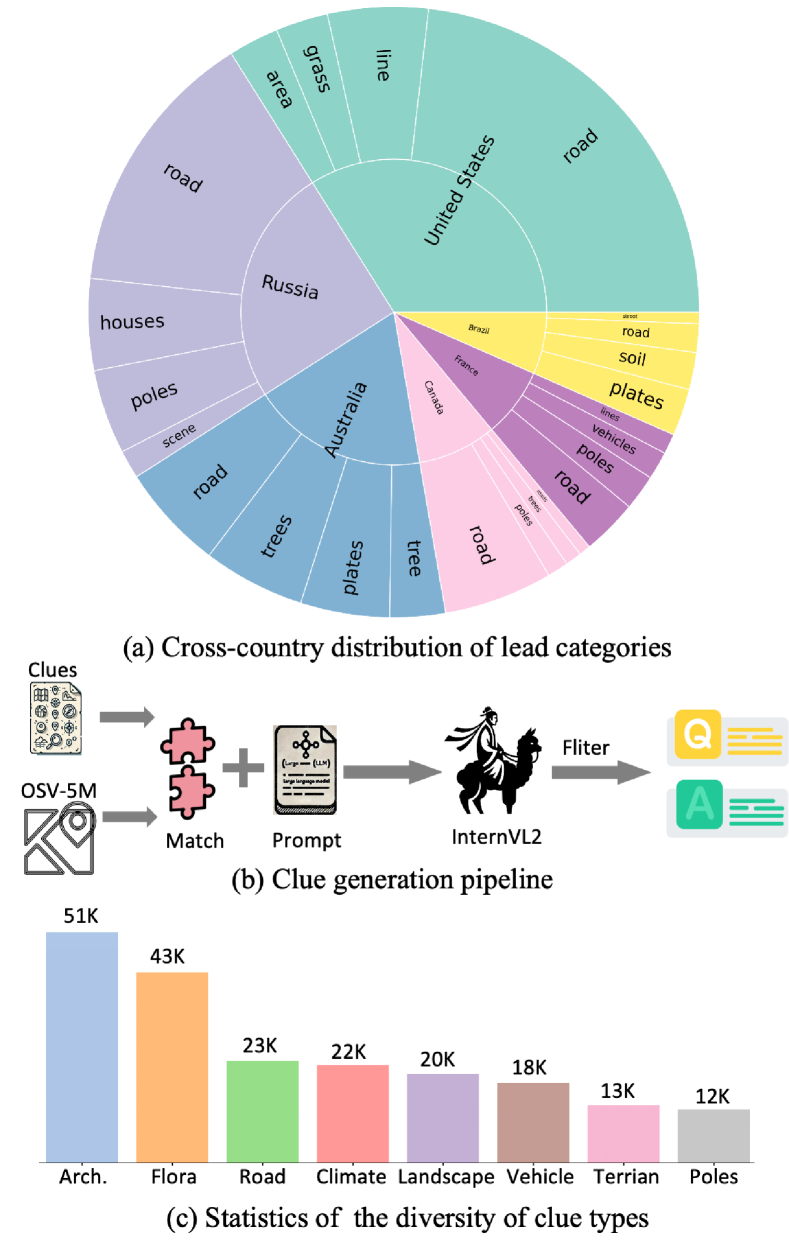
Clue generation pipeline. Fig. 3(b) shows an automated pipeline for generating high-correlated image-text clues pairs. We utilize InternVL2-26b (Chen et al. 2024) to generate image-text clue pairs based on street view images and the GeoGuessr Database. To ensure the quality and relevance of the generated pairs, our pipeline incorporates system messages, visual annotations, and the GeoGuessr database as prompts for InternVL2. System messages define the desired tone and style, while the GeoGuessr Database provides essential geographic traits such as architectural styles and vegetation characteristics. To ensure general distribution and locatability, we employed the sampling method from (Clark et al. 2023) to select samples from the OSV-5M dataset, yielding 70K globally distributed samples and eliminating noisy data from previously collected geographic clues.
In step 1, we categorize each clue by country, ensuring that each nation had its own set of specific clues. In Step 2, we pair the images with the corresponding geographic clues of each country and, together with the prompt, input them into InternVL2 to guide the model in selecting and summarizing geographic clues that aid in location recognition, facilitating further analysis. This phase only concludes when the selected clues are corroborated by identifiable features in the images, ensuring the final output includes geographic clues for each sample. Fig. 3(c) shows the distribution of the geographic clues in responses.
3.3 Dialog Part
Data sources. The supervised fine-tuning high-quality captions for multi-turn inquiries about landmarks were collected from GPT4-V. The images are derived from a well-annotated subset of the Google Landmarks dataset, which includes nearly 73K samples. The choice of the Google Landmarks dataset stems from the high recognizability of landmark data, which enables the extraction of extensive geographic and cultural information embedded within images. Such information is often crucial for users in real-world applications. For each image selected from Google Landmarks dataset , we employ a meticulously crafted prompt . This prompt instructs GPT4-V to conduct multiple rounds of self-questioning around pictures to uncover detailed geographic information.
Prompt Design. Given the diversity of geolocated images in the Google Landmarks dataset, we aim to obtain highly relevant information through Q&A dialogues regardless of the country or region from which the images originate. This means that the descriptions of the images should not only cover their visible appearance and attributes but also include related knowledge, climatic characteristics, architectural styles, and even historical context. This comprehensive approach ensures that the dataset can effectively support a wide range of real-world applications by providing enriched and contextually relevant data. Besides, multiple rounds of dialog can be used to dig deeper into the design features in an image. For instance, an image of a typical suburban house in Chicago might feature a steep gable roof designed to handle snowfall, reflecting the cold climate typical of four regions in North America. The use of stone, wood, and skylights in the house’s construction suggests it is located in an area with distinct seasons. The growth and maintenance of surrounding vegetation indicate ample rainfall in the region. Additionally, the spacious garden design, single-family house style, and separation between houses further suggest a suburban area in Chicago.
To ensure the quality and consistency of the Q&A dialogues, we designed a system prompt for general descriptions and defined a specific task for the Google Landmarks data. This task aims to facilitate Q&A dialogues and progressively uncover geographic clues in the images, as demonstrated in Appendix, the system prompt requires GPT4-V to play both the player and the quizmaster roles in a GeoGuessr game. The quizmaster guides the player to analyze images in depth and extract clues, with responses covering aspects such as environment and climate, architecture and landmarks, language and culture, and people’s appearances. Each sample involves four rounds of Q&A. The first three rounds pose challenging questions about visible geographic elements, guiding location predictions without revealing visual details. Answers should include clear reasoning steps. In the fourth round, the player makes an explanatory best guess based on prior analysis and reasoning.
4 Methodology
GaGA is a multi-modal large language model designed for geolocation. Unlike existing open-source models like Llama3 (AI@Meta 2024) and Qwen-VL, GaGA has geolocation capabilities and can engage in dialogue with users. The geolocation capability means the model can accept user-captured street view images as input and output the image’s country, region, city, and latitude/longitude coordinates, along with the reasoning behind the determined location. The dialogue capability allows the model to engage with users after providing the geolocation. Users can share their understanding of the location based on their knowledge, enabling a conversation with GaGA to correct any inaccuracies in the model’s reasoning, thereby improving the geolocation accuracy.
GaGA uses the same model architecture and training objectives as LLaVA. We enhanced the model’s geolocation ability by adding image-geolocation pairs (Meta Part) to the pretraining data. For fine-tuning, we included image-dialogue pairs (Dialog Part) and image-textual clue pairs (Clue Part) to enable the model to output clues and refine its geolocation based on user-provided information.
4.1 Model Architecture
GaGA consists of an image encoder for extracting features from street view images, a large language model (such as Llama3), a visual projection layer , and a text tokenizer . We selected the pretrained Llama3-8B as because it excels in mapping coordinates to geographic names among publicly available LLMs.
For input images , we chose the pretrained CLIP vision encoder ViT-L/14-336, which provides the visual features of geographic images . The trainable visual projection layer is used to capture visual features from street view images. We connect these image features to the word embedding space. Specifically, we trained a projector to encode the unified visual representation into language embedding tokens , which have the same dimensions as the word embedding space in the language model:
| (1) |
These tokens are then combined with tokenized text queries and fed into the large language model to generate corresponding responses :
| (2) |
4.2 Model Training
The training process of GaGA is divided into two stages: pretraining and finetuning. During the pretraining stage, our objective is to equip the model with an intuitive comprehension of images from diverse regions. To achieve this, we train the model on data from the Meta Part while keeping the vision encoder and LLM parameters frozen, updating only the parameters of the projector. The projector’s parameters are initialized using the sharegpt4V data. In the finetuning stage, our objective shifts to enabling the model to effectively analyze geographical images and engage with users. At this stage, We fix the parameters of the projector and apply QLoRA for finetuning the LLM. The finetuning dataset includes a subset of the Meta Part, along with the Clue Part and Dialog Part, resulting in a final dataset containing 240k image-text pairs.All experiments were performed based on the XTuner (Contributors 2023b), using the LMDeploy (Contributors 2023a) for efficient reasoning. The setting of hyperparameters is in the Appendix.
5 Experiment
We design a series of experiments to comprehensively evaluate GaGA’s performance in geolocation and its mastery of world geographic knowledge. First, we assess GaGA’s geolocation capabilities (Sec. 5.1). Next, we simulate the impact of human interaction on model’s performance in real-world dialogue scenarios (Sec. 5.2). Finally, we conduct several ablation studies for further analysis (Sec. 5.3).
5.1 Geolocation Performance
Benchmark. GWS15k is a high-quality benchmark with well-distributed global coverage. However, due to it not being open-source, we have reproduce it in this study. Details of the reproduction and the pseudocode are provided in the Appendix. The images and meta-geographical information are inherited from the OSV-5M test set.
| Method |
|
Recall | Classification Accuracy | ||||
| Country | Region | City | |||||
| LLaVA-Llama3† | hier | 0.99 | 1.76 | 0.26 | 0.02 | ||
| InternVL2† | hier | 0.96 | 24.74 | 4.20 | 0.48 | ||
| Qwen-VL† | hier | 0.98 | 34.20 | 8.19 | 1.45 | ||
| GeoReasoner† | hier | 1 | 40.63 | 9.57 | 1.11 | ||
| StreetCLIP | hier | 1 | 40.11 | 10.75 | 3.02 | ||
| OSV-5M-Baseline | dire | 1 | 58.49 | 29.58 | 3.36 | ||
| GaGA† | dire | 1 | 63.06 | 27.95 | 6.28 | ||
| Method | Coordinates Accuracy (% @ km) | Geoscore | ||||
| 1km | 25km | 200km | 750km | 2500km | ||
| ISNs | 0.05 | 0.6 | 4.2 | 15.5 | 38.5 | - |
| Translocator | 0.5 | 1.1 | 8 | 25.5 | 48.3 | - |
| GeoDecoder | 0.7 | 1.5 | 8.7 | 26.9 | 50.5 | - |
| GeoCLIP★ | 0.2 | 3.1 | 15.4 | 40.3 | 71.2 | 2345.2 |
| PIGEON | 0.7 | 9.2 | 31.2 | 65.7 | 85.1 | - |
| OSV-5M-Bs★ | 0.08 | 14.9 | 39.3 | 56.2 | 74.4 | 2944.9 |
| GaGA★ | 0.1 | 8.5 | 33.9 | 60.6 | 82.2 | 3113.0 |
| Model | Coordinates Accuracy | Classification Accuracy | ||||||
| 1km | 25km | 200km | 750km | 2500km | Country | Region | City | |
| OSV-5M-Baseline | 0.108 | 17.058 | 47.606 | 66.270 | 81.180 | 67.430 | 39.316 | 6.074 |
| GaGA | 0.068 | 8.021 | 40.061 | 67.982 | 85.396 | 71.499 | 37.867 | 7.467 |
Metrics. We employed three metrics to evaluate the prediction accuracy of the geolocation model:
-
•
Accuracy of predicted locations across administrative boundaries: country, region, area, and city
-
•
Accuracy of predicted coordinates within various distance thresholds: 1km, 25km, 200km, 750km, and 2500km, calculated as the haversine distance between the model’s predicted GPS coordinates and the ground truth.
-
•
Geoscore, based on the famous GeoGuessr game, defined as , represents the Haversine distance between predicted and ground truth image locations.
Evaluation Mode.We have hierarchical and direct evaluation modes. For VLMs that are not fine-tuned on MG-Geo, we constrain their representation of administrative boundaries during the prediction phase by employing a hierarchical approach and providing candidate administrative boundary names. For example, if the model correctly predicts the country, it is then given the names of all regions within that country for subsequent predictions. If the model’s prediction at the country level is incorrect, all predictions at lower levels, such as regions or cities, are also considered incorrect. Pseudocode are provided in the Appendix.
Analysis. The results of the administrative boundary prediction accuracy are shown in Table 1. To be clear, for LVLM-based methods, there is no guarantee consistently providing relevant answers. Therefore, we use recall rates to measure the proportion of valid answers in a large language model. GaGA demonstrates outstanding performance, surpassing the current state-of-the-art model, OSV-5M-Baseline, with a lead of 4.57% at the country level and 2.92% at the city level. It also achieves performance comparable to the best-performing models at the region level. Additionally, we compare GaGA with advanced Vision-Language Models (VLMs) such as LLaVA-Llama3, Qwen-VL (Bai et al. 2023), Intern VL2 (Chen et al. 2024) and GeoReasoner (Li et al. 2024). LLaVA-Llama3 serves as our baseline model, which adopts the LLaVA (Liu et al. 2023) architecture with Llama3 (AI@Meta 2024) as its language backbone. Due to the limited size of its training set, its performance on geolocation is significantly poor. For GeoReasoner, we use the “Clue Part” (73k samples) of MG-Geo and the SFT data (2k samples)111https://github.com/lingli1996/GeoReasoner provided by the original authors for “Reasoning Tuning,” along with 100k samples from the “Meta Part” of MG-Geo for “Location Tuning.” The results show that these state-of-the-art VLMs struggle to outperform GaGA in terms of location accuracy. StreetCLIP(Haas, Alberti, and Skreta 2023), a model based on the CLIP architecture, fine-tuned on street-view text data, also fails to outperform GaGA on the GWS15k dataset.
| Model | Prompt | Recall | Country | Region | City |
| GaGA | Direct inquiry | 1 | 64.89 | 27.97 | 7.67 |
| + Question | 1 | 61.24 | 29.25 | 8.22 | |
| -3.65 | +1.28 | +0.55 | |||
| + Q & A | 1 | 74.77 | 34.73 | 9.87 | |
| +9.88 | +6.76 | +2.2 | |||
| LLaVA-LlaMA3 | Direct inquiry | 0.99 | 2.92 | 0.54 | 0 |
| + Question | 0.99 | 4.38 | 0.54 | 0.05 | |
| +1.46 | 0 | +0.05 | |||
| + Q & A | 0.96 | 12.79 | 2.92 | 0.36 | |
| +9.87 | +2.38 | +0.36 |
| Model | Country | Region | City | Recall |
| LLaVA-Llama3 | 1.76 | 0.26 | 0.02 | 0.99 |
| GaGA-pretrain | 63.38 | 28.84 | 6.47 | 0.99 |
| GaGA-chat | 63.06 | 27.95 | 6.28 | 1.00 |
Table 2 presents the performance comparison of GaGA with ISNs (Muller-Budack, Pustu-Iren, and Ewerth 2018), Translocator, GeoDecoder (Qi et al. 2024), GeoCLIP (Vivanco Cepeda, Nayak, and Shah 2024), PIGEON (Haas et al. 2024), and OSV-5M-Baseline. If the discrepancies in the reproduction of GWS15k across different works are disregarded, GaGA performs relatively well in geolocation prediction, achieving the second-best performance across the 200km to 2500km threshold range. We evaluate the performance of OSV-5M-Baseline and GeoCLIP on the GWS15k dataset as reproduced in this work to provide a fairer comparison. GaGA outperforms OSV-5M-Baseline at the 1km, 750km, and 2500km granularities, and significantly outperforms GeoCLIP across the 25km to 2500km range. Meanwhile, GaGA achieves the highest Geoscore among the three models. Since the remaining works cannot be reproduced, we are unable to obtain the corresponding Geoscore for them.
In terms of output mechanism, Large Language Models (LLMs) are not particularly well-suited for predicting long floating-point numbers like latitude and longitude. These numbers are often split into multiple tokens, with the model generating each token sequentially during prediction, which can reduce the precision of the final floating-point output. As a result, GaGA’s prediction performance at the 1km and 25km thresholds is less than ideal.
5.2 Interactive Geolocation Analysis
Most geolocation models function as “black box” models, outputting predictions without explanations. GaGA, however, combines strong geolocation capabilities with the ability of large language models to integrate and associate world knowledge, enabling dynamic predictions during user interaction. Specifically, when a user asks about a geographic feature or provides prior information, GaGA can merge its world knowledge with the user’s input for more informed predictions. For further validation, we selected 547 well-annotated images covering both cultural and natural landscapes.
Using GPT-4V, we generated Q&A dialogues, ensuring that questions are closely related to visible geographical elements without directly providing visual details, guiding only location prediction. For example:“Considering the architectural design, what region of the world would you think displays such forms, and why?”
Table 4 presents the prediction performance after directly inquiring the geographic location from the VLM (Direct inquiry), providing a guiding question (+Question), and offering both the question and an effective answer (+Q&A). By comparing the performance of GaGA with its base model, LLaVA-Llama3, we observed that when a guiding question is provided (+Question), GaGA shows greater improvement at the region and city levels compared to LLaVA-Llama3, with the exception of the country level. When an effective prior is provided, GaGA exhibits a greater performance increase across all levels than LLaVA-Llama3. This indicates that GaGA has a distinct advantage in both generating geographic knowledge related to the question and understanding and integrating prior content to refine its predictions.
The decline in GaGA’s country-level localization performance under guided questioning is primarily due to the multiple valid responses to geographical feature questions. For example, similar architectural styles across European countries can confuse GaGA at the country level after answering such questions. Conversely, LLaVA-Llama3, with inherently lower country recognition accuracy, benefits from external knowledge, leading to improved performance by roughly adjusting the prediction range.
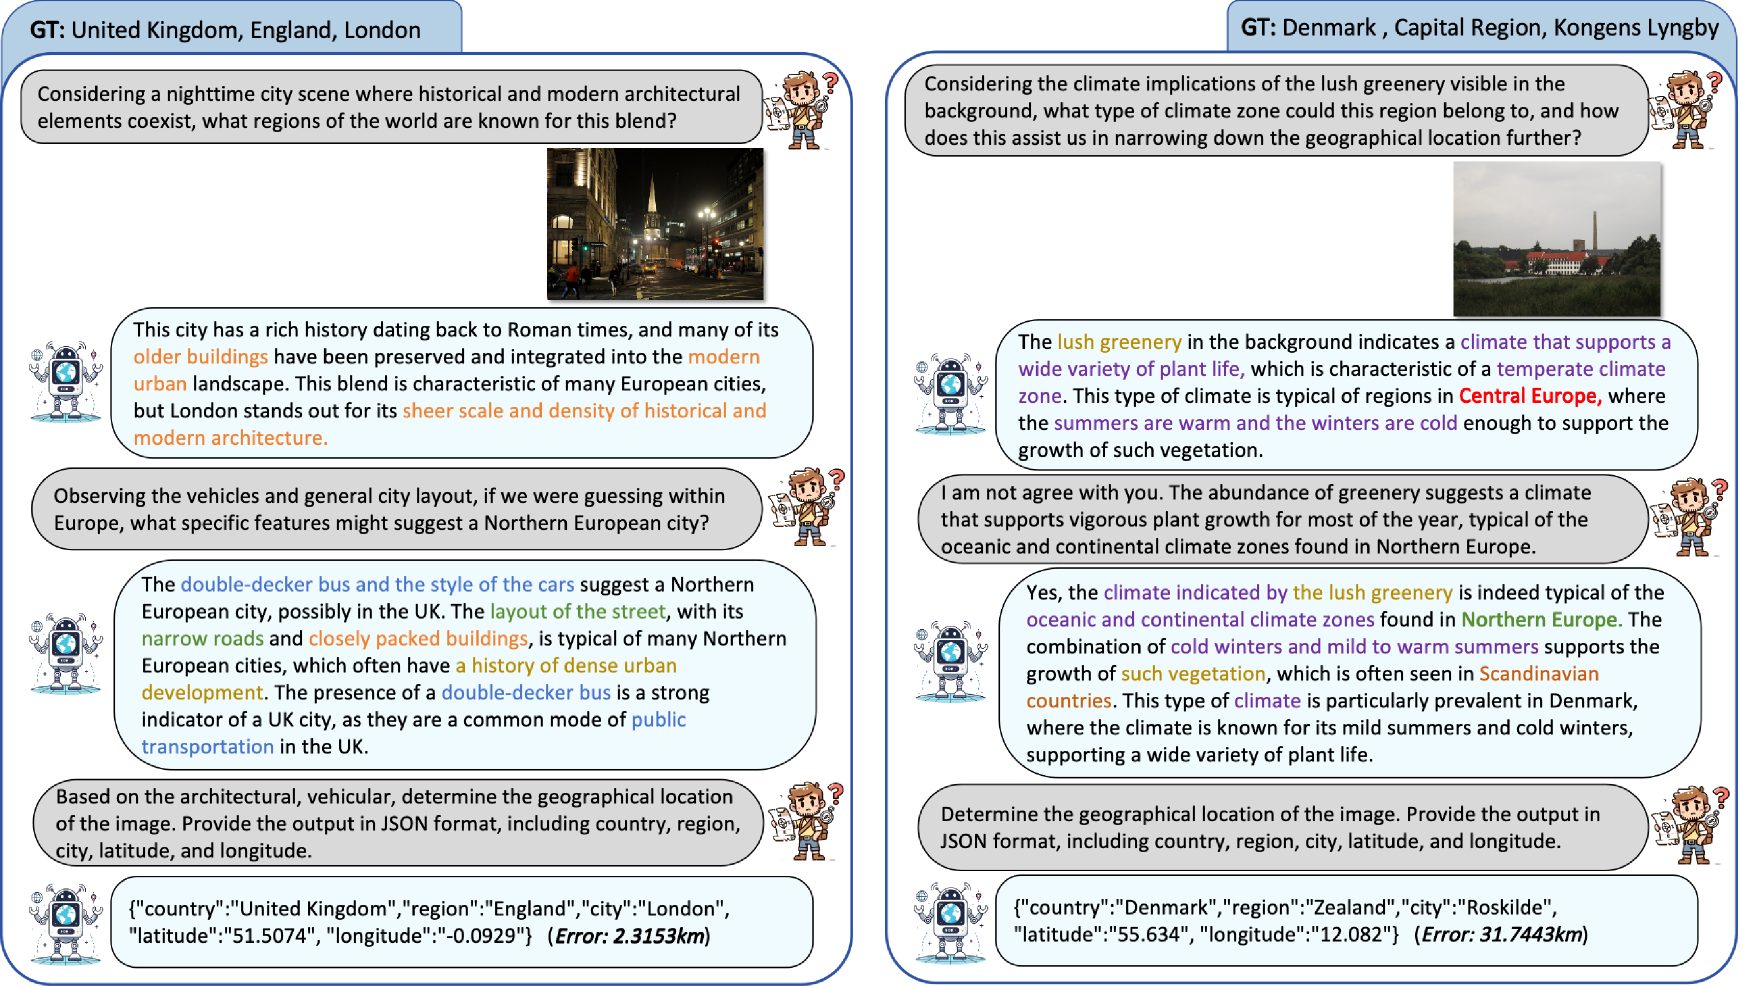
Figure 4 illustrates examples of GaGA’s dialogues in different scenarios. The left side shows how GaGA effectively integrates external knowledge under human guidance; the right side depicts the model’s prediction outcomes when provided with effective prior information. Additionally, as demonstrated in Figure 1, GaGA also exhibits potential in delving deeper into clues when its initial prediction is challenged.
5.3 Ablation Study
In Sec. 5.1, GWS15k is used as a subset of OSV-5M-test. To address any distribution differences from the sampling strategy, we also evaluated the entire OSV-5M test set and reported GaGA’s performance. The entire test set consists of 210,122 images, which are well distributed globally and have excellent diversity. As shown in Table 3, the performance difference between GaGA and OSV-5M-Baseline aligns with Sec. 5.1’s findings. GaGA excels in coordinate prediction accuracy within the 750 km and 2500 km thresholds and leads in administrative boundary classification accuracy at both the country and city levels.
Furthermore, we evaluate the impact of the two training stages on the model’s performance. In this part, since our baseline model, LLaVA-Llama3, can not produce valid coordinate outputs, the accuracy of coordinate predictions is not reported. It can be observed that after pre-training, the GaGA-pretrain model achieves the highest accuracy in localization, although it lacks flexible conversational abilities. The fine-tuning stage, which incorporates dialog data, slightly reduces localization accuracy but enables the model to flexibly integrate user-provided knowledge and analyze geographical features. Ultimately, we strike a balance between localization performance and conversational ability.
6 Discussion
The integration of large visual language models (LVLMs) into image-based geographic localization enhances interpretability, interactivity, and accuracy, benefiting applications like emergency response and environmental monitoring. However, these advancements also bring ethical concerns, such as potential over-reliance on models, propagation of biases, and privacy risks related to sensitive location data. While LVLMs offer significant benefits, responsible deployment with awareness of their limitations is crucial to mitigating ethical risks and protecting user privacy.
7 Conclusion
In this work, we introduce the Multi-modal Global Geolocation (MG-Geo) dataset and develop the Global Geolocation Assistant (GaGA), a novel Large Visual Language Model. GaGA demonstrates superior performance in both accuracy and interpretability, particularly through its ability to refine localization outputs via interactive dialogue. Our contributions set a new standard in the field, advancing the use of LVLMs for geographic tasks and highlighting the potential of interactive, user-centered geolocation systems for future research and applications.
References
- AI@Meta (2024) AI@Meta. 2024. Llama 3 Model Card. None.
- Astruc et al. (2024a) Astruc, G.; Dufour, N.; Siglidis, I.; Aronssohn, C.; Bouia, N.; Fu, S.; Loiseau, R.; Nguyen, V. N.; Raude, C.; Vincent, E.; Xu, L.; Zhou, H.; and Landrieu, L. 2024a. OpenStreetView-5M: The Many Roads to Global Visual Geolocation. In Proceedings of the IEEE/CVF Conference on Computer Vision and Pattern Recognition (CVPR), 21967–21977.
- Astruc et al. (2024b) Astruc, G.; Dufour, N.; Siglidis, I.; Aronssohn, C.; Bouia, N.; Fu, S.; Loiseau, R.; Nguyen, V. N.; Raude, C.; Vincent, E.; et al. 2024b. OpenStreetView-5M: The Many Roads to Global Visual Geolocation. In Proceedings of the IEEE/CVF Conference on Computer Vision and Pattern Recognition, 21967–21977.
- Bai et al. (2023) Bai, J.; Bai, S.; Yang, S.; Wang, S.; Tan, S.; Wang, P.; Lin, J.; Zhou, C.; and Zhou, J. 2023. Qwen-VL: A Frontier Large Vision-Language Model with Versatile Abilities. arXiv preprint arXiv:2308.12966.
- Chen et al. (2023a) Chen, L.; Li, J.; Dong, X.; Zhang, P.; He, C.; Wang, J.; Zhao, F.; and Lin, D. 2023a. ShareGPT4V: Improving Large Multi-Modal Models with Better Captions. arXiv:2311.12793.
- Chen et al. (2024) Chen, Z.; Wang, W.; Tian, H.; Ye, S.; Gao, Z.; Cui, E.; Tong, W.; Hu, K.; Luo, J.; Ma, Z.; et al. 2024. How Far Are We to GPT-4V? Closing the Gap to Commercial Multimodal Models with Open-Source Suites. arXiv preprint arXiv:2404.16821.
- Chen et al. (2023b) Chen, Z.; Wu, J.; Wang, W.; Su, W.; Chen, G.; Xing, S.; Zhong, M.; Zhang, Q.; Zhu, X.; Lu, L.; Li, B.; Luo, P.; Lu, T.; Qiao, Y.; and Dai, J. 2023b. InternVL: Scaling up Vision Foundation Models and Aligning for Generic Visual-Linguistic Tasks. arXiv preprint arXiv:2312.14238.
- Clark et al. (2023) Clark, B.; Kerrigan, A.; Kulkarni, P. P.; Cepeda, V. V.; and Shah, M. 2023. Where we are and what we’re looking at: Query based worldwide image geo-localization using hierarchies and scenes. In Proceedings of the IEEE/CVF Conference on Computer Vision and Pattern Recognition, 23182–23190.
- Contributors (2023a) Contributors, L. 2023a. LMDeploy: A Toolkit for Compressing, Deploying, and Serving LLM. https://github.com/InternLM/lmdeploy.
- Contributors (2023b) Contributors, X. 2023b. XTuner: A Toolkit for Efficiently Fine-tuning LLM. https://github.com/InternLM/xtuner.
- Dettmers et al. (2024) Dettmers, T.; Pagnoni, A.; Holtzman, A.; and Zettlemoyer, L. 2024. Qlora: Efficient finetuning of quantized llms. Advances in Neural Information Processing Systems, 36.
- Gadre et al. (2023) Gadre, S. Y.; Ilharco, G.; Fang, A.; Hayase, J.; Smyrnis, G.; Nguyen, T.; Marten, R.; Wortsman, M.; Ghosh, D.; Zhang, J.; Orgad, E.; Entezari, R.; Daras, G.; Pratt, S.; Ramanujan, V.; Bitton, Y.; Marathe, K.; Mussmann, S.; Vencu, R.; Cherti, M.; Krishna, R.; Koh, P. W.; Saukh, O.; Ratner, A.; Song, S.; Hajishirzi, H.; Farhadi, A.; Beaumont, R.; Oh, S.; Dimakis, A.; Jitsev, J.; Carmon, Y.; Shankar, V.; and Schmidt, L. 2023. DataComp: In search of the next generation of multimodal datasets. NeurIPS Dataset and Benchmark.
- Haas, Alberti, and Skreta (2023) Haas, L.; Alberti, S.; and Skreta, M. 2023. Learning generalized zero-shot learners for open-domain image geolocalization. arXiv preprint arXiv:2302.00275.
- Haas et al. (2024) Haas, L.; Skreta, M.; Alberti, S.; and Finn, C. 2024. Pigeon: Predicting image geolocations. In Proceedings of the IEEE/CVF Conference on Computer Vision and Pattern Recognition, 12893–12902.
- Hays and Efros (2008a) Hays, J.; and Efros, A. A. 2008a. Im2gps: estimating geographic information from a single image. In 2008 ieee conference on computer vision and pattern recognition, 1–8. IEEE.
- Hays and Efros (2008b) Hays, J.; and Efros, A. A. 2008b. Im2gps: estimating geographic information from a single image. In CVPR.
- Li et al. (2023) Li, B.; Zhang, Y.; Chen, L.; Wang, J.; Pu, F.; Yang, J.; Li, C.; and Liu, Z. 2023. MIMIC-IT: Multi-Modal In-Context Instruction Tuning. arXiv:2306.05425.
- Li et al. (2024) Li, L.; Ye, Y.; Jiang, B.; and Zeng, W. 2024. GeoReasoner: Geo-localization with Reasoning in Street Views using a Large Vision-Language Model. arXiv:2406.18572.
- Liu et al. (2023) Liu, H.; Li, C.; Wu, Q.; and Lee, Y. J. 2023. Visual Instruction Tuning. arXiv:2304.08485.
- Luo et al. (2022) Luo, G.; Biamby, G.; Darrell, T.; Fried, D.; and Rohrbach, A. 2022. Gˆ 3: Geolocation via Guidebook Grounding. arXiv preprint arXiv:2211.15521.
- Muller-Budack, Pustu-Iren, and Ewerth (2018) Muller-Budack, E.; Pustu-Iren, K.; and Ewerth, R. 2018. Geolocation estimation of photos using a hierarchical model and scene classification. In Proceedings of the European conference on computer vision (ECCV), 563–579.
- Peng et al. (2023) Peng, Z.; Wang, W.; Dong, L.; Hao, Y.; Huang, S.; Ma, S.; and Wei, F. 2023. Kosmos-2: Grounding Multimodal Large Language Models to the World. arXiv:2306.14824.
- Qi et al. (2024) Qi, F.; Dai, M.; Zheng, Z.; and Wang, C. 2024. GeoDecoder: Empowering Multimodal Map Understanding. arXiv preprint arXiv:2401.15118.
- Radford et al. (2021) Radford, A.; Kim, J. W.; Hallacy, C.; Ramesh, A.; Goh, G.; Agarwal, S.; Sastry, G.; Askell, A.; Mishkin, P.; Clark, J.; et al. 2021. Learning transferable visual models from natural language supervision. In International conference on machine learning, 8748–8763. PMLR.
- Seo et al. (2018) Seo, P. H.; Weyand, T.; Sim, J.; and Han, B. 2018. CPlaNet: Enhancing Image Geolocalization by Combinatorial Partitioning of Maps. In Proceedings of the European Conference on Computer Vision, 536–551.
- Theiner, Müller-Budack, and Ewerth (2022) Theiner, J.; Müller-Budack, E.; and Ewerth, R. 2022. Interpretable semantic photo geolocation. In Proceedings of the IEEE/CVF Winter Conference on Applications of Computer Vision, 750–760.
- Vivanco Cepeda, Nayak, and Shah (2024) Vivanco Cepeda, V.; Nayak, G. K.; and Shah, M. 2024. Geoclip: Clip-inspired alignment between locations and images for effective worldwide geo-localization. Advances in Neural Information Processing Systems, 36.
- Vo, Jacobs, and Hays (2017) Vo, N.; Jacobs, N.; and Hays, J. 2017. Revisiting im2gps in the deep learning era. In Proceedings of the IEEE international conference on computer vision, 2621–2630.
- Weyand et al. (2020) Weyand, T.; Araujo, A.; Cao, B.; and Sim, J. 2020. Google landmarks dataset v2-a large-scale benchmark for instance-level recognition and retrieval. In Proceedings of the IEEE/CVF conference on computer vision and pattern recognition, 2575–2584.
- Wu et al. (2020) Wu, Y.; Luo, R.; Lam, T.-W.; Ting, H.-F.; and Wang, J. 2020. Translocator: local realignment and global remapping enabling accurate translocation detection using single-molecule sequencing long reads. In Proceedings of the 11th ACM International Conference on Bioinformatics, Computational Biology and Health Informatics, 1–7.
- Zhang, Sultani, and Wshah (2023) Zhang, X.; Sultani, W.; and Wshah, S. 2023. Cross-View Image Sequence Geo-localization. In WACV.
- Zhu, Shah, and Chen (2022) Zhu, S.; Shah, M.; and Chen, C. 2022. TransGeo: Transformer Is All You Need for Cross-view Image Geo-localization. In IEEE Conference on Computer Vision and Pattern Recognition, 1162–1171.
Appendix
A Pre-training Details
Table 6 summarizes the detailed settings we use for pre-training and supervised fine-tuning.
| Configuration | Value | ||
| Pre-training: | |||
| Dataset | Meta Part of MG-Geo | ||
| Training Epochs | 1 | ||
| Total Batch Size | 16 | ||
| Optimizer | AdamW | ||
| LR | 210-4 | ||
| LR Schedule | CosineAnnealing | ||
| Weight Decay | 0 | ||
| Warmup Ratio | 0.03 | ||
| Adam Beta1 | 0.9 | ||
| Adam Beta2 | 0.999 | ||
| Image Resolution | 336336 | ||
| Max Text Token Length | 1472 | ||
| Supervised Fine-tuning: | |||
| Dataset | Mix240k of MG-Geo | ||
| Training Epochs | 1 | ||
| Total Batch Size | 16 | ||
| Optimizer | AdamW | ||
| LR Schedule | CosineAnnealing | ||
| LR | 210-5 | ||
| Quantization Type | BitsAndBytesConfig | ||
| Quantization Bits | 4-bit | ||
| 4-bit Quant Type | nf | ||
| 4-bit Compute Dtype | torch.float16 | ||
| lora Alpha | 16 | ||
| Low-Rank Matrix Rank | 64 | ||
| LoRA Dropout | 0.05 | ||
| Weight Decay | 0 | ||
| Warmup Ratio | 0.03 | ||
| Adam Beta1 | 0.9 | ||
| Adam Beta2 | 0.999 | ||
| Image Resolution | 336336 | ||
| Max Text Token Length | 1472 | ||
B Dataset Analysis
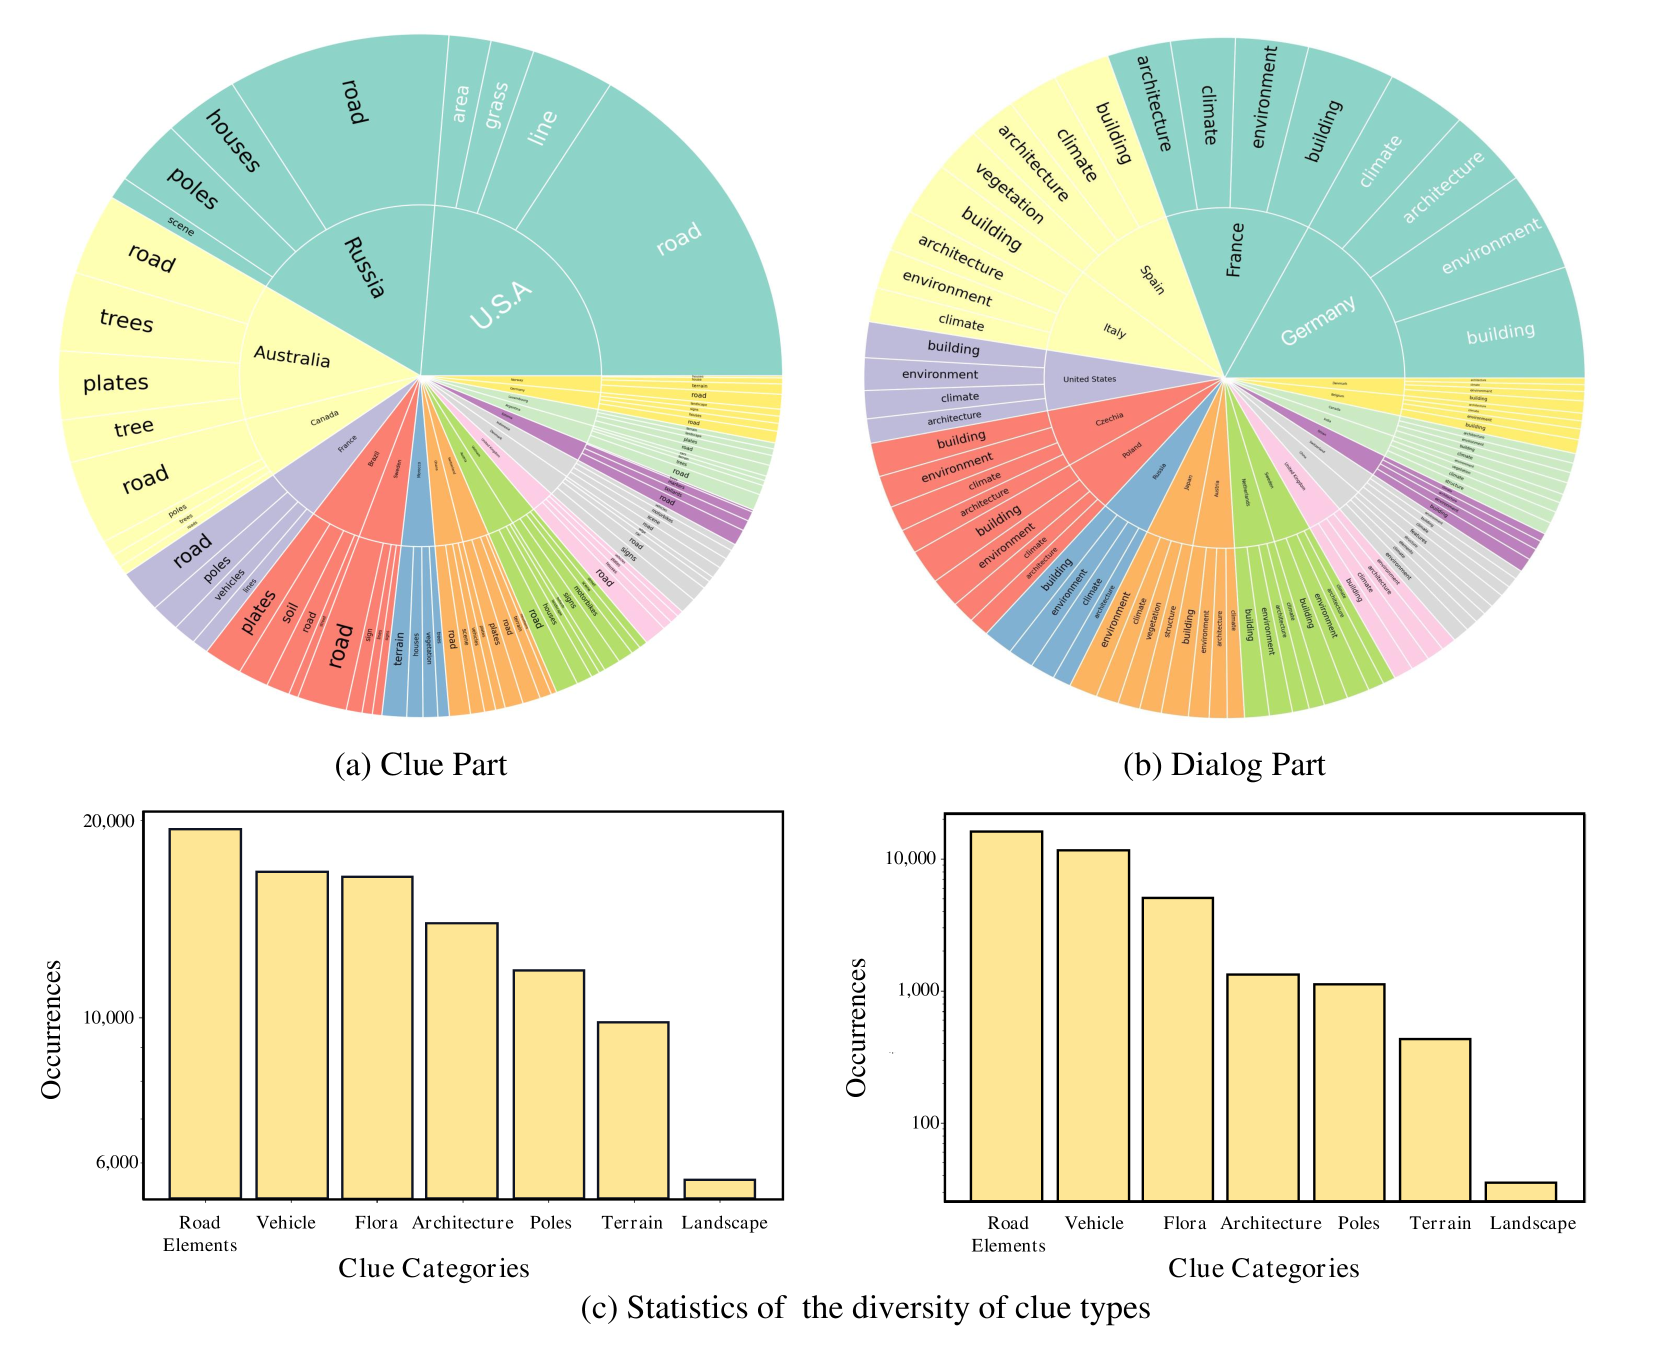
To effectively demonstrate the unique characteristics and diversity of geographic cues across different countries within the Clue Part (see Fig. 5(a)) and Dialog Part (see Fig. 5(b)), we conducted a comprehensive analysis of the national cue structures within these components. We identified the top 20 countries with the highest frequency of occurrence and extracted the four most prevalent direct cue phrases associated with each country. Our findings indicate that the Clue Part exhibits a greater diversity in detailed geographic cues compared to the Dialog Part. The Clue Part’s questions and answers encompass a broader range of specific geographic details, making it a valuable resource for training models to recognize subtle and varied geographical features.
In contrast, the Dialog Part emphasizes the diversity of dialogue from a conversational perspective, focusing on elements like buildings, environment, architecture, and climate. This design better reflects how humans naturally engage in dialogue when presented with unfamiliar images, especially when specific geographic details are unknown. We also demonstrated the diversity of clue types across the dataset components, as shown in Fig. 5(c).
C Evaluation of Dialog Data
As shown in the table 7, we evaluated GaGA’s dialog on Fluency, Relevance, Informativeness, and Accuracy, using pairwise ratings (Win, Tie, Lose) against GPT-4. “K” represents the Fleiss’ Kappa value, which measures inter-rater reliability, with three experts assessing 50 samples.In 50 rounds of comparison, GaGA outperforms GPT-4 in all four metrics, and the scores from the three experts show a high level of consistency.
| Metrics | Win | Loss | Tie | K |
| Fluency | 31 | 3 | 16 | 0.55 |
| Relevance | 33 | 5 | 22 | 0.74 |
| Informativeness | 26 | 7 | 17 | 0.64 |
| Accuracy | 22 | 18 | 10 | 0.91 |
D Performance of Advanced VLM in Dialog
As shown in the table 8, we evaluate InternVL2 and Qwen-VL in geolocalization under interaction design for performance improvement.Qwen-VL performs poorly under the direct inquiry prompt setting, but its performance at the country level significantly improves after incorporating a guiding question. Similarly, InternVL2, after engaging in dialoge, uncovers more useful clues, leading to performance improvements across the country, region, and city levels, demonstrating the effectiveness of interaction.
| Model | Prompt | Recall | Country | Region | City |
| GaGA | Direct inquiry | 1 | 64.89 | 27.97 | 7.67 |
| + Question | 1 | 61.24 | 29.25 | 8.22 | |
| -3.65 | +1.28 | +0.55 | |||
| Qwen-VL | Direct inquiry | 0.96 | 13.89 | 6.03 | 2.01 |
| + Question | 0.92 | 21.38 | 6.94 | 1.82 | |
| +7.49 | +0.91 | -0.19 | |||
| InternVL2 | Direct inquiry | 0.96 | 54.11 | 19.19 | 3.29 |
| + Question | 0.97 | 55.02 | 19.19 | 4.57 | |
| +0.91 | 0 | +1.28 |
E Additional Testing on Open Datsets
Im2GPS (Hays and Efros 2008b) and Im2GPS3k (Vo, Jacobs, and Hays 2017) datasets contain many non-localizable images (e.g., 35% in Im2gps3k lack geolocation), like selfies and indoor photos. Testing on these images could introduce unreliable errors or favor methods that exploit memory training biases in the distribution (Astruc et al. 2024b). Thus, we used the more uniformly distributed and challenging GWS15k dataset (Clark et al. 2023) in the main text. For consistency, supplementary results on these datasets show comparable performance to state-of-the-art models, with GaGA’s performance on Im2GPS and Im2GPS3k added to Table 9 in the revised manuscript.
| Benchmark | Method | Coordinates Accuracy (% @ km) | ||||
| 1km | 25km | 200km | 750km | 2500km | ||
| Im2GPS3k | PIGEON | 11.3 | 36.7 | 53.8 | 72.4 | 85.3 |
| GeoCLIP | 14.1 | 34.4 | 50.6 | 69.6 | 83.8 | |
| GaGA | 11.7 | 33.0 | 48.0 | 67.1 | 82.1 | |
| Im2GPS | PIGEON | 14.8 | 40.9 | 63.3 | 82.3 | 91.1 |
| GeoCLIP | 17.7 | 44.7 | 59.9 | 78.0 | 89.4 | |
| GaGA | 16.8 | 38.8 | 54.8 | 75.1 | 87.7 | |
F Text Prompts
The following is our carefully designed Prompt when using GPT4-V to obtain the Dialog Part of MG-Geo, divided into SYSTOM_PROMPT and TASK_PROMPT. The former defines GPT-V’s identity when answering, while the latter specifies an explicit task.
-
•
SYSTEM_PROMPT = “Let’s start the geography guessing game! Description: You are an excellent GeoGusser player and questioner. The player observes the image and deduces the geographic location step by step based on clues such as environment and climate, buildings and landmarks, language and culture, and people’s appearance. The questioner continuously guides the player in analyzing the image deeply and uncovering more visual clues.”
-
•
TASK_PROMPT = “Geographical Location Prediction.Reasoning Q&A: Based on the image provided to you; please conduct THREE rounds of Q&A (denoted as Q1A1, Q2A2, and Q3A3, respectively) between the questioner and the player. Questions should be sufficiently challenging and closely related to the visual elements but NOT actively provide visual details to the player. Only include questions that guide position prediction and require the player to utilize 1) complex reasoning, 2) world knowledge, and 3) interpretive answers to gradually deduce the location. When answering complex questions, provide detailed reasoning steps for clarity and persuasiveness.Predict Coordinates: After the reasoning, the questioner should ask about the geographic coordinates and request an answer from the player, denoted as Q4A4. Based on previous rationale and analysis, the player makes the best prediction and briefly explains the choice. The player MUST provide reasonable coordinates regardless of uncertainty. Please strictly follow these rules: Do not mention anything from the prompt in your response, and avoid content unrelated to the Q&A. Please use Decimal Degrees for coordinates and follow the format ’(latitude, longitude)’.”
G Pseudocode of Hierarchical Mode Evaluation
H Reproduction of GWS15k
To collect evenly distributed imagery, we used a database of 43,000 cities and each country’s surface area. We first sampled countries/regions based on their proportion of Earth’s surface area, then randomly selected a city within each and GPS coordinates within a 5 km radius of that city’s center to sample from OSV5M-Test.
I Future Research
Large vision-language models (LVLMs) for global geolocation tasks will demonstrate greater adaptability and flexibility when addressing complex problems. The Retrieval-Augmented Generation (RAG) technique enhances the model’s performance by combining its powerful reasoning capabilities with external information. By incorporating the latest retrieved relevant data into input prompts, RAG helps mitigate “hallucinations” and enables the generation of more accurate responses.
Future geolocation models will increasingly integrate multimodal data, such as combining street view images, aerial image, voice descriptions, and textual annotations for localization. RAG technology offers unique advantages in this context. By retrieving multimodal information relevant to the input data, RAG can merge these diverse forms of data, providing the model with richer contextual information. For instance, in a street view image localization task, RAG can retrieve historical photos of the location, user reviews, or even related news articles, helping the model pinpoint the location in the image more accurately.
J Additional Qualitative Results