Radiology Report Generation via Multi-objective Preference Optimization
Abstract
Automatic Radiology Report Generation (RRG) is an important topic for alleviating the substantial workload of radiologists. Existing RRG approaches rely on supervised regression based on different architectures or additional knowledge injection, while the generated report may not align optimally with radiologists’ preferences. Especially, since the preferences of radiologists are inherently heterogeneous and multi-dimensional, e.g., some may prioritize report fluency, while others emphasize clinical accuracy. To address this problem, we propose a new RRG method via Multi-objective Preference Optimization (MPO) to align the pre-trained RRG model with multiple human preferences, which can be formulated by multi-dimensional reward functions and optimized by multi-objective reinforcement learning (RL). Specifically, we use a preference vector to represent the weight of preferences and use it as a condition for the RRG model. Then, a linearly weighed reward is obtained via a dot product between the preference vector and multi-dimensional reward. Next, the RRG model is optimized to align with the preference vector by optimizing such a reward via RL. In the training stage, we randomly sample diverse preference vectors from the preference space and align the model by optimizing the weighted multi-objective rewards, which leads to an optimal policy on the entire preference space. When inference, our model can generate reports aligned with specific preferences without further fine-tuning. Extensive experiments on two public datasets show the proposed method can generate reports that cater to different preferences in a single model and achieve state-of-the-art performance.
Introduction
Radiology reports provide an important basis for physicians to make diagnoses and are usually written by experienced radiologists based on the syndromes observed in medical images. However, manually writing reports is labor-intensive, time-consuming, and error-prone due to the large amount of daily medical reports and variations in experience among radiologists. Therefore, automatic radiology report generation (RRG) relying on deep learning techniques as an alternative has emerged as an attractive research topic in both artificial intelligence and medicine.
To generate high-quality reports, a series of approaches (Chen et al. 2020; Liu et al. 2024a) have been proposed. They usually adopt the classic encoder-decoder structure and generate better text descriptions by promoting the model’s structure, such as introducing a cross-modal memory module (Chen et al. 2021; Shen et al. 2024), a multi-modal alignment module (Yang et al. 2023), or new attention mechanisms (Song et al. 2022). Another line of approaches improves report generation by injecting additional knowledge, such as knowledge graphs (Yang et al. 2022; Kale et al. 2023; Huang, Zhang, and Zhang 2023) or disease tags (You et al. 2021; Wang et al. 2022; Jin et al. 2024), or retrieved reports from other corpora (Liu et al. 2024b).
The above RRG methods rely on supervised regression based on different architectures or additional knowledge injection. However, the generated reports may not align optimally with radiologists’ preferences. Some approaches (Qin and Song 2022; Delbrouck et al. 2022) integrate reinforcement learning (RL) into report generation to maximize rewards that assess report quality. These RL-based approaches generally use a single evaluation metric or a simple weighted sum of multiple metrics to formulate the reward function. This function typically represents a weighted aggregation of multiple objectives, tailored to a specific preference. Nonetheless, preferences are inherently heterogeneous and multi-dimensional. For instance, some radiologists may prioritize the fluency of the text, while others may focus on clinical accuracy. Therefore, RRG models must cater to the diverse preferences of different radiologists, a challenge that is difficult to achieve with a single model and remains unexplored in previous works.
In this paper, we study this unexplored topic for the first time and propose a new RRG method to align the pre-trained RRG model with multiple human preferences via Multi-objective Preference Optimization (MPO). The key challenge is how to utilize a low-dimensional preference vector to control the model’s behavior. To address this challenge, MPO formalizes the preferences as a multi-dimensional vector and uses it as a condition for the RRG model, which can be formulated by multi-dimensional reward functions and optimized by multi-objective reinforcement learning. Specifically, our MPO introduces two new modules: the preference vector fusion (PVF) network and the multi-objective optimization (MOO) module. The PVF network is situated between the encoder and decoder of the standard Transformer. It employs a multi-head attention mechanism and residual connections to fuse the preference vector with the encoded image features, enabling conditional generation. The MOO module uses the preference vector to represent the weight of the preference and linearly weights the multi-dimensional reward with the preference vector. Then, RL is used to optimize the weighted reward function, promoting the RRG model to align with the preference. During training, we randomly sample diverse preference vectors from the preference space and align the RRG model by optimizing the weighted multi-objective rewards functions, which leads to an optimal policy on the entire preference space, ensuring the optimal RRG model performs differently under various preferences. During inference, our model can generate reports aligned with specific preferences without further fine-tuning. Our main contribution is summarized as follows:
-
•
We propose a new RRG method that aligns with human preferences and formulate it as a multi-objective optimization reinforcement learning problem. To the best of our knowledge, this is the first study to align an RRG model with human preferences.
-
•
We propose a preference vector fusion module that fuses the encoded image features with the preference vector using an attention mechanism and residual connections, ensuring that the preference vector can condition the report generation.
-
•
Extensive experiments on two public datasets demonstrate that our proposed method can cater to different preferences within a single model without further fine-tuning and achieve state-of-the-art performance.
Related Works
Radiology Report Generation
Recent advancements in RRG can be classified into two main strategies: improving model architectures and injecting additional knowledge.
Improving Model Architectures
Early RRG studies are implemented on CNN-RNN or CNN-LSTM architectures (Wang et al. 2020; Najdenkoska et al. 2021). Recent works have focused on improving the network based on the CNN-Transformer architecture. For instance, both CMN (Chen et al. 2021) and MAN (Shen et al. 2024) introduce a cross-modal memory network featuring a shared memory that records the alignment information between images and text. XPRONET (Wang, Bhalerao, and He 2022) proposes a cross-modal prototype-driven network to enhance cross-modal pattern learning. METrans (Wang et al. 2023) introduces multiple learnable “expert” tokens into both the Transformer encoder and decoder, enhancing image representation and report generation. To capture subtle differences in radiology images, various attention mechanisms have been developed to enhance feature robustness in report generation, such as the co-attention mechanism (Jing, Xie, and Xing 2018). Additionally, Ali-Transformer (You et al. 2021) introduces cross-view attention, using single-view and multi-view branches to combine features from frontal and lateral images with squeeze-excitation attention to aid report generation. Song et al. (2022) introduce a cross-modal contrastive attention (CMCA) model that uses contrastive features from similar historical cases to guide report generation. Wang et al. (2022) propose a memory-augmented sparse attention block that integrates bilinear pooling with self-attention to capture higher-order interactions and generate long reports.
Injecting Additional Knowledge
This type of work explores the injection of additional knowledge, such as disease labels (Tanida et al. 2023; Jin et al. 2024), retrieved reports (Liu et al. 2024b), and knowledge graphs (Kale et al. 2023; Huang, Zhang, and Zhang 2023), to assist in report generation. PPKED (Liu et al. 2021a) combines abnormal findings, knowledge graphs, and retrieved reports to mimic the working patterns of radiologists. KiUT (Huang, Zhang, and Zhang 2023) enhances results by integrating visual and contextual knowledge with external clinical insights through an injected knowledge distiller. RGRG (Tanida et al. 2023) uses an object detector as region guidance for report generation, allowing the decoder to directly utilize disease information. Jin et al. (2024) generates high-quality reports by converting diagnostic results from a disease classification branch and combining them with retrieved reports.
RRG via Reinforcement Learning
The aforementioned RRG methods are primarily single-stage and rely on supervised regression. Recently, reinforcement learning (RL) has been integrated into RRG tasks, further enhancing report-generation capabilities through appropriate supervision from carefully designed rewards. These rewards are typically calculated based on natural language generation (NLG) metrics (Wang et al. 2021, 2022) or semantic relevance metrics (Delbrouck et al. 2022). For example, CMN+RL (Qin and Song 2022) leverages signal from NLG metrics, such as BLEU, as a reward to guide the cross-modal mappings between image and text features. Li et al. (2018) design a hierarchical decision-making policy guided by sentence-level and word-level rewards to determine whether to retrieve a template sentence or generate a new one. Miura et al. (2021) design two new rewards, namely, the exact entity matching reward and the entity matching reward, based on entity coverage and relationships. These rewards are combined with NLG metric rewards to improve the factual completeness and consistency of generated reports. Similarly, Delbrouck et al. (2022) employ entities and relationships extracted by PubMedBERT (Gu et al. 2021) to compute three rewards to enhance the factual completeness and correctness of report generation. Wu, Huang, and Huang (2023) introduce an imbalanced evaluation reward that divides performance differences into four groups based on token frequency, balancing performance to ensure that tokens from these groups are given equal weight.
These RL-based report generation methods typically employ either a single evaluation metric or a straightforward weighted sum of multiple metrics as the reward function. Such a reward function represents a weighted aggregation of multiple objectives under a specific preference vector, which is essentially a single-objective optimization and can only produce a policy applicable to a particular preference. Consequently, the model must be retrained to adapt to different preferences. Recent studies (Yu et al. 2024; Yuan et al. 2024; Shan et al. 2024) incorporate preference information into the generation process to guide preference alignment. Our approach is orthogonal to the above methods, and we are the first to align preferences with the RRG model via multi-objective preference optimization.
Methods
Overview and Generation Pipeline
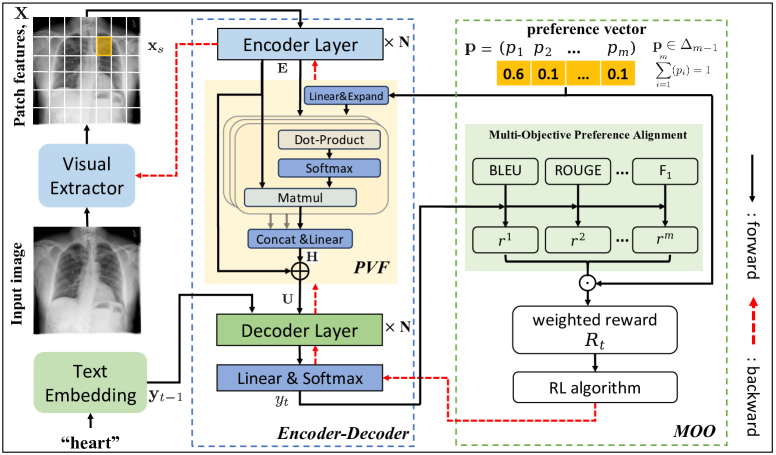
We aim to train a model that can generate reports aligned with human preferences. As shown in Figure 1, our MPO builds upon the mainstream encoder-decoder framework and comprises two novel modules: the encoder-decoder with our preference vector fusion (PVF) network, and the multi-objective optimization (MOO) module. In our framework, RRG is also formulated as a sequence-to-sequence task, where, given a radiology image , the Encoder Layers encode the visual features extracted by the visual extractor and the Decoder Layers generate report conditioned on both visual features and preference vector . Here, is the generated tokens at step , is the length of the report, and represents the vocabulary space. The entire generation process can be formulated as follows:
| (1) |
Firstly, we extract visual features from radiology image via a pre-trained CNN, specifically ResNet 101 (He et al. 2016). Then, decompose the image into equally sized patches, with the patch features being extracted from the last convolutional layer of the CNN. These patch features are then expanded into a sequence by concatenating them row-by-row, which is formulated as follows:
| (2) |
where is the visual extractor, is a patch feature, is the feature dimension, and represents the patch number.
Then, the extracted visual features and text embedding are fed into the encoder-decoder module. In this module, the encoder processes the visual features , which are then fused with a multi-dimensional preference vector through the PVF network. These fused features are then combined with the text embeddings and input into the decoder to generate the next token. The MOO module calculates rewards based on multiple evaluation metrics and weights these rewards using preference vectors to formulate a multi-objective reward function. An RL algorithm is then applied to optimize this function, thereby generating reports that align with the specified preferences. Next, we will detail our proposed PVF and MOO modules together with a two-stage training procedure.
Encoder-Decoder with the PVF Network
The visual features and text embedding are utilized as inputs of the encoder and decoder, respectively. First, the visual features are fed into the encoder by Eq. (3) to obtain the encoded visual features ,
| (3) |
where is the Encoder Layers in the standard Transformer. Then the encoded visual features are fed into the PVF network to fuse with the preference vector .
The key challenge of our MPO approach is how to align the RRG model with multiple preferences. To address this challenge, we formalize the preferences as multi-dimensional vectors and use them as a condition for the RRG model. Now the question is how to incorporate the preference vector into the report generation model. Inspired by the large language model, the radiology image can be viewed as the prompt of the report generation model, and the preference vector is the conditional input. Therefore, we design a preference vector fusion (PVF) network to integrate the preference vector with encoded visual features.
Specifically, given an -dimensional preference vector , where represents the preference simplex, represents the weight for preference dimension , and . During training, a preference vector is randomly sampled from the preference simplex and undergoes linear mapping and dimension expansion to ensure the processed preference vector has the same dimension as the encoded visual features , where . The core of the PVF network is a fusion module based on a multi-head attention mechanism and a residual connection, where the expanded preference vector serves as the query, while the encoded visual features serve as both the key and value. For each head , the fusion process follows the same procedure described as follows:
| (4) |
Then, the attention feature is obtained by concatenating from all heads (the number of heads is 8 in our method). Finally, the attention feature is fused with the encoded visual feature through residual connection to obtain the fused feature , which is expressed as follows:
| (5) |
where is a scaling factor. Then the fused features along with the text embedding from previous steps, serve as the input of the Decoder Layers to generate the current output by Eq. (6),
| (6) |
where is the Decoder Layers. Given the entire predicted report sequence and the associated ground truth report , the basic generation loss is:
| (7) |
Multi-objective Optimization via RL
The PVF network merely integrates the preference vector into the report generation network, which is not yet aligned with the preferences and therefore cannot control the behavior of the model. To align with multiple preferences, we propose the Multi-Objective Optimization (MOO) module, which includes a multi-dimensional reward function optimized by multi-objective RL. The MOO module uses the preference vector to represent the weight of each preference and linearly combines the multi-dimensional reward with the preference vector. Subsequently, a policy gradient is employed to optimize this weighted reward function, thereby guiding the model to better align with different preferences.
We conceptualize the report generation model as an agent interacting with external environment, which includes visual and textual features, along with a preference vector . All model parameters, denoted by , define a policy that guides the action—predicting the next token, i.e., . For each report, once the end-of-sequence token is generated, the agent receives several rewards based on improvements in multiple evaluation metrics. Some of these evaluation metrics focus on the accuracy of text description, such as BLEU{1-4}, ROUGE-L, and some focus on clinical efficacy, such as F1 and Recall of disease labels. The number of rewards corresponds to the dimensions of the preference vector. For the evaluation metric, the reward for the action at step is determined by the improvement in generating the next token on that evaluation metric, which is formulated as follows:
| (8) |
where , and . Therefore, at step , the multi-objective reward function weighted by the preference vector is calculated as follows:
| (9) |
Therefore, the total reward of generating a report is the sum of :
| (10) | ||||
where represents the multi-objective rewards obtained from the sampling strategy. Then the model is trained to maximize the expected reward from the generated report via a sampling strategy. The loss function is now defined as follows:
| (11) |
The gradient of the loss function is computed using the REINFORCE algorithm (Williams 1992) as follows:
| (12) |
To stabilize the RL training process, we follow Rennie et al. (2017) and introduce a reference reward , where is a weighted sum of multiple metrics calculated via greedy sampling. Thus, Eq. (12) can be re-formulated as follows:
| (13) |
Then, we approximate the expected gradient through Monte-Carlo sampling, which averages the gradient of generated reports sampled from as follows:
| (14) |
Training
MPO comprises two training stages: the first employs the primary generation loss in Eq. (7) to regularize the action space, and the second involves multi-objective optimization based on Eq. (14). During training, we randomly sample diverse preference vectors from the preference space and refine the RRG model by optimizing weighted multi-objective rewards. This strategy achieves an optimal policy across the entire preference space, ensuring that the optimal model adapts to various preference conditions. During inference, given a preference vector, our model can generate reports that cater to this preference without further fine-tuning.
Experiments
Experiment Settings
Datasets. We evaluate our method on two public datasets, IU-Xray (Demner-Fushman et al. 2016) and MIMIC-CXR (Johnson et al. 2019). IU-Xray consists of 7,470 chest X-ray images, accompanied by 3,955 reports. Following CMN (Chen et al. 2021), only the findings and impressions are included. Datasets are randomly split into 7:1:2 for train, val, and test. MIMIC-CXR, the largest publicly available dataset for RRG, contains 337,110 chest X-ray images and 227,835 corresponding reports. We adhere to the official dataset splits to ensure a fair comparison.
Evaluation Metrics. We utilize the widely used Natural Language Generation (NLG) metrics including BLEU{1-4} (Papineni et al. 2002), METOR, and ROUGE-L (Lin 2004) to assess the quality of the generated text reports. Additionally, to evaluate Clinical Efficacy (CE), we use CheXbert (Smit et al. 2020) to annotate labels for 14 observations in medical reports. Precision (P), recall (R), and F1 scores are then calculated based on the labels according to the label between the reference and generated reports. Higher values in both NLG and CE metrics indicate better performance.
Implementation Details. Our method was implemented in PyTorch and trained on an NVIDIA 4090 GPU with 24GB of memory. We employ ResNet101, pre-trained on ImageNet, as the visual extractor, and a randomly initialized Transformer (Vaswani et al. 2017), as the encoder-decoder. The initial learning rate for ResNet101 and remaining networks are and , respectively. We use the Adam optimizer for training and include a beam search of width 3. Maximum report lengths are set to 60 words for IU-Xray and 100 words for MIMIC-CXR. Our model undergoes Maximum Likelihood Estimation(MLE) training for 50 epochs on IU-Xray and 30 epochs on MIMIC-CXR to regularize the action space, followed by an RL training phase using the same optimizer. During training, the sampling interval of the preference vector on both datasets is 0.1, For the IU-Xray dataset, we use NLG metrics as the multi-objective rewards, the batch size is 8, and . For the MIMIC-CXR dataset, we combine NLG and CE metrics as the multi-objective rewards, the batch size is 6, and .
Effective of Preference Guidance
To verify the effectiveness of preference guidance, we test the model trained in a two-dimensional preference vector space. (The results of the three-dimensional preference space are detailed in the supplementary material.) Tables 1 and 2 show the test results with a preference vector sampling interval of 0.2 on the IU-Xray and MIMIC-CXR datasets, respectively. For the IU-Xray dataset, the two rewards in the multi-objective optimization are calculated from the BLEU-1 and ROUGE-L metrics, where and represent their weights, respectively. For the MIMIC-CXR dataset, the two rewards are calculated from BLEU-1 in the NLG metric and F1 in the CE metric. From Table 1, as the weight of BLEU-1 decreases from 1 to 0, the weight of ROUGE-L increases from 0 to 1; the B1 score decreases from 0.548 to 0.531 (the other three BLEU scores also gradually decrease), while the ROUGE-L score increases from 0.413 to 0.415. In Table 2, with this preference configuration, the B1 score decreases from 0.416 to 0.392, and other NLG metrics also gradually decrease, while the F1 score significantly improves from 0.363 to 0.436. Since F1 is calculated based on precision and recall, the change trends of P and R are consistent with F1 and also gradually increase. The above observations demonstrate that our MPO method can customize the behavior of the model by controlling the preference vector, thereby generating reports that align with specific preferences.
| B1 | B2 | B3 | B4 | RG-L | ||
|---|---|---|---|---|---|---|
| 1 | 0 | 0.548 | 0.383 | 0.278 | 0.209 | 0.413 |
| 0.8 | 0.2 | 0.546 | 0.381 | 0.276 | 0.207 | 0.4137 |
| 0.6 | 0.4 | 0.544 | 0.379 | 0.274 | 0.206 | 0.4139 |
| 0.4 | 0.6 | 0.542 | 0.377 | 0.272 | 0.205 | 0.414 |
| 0.2 | 0.8 | 0.537 | 0.374 | 0.270 | 0.203 | 0.4143 |
| 0 | 1 | 0.531 | 0.37 | 0.268 | 0.200 | 0.415 |
| B1 | B2 | B3 | B4 | MTR | RG-L | P | R | F1 | ||
|---|---|---|---|---|---|---|---|---|---|---|
| 1 | 0 | 0.416 | 0.269 | 0.191 | 0.139 | 0.162 | 0.309 | 0.363 | 0.315 | 0.316 |
| 0.8 | 0.2 | 0.413 | 0.267 | 0.188 | 0.137 | 0.161 | 0.308 | 0.375 | 0.319 | 0.318 |
| 0.6 | 0.4 | 0.407 | 0.262 | 0.183 | 0.134 | 0.158 | 0.305 | 0.393 | 0.363 | 0.329 |
| 0.4 | 0.6 | 0.406 | 0.26 | 0.182 | 0.132 | 0.158 | 0.305 | 0.401 | 0.363 | 0.330 |
| 0.2 | 0.8 | 0.405 | 0.259 | 0.181 | 0.131 | 0.157 | 0.303 | 0.412 | 0.364 | 0.335 |
| 0 | 1 | 0.392 | 0.249 | 0.173 | 0.125 | 0.151 | 0.299 | 0.436 | 0.376 | 0.353 |
| Methods | Years | Meeting | IU-Xray | MIMIC-CXR | ||||||||||
|---|---|---|---|---|---|---|---|---|---|---|---|---|---|---|
| B1 | B2 | B3 | B4 | MTR | RG-L | B1 | B2 | B3 | B4 | MTR | RG-L | |||
| R2Gen | 2020 | EMNLP | 0.470 | 0.304 | 0.219 | 0.165 | 0.187 | 0.371 | 0.353 | 0.218 | 0.145 | 0.103 | 0.128 | 0.267 |
| CMN | 2021 | ACL | 0.475 | 0.309 | 0.222 | 0.170 | 0.191 | 0.375 | 0.353 | 0.218 | 0.148 | 0.108 | 0.142 | 0.277 |
| CA | 2021 | ACL | 0.492 | 0.314 | 0.222 | 0.169 | 0.193 | 0.381 | 0.350 | 0.219 | 0.152 | 0.109 | 0.151 | 0.283 |
| CMN+RL | 2022 | ACL | 0.494 | 0.321 | 0.235 | 0.181 | 0.201 | 0.384 | 0.381 | 0.232 | 0.155 | 0.109 | 0.151 | 0.287 |
| XPRONET | 2022 | ECCV | 0.525 | 0.357 | 0.262 | 0.199 | 0.220 | 0.411 | 0.344 | 0.215 | 0.146 | 0.105 | 0.138 | 0.279 |
| KiUT | 2023 | CVPR | 0.525 | 0.360 | 0.251 | 0.185 | 0.242 | 0.409 | 0.393 | 0.243 | 0.159 | 0.113 | 0.160 | 0.285 |
| METrans | 2023 | CVPR | 0.483 | 0.322 | 0.228 | 0.172 | 0.192 | 0.380 | 0.386 | 0.250 | 0.169 | 0.124 | 0.152 | 0.291 |
| MMTN | 2023 | AAAI | 0.486 | 0.321 | 0.232 | 0.175 | - | 0.375 | 0.379 | 0.238 | 0.159 | 0.116 | 0.161 | 0.283 |
| MAN | 2024 | AAAI | 0.501 | 0.328 | 0.230 | 0.170 | 0.213 | 0.386 | 0.396 | 0.244 | 0.162 | 0.115 | 0.151 | 0.274 |
| COMG+RL | 2024 | WACV | 0.536 | 0.378 | 0.275 | 0.206 | 0.218 | 0.383 | 0.363 | 0.235 | 0.167 | 0.124 | 0.128 | 0.290 |
| MPO | Ours | AAAI | 0.548 | 0.383 | 0.278 | 0.209 | 0.224 | 0.415 | 0.416 | 0.269 | 0.191 | 0.139 | 0.162 | 0.309 |
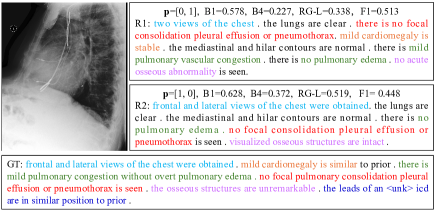
Qualitative results. To further verify the effectiveness of preference guidance intuitively, we perform qualitative analysis on the MIMIC-CXR dataset. Figure 2 shows the comparison between the reference report “GT” and reports generated under two preference configurations. “R1” is the generated report when the preference vector is [0, 1], indicating a complete preference for CE metrics. “R2” is the generated report when the preference vector is [1, 0], indicating a complete preference for NLG metrics. Both R1 and R2 mention the absence of focal pulmonary consolidation, pleural effusion, pneumothorax, and pulmonary edema, and describe the imaging views as “frontal and lateral views of the chest”, consistent with the GT. For the difference, GT mentions “mild pulmonary congestion without overt pulmonary edema” reflected in R1 as “mild pulmonary vascular congestion” while R2 lacks this detail. Both GT and R1 recognize “mild cardiomegaly” as stable, but missing in R2. The above observations indicate that R1 aligns more closely with GT in terms of content consistency and medical terminology. Conversely, R2 has a high degree of overlap in text descriptions but omits critical details like cardiomegaly, which are essential in GT. These observations are consistent with the preference vector, indicating that the preference vector can effectively control the performance of report generation.
| Methods | Years | P | R | F1 |
|---|---|---|---|---|
| R2Gen | 2020 | 0.333 | 0.273 | 0.276 |
| CMN | 2021 | 0.334 | 0.275 | 0.278 |
| CA | 2021 | 0.352 | 0.298 | 0.303 |
| CMN+RL | 2022 | 0.342 | 0.294 | 0.292 |
| KiUT | 2023 | 0.371 | 0.318 | 0.321 |
| METrans | 2023 | 0.364 | 0.309 | 0.311 |
| MAN | 2024 | 0.411 | 0.398 | 0.389 |
| COMG+RL | 2024 | 0.424 | 0.291 | 0.345 |
| MPO | ours | 0.436 | 0.376 | 0.353 |
| Methods | IU-Xray | MIMIC-CXR | |||||||||||||
|---|---|---|---|---|---|---|---|---|---|---|---|---|---|---|---|
| B1 | B2 | B3 | B4 | MTR | RG-L | B1 | B2 | B3 | B4 | MTR | RG-L | P | R | F1 | |
| Base | 0.470 | 0.304 | 0.219 | 0.165 | 0.187 | 0.371 | 0.353 | 0.218 | 0.145 | 0.103 | 0.128 | 0.267 | 0.333 | 0.273 | 0.276 |
| +MOO | 0.540 | 0.376 | 0.273 | 0.202 | 0.220 | 0.408 | 0.381 | 0.243 | 0.168 | 0.122 | 0.144 | 0.298 | 0.372 | 0.358 | 0.312 |
| +MOO+PVF | 0.548 | 0.383 | 0.278 | 0.209 | 0.224 | 0.415 | 0.416 | 0.269 | 0.191 | 0.139 | 0.162 | 0.309 | 0.436 | 0.376 | 0.353 |
Comparison with Previous Works
We compare MPO with a wide range of SOTA methods in the past five years, including R2Gen (Chen et al. 2020), CMN (Chen et al. 2021), CA (Liu et al. 2021b), CMN+RL (Qin and Song 2022), XPRONET (Wang, Bhalerao, and He 2022), KiUT(Huang, Zhang, and Zhang 2023), METrans (Wang et al. 2023), MMTN (Cao et al. 2023), MAN (Shen et al. 2024) and COMG+RL (Gu et al. 2024). The results of other methods are cited from their papers. The NLG results on both datasets are shown in Table 3, and the clinical efficacy results on the MIMIC-CXR are shown in Table 4.
Overall, our proposed MPO achieves the best results on all NLG metrics on both datasets, except for the MTR metric in the IU-Xray dataset, which demonstrates that the proposed MPO method can not only generate reports that cater to human preferences but also generate higher-quality reports. Comparing the CE metrics in Table 4, our method achieves the best performance in precision and the second-best performance in recall and F1 scores. Although MAN has higher recall and F1 scores, it cannot adapt to the preferences of radiologists. Additionally, our MPO significantly outperforms the baseline method R2Gen (Chen et al. 2020) in all metrics. Specifically, improving Precision from 0.333 to 0.436, Recall from 0.273 to 0.376, and F1 from 0.276 to 0.353. The average value of CE is improved by about 9.4%, demonstrating our approach’s effectiveness.
Other Results and Analyses
Ablation Study
Ablation studies are performed on both IU-Xray and MIMIC-CXR datasets to explore the impact of each component in our MPO method. Three variants were investigated: (1) “Base” represents our baseline, R2Gen (Chen et al. 2020). (2) “Base+MOO” combines the baseline with our MOO module. It uses a preference vector to weigh multiple rewards and optimizes it via multi-objective RL. (3) “Base+MOO+PVF” represents our full model, which includes both the PVF and MOO modules. The results are shown in Table 5. “Base+MOO” achieves significant improvements across all metrics on both datasets compared to “Base”, demonstrating that optimizing multiple objective reward functions can significantly improve model performance. Furthermore, “Base+MOO+PVF” outperforms “Base+MOO” in all metrics, suggesting that incorporating preference vectors as conditional inputs and utilizing multi-objective optimization can further improve the performance of report generation.
| Fusion | B1 | B2 | B3 | B4 | MTR | RG-L |
|---|---|---|---|---|---|---|
| Concat | 0.544 | 0.379 | 0.275 | 0.206 | 0.222 | 0.411 |
| Add | 0.541 | 0.378 | 0.275 | 0.208 | 0.222 | 0.412 |
| Mul | 0.543 | 0.378 | 0.274 | 0.205 | 0.222 | 0.410 |
| PVF | 0.548 | 0.383 | 0.278 | 0.209 | 0.224 | 0.415 |
Fusion Methods
In addition to PVF, we explore three other fusion methods to fuse preference vectors. The first concatenates (Concat) the expanded preference vector with the encoded visual features and then applies a linear transformation to obtain the fused features. The second and third methods align the dimension of the preference vector with the encoded visual features through linear transformation and dimensionality expansion, followed by either addition (Add) or dot multiplication (Mul), respectively. As shown in Table 6, our PVF network outperforms other methods across all evaluation metrics. The Concat, Add, and Mul methods perform poorly because they may not capture the complex relationships between preference vectors and encoded visual features through simple fusion. In contrast, the PVF network leverages the attention mechanism to align the preference vector with key information in the visual features, resulting in more effective fusion and superior performance.
| B1 | B2 | B3 | B4 | MTR | RG-L | |
|---|---|---|---|---|---|---|
| 0.1 | 0.539 | 0.375 | 0.273 | 0.206 | 0.221 | 0.409 |
| 0.5 | 0.54 | 0.375 | 0.271 | 0.203 | 0.219 | 0.409 |
| 1 | 0.541 | 0.376 | 0.272 | 0.204 | 0.221 | 0.408 |
| 3 | 0.548 | 0.383 | 0.278 | 0.209 | 0.224 | 0.415 |
| 5 | 0.544 | 0.38 | 0.277 | 0.207 | 0.222 | 0.413 |
| 10 | 0.546 | 0.381 | 0.277 | 0.208 | 0.222 | 0.411 |
Hyperparameter Analysis
Hyperparameter analysis of is conducted on the IU-Xray dataset. The candidate set for includes {0.1, 0.5, 1, 3, 5, 10}. The experimental results in Table 7, indicate that the value of within a reasonable range does not significantly affect the results. The best performance is achieved when .
Conclusion
In this study, we propose a novel method for automatic RRG via Multi-objective Preference Optimization (MPO), which effectively addresses the inherent heterogeneity and multi-dimensionality of radiologists’ preferences. We propose two innovative modules: the preference vector fusion network and the multi-objective optimization module to enable conditional generation and effective preference alignment. By employing preference vectors to condition the RRG model and optimizing the preference-weighted multi-dimensional reward function through reinforcement learning, our model derives an optimal policy over the entire preference space, resulting in a model with high adaptability to different preferences. Through extensive experiments on two public datasets, we have demonstrated that our method can cater to various preferences within a single model and achieve state-of-the-art performance. In future work, we will explore designing new evaluation metrics as reward functions for preference alignment.
Acknowledgement
This work is supported by the National Natural Science Foundation of China under Grant No. 62306115 and No. 62476087.
References
- Cao et al. (2023) Cao, Y.; Cui, L.; Zhang, L.; Yu, F.; Li, Z.; and Xu, Y. 2023. MMTN: multi-modal memory transformer network for image-report consistent medical report generation. In Proceedings of the AAAI Conference on Artificial Intelligence, volume 37, 277–285.
- Chen et al. (2021) Chen, Z.; Shen, Y.; Song, Y.; and Wan, X. 2021. Cross-modal Memory Networks for Radiology Report Generation. In Proceedings of the 59th Annual Meeting of the Association for Computational Linguistics and the 11th International Joint Conference on Natural Language Processing (Volume 1: Long Papers), 5904–5914.
- Chen et al. (2020) Chen, Z.; Song, Y.; Chang, T.-H.; and Wan, X. 2020. Generating Radiology Reports via Memory-driven Transformer. In Proceedings of the 2020 Conference on Empirical Methods in Natural Language Processing (EMNLP), 1439–1449.
- Delbrouck et al. (2022) Delbrouck, J.-B.; Chambon, P.; Bluethgen, C.; Tsai, E.; Almusa, O.; and Langlotz, C. 2022. Improving the Factual Correctness of Radiology Report Generation with Semantic Rewards. In Findings of the Association for Computational Linguistics: EMNLP 2022, 4348–4360.
- Demner-Fushman et al. (2016) Demner-Fushman, D.; Kohli, M. D.; Rosenman, M. B.; Shooshan, S. E.; Rodriguez, L.; Antani, S.; Thoma, G. R.; and McDonald, C. J. 2016. Preparing a collection of radiology examinations for distribution and retrieval. Journal of the American Medical Informatics Association, 23(2): 304–310.
- Gu et al. (2024) Gu, T.; Liu, D.; Li, Z.; and Cai, W. 2024. Complex Organ Mask Guided Radiology Report Generation. In Proceedings of the IEEE/CVF Winter Conference on Applications of Computer Vision (WACV), 7995–8004.
- Gu et al. (2021) Gu, Y.; Tinn, R.; Cheng, H.; Lucas, M.; Usuyama, N.; Liu, X.; Naumann, T.; Gao, J.; and Poon, H. 2021. Domain-specific language model pretraining for biomedical natural language processing. ACM Transactions on Computing for Healthcare (HEALTH), 3(1): 1–23.
- He et al. (2016) He, K.; Zhang, X.; Ren, S.; and Sun, J. 2016. Deep residual learning for image recognition. In Proceedings of the IEEE conference on computer vision and pattern recognition, 770–778.
- Huang, Zhang, and Zhang (2023) Huang, Z.; Zhang, X.; and Zhang, S. 2023. Kiut: Knowledge-injected u-transformer for radiology report generation. In Proceedings of the IEEE/CVF Conference on Computer Vision and Pattern Recognition, 19809–19818.
- Jin et al. (2024) Jin, H.; Che, H.; Lin, Y.; and Chen, H. 2024. Promptmrg: Diagnosis-driven prompts for medical report generation. In Proceedings of the AAAI Conference on Artificial Intelligence, volume 38, 2607–2615.
- Jing, Xie, and Xing (2018) Jing, B.; Xie, P.; and Xing, E. 2018. On the Automatic Generation of Medical Imaging Reports. In Proceedings of the 56th Annual Meeting of the Association for Computational Linguistics (Volume 1: Long Papers), 2577–2586.
- Johnson et al. (2019) Johnson, A. E.; Pollard, T. J.; Greenbaum, N. R.; Lungren, M. P.; Deng, C.-y.; Peng, Y.; Lu, Z.; Mark, R. G.; Berkowitz, S. J.; and Horng, S. 2019. MIMIC-CXR-JPG, a large publicly available database of labeled chest radiographs. arXiv preprint arXiv:1901.07042.
- Kale et al. (2023) Kale, K.; Bhattacharyya, P.; Shetty, A.; Gune, M.; Shrivastava, K.; Lawyer, R.; and Biswas, S. 2023. “Knowledge is Power”: Constructing Knowledge Graph of Abdominal Organs and Using Them for Automatic Radiology Report Generation. In Proceedings of the 61st Annual Meeting of the Association for Computational Linguistics (Volume 5: Industry Track), 11–24.
- Li et al. (2018) Li, Y.; Liang, X.; Hu, Z.; and Xing, E. P. 2018. Hybrid retrieval-generation reinforced agent for medical image report generation. Advances in neural information processing systems, 31.
- Lin (2004) Lin, C.-Y. 2004. Rouge: A package for automatic evaluation of summaries. In Text summarization branches out, 74–81.
- Liu et al. (2024a) Liu, A.; Guo, Y.; Yong, J.-h.; and Xu, F. 2024a. Multi-grained Radiology Report Generation with Sentence-level Image-language Contrastive Learning. IEEE Transactions on Medical Imaging.
- Liu et al. (2024b) Liu, C.; Tian, Y.; Chen, W.; Song, Y.; and Zhang, Y. 2024b. Bootstrapping Large Language Models for Radiology Report Generation. In Proceedings of the AAAI Conference on Artificial Intelligence, volume 38, 18635–18643.
- Liu et al. (2021a) Liu, F.; Wu, X.; Ge, S.; Fan, W.; and Zou, Y. 2021a. Exploring and distilling posterior and prior knowledge for radiology report generation. In Proceedings of the IEEE/CVF conference on computer vision and pattern recognition, 13753–13762.
- Liu et al. (2021b) Liu, F.; Yin, C.; Wu, X.; Ge, S.; Zhang, P.; and Sun, X. 2021b. Contrastive Attention for Automatic Chest X-ray Report Generation. In Findings of the Association for Computational Linguistics: ACL-IJCNLP 2021, 269–280.
- Miura et al. (2021) Miura, Y.; Zhang, Y.; Tsai, E.; Langlotz, C.; and Jurafsky, D. 2021. Improving Factual Completeness and Consistency of Image-to-Text Radiology Report Generation. In Proceedings of the 2021 Conference of the North American Chapter of the Association for Computational Linguistics: Human Language Technologies, 5288–5304.
- Najdenkoska et al. (2021) Najdenkoska, I.; Zhen, X.; Worring, M.; and Shao, L. 2021. Variational topic inference for chest x-ray report generation. In Medical Image Computing and Computer Assisted Intervention–MICCAI 2021: 24th International Conference, Strasbourg, France, September 27–October 1, 2021, Proceedings, Part III 24, 625–635. Springer.
- Papineni et al. (2002) Papineni, K.; Roukos, S.; Ward, T.; and Zhu, W. 2002. Bleu: a Method for Automatic Evaluation of Machine Translation. In Proceedings of the 40th Annual Meeting of the Association for Computational Linguistics, July 6-12, 2002, Philadelphia, PA, USA, 311–318. ACL.
- Qin and Song (2022) Qin, H.; and Song, Y. 2022. Reinforced cross-modal alignment for radiology report generation. In Findings of the Association for Computational Linguistics: ACL 2022, 448–458.
- Rennie et al. (2017) Rennie, S. J.; Marcheret, E.; Mroueh, Y.; Ross, J.; and Goel, V. 2017. Self-critical sequence training for image captioning. In Proceedings of the IEEE conference on computer vision and pattern recognition, 7008–7024.
- Shan et al. (2024) Shan, Z.; Fan, C.; Qiu, S.; Shi, J.; and Bai, C. 2024. Forward kl regularized preference optimization for aligning diffusion policies. arXiv preprint arXiv:2409.05622.
- Shen et al. (2024) Shen, H.; Pei, M.; Liu, J.; and Tian, Z. 2024. Automatic Radiology Reports Generation via Memory Alignment Network. In Proceedings of the AAAI Conference on Artificial Intelligence, volume 38, 4776–4783.
- Smit et al. (2020) Smit, A.; Jain, S.; Rajpurkar, P.; Pareek, A.; Ng, A. Y.; and Lungren, M. 2020. Combining Automatic Labelers and Expert Annotations for Accurate Radiology Report Labeling Using BERT. In Proceedings of the 2020 Conference on Empirical Methods in Natural Language Processing (EMNLP), 1500–1519.
- Song et al. (2022) Song, X.; Zhang, X.; Ji, J.; Liu, Y.; and Wei, P. 2022. Cross-modal contrastive attention model for medical report generation. In Proceedings of the 29th International Conference on Computational Linguistics, 2388–2397.
- Tanida et al. (2023) Tanida, T.; Müller, P.; Kaissis, G.; and Rueckert, D. 2023. Interactive and explainable region-guided radiology report generation. In Proceedings of the IEEE/CVF Conference on Computer Vision and Pattern Recognition, 7433–7442.
- Vaswani et al. (2017) Vaswani, A.; Shazeer, N.; Parmar, N.; Uszkoreit, J.; Jones, L.; Gomez, A. N.; Kaiser, Ł.; and Polosukhin, I. 2017. Attention is all you need. Advances in neural information processing systems, 30.
- Wang et al. (2020) Wang, F.; Liang, X.; Xu, L.; and Lin, L. 2020. Unifying relational sentence generation and retrieval for medical image report composition. IEEE transactions on cybernetics, 52(6): 5015–5025.
- Wang, Bhalerao, and He (2022) Wang, J.; Bhalerao, A.; and He, Y. 2022. Cross-modal prototype driven network for radiology report generation. In European Conference on Computer Vision, 563–579. Springer.
- Wang et al. (2023) Wang, Z.; Liu, L.; Wang, L.; and Zhou, L. 2023. Metransformer: Radiology report generation by transformer with multiple learnable expert tokens. In Proceedings of the IEEE/CVF Conference on Computer Vision and Pattern Recognition, 11558–11567.
- Wang et al. (2022) Wang, Z.; Tang, M.; Wang, L.; Li, X.; and Zhou, L. 2022. A medical semantic-assisted transformer for radiographic report generation. In International Conference on Medical Image Computing and Computer-Assisted Intervention, 655–664. Springer.
- Wang et al. (2021) Wang, Z.; Zhou, L.; Wang, L.; and Li, X. 2021. A self-boosting framework for automated radiographic report generation. In Proceedings of the IEEE/CVF Conference on Computer Vision and Pattern Recognition, 2433–2442.
- Williams (1992) Williams, R. J. 1992. Simple statistical gradient-following algorithms for connectionist reinforcement learning. Machine learning, 8: 229–256.
- Wu, Huang, and Huang (2023) Wu, Y.; Huang, I.-C.; and Huang, X. 2023. Token Imbalance Adaptation for Radiology Report Generation. In Conference on Health, Inference, and Learning, 72–85. PMLR.
- Yang et al. (2023) Yang, S.; Wu, X.; Ge, S.; Zheng, Z.; Zhou, S. K.; and Xiao, L. 2023. Radiology report generation with a learned knowledge base and multi-modal alignment. Medical Image Analysis, 86: 102798.
- Yang et al. (2022) Yang, S.; Wu, X.; Ge, S.; Zhou, S. K.; and Xiao, L. 2022. Knowledge matters: Chest radiology report generation with general and specific knowledge. Medical image analysis, 80: 102510.
- You et al. (2021) You, D.; Liu, F.; Ge, S.; Xie, X.; Zhang, J.; and Wu, X. 2021. Aligntransformer: Hierarchical alignment of visual regions and disease tags for medical report generation. In Medical Image Computing and Computer Assisted Intervention–MICCAI 2021: 24th International Conference, Strasbourg, France, September 27–October 1, 2021, Proceedings, Part III 24, 72–82. Springer.
- Yu et al. (2024) Yu, X.; Bai, C.; He, H.; Wang, C.; and Li, X. 2024. Regularized Conditional Diffusion Model for Multi-Task Preference Alignment. arXiv preprint arXiv:2404.04920.
- Yuan et al. (2024) Yuan, X.; Shang, Z.; Wang, Z.; Wang, C.; Shan, Z.; Qi, Z.; Zhu, M.; Bai, C.; and Li, X. 2024. Preference Aligned Diffusion Planner for Quadrupedal Locomotion Control. arXiv preprint arXiv:2410.13586.