Americans’ Support for AI Development - Measured Daily with Open Data and Methods
Abstract.
A confluence of maturing Web technologies and Web platforms affords a new form of scientific communication: free and open nowcasting of public opinion. Here, I present the first open-source system to do so. The automated system gathers new human responses to survey items daily, anonymizes and publicly distributes microdata, and presents analyses through a publicly viewable Web dashboard. A demonstration implementation tracked support for further development of artificial intelligence at daily resolution. As of 2024-11-17, the system had autonomously produced 214 daily estimates of support. I argue that more scientists should adopt the method of open nowcasting, because it encourages transparency in research design and eases replication.
1. Introduction
As researchers, we should employ technology to make the process of discovering truth more efficient. Here I present an open-source system with that aim. Specifically, the system creates and automatically updates a new form of scientific communication: a daily nowcast of public opinion.
Nowcasting is defined as ”predicting” the present, the very recent past and the very near future (BańBura et al., 2011). As a practice, nowcasting began in meteorology, but more recently has been imported into social science. Specifically, economists have nowcasted Gross Domesitic Product (GDP) estimates (Bok et al., 2018) between official figures – which are low-frequency, delayed and often revised after initial release. There is tremendous value in high-frequency, immediately available quantitative information, and that is just as true for American attitudes as it is for GDP figures.
Social science in general could benefit from daily-updated data. The General Social Survey (arguably the most widely used social science instrument) releases new data every two years. The American National Election Studies project collects data every four years. A successful precedent for daily data has been set, however. The Global Database of Events, Language and Tone compiles scrapes of news stories into daily datasets released in real-time. Researchers have found this useful; Leetaru and Schrodt (Leetaru and Schrodt, 2013) has been cited by over 900 manuscripts.
The current work demonstrates an open-source system to collect survey response data at daily resolution and nowcast public opinion. The goal of the system is to provide research communities with a workflow that converts modest investments in time and money into consistently, persistently growing public datasets.
1.1. Demonstrating Free and Open Daily Nowcasting
Do Americans support further development of artificial intelligence (AI)? It is common sense to quantify and persistently track a response to this question for several reasons. First, many commercial entities are pursuing development of AI and making rapid progress that might cause disruptive change to economic and social systems. Second, billions of US dollars are being spent by the federal and state governments toward the aim of furthering development. Third, there are outspoken sources which characterize further development of AI as a doomsday scenario that will end in human extinction. Continuous observation of the distribution of Americans’ support has practical application, and at the same time, presents an unprecedented opportunity to ”nowcast” evolving public opinion on a developing technology.
Many careful studies of public opinion on AI have been conducted (Schepman and Rodway, 2020; Sindermann et al., 2021; Jones and Skiena, 2024) . Each presented data at annual or one-shot temporal resolution, however. In the quickly-evolving domain of AI development, finer-grained data available at low-latency would be extremely valuable.
More broadly, the system demonstrated here is meant to be adapted to address other social science research questions. Daily data collected and distributed consistently and persistently has open-science transparency unavoidably built-in. It creates an affordance for short feedback loops: predict, observe, update models, repeat. For these reasons, I believe automated daily nowcasting should be an aim more researchers pursue.
2. Social Science Dashboard Inator: A System to Collect, Distribute and Present Nowcasted Public Opinion
The Social Science Dashboard Inator (SSDI, https://github.com/jasonjeffreyjones/social-science-dashboard-inator) is a free and open source system that automates this process:
-
(1)
From a large pool of potential survey respondents, choose a small random set and distribute a short survey to them.
-
(2)
Download survey responses, match these to known demographics of respondents and publish an anonymized, structured microdata file to a public data repository.
-
(3)
Update a web dashboard that summarizes results and tests hypotheses.
Using the system has many benefits. The primary benefit is continuous, automated data collection. A researcher invests the effort of a one-time setup and is then rewarded with new data every day. Temporal trends are automatically detected in real-time. The system scales with funding investment. If one increases spending, they can choose higher precision estimates and/or a larger battery of items.
A secondary benefit of this approach is the built-in commitment to research transparency. The best way to promote data sharing is to make it automatic. Social Science Dashboard Inator forces adherence to open-science practices. Automated daily scripts collect data, share it publicly, and instantly conduct replicable analysis with open-source code.
Only two paid services — Qualtrics and Prolific — are currently in the workflow. These are familiar and often available tools for social scientists. Both could conceivably be replaced with free tools. Here they were included as convenient providers for survey delivery.
2.1. Technical Specifications
Table 1 illustrates the daily, looping, automated process. Each day, new data is collected, wrangled, analyzed and publicly distributed. Importantly, this process is completely automated. A short series of open-source scripts (R and Python) perform each step in sequence. The scripts are triggered by cron jobs and log their progress. There is no manual process; daily data collection and analysis proceeds autonomously. The primary investigator and the broader community can watch as estimates become more precise and temporal trends appear in the compounding data.
| Step | Event |
|---|---|
| 1 | New respondents recruited |
| 2 | New data collected |
| 3 | Cumulative file updated and shared |
| 4 | Analyses performed on new cumulative data |
| 5 | Web dashboard updated to display results |
Table 2 illustrates the one-time manual setup process. The setup contains familiar and unfamiliar steps. Familiar to researchers will be creating surveys and paying for respondent recruitment. Less familiar steps are creating cron jobs and obtaining API credentials. These can be handled by technical support staff or obviated when a fully-hosted, multiuser system is created. (The author is applying for funding to develop a hosted system.)
Several best practices should be followed during setup. First, a public repository must be created. It should be hosted publicly at a data archive such as the Open Science Framework or Harvard Dataverse. The repository contains the survey items and response options as text. A Qualtrics archive file is also recommended, because it can contain additional information such as the form of order randomization employed. The repository should also contain all other files (e.g. R and Python scripts, HTML templates for the Web dashboard).
A second best practice is to make only the minimum modifications necessary to the Inator template files. The template produces daily estimates and a visualization for each item in the survey. An example demonstrates aggregation over different time scales (e.g. monthly) as well as bivariate and multivariate analyses. Researchers are encouraged to keep their instances consistent with the templates so that the process remains consistent and familiar across projects, but of course they are free to modify files as justified by their needs.
| Step | Task | Recommended Tool |
|---|---|---|
| 1 | Compose an online survey | Qualtrics XM |
| 2 | Set up daily respondent recruitment | Prolific API, Python |
| 3 | Modify analysis code | R |
| 4 | Modify presentation templates | HTML, CSS |
| 5 | Set up web server | Institution or AWS |
| 6 | Upload all files | SFTP |
| 7 | Set up daily jobs | cron, command line |
3. Demonstration Survey Methods and Results
To pilot the Social Science Dashboard Inator, the author fielded a survey to American adults on the topic of artificial intelligence. The automated loop (Table 1) delivered the survey to a random selection of 11 respondents from the approximately 90,000 eligible Prolific users every day. The survey began running on April 18, 2024 and has run continuously since. More than 2000 respondents have provided data.
The primary item - and the focus of this report - measures support for further development of AI. Specifically, the respondent is asked how much they agree with the statement I support further development of artificial intelligence. Response options ranged from Strongly disagree to Strongly agree. The intention is to measure support consistently and persistently, so that changing attitudes among the American public are detected in real-time.
To ease visualization and analysis, the author makes the strong assumption that responses can be treated as an interval variable. See the mapping on the vertical axis of Figure 1. Note that some discussions of Likert-type data recommend that only summed scales of items be treated as interval and that single items be analyzed with non-parametric tests(Batterton and Hale, 2017). One of the advantages of the current approach is that all data is available for those who prefer this approach to the current.
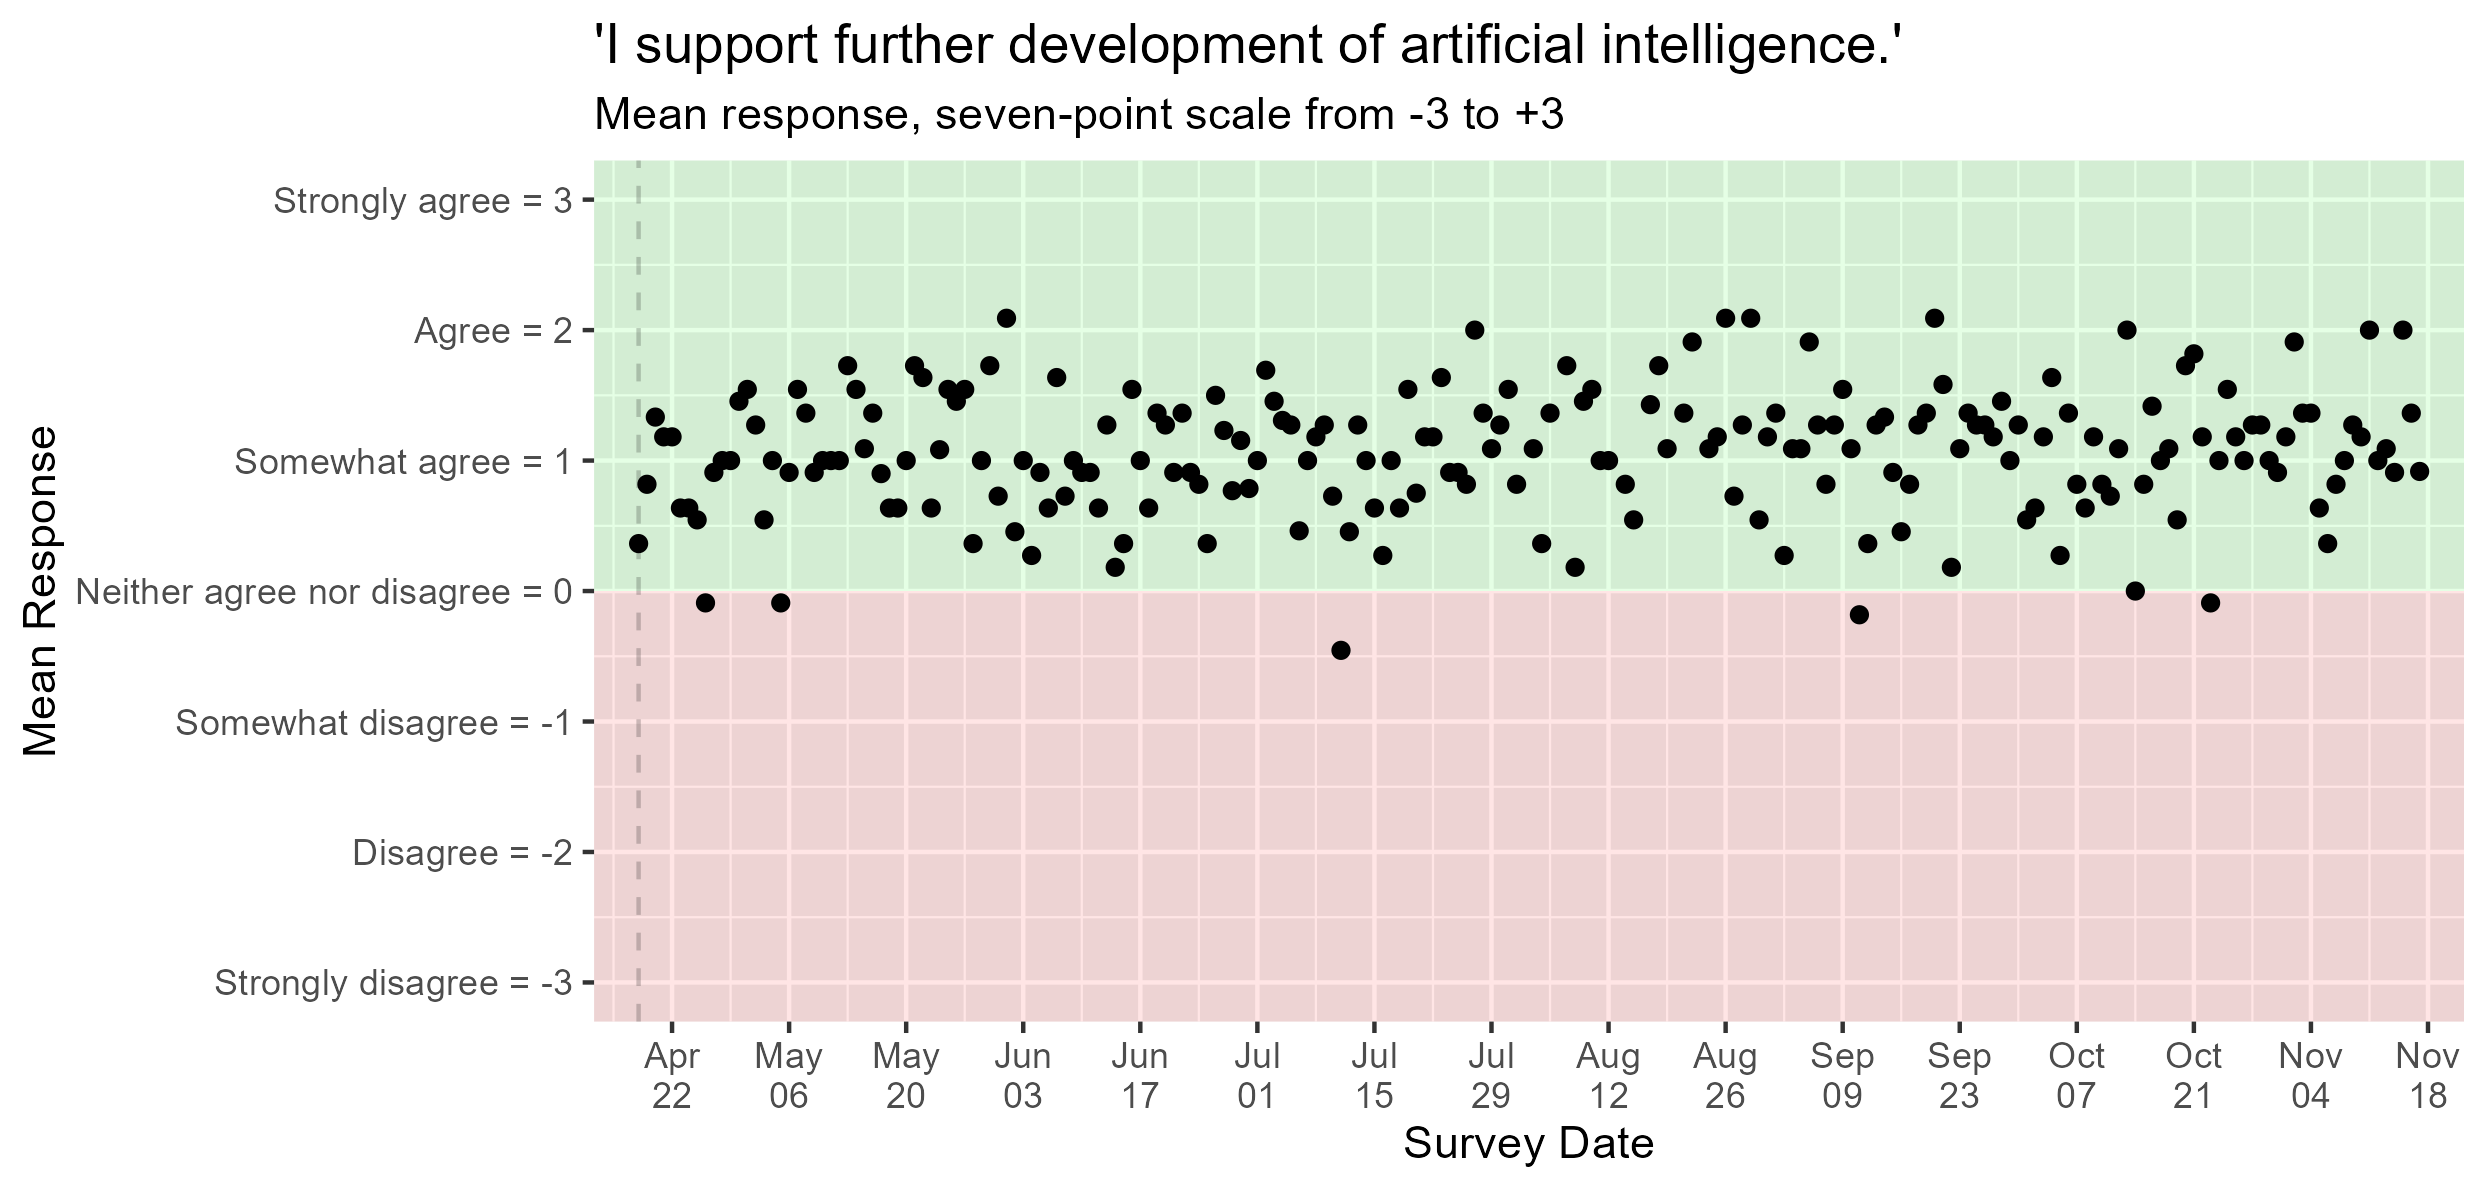
On a plot, black points show American adults’ support for further AI development on the vertical axis and dates on the horizontal axis.
3.1. Daily Support Series
Daily estimates of American adults’ support for further AI development are displayed in Figure 1. Daily data collection began in April of 2024, and support was modestly positive. After mapping the seven responses to the values -3 through +3, one finds a mean support value for the first 30 daily estimates of 0.99, with a 95% confidence interval (CI) of [0.94,1.03]. For the last 30 daily estimates, the mean support value was 1.16, CI:[1.11,1.21]. In a linear regression over all 214 daily estimates, the estimated coefficient for daily change was positive (0.0008), but the confidence interval included zero [-0.0002,0.0019]. One may conclude that evidence for increasing support is equivocal and extending the series to provide further evidence would be very welcome. Narratives of extreme change or fluctuation in support would be not be supported by this evidence.
Compare these results to previous surveys. Jones and Skiena (Jones and Skiena, 2022) fielded the item How much do you oppose or support the development of Artificial Intelligence? weekly from 2020 through 2022. Response options were the values 1 to 7 with 1 labeled as Strongly oppose and 7 Strongly support. They wrote:
On average, the American public supports the development of Artificial Intelligence. In the data from April 14, 2022, the estimated mean response is 4.48, with a 95% confidence interval of 4.12–4.83. On our 7-point scale … a value of 4 indicates indifference, any value below that opposition and any point above support. In 82 weeks of running this same survey item, we have never observed a mean estimate below the midpoint of the scale.
The current results closely match these older observations. Given the opportunity to express their support for further development of AI in 2024, the public was modestly positive. Similarly, when asked whether they opposed or supported development from 2020 through 2022, the balance of responses were mildly in support.
Zhang and Dafoe (Zhang and Dafoe, 2019) posed the same question to Americans in 2018. They describe their results this way:
Americans express mixed support for the development of AI, although more support than oppose the development of AI … A substantial minority (41%) somewhat or strongly supports the development of AI. A smaller minority (22%) somewhat or strongly oppose its development. Many express a neutral attitude: 28% of respondents state that they neither support nor oppose while 10% indicate they do not know.
Inspection of Figure 2 affords comparison to these previous results. In this histogram, date of data collection is ignored, and the frequency of each discrete response is plotted. The modal response was Agree and there are more responses to the right than to the left of Neither agree nor disagree. Despite all the many changes in the field of AI from 2018 through 2024, Americans’ average support for further development was and remains slightly favorable.
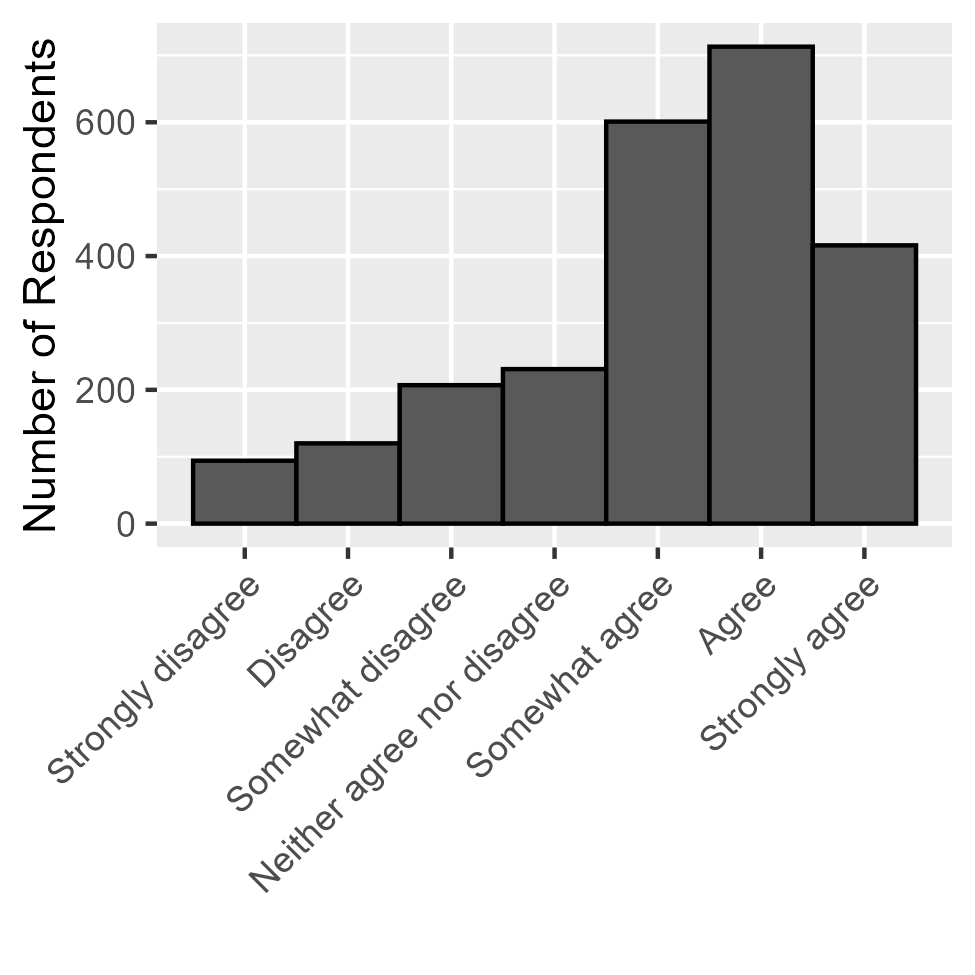
On a plot, bars show how many American adults responded with each level of support for further AI development.
3.2. Political Polarization
Because Prolific was used as the respondent recruitment platform, several demographic variables were available for every respondent. In Figure 3, support is plotted as a function of political party affiliation. Responses were aggregated monthly to increase precision of estimates. The results reveal no evidence that Democrats and Republicans were widely polarized or are polarizing on AI support.
Summarizing across all responses, the mean AI Support from Democrats was 1.13 and from Republicans 1.02. The 95% confidence interval for the difference was [-0.03,0.25]. In 2024, both Democrats and Republicans expressed mild support for further development of artificial intelligence. The advantage of the SSDI will be continuous monitoring of polarization through future political and technological changes.
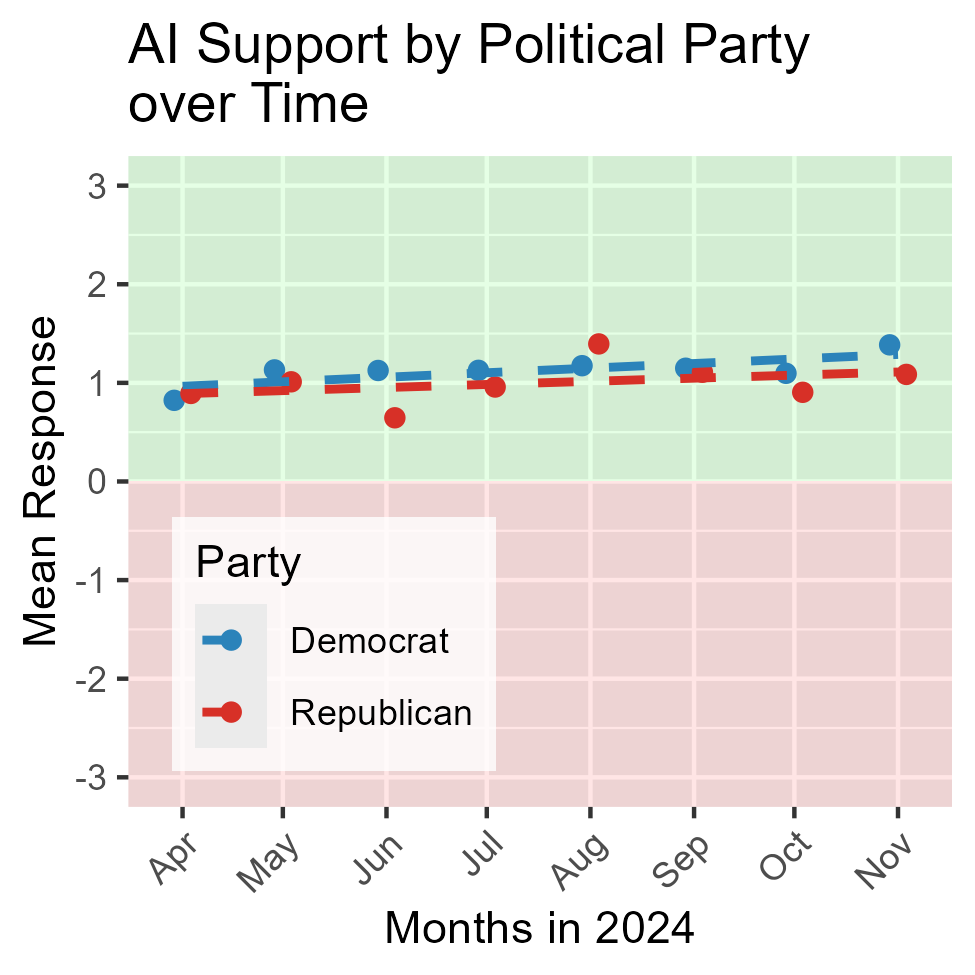
On a plot, lines and points show how American adults’ support for further AI development differs between Democrats and Republicans over time.
4. Discussion
The call-for-papers requested work with an aim of ”maintaining a human-centric web in the era of Generative AI” and addressing the issue that ”trust and community have been eroded.” This project tackles both. First, the main product is a Web application that surfaces human opinions. The responses of individuals were collected and visualized to provide open access to the perspectives of people.
To build trust, every aspect of research was made publicly, freely available. Every prompt, response, demographic, analysis procedure, analysis result and interpretation can be inspected by anyone.
It is the hope of the author that ongoing SSDIs create communities and communities create SSDIs. The processes described in Section 2.1 are agnostic in regards to what attitudes are being nowcast. Whatever a research community wishes to continuously monitor - be it fear, hope, sleep, activity, affinity, polarization, etc. - an SSDI creates consistent data at high temporal resolution. Time series data produced by nowcasting makes it much easier to address questions of the form: When did X begin changing and why?
SSDIs are meant to tackle two crises facing social science. First is the replication/reproducibility crisis. Now in its second decade, the crisis began with a respected psychologist publishing a claim for extra-sensory perceptions of future events in a peer-reviewed journal using standard procedural and statistical techniques. Despite much discussion about this absurd outcome, surprisingly little has changed in the way we conduct social science.
The second crisis is more recent and less discussed, but just as challenging. Call this the ”predictability crisis.” Growth in theories that successfully predict outcomes in human lives has not tracked in sync with the explosive growth in available data on human lives (Hofman et al., 2017). As an example, consider the Salganik, et al., 2020 mass collaboration (Salganik et al., 2020). The final report describes the unimpressive results of more than 100 researchers collaborating and competing on the common task of predicting life outcomes (such as grade point average) from extensive survey data starting at birth. No matter the technique or predictive features teams focused on, prediction performance (measured with R-squared on holdout data) was rarely – and then only modestly – better than a baseline model.
Daily nowcasting with freely and openly available data and methods directly confronts both crises. Open access to the data and analysis code makes reproducibility trivially easy. Attempts at replication can begin with full knowledge of the procedures and materials used in the original SSDI. In fact, there is nothing to prevent other researchers from simultaneous reproduction or replication. Fundamental disagreements about the best way to measure a construct or conduct analysis on data can be addressed immediately by parallel dashboards.
SSDIs offer scientists an opportunity to undertake principled prediction. Worthwhile theories and models should have something to say about the future trajectory of the daily time series. Consistent, persistent estimates provide accountability to the predictions made by theories and models. Collecting these estimates daily and continuously dramatically shortens the feedback loop as compared to a process of waiting years for data and further years for articles interpreting the data.
In summary, the author advocates for daily nowcasting as a powerful method to improve and accelerate social science. Here I present an open source system to automate the process. Further, I offer the initial results of the first demonstration project.
Future development will streamline the setup process. Ultimately, the goal is to provide research communities with tools that convert modest investments in time and money into consistently, persistently growing public datasets.
Acknowledgements.
¡Acknowledgements redacted to preserve anonymity¿ All funding for this project was provided by Jason Jeffrey Jones Productions (https://jasonjones.ninja/jason-jeffrey-jones-productions/).References
- (1)
- Batterton and Hale (2017) Katherine A Batterton and Kimberly N Hale. 2017. The Likert scale what it is and how to use it. Phalanx 50, 2 (2017), 32–39. Publisher: JSTOR.
- BańBura et al. (2011) M. BańBura, D. Giannone, and L. Reichlin. 2011. Nowcasting. Oxford University Press, Oxford. https://www.oxfordhandbooks.com/view/10.1093/oxfordhb/9780195398649.001.0001/oxfordhb-9780195398649-e-8
- Bok et al. (2018) Brandyn Bok, Daniele Caratelli, Domenico Giannone, Argia M Sbordone, and Andrea Tambalotti. 2018. Macroeconomic nowcasting and forecasting with big data. Annual Review of Economics 10 (2018), 615–643. Publisher: Annual Reviews.
- Hofman et al. (2017) Jake M. Hofman, Amit Sharma, and Duncan J. Watts. 2017. Prediction and explanation in social systems. Science 355, 6324 (Feb. 2017), 486–488. https://doi.org/10.1126/science.aal3856 Publisher: American Association for the Advancement of Science.
- Jones and Skiena (2024) Jason Jeffrey Jones and Steven Skiena. 2024. Attitudes Toward Artificial General Intelligence: Results from American Adults in 2021 and 2023. Seeds of Science (Feb. 2024). https://doi.org/10.53975/8b8e-9e08
- Jones and Skiena (2022) Jason Jeffrey Jones and Steven S Skiena. 2022. Jones-Skiena Public Opinion of AI Dashboard. https://jasonjones.ninja/jones-skiena-public-opinion-of-ai/
- Leetaru and Schrodt (2013) Kalev Leetaru and Philip A Schrodt. 2013. Gdelt: Global data on events, location, and tone, 1979–2012. In ISA annual convention, Vol. 2. Citeseer, 1–49. Issue: 4.
- Salganik et al. (2020) Matthew J. Salganik, Ian Lundberg, Alexander T. Kindel, Caitlin E. Ahearn, Khaled Al-Ghoneim, Abdullah Almaatouq, Drew M. Altschul, Jennie E. Brand, Nicole Bohme Carnegie, Ryan James Compton, Debanjan Datta, Thomas Davidson, Anna Filippova, Connor Gilroy, Brian J. Goode, Eaman Jahani, Ridhi Kashyap, Antje Kirchner, Stephen McKay, Allison C. Morgan, Alex Pentland, Kivan Polimis, Louis Raes, Daniel E. Rigobon, Claudia V. Roberts, Diana M. Stanescu, Yoshihiko Suhara, Adaner Usmani, Erik H. Wang, Muna Adem, Abdulla Alhajri, Bedoor AlShebli, Redwane Amin, Ryan B. Amos, Lisa P. Argyle, Livia Baer-Bositis, Moritz Büchi, Bo-Ryehn Chung, William Eggert, Gregory Faletto, Zhilin Fan, Jeremy Freese, Tejomay Gadgil, Josh Gagné, Yue Gao, Andrew Halpern-Manners, Sonia P. Hashim, Sonia Hausen, Guanhua He, Kimberly Higuera, Bernie Hogan, Ilana M. Horwitz, Lisa M. Hummel, Naman Jain, Kun Jin, David Jurgens, Patrick Kaminski, Areg Karapetyan, E. H. Kim, Ben Leizman, Naijia Liu, Malte Möser, Andrew E. Mack, Mayank Mahajan, Noah Mandell, Helge Marahrens, Diana Mercado-Garcia, Viola Mocz, Katariina Mueller-Gastell, Ahmed Musse, Qiankun Niu, William Nowak, Hamidreza Omidvar, Andrew Or, Karen Ouyang, Katy M. Pinto, Ethan Porter, Kristin E. Porter, Crystal Qian, Tamkinat Rauf, Anahit Sargsyan, Thomas Schaffner, Landon Schnabel, Bryan Schonfeld, Ben Sender, Jonathan D. Tang, Emma Tsurkov, Austin van Loon, Onur Varol, Xiafei Wang, Zhi Wang, Julia Wang, Flora Wang, Samantha Weissman, Kirstie Whitaker, Maria K. Wolters, Wei Lee Woon, James Wu, Catherine Wu, Kengran Yang, Jingwen Yin, Bingyu Zhao, Chenyun Zhu, Jeanne Brooks-Gunn, Barbara E. Engelhardt, Moritz Hardt, Dean Knox, Karen Levy, Arvind Narayanan, Brandon M. Stewart, Duncan J. Watts, and Sara McLanahan. 2020. Measuring the predictability of life outcomes with a scientific mass collaboration. Proceedings of the National Academy of Sciences 117, 15 (April 2020), 8398–8403. https://doi.org/10.1073/pnas.1915006117 Publisher: National Academy of Sciences Section: Social Sciences.
- Schepman and Rodway (2020) Astrid Schepman and Paul Rodway. 2020. Initial validation of the general attitudes towards Artificial Intelligence Scale. Computers in human behavior reports 1 (2020), 100014. Publisher: Elsevier.
- Sindermann et al. (2021) Cornelia Sindermann, Peng Sha, Min Zhou, Jennifer Wernicke, Helena S Schmitt, Mei Li, Rayna Sariyska, Maria Stavrou, Benjamin Becker, and Christian Montag. 2021. Assessing the attitude towards artificial intelligence: Introduction of a short measure in German, Chinese, and English language. KI-Künstliche intelligenz 35 (2021), 109–118. Publisher: Springer.
- Zhang and Dafoe (2019) Baobao Zhang and Allan Dafoe. 2019. Artificial intelligence: American attitudes and trends. Available at SSRN 3312874 (2019).