MozzaVID: Mozzarella Volumetric Image Dataset
Abstract
Influenced by the complexity of volumetric imaging, there is a shortage of established datasets useful for benchmarking volumetric deep-learning models. As a consequence, new and existing models are not easily comparable, limiting the development of architectures optimized specifically for volumetric data. To counteract this trend, we introduce MozzaVID – a large, clean, and versatile volumetric classification dataset. Our dataset contains X-ray computed tomography (CT) images of mozzarella microstructure and enables the classification of 25 cheese types and 149 cheese samples. We provide data in three different resolutions, resulting in three dataset instances containing from 591 to 37,824 images. While being general-purpose, the dataset also facilitates investigating mozzarella structure properties. The structure of food directly affects its functional properties and thus its consumption experience. Understanding food structure helps tune the production and mimicking it enables sustainable alternatives to animal-derived food products. The complex and disordered nature of food structures brings a unique challenge, where a choice of appropriate imaging method, scale, and sample size is not trivial. With this dataset we aim to address these complexities, contributing to more robust structural analysis models. The dataset can be downloaded from: https://archive.compute.dtu.dk/files/public/projects/MozzaVID/.
1 Introduction
Volumetric images serve the purpose of investigating the internal shape and structure of an object, making them an important tool in fields such as medical imaging [58, 14, 26], material science [52, 43, 17], paleontology [59, 8] and food science [54, 16]. With the growing use of volumetric data, many image analysis algorithms have been developed to work well with this modality. Most notably, the versatility and power of deep learning methods have caused them to dominate research contributions, especially in the medical field [70, 35, 56, 50]. Together with this development, an interest in obtaining comprehensive, well-curated volumetric datasets [64, 55, 47, 49] has grown proportionally.
While the availability of volumetric datasets grows, their properties are still far from those known in 2D datasets. The complexity of image acquisition and the size of volumetric data mean that most datasets contain a small number of big image instances (typically between 1 and 100), with only a handful of moderately sized collections (containing between 100 and 10,000 volumes) [2, 1, 46, 27]. However, these bigger datasets typically target a complex scientific question that is difficult to address within a single deep-learning task. In comparison, even the smallest of widely recognized 2D datasets contain upwards of 60,000 images [11, 34, 37]. The main purpose of these datasets is often to support generic method development, which is then reflected in their design.
In 2D model development, it has become a standard practice to evaluate proposed architectures on a set of benchmark datasets [25, 53, 39, 15, 38, 68, 60], demonstrating their versatility across different tasks. However, the limitations of existing volumetric datasets make it difficult to conduct similar evaluations. As a result, the most impactful contributions to the field tend to focus on adapting State-of-the-Art (SotA) 2D architectures to solve specific problems defined by a single dataset [6, 24, 69, 61, 66]. While the assumption that 2D models can be effectively adapted to volumetric data is supported by some high-level similarities, the properties of volumetric data make it likely, that models optimized specifically for this modality may outperform those that were simply adapted from 2D.
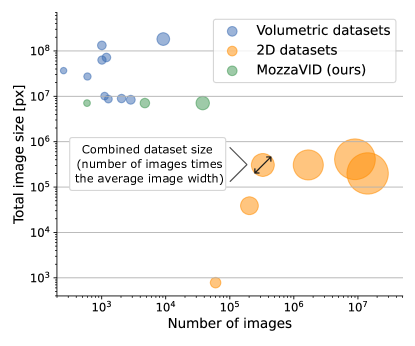
To facilitate the development and benchmarking of volumetric models, we introduce the mozzarella volumetric image dataset (MozzaVID). It consists of 591 raw synchrotron X-ray computed tomography (CT) scans of mozzarella cheese microstructure, enabling the classification of 25 cheese types and fine-grained classification of 149 samples. Mozzarella has an anisotropic microstructure that is highly disordered [4, 19], allowing for arbitrary splitting of the original scans with a low risk of introducing bias or losing crucial information. This property enables creating datasets with varying sample sizes and resolutions, which we demonstrate by proposing three main dataset splits: containing 591, 4728, and 37,824 samples. With its properties, MozzaVID can serve a similar role as large, method-oriented 2D datasets, while also remaining representative of typical volumetric datasets, forming a bridge between the two groups, as highlighted in Fig. 1.
Apart from providing a general benchmark, the dataset is specifically targeted towards developing and evaluating methods for deep learning-based structural analysis. The structure of materials directly affects their functional properties, and structural analysis is an important use case for volumetric images [57, 20, 30]. Structural properties are also an essential part of certain food products such as meat, bread, pastries, and cheese (e.g. mozzarella). With 34% of greenhouse gas emissions linked to food [7], understanding structural properties is crucial for developing environmentally-friendly alternatives of known structured foods that are also pleasant to eat [5, 21, 13].
The variability in the microstructure of samples imaged in the MozzaVID dataset is induced by both the chemical composition of their ingredients and the processing parameters of the raw cheese curd. These parameters, together with rheological and functional measurements, form metadata, which will be published in a simplified form together with the dataset.
The separation into cheese types and samples forms a hierarchy, where each cheese comprises 6 samples, with 4 scans performed within each sample, where the only difference between those is their spatial distance. With this separation we expect the samples to exhibit three levels of similarity: superficial similarity between samples produced with comparable recipes, moderate similarity between samples from the same cheese, and strong similarity between scans of the same sample.
Our experiments confirm the outlined relationships – with the biggest dataset instance we can obtain close to perfect classification of the 25 cheeses, as well as high accuracy on the 149 samples. By investigating the embeddings of the classifiers we further show that they learn to arrange the classes into groups of cheese types with similar parameters and create a latent space that accurately covers the extent of the samples’ structural variation. This shows that through classification alone we are capable of investigating and quantifying the variability and relationships of the analyzed structures.
2 Related work
Volumetric datasets exhibit a wide variation in imaging methods, sample sizes, and application domains. By far, the biggest and most diverse group consists of instances with no, or limited annotation available. In this group, the datasets typically consist of only a few volumes, acquired with a general goal of analyzing the imaged object – either for domain-specific research or for advancing imaging technology. The two most notable mentions in this category are TomoBank [9] – a large repository of lab-scale and synchrotron CT datasets, and The Human Atlas project [12] – a repository of hierarchical phase-contrast CT of human anatomy.
Annotated volumetric datasets, particularly those targeted for deep learning applications, are predominantly found in the medical field. In this field, bigger datasets are available for research in specific diagnostic areas, typically consisting of 100–1,500 volumes. Frequently, these datasets are linked to a public challenge, demonstrated by well-recognized instances such as BraTS [2, 47, 3], KiTS [27], or LIDC-IDRI/Luna16 [1, 55]. Although these datasets are large for volumetric imaging standards, they are still relatively small for deep learning purposes. Notably, the PN9 dataset [46] provides a larger sample of 8,798 lung CT scans. Outside the medical domain, the dataset representation is very limited. The BugNIST dataset [28] is a recent exception, containing 9,544 scans of common bugs. A full overview of the biggest and most recognized volumetric datasets can be found in Tab. 1.
| Dataset | # of volumes | Volume size | Primary application | Directly accessible | Task |
|---|---|---|---|---|---|
| ADAM | 254 | 512512140 (max) | Medical — brain MRI | No | Detection, segmentation |
| BraTS | 50–2,040 | 240240155 | Medical — brain MRI | No | Segmentation |
| KiTS | 599 | 512512104 | Medical — kidney CT | Yes | Segmentation, classification |
| LIDC-IDRI | 1,010 | 512512(65–764) | Medical — thoracic CT | Yes | Detection |
| MosMedData | 1,110 | 512512(36–41) | Medical — chest CT | Yes | Segmentation, classification |
| CTSpine1k | 1,005 | 512512(349–659) | Medical — spine CT | No | Segmentation |
| CTPelvic1k [36] | 1,184 | 512512273 (mean) | Medical — pelvic CT | Yes | Segmentation |
| OASIS | 2,842 | 256256128 | Medical — brain MRI | No | Segmentation, classification |
| PN9 | 8,798 | Not reported | Medical — thoracic CT | No | Detection |
| ATLAS v2.0 [33] | 1,271 | 233197189 | Medical — brain MRI | Yes | Segmentation |
| BugNIST | 9,154 + 388 | 900450/650450/650 | Method development | Yes | Detection under domain shift, classification |
| MozzaVID (ours) | 591–37,824 | 190190190 | Food science | Yes | Classification |
| Dataset | # of images | Image size | Primary application | Task |
|---|---|---|---|---|
| MNIST, Fashion-MNIST | (each) | 2828 | Method testing | Classification |
| CelebA | 178218 | Method development | Face attribute recognition, face recognition, face detection | |
| COCO | 640480 | Method development | Object detection, keypoint detection, panoptic segmentation | |
| ImageNet [10] (2014) | 482415 | Computer vision | Object detection, image classification | |
| Open Images [31] | Unspecified | Computer vision | Object and visual relationship detection, instance segmentation | |
| MSLS [65] | 480640 | Computer vision | Visual place recognition |
A majority of the existing datasets (especially those within the medical field) focus on segmentation or detection as the primary task. A smaller subset also offers classification targets (KiTS, MosMedData [48], OASIS [44]), often as an extension to the main target. BugNIST is a single example of a big classification-oriented dataset, but it is only a first step before the main, domain shift task. Containing only 12 classes, trained baseline classification models easily reach high accuracy.
A significant limitation of many of the medical datasets is their accessibility. Typically, medical data is rarely published due to confidentiality constraints. Although this is not the case for the presented examples, many of them still cannot be directly downloaded online. Some require registering an account and/or agreeing to terms and conditions (BraTS, ADAM [62], OASIS) while others are only fully accessible after personally contacting the publisher (CTSpine1k [12], PN9).
From the methodological perspective, existing datasets pose further challenges. Many suffer from class imbalance, various sources of annotation and representation bias, as well as high specificity of the investigated problem, making them too specialized to serve as a generic baseline. Consequently, most volumetric deep learning research relies on unique, often case-specific datasets, limiting model generalizability and comparability across studies.
Serving as a context to presented characteristics, Tab. 2 lists a subset of the most recognized 2D datasets. In this summary, even the smallest of the datasets (MNIST [11], Fashion MNIST [67]) contain many more data instances than any of the existing volumetric counterparts. It is also worth noting that many of these 2D datasets were made primarily for testing or development of new methods (MNIST, Fashion MNIST, CelebA [37], COCO [34]). This approach is further reflected in the design of these datasets, through their simplicity, image size, clear task definition, and cleanliness.
3 Data
The MozzaVID dataset consists of high-resolution CT images of 25 types of mozzarella cheese with diverse functional properties. This dataset is the first published instance of synchrotron-based CT imaging of mozzarella, enabling a detailed and nearly noise-free look into its 3D microstructure.
3.1 Acquisition and preprocessing
A defining part of mozzarella production is the cooking-stretching step, where the cheese curd is heated and simultaneously kneaded with a rotating screw [18]. Investigated mozzarella types are made with varying cooking temperatures, speeds of the screw as well as optional additives. This experimental design is made to represent a set of realistic recipes and capture the range of potential structural variability of mozzarella. An important exception is the Cagliata cheese (class 25) which was produced without stretching the curd. Each cheese type was characterized with rheological and chemical measurements, enabling future structural analysis with detailed metadata (used in simplified form due to confidentiality). Within the dataset, three pairs of samples were prepared with the same recipe, and one was produced without the cooking-stretching step, making it fully isotropic. The samples were stored frozen and thawed directly before imaging.
Mozzarella cheese is a challenging target for CT imaging because its two primary components – proteins and fats have a similar, low X-ray attenuation coefficient. In the case of lab-scale X-ray sources, that property results in prolonged scan times which are problematic due to the thermal instability of the cheese. Even if these issues are mitigated, lab-scale results of mozzarella CT scans are typically limited in number and very noisy [19]. A potential solution for collecting high-quality CT scans of mozzarella is to use synchrotron light sources. Although it cannot be used for routine data collection, it provides X-ray radiation of high flux and coherence, enabling fast scans at high resolution and low noise levels.
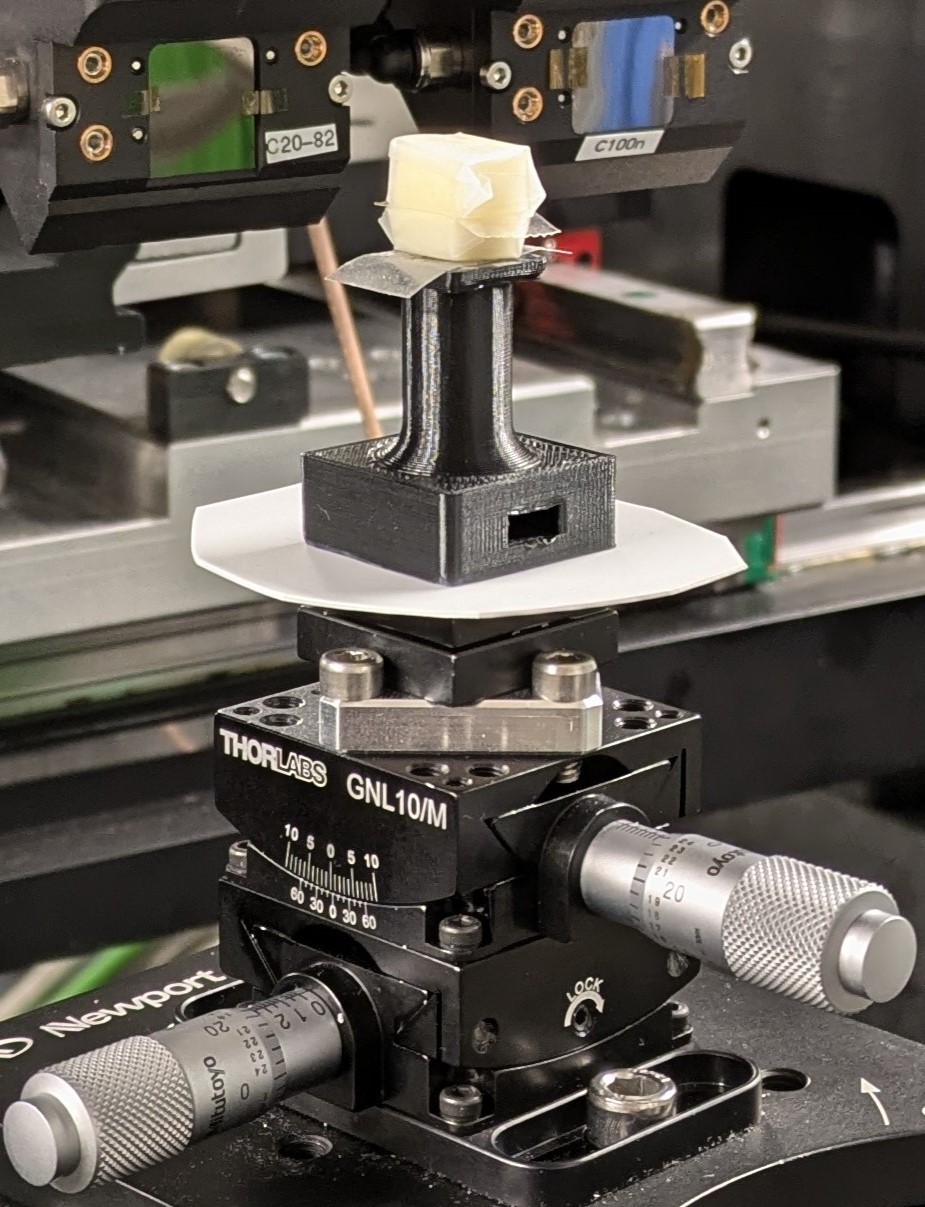
The measurements were conducted at the DanMAX beamline of the MAX IV synchrotron. Six samples were prepared from each cheese class by cutting out cubes and wrapping them in parafilm, summing up to a total of 150 samples. Within each sample, four local tomography scans were taken, resulting in a total of 600 individual scans. All the scans were performed using the energy of and exposure time of . 2601 unique projections were taken at pixel size and 23562688 px resolution. The final scan width was approximately . The scanning setup is introduced in Fig. 2.
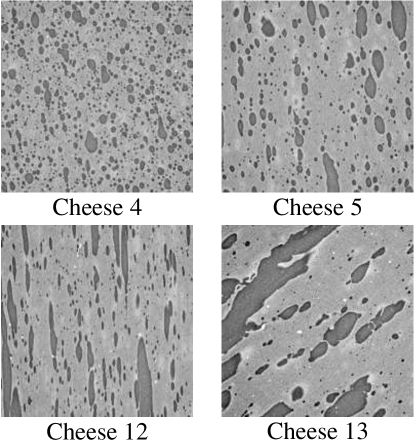
Of the original reconstructed scans, 9 were discarded due to artefacts that heavily compromised image quality. In particular, one whole sample from cheese 4 was discarded, lowering the total number of samples to 149. The final set of 591 scans was cropped to the shape of 160116012156 (XYZ), and their histograms aligned by segmenting out the fat and protein and standardizing their intensities. This processed data was then treated as a raw input for dataset preparation.
3.2 Dataset preparation
The extracted raw scans (Fig. 2) present a detailed and clear description of the mozzarella structure, but their resolution is too high for most deep-learning algorithms. To address this issue, we propose a pipeline that downsamples the volumes and splits them to create more data instances. The internal structure of mozzarella does not contain specific macroscopic shapes or boundaries, allowing the samples to be split into smaller volumes without introducing bias. Additionally, the lack of repeating patterns or monotonous structures further minimizes the risk of ineffective splits. The practical limiting factors are the minimum split and maximum effective pixel size – they need to be conservative enough to retain a meaningful representation of the structure. For example, one could omit the downsampling and instead increase the number of splits to retain the same number of voxels per volume; however, these volumes would not be representative of the structure as the area they cover would be too small. In essence, this splitting process is an artificial equivalent of varying the imaging settings.
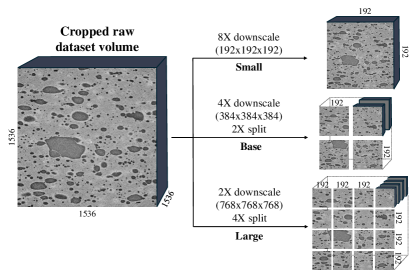
Three main configurations of the dataset were prepared. Starting by limiting the volume size to a central cube of 1536 pixel width, the instances are then defined as:
-
1.
8X-1X (Small) – each volume downscaled 8-fold, preserving the original count of 591 volumes,
-
2.
4X-2X (Base) – each volume downscaled 4-fold and split into equal 8 sub-volumes (2 in each dimension), resulting in 4,728 volumes,
-
3.
2X-4X (Large) – each volume downscaled 2-fold and split into 64 sub-volumes (4 in each dimension), resulting in 37,824 volumes.
The output resolution of all the configurations is standardized at voxels. Fig. 3 illustrates the dataset preparation process.
We settle on the outlined approach as it is simple, creates volumes of manageable size, and aligns well with the goals of the dataset. The number of volumes in the Base and Large instances is well suited for the targets of 25 and 149 classes respectively, while also enabling the exploration of the influence of scale on the accuracy. The Small instance is very limited for deep learning purposes but is representative of typical volumetric datasets, which rarely exceed this number, and potential volumetric methods have to be ready to address such a limitation.
4 Experiments
Within the proposed dataset, there is a hierarchy of targets and approaches that can be explored, such as classification granularity, dataset configuration, and dimensionality. These factors combine to form ten experimental setups that we evaluate on a set of benchmark architectures.
To assess the potential of classification in learning the space of possible mozzarella structures, we also investigate the features of trained models and compare their distribution to the properties known from the experimental design of available cheese types.
4.1 Granularity and dataset configuration
We evaluate two classification targets within the dataset: coarse-grain, corresponding to the 25 cheese types, and fine-grain, corresponding to the 149 individual cheese samples. For coarse-grain classification, we use all three dataset configurations: Small, Base, and Large. For fine-grain classification, only the Base and Large configurations are used. In the Small instance, the ratio of sample size to class number is too small.
4.2 Dimensionality
To effectively investigate the influence of the volumetric representation, we compare models trained on full 3D volumes with those trained on 2D slices, simulating simpler imaging techniques, such as microscopy. In mozzarella, a general direction of the fiber structure can be inferred with the naked eye, so in 2D imaging, it is typical to take a set of measurements with an imaging plane parallel to the fiber direction. In our dataset, due to the sample preparation, the fiber direction is always roughly perpendicular to the Z-axis. This means, that Z-axis slices are an approximate representation of a 2D imaging approach. To provide a better overview of the structure in each volume, and fit to typical 3-channel 2D architectures, we choose three such slices from each volume: at 25%, 50%, and 75% of the height. For a fair comparison, no pre-trained weights are used on either 2D or 3D models.
4.3 Model selection and training setup
We selected five widely recognized architectures within convolutional neural networks and transformers, to evaluate performance across the dataset variations. Due to the volume instance size (which roughly corresponds to a 4K 2D image), and subsequent memory limitations, most models are in their medium/small size version:
-
•
Convolutional Neural Networks (CNNs):
- –
- –
-
–
ConvNext-S [39] – a recent CNN architecture inspired by transformers. Sourced from the official repository and adapted to 3D by us.
-
•
Transformers:
- –
- –
All models were trained using the AdamW optimizer [40] with a learning rate of and an effective batch size of 32. Data augmentation was limited to random flipping along the X and Y axes to preserve the spatial structure. All images are normalized using mean and standard deviation extracted from the raw data. The data is split into train, validation, and test sets with a fraction of 70%, 20%, and 10% respectively. We use cross-entropy loss for training and test set accuracy as the final performance evaluation metric. For each experimental setup, models were trained with an early stopping criterion based on validation loss. The CNNs were trained with a 30-epoch patience, while the transformer-based models, which generally converge more slowly, used a 50-epoch patience. If a model did not converge within a week, its training was stopped at the currently best result.
| Granularity | Coarse | Fine | ||||||||
|---|---|---|---|---|---|---|---|---|---|---|
| Split | Small | Base | Large | Base | Large | |||||
| Dimensionality | 2D | 3D | 2D | 3D | 2D | 3D | 2D | 3D | 2D | 3D |
| ResNet50 | 0.360 | 0.820 | 0.661 | 0.973 | 0.877 | 0.993 | 0.403 | 0.690 | 0.678 | 0.935 |
| MobileNetV2 | 0.160 | 0.460 | 0.525 | 0.964 | 0.855 | 0.909 | 0.369 | 0.733 | 0.717 | 0.805 |
| ConvNeXt-S | 0.100 | 0.200 | 0.394 | 0.805 | 0.713 | 0.936* | 0.102 | 0.733 | 0.488 | 0.877* |
| ViT-B/16 | 0.220 | 0.240 | 0.428 | 0.819 | 0.597 | 0.927 | 0.181 | 0.541 | 0.437 | 0.855 |
| Swin-S | 0.380 | 0.660 | 0.663 | 0.941 | 0.894 | 0.976* | 0.376 | 0.708 | 0.704 | 0.922* |
| Average | 0.244 | 0.476 | 0.534 | 0.900 | 0.787 | 0.948 | 0.286 | 0.681 | 0.605 | 0.885 |
4.4 Analysis of the learned representation
After training, we choose the best-performing model from the coarse-grained target and extract feature representations from its second-to-last layers. We then apply the UMAP [45] dimensionality reduction technique to investigate relationships between the clusters formed in this embedding space with the primary assumption being that the clusters will follow the class-based separation of the data.
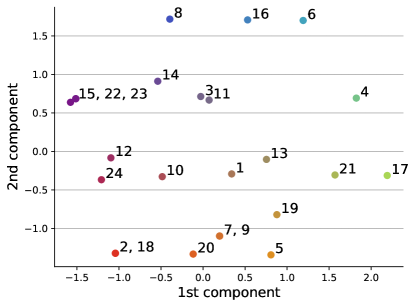
This compressed representation is further compared to the available metadata, specifically to the experimental design of investigated cheese types. This parameter space is first normalized and expressed with 2-component PCA (Fig. 4), resulting in a spatial relationship between classes that can be compared to the UMAP of the clusters. If the models have learned a meaningful representation of the structure, embedding clusters representing similar cheese types should be located close to each other. To enable the visual comparison of UMAP clusters we assign a color representation to the points in the PCA space.
5 Results
5.1 Training
The majority of the trained models converged and reached the early stopping criterion, except for 3D Large instances of the ConvNeXt and Swin models, which continued improving in small increments until the predefined time limit. Most of the models trained on the Small dataset exhibited strong overfitting to the training data, as expected given the dataset size, though this could potentially be mitigated with regularization techniques. Exceptions to this trend were the 3D Swin and ResNet models, where the overfitting was much less severe. This result is especially surprising for the Swin model, given the sensitivity of transformer architectures to dataset size [15, 32].
Tab. 3 shows the complete classification results. Both the average and the per-model metrics demonstrate a significant improvement in accuracy with the 3D data. Interestingly, 3D models trained on the Base dataset consistently outperformed their counterparts trained on the 2D Large dataset. This suggests that even a smaller 3D dataset is more advantageous than a big 2D dataset for this problem. If overfitting was less prevalent in the Base models, a similar pattern would likely hold for the Small 3D vs Base 2D models, as suggested by ResNet’s performance.
Across models, ResNet performed the most consistently in all the tasks and achieved the highest accuracy scores for nearly all 3D configurations. MobileNetV2 also demonstrated stable performance, though slightly lower than ResNet. Swin performed very well with 2D data but struggled with 3D, while ConvNeXt and ViT were the least stable models, showing significant performance variability.
At a high level, top scores for both granularities (coarse-grained: , fine-grained: ) confirm the validity and feasibility of the classification task. Both scores were only achieved on the Large dataset instance, fine-grained classification was much more challenging in the Base dataset (), and coarse-grained was especially problematic in the Small dataset ().
From the structural analysis perspective, the high accuracy achieved in the Large dataset suggests that even small volumes, approximately in size, contain features sufficient for accurate classification of cheese types based on their structural properties. At the same time, these volumes exhibit enough unique characteristics to identify them as part of a specific sample, and its subtle, localized structural variations.
5.2 Learned representation
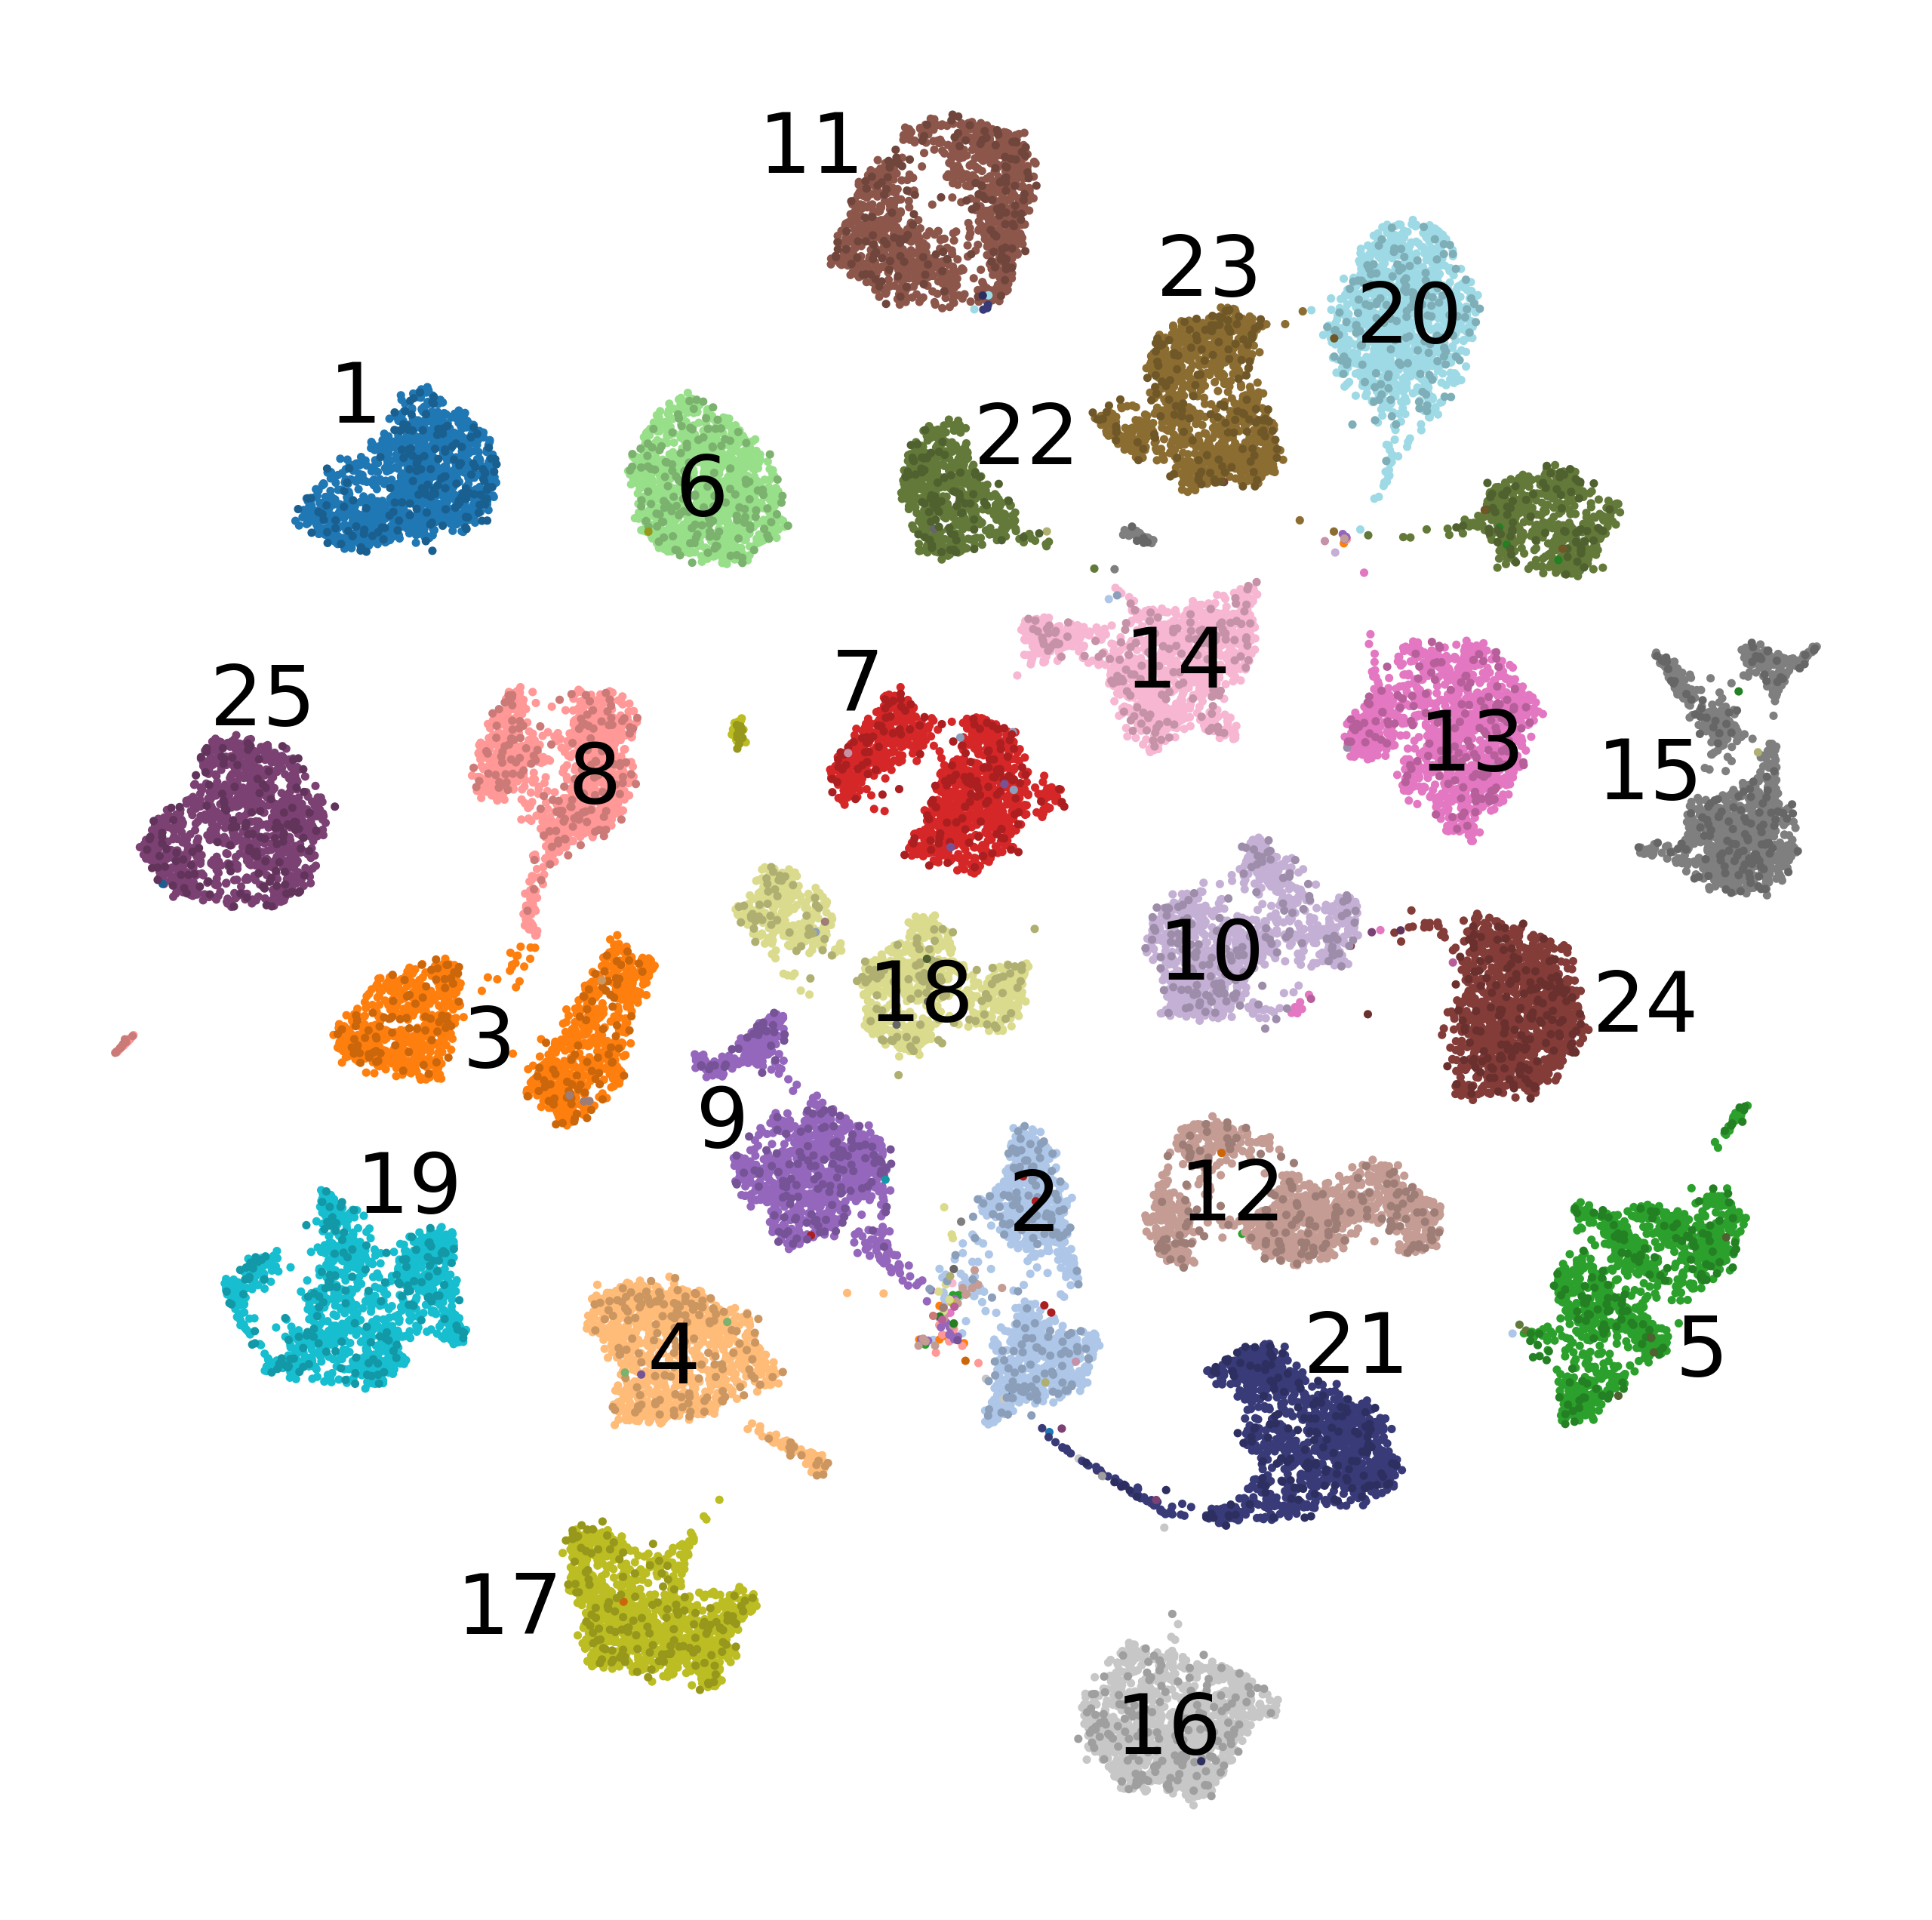
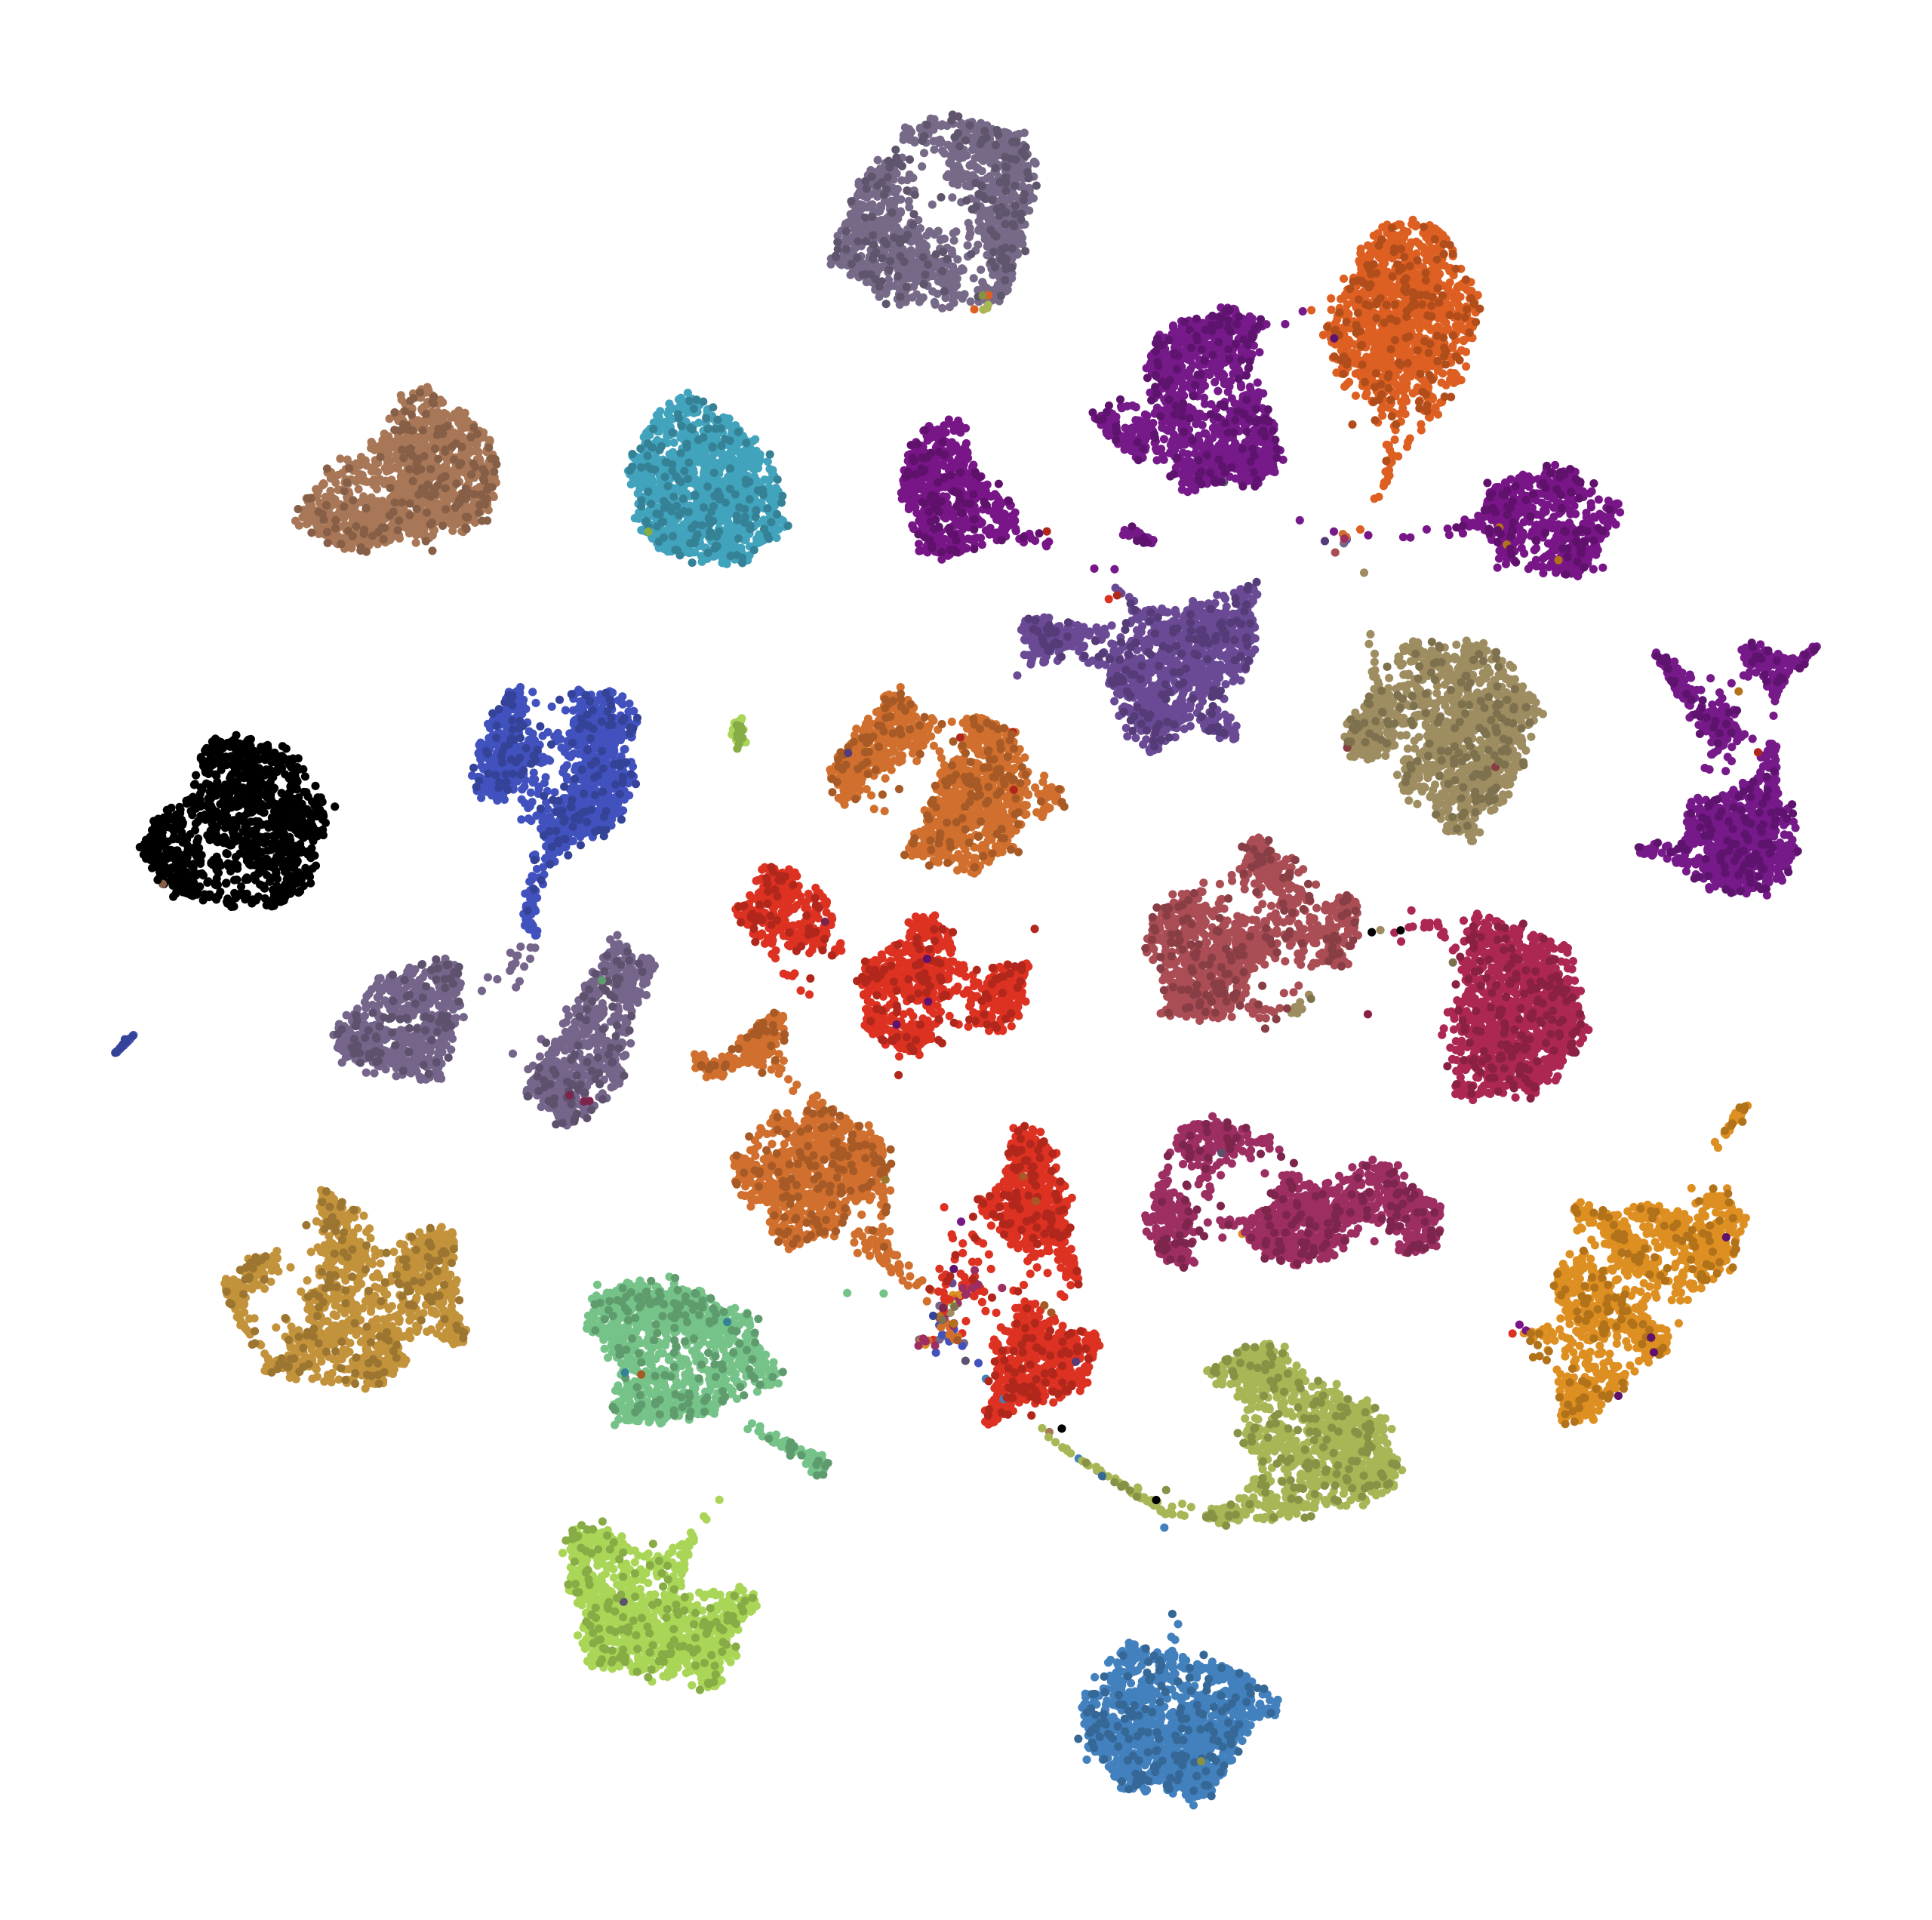
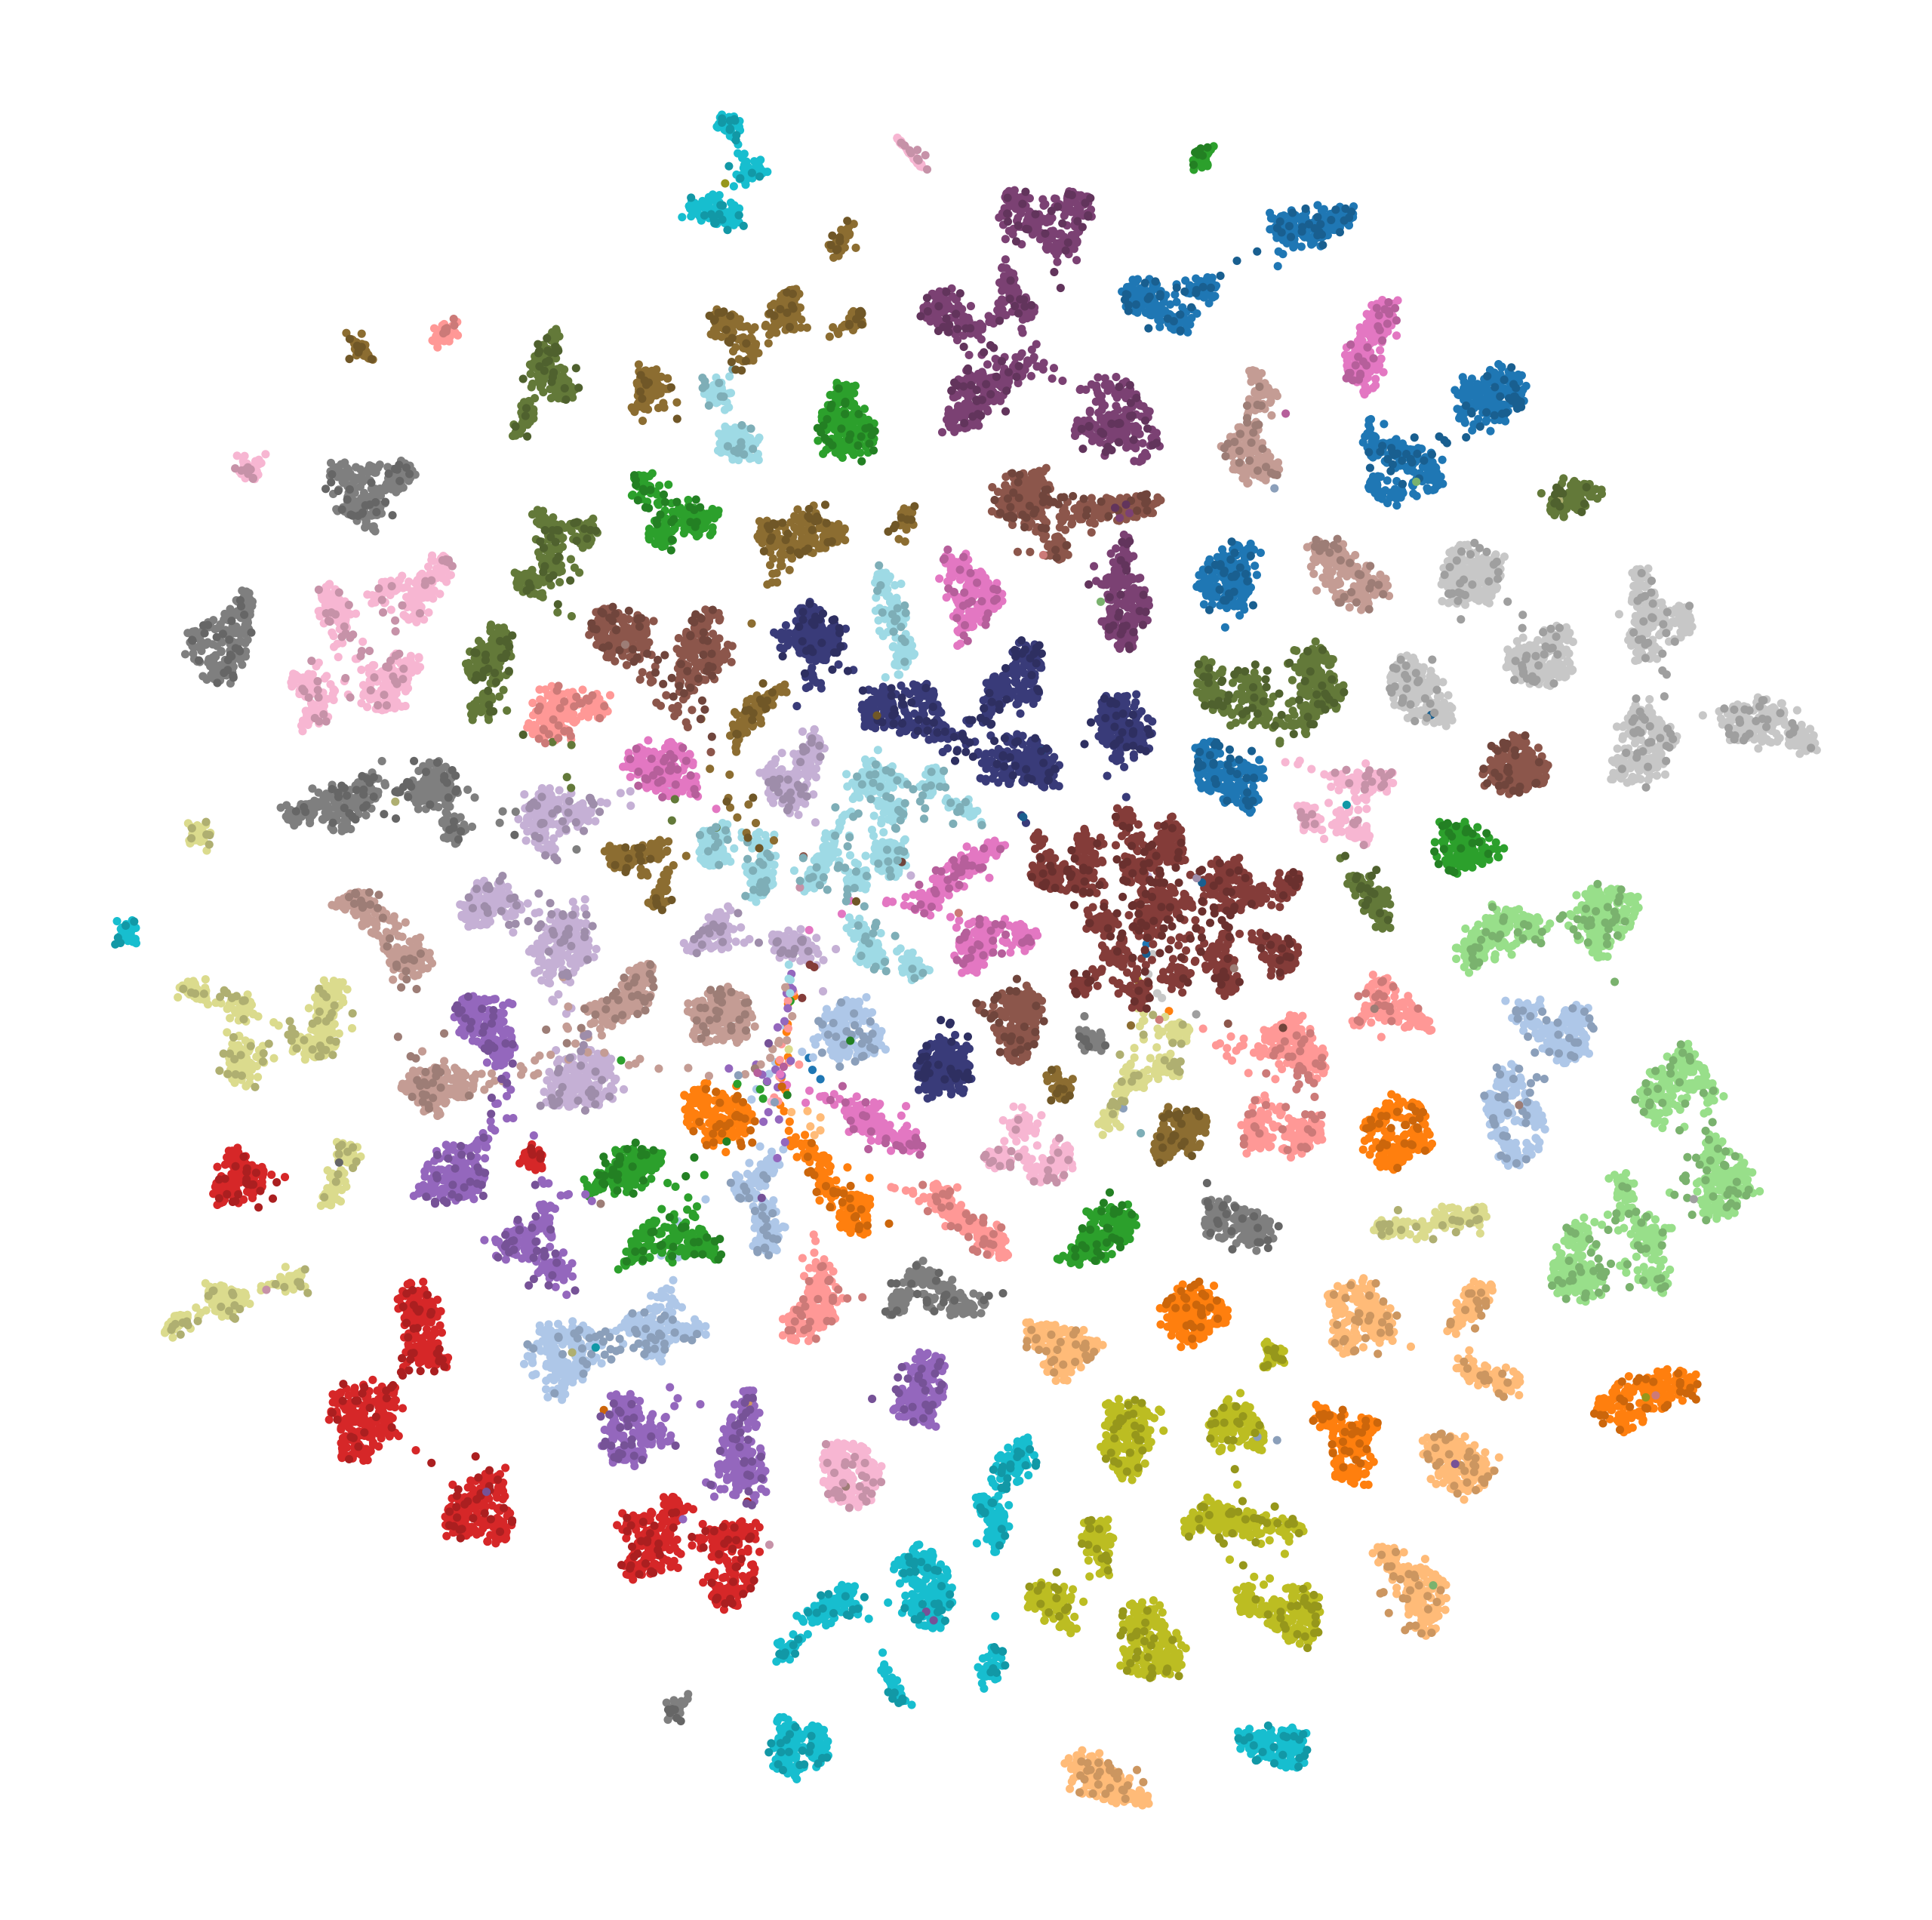
UMAP representation of the best-performing coarse-grained model shows distinct clustering of volumes corresponding to each class, with most classes forming tight, well-defined clusters (Fig. 5(a)). This clustering supports the high accuracy of the model, validating its ability to capture and distinguish between structural variations across classes.
Applying the PCA-based colormap (Fig. 4) provides additional insights into the UMAP representation (Fig. 5(b)). Classes 2, 7, 9, 10, 12, 18, and 24 form a large, central group of clusters with similar colors, suggesting the model has correctly identified their similarity. This group transitions to two additional groups: purple clusters on the top-right (classes 15, 22, 23) and green clusters on the bottom (classes 4, 17, 21). The color transition from red to green and red to purple aligns well with the spatial relationships present in the PCA space.
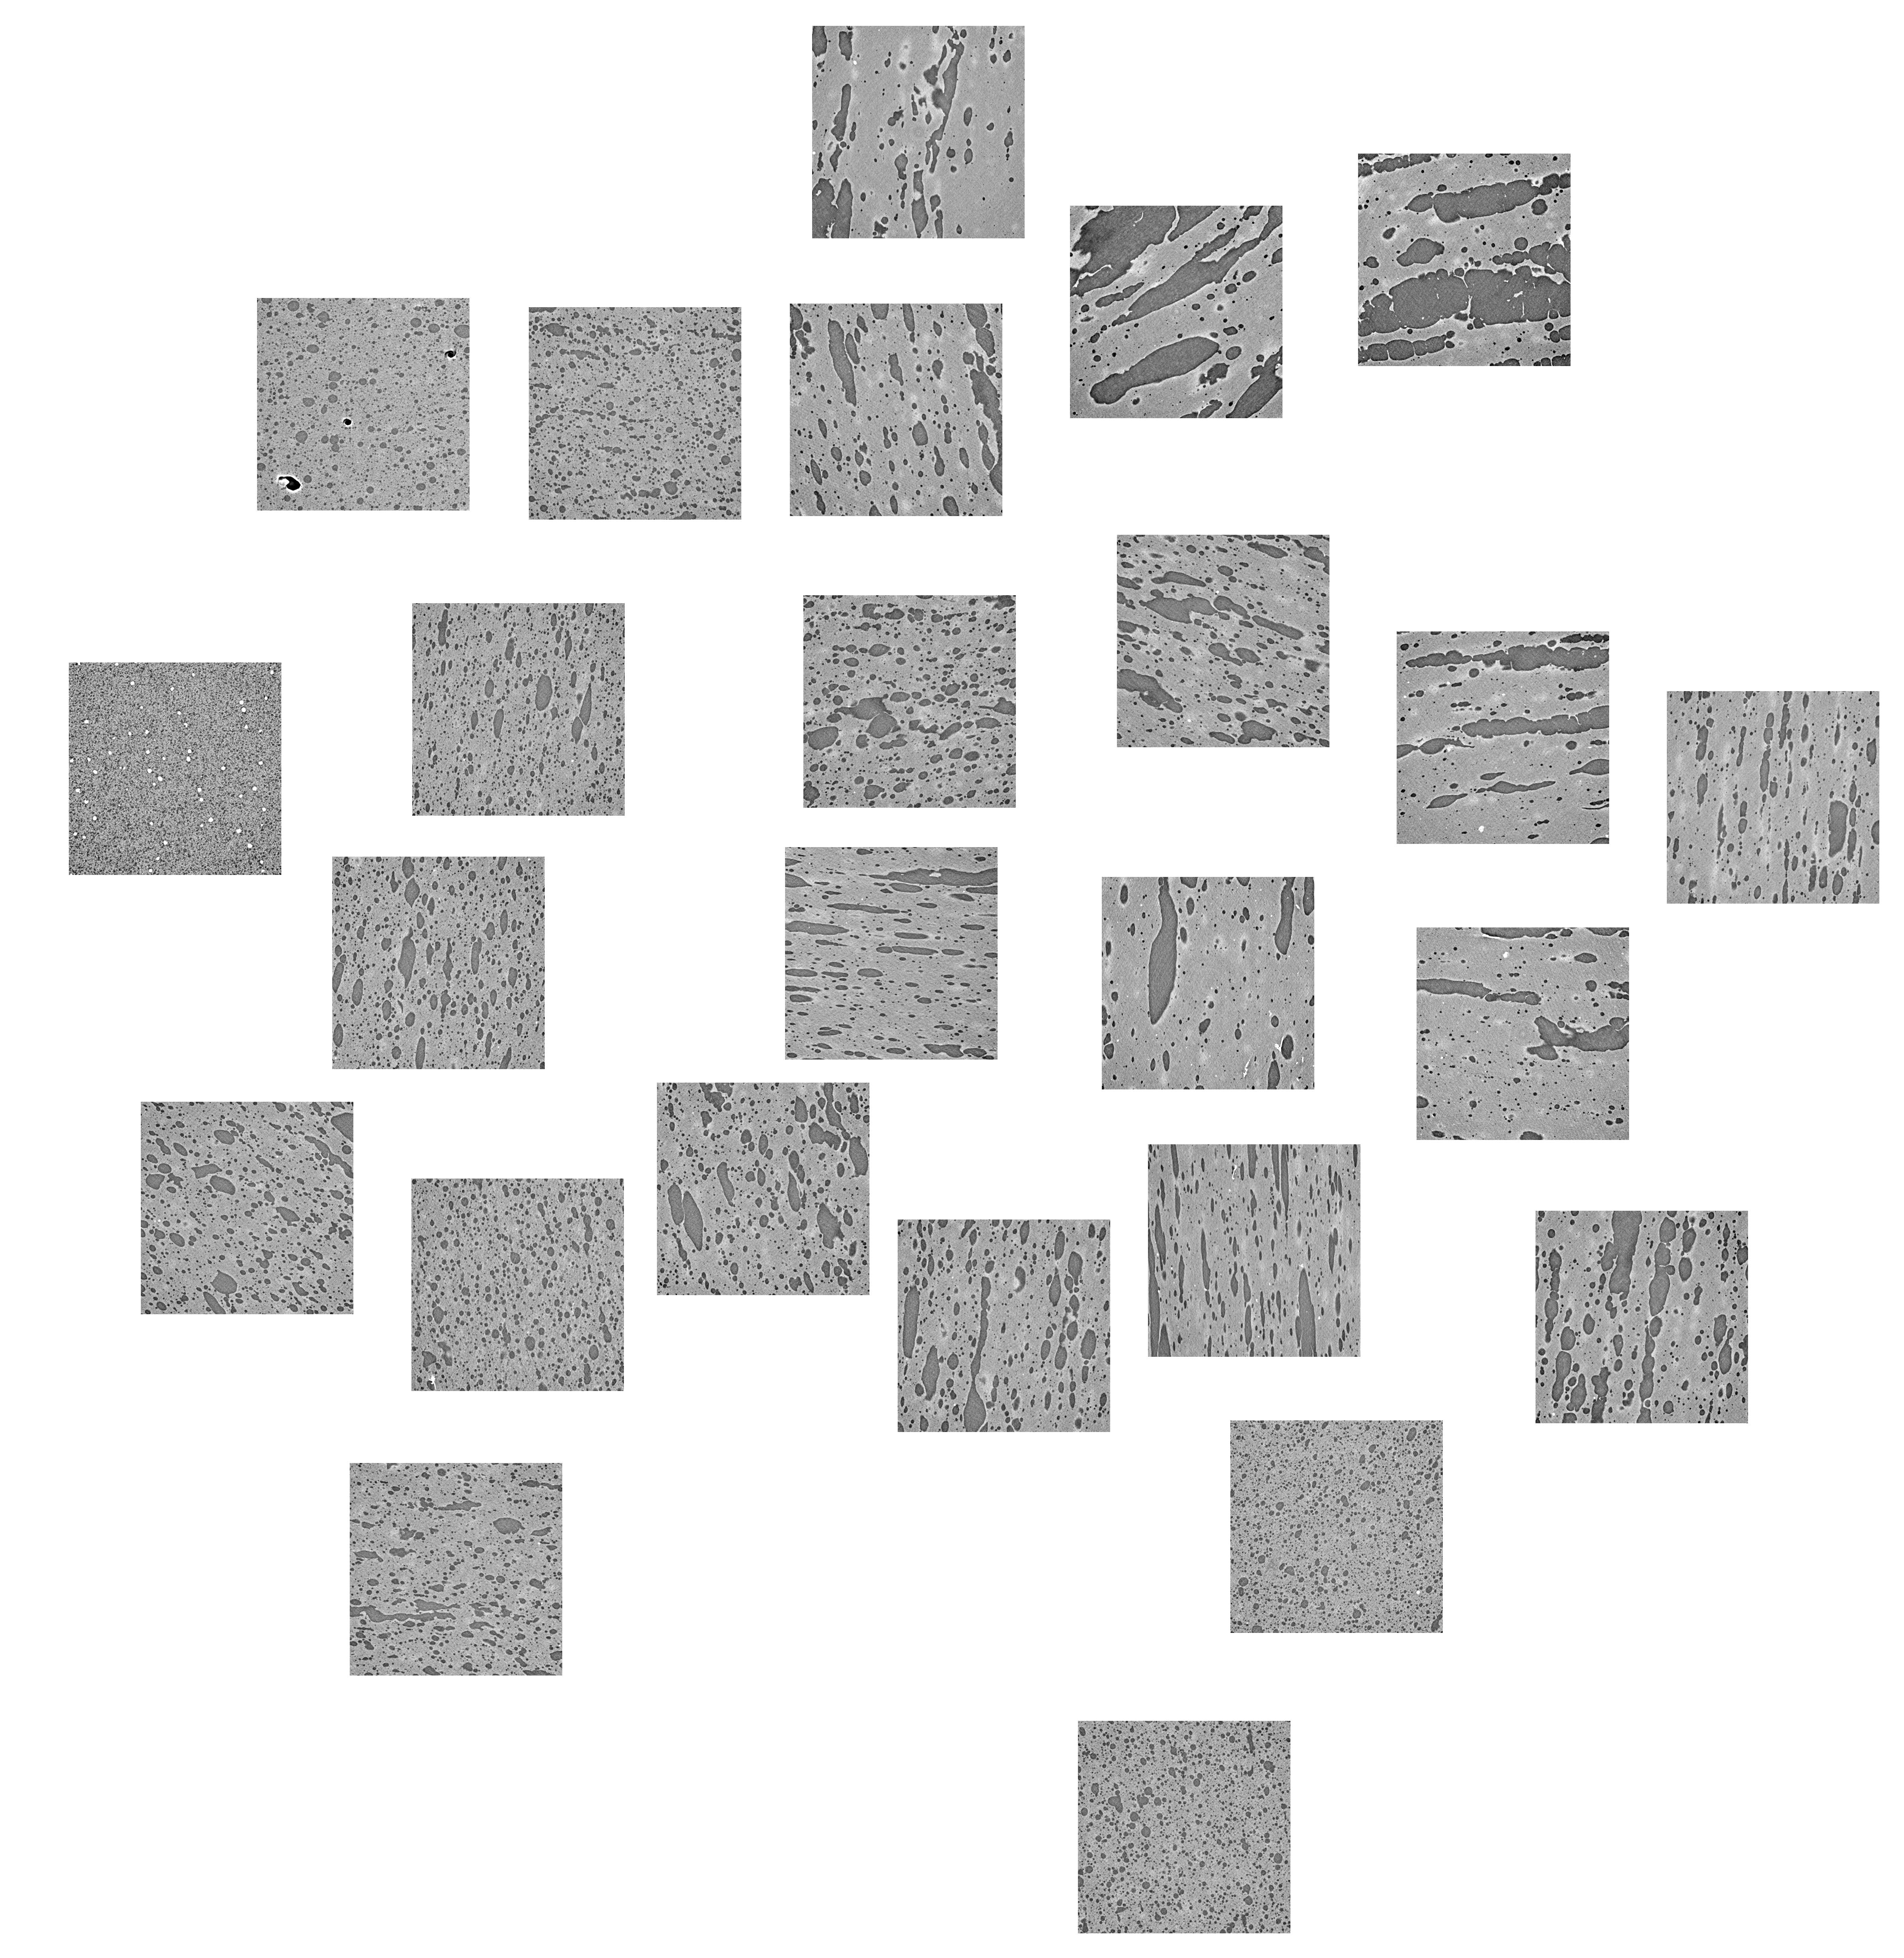
The positioning of some classes (13, 16, 19, and 20) deviates from the alignment with the PCA space, suggesting that the model’s representation may be coincidental or at least not very accurate. To further evaluate this deviation, we use a visualization from Fig. 5(c), where the class clusters are substituted with example 2D slices of the volumetric data. This additional visualization highlights a strong similarity of cheese types located close to each other. Volumes on the right side of the map generally display anisotropic structures with large fat domains that grow even further toward the top. Conversely, the left and bottom areas contain volumes with smaller fat domains and potentially more isotropic structures. With this view, it is clear that the classes deemed problematic in the context of the cheese experimental design are positioned correctly in terms of their actual structural features.
6 Discussion
6.1 Data
A dataset’s reliability depends critically on the quality of its data sources, and potential errors and noise may arise at all stages of data generation. In the context of this study, these sources can be summarized into three groups: mozzarella cheese preparation, imaging, and post-processing.
The mozzarella cheese used in this study was prepared in a manufacturing environment, ensuring control over its composition and production parameters. However, food and specifically mozzarella production often cannot be fully controlled, resulting in local variations e.g. in cooking temperature or protein structure development. These differences were highlighted in Sec. 5.2, where cheese types similar in terms of the experimental design had vastly different structures. While this discrepancy is important for further food science applications of the dataset, it has a negligible effect on its use in deep learning research.
The cheese types were produced within a similar time frame, and their deterioration was mitigated through vacuum sealing and freezing for storage. An exception is the Cagliata cheese, prepared approximately a year earlier. Despite having the same storage conditions, a lot of salt crystals developed within its matrix, which then created very bright spots on the scans. This effect likely makes it easier to classify this cheese type but does not compromise the overall dataset’s utility.
Synchrotron imaging significantly increased the quality and consistency of generated volumes compared to conventional CT. The power and coherence of synchrotron radiation allowed for generating low-noise and high-contrast scans, and the fast scanning time eliminated the risk of sample movement/deterioration during imaging.
Post-processing steps were designed to limit the potential sources of bias and error, including discarding problematic scans, cropping volumes to avoid artifacts and inconsistencies near the scan edges, and normalizing voxel intensities across samples.
The orientation of the structure in the samples is potentially a source of bias. If two similar anisotropic structures are imaged with a consistent, different orientation, a model may learn to classify them based on this orientation alone. To mitigate this, sample preparation involved purposefully varying cutting directions, and random flipping was applied during training. Despite these precautions, the problem is not completely, systematically addressed. The most robust solution would require repeating the scan reconstructions with varying rotation offsets, but practical limitations make such modification problematic and highly time-consuming. Future dataset users can mitigate this potential issue further by randomly rotating the volumes during training.
6.2 Experiments
The high accuracy scores achieved for both classification targets validate the problem’s feasibility but may also limit the potential for future improvement. However, the high scores apply only to the largest dataset instance, which is not representative of typical volumetric datasets. Reaching volume counts of over 10,000 will continue to be problematic for most volumetric imaging tasks, and the size of this dataset instance (37,760) is highly uncommon.
The accuracy drops significantly in the Base and Small instances that reflect more realistic conditions of volumetric datasets. This performance gap is the most prevalent trend in the training result, caused either by the general lack of data, or consequent strong overfitting to training data. We propose that future research could use the biggest instance to establish a base performance of a model, followed by a shift to the smaller data instances that are more challenging and representative of the typical volumetric task. For example, researchers could use the Small dataset with coarse-grained classes or the Base dataset with fine-grained classes.
The difference in performance between 2D and 3D models underscores the importance and impact of volumetric representation for this problem. Furthermore, the Swin model’s strong 2D performance but relative underperformance in 3D suggests that the properties of most advanced SotA models may make them too optimized for 2D images to perform similarly well with volumetric data. This highlights a corresponding opportunity to develop models specifically optimized for volumetric tasks.
6.3 Classification as a method of structural analysis
While classification is a useful tool for high-level data analysis, it may not be the most direct approach for studying fine-grained structures. At the same time, many traditional image analysis methods are targeted specifically for texture and structure. However, some of these methods are very basic [23, 22] while others require careful parameter tuning and intensive computation [29, 51].
Through this classification task, we aim to explore the broad relationships and tendencies in mozzarella microstructure with implications for the analysis of structured foods. The disordered nature of food structures introduces significant uncertainty in any local measurements. However, our results demonstrate that these local, irregular structures still retain enough distinctiveness to identify their properties both on the coarse and fine-grained levels. Future work will build on these findings by exploring alternative architectures, training setups, and representations that may further enhance the ability to capture and analyze these structural characteristics.
7 Conclusion
A primary limitation in volumetric deep learning is the small size of most available datasets, which restricts the ability to achieve robust, high-quality results. Additionally, many 3D architectures are based on state-of-the-art 2D architectures which are not fully compatible with volumetric data requirements. They are optimized for large quantities of relatively small images, while volumetric datasets typically offer fewer, high-resolution volumes. The development of models specifically tailored to this modality has a strong potential to advance the field of volumetric deep learning. However, to reliably evaluate and benchmark these new approaches, there is a pressing need for large, high-quality volumetric datasets.
The MozzaVID dataset is a strong candidate as a benchmark dataset for this purpose. With its substantial size, well-curated samples, and two classification targets, MozzaVID offers a flexible framework for volumetric model evaluation. Its largest instance provides a feasible base for model benchmarking, while the Small and Base instances represent realistic, more challenging settings that align with typical limitations in volumetric data availability.
Beyond benchmarking, MozzaVID also offers a unique opportunity for analyzing mozzarella microstructure. Preliminary results indicate that classification models trained on MozzaVID can capture meaningful patterns in structural variability, setting the stage for more advanced structural analysis. Such analysis could yield valuable insights with potential applications for other structured foods, advancing the intersection of deep learning and food science.
The dataset can be explored through: https://papieta.github.io/MozzaVID. Initially, only the train and test splits are published. The full dataset, including the raw scans will be released after the end of a planned Kaggle classification challenge.
References
- Armato et al. [2015] Samuel G. Armato, III, Geoffrey McLennan, Luc Bidaut, Michael F. McNitt-Gray, Charles R. Meyer, Anthony P. Reeves, Binsheng Zhao, Denise R. Aberle, Claudia I. Henschke, Eric A. Hoffman, Ella A. Kazerooni, Heber MacMahon, Edwin J. R. Van Beek, David Yankelevitz, Alberto M. Biancardi, Peyton H. Bland, Matthew S. Brown, Roger M Engelmann, Gary E. Laderach, Daniel Max, Richard C. Pais, David P. Y. Qing, Rachael Y. Roberts, Amanda R. Smith, Adam Starkey, Poonam Batra, Philip Caligiuri, Ali Farooqi, Gregory W. Gladish, C. Matilda Jude, Reginald F. Munden, Iva Petkovska, Leslie E. Quint, Lawrence H. Schwartz, Baskaran Sundaram, Lori E. Dodd, Charles Fenimore, David Gur, Nicholas Petrick, John Freymann, Justin Kirby, Brian Hughes, Alessi Vande Casteele, Sangeeta Gupte, Maha Sallam, Michael D. Heath, Michael H. Kuhn, Ekta Dharaiya, Richard Burns, David S. Fryd, Marcos Salganicoff, Vikram Anand, Uri Shreter, Stephen Vastagh, Barbara Y. Croft, and Laurence P. Clarke. Data from LIDC-IDRI. The Cancer Imaging Archive, 2015.
- Baid et al. [2021] Ujjwal Baid, Satyam Ghodasara, Suyash Mohan, Michel Bilello, Evan Calabrese, Errol Colak, Keyvan Farahani, Jayashree Kalpathy-Cramer, Felipe C. Kitamura, Sarthak Pati, Luciano M. Prevedello, Jeffrey D. Rudie, Chiharu Sako, Russell T. Shinohara, Timothy Bergquist, Rong Chai, James Eddy, Julia Elliott, Walter Reade, Thomas Schaffter, Thomas Yu, Jiaxin Zheng, Ahmed W. Moawad, Luiz Otavio Coelho, Olivia McDonnell, Elka Miller, Fanny E. Moron, Mark C. Oswood, Robert Y. Shih, Loizos Siakallis, Yulia Bronstein, James R. Mason, Anthony F. Miller, Gagandeep Choudhary, Aanchal Agarwal, Cristina H. Besada, Jamal J. Derakhshan, Mariana C. Diogo, Daniel D. Do-Dai, Luciano Farage, John L. Go, Mohiuddin Hadi, Virginia B. Hill, Michael Iv, David Joyner, Christie Lincoln, Eyal Lotan, Asako Miyakoshi, Mariana Sanchez-Montano, Jaya Nath, Xuan V. Nguyen, Manal Nicolas-Jilwan, Johanna Ortiz Jimenez, Kerem Ozturk, Bojan D. Petrovic, Chintan Shah, Lubdha M. Shah, Manas Sharma, Onur Simsek, Achint K. Singh, Salil Soman, Volodymyr Statsevych, Brent D. Weinberg, Robert J. Young, Ichiro Ikuta, Amit K. Agarwal, Sword C. Cambron, Richard Silbergleit, Alexandru Dusoi, Alida A. Postma, Laurent Letourneau-Guillon, Gloria J. Guzman Perez-Carrillo, Atin Saha, Neetu Soni, Greg Zaharchuk, Vahe M. Zohrabian, Yingming Chen, Milos M. Cekic, Akm Rahman, Juan E. Small, Varun Sethi, Christos Davatzikos, John Mongan, Christopher Hess, Soonmee Cha, Javier Villanueva-Meyer, John B. Freymann, Justin S. Kirby, Benedikt Wiestler, Priscila Crivellaro, Rivka R. Colen, Aikaterini Kotrotsou, Daniel Marcus, Mikhail Milchenko, Arash Nazeri, Hassan Fathallah-Shaykh, Roland Wiest, Andras Jakab, Marc-Andre Weber, Abhishek Mahajan, Bjoern Menze, Adam E. Flanders, and Spyridon Bakas. The RSNA-ASNR-MICCAI BraTS 2021 benchmark on brain tumor segmentation and radiogenomic classification. arXiv:2107.02314 [cs.CV], 2021.
- Bakas et al. [2017] Spyridon Bakas, Hamed Akbari, Aristeidis Sotiras, Michel Bilello, Martin Rozycki, Justin S. Kirby, John B. Freymann, Keyvan Farahani, and Christos Davatzikos. Advancing the cancer genome atlas glioma MRI collections with expert segmentation labels and radiomic features. Scientific Data, 4(1):170117, 2017.
- Bast et al. [2015] Ramona Bast, Prateek Sharma, Hannah K. B. Easton, Tzvetelin T. Dessev, Mita Lad, and Peter A. Munro. Tensile testing to quantitate the anisotropy and strain hardening of mozzarella cheese. International Dairy Journal, 44:6–14, 2015.
- Bhat and Fayaz [2011] Zuhaib Fayaz Bhat and Hina Fayaz. Prospectus of cultured meat - advancing meat alternatives. Journal of Food Science and Technology, 48(2):125–140, 2011.
- Çiçek et al. [2016] Özgün Çiçek, Ahmed Abdulkadir, Soeren S. Lienkamp, Thomas Brox, and Olaf Ronneberger. 3D U-Net: Learning dense volumetric segmentation from sparse annotation. In Medical Image Computing and Computer-Assisted Intervention (MICCAI 2016), pages 424–432. Lecture Notes in Computer Science, Vol. 9901. Springer, 2016.
- Crippa et al. [2021] M. Crippa, E. Solazzo, D. Guizzardi, F. Monforti-Ferrario, F. N. Tubiello, and A. Leip. Food systems are responsible for a third of global anthropogenic GHG emissions. Nature Food, 2(3):198–209, 2021.
- Cunningham et al. [2014] John A. Cunningham, Imran A. Rahman, Stephan Lautenschlager, Emily J. Rayfield, and Philip C. J. Donoghue. A virtual world of paleontology. Trends in Ecology and Evolution, 29(6):347–357, 2014.
- De Carlo et al. [2018] Francesco De Carlo, Doğa Gürsoy, Daniel J. Ching, K. Joost Batenburg, Wolfgang Ludwig, Lucia Mancini, Federica Marone, Rajmund Mokso, Daniël M. Pelt, Jan Sijbers, and Mark Rivers. TomoBank: A tomographic data repository for computational x-ray science. Measurement Science and Technology, 29(3):034004, 2018.
- Deng et al. [2009] Jia Deng, Wei Dong, Richard Socher, Li-Jia Li, Kai Li, and Li Fei-Fei. ImageNet: A large-scale hierarchical image database. In Proceedings of Computer Vision and Pattern Recognition (CVPR). IEEE, 2009.
- Deng [2012] Li Deng. The MNIST database of handwritten digit images for machine learning research [best of the web]. IEEE Signal Processing Magazine, 29(6):141–142, 2012.
- Deng et al. [2024] Yang Deng, Ce Wang, Yuan Hui, Qian Li, Jun Li, Shiwei Luo, Mengke Sun, Quan Quan, Shuxin Yang, You Hao, Pengbo Liu, Honghu Xiao, Chunpeng Zhao, Xinbao Wu, and S. Kevin Zhou. CTSpine1K: A large-scale dataset for spinal vertebrae segmentation in computed tomography. arXiv:2105.14711 [eess.IV], 2024.
- Dobson and Marangoni [2023] S. Dobson and A. G. Marangoni. Methodology and development of a high-protein plant-based cheese alternative. Current Research in Food Science, 7:100632, 2023.
- Doi [2007] Kunio Doi. Computer-aided diagnosis in medical imaging: Historical review, current status and future potential. Computerized Medical Imaging and Graphics, 31(4-5):198–211, 2007.
- Dosovitskiy et al. [2021] Alexey Dosovitskiy, Lucas Beyer, Alexander Kolesnikov, Dirk Weissenborn, Xiaohua Zhai, Thomas Unterthiner, Mostafa Dehghani, Matthias Minderer, Georg Heigold, Sylvain Gelly, Jakob Uszkoreit, and Neil Houlsby. An image is worth 16x16 words: Transformers for image recognition at scale. arXiv:2010.11929 [cs.CV], 2021.
- Du et al. [2019] Zhe Du, Yongguang Hu, Noman Ali Buttar, and Ashraf Mahmood. X-ray computed tomography for quality inspection of agricultural products: A review. Food Science & Nutrition, 7(10):3146–3160, 2019.
- du Plessis and Boshoff [2019] Anton du Plessis and William P. Boshoff. A review of X-ray computed tomography of concrete and asphalt construction materials. Construction and Building Materials, 199:637–651, 2019.
- Feng et al. [2021] Ran Feng, Sylvain Barjon, Frans W. J. van den Berg, Søren Kristian Lillevang, and Lilia Ahrné. Effect of residence time in the cooker-stretcher on mozzarella cheese composition, structure and functionality. Journal of Food Engineering, 309:110690, 2021.
- Feng et al. [2023] Ran Feng, Franciscus Winfried J. van der Berg, Rajmund Mokso, Søren Kristian Lillevang, and Lilia Ahrné. Structural, rheological and functional properties of extruded mozzarella cheese influenced by the properties of the renneted casein gels. Food Hydrocolloids, 137:108322, 2023.
- Garcea et al. [2018] S. C. Garcea, Y. Wang, and P. J. Withers. X-ray computed tomography of polymer composites. Composites Science and Technology, 156:305–319, 2018.
- Godoi et al. [2016] Fernanda C. Godoi, Sangeeta Prakash, and Bhesh R. Bhandari. 3D printing technologies applied for food design: Status and prospects. Journal of Food Engineering, 179:44–54, 2016.
- Granlund [1978] Goesta H. Granlund. In search of a general picture processing operator. Computer Graphics and Image Processing, 8(2):155–173, 1978.
- Haralick et al. [1973] Robert M. Haralick, Karthikeyan Shanmugam, and Its’Hak Dinstein. Textural features for image classification. IEEE Transactions on Systems, Man, and Cybernetics, SMC3(6):610–621, 1973.
- Hatamizadeh et al. [2022] Ali Hatamizadeh, Vishwesh Nath, Yucheng Tang, Dong Yang, Holger R. Roth, and Daguang Xu. Swin UNETR: Swin transformers for semantic segmentation of brain tumors in MRI images. In Brainlesion: Glioma, Multiple Sclerosis, Stroke and Traumatic Brain Injuries (BrainLes 2021), pages 272–284. Lecture Notes in Computer Science, Vol. 12962. Springer, 2022.
- He et al. [2016] Kaiming He, Xiangyu Zhang, Shaoqing Ren, and Jian Sun. Deep residual learning for image recognition. In Proceedings of Computer Vision and Pattern Recognition (CVPR), pages 770–778. IEEE, 2016.
- Heimann and Meinzer [2009] Tobias Heimann and Hans Peter Meinzer. Statistical shape models for 3d medical image segmentation: A review. Medical Image Analysis, 13(4):543–563, 2009.
- Heller et al. [2020] Nicholas Heller, Niranjan Sathianathen, Arveen Kalapara, Edward Walczak, Keenan Moore, Heather Kaluzniak, Joel Rosenberg, Paul Blake, Zachary Rengel, Makinna Oestreich, Joshua Dean, Michael Tradewell, Aneri Shah, Resha Tejpaul, Zachary Edgerton, Matthew Peterson, Shaneabbas Raza, Subodh Regmi, Nikolaos Papanikolopoulos, and Christopher Weight. The KiTS19 challenge data: 300 kidney tumor cases with clinical context, CT semantic segmentations, and surgical outcomes. arXiv:1904.00445 [q-bio.QM], 2020.
- Jensen et al. [2024] Patrick Møller Jensen, Vedrana Andersen Dahl, Rebecca Engberg, Carsten Gundlach, Hans Martin Kjer, and Anders Bjorholm Dahl. BugNIST - a large volumetric dataset for object detection under domain shift. arXiv:2304.01838 [cs.CV], 2024.
- Jeppesen et al. [2021] N. Jeppesen, L. P. Mikkelsen, A. B. Dahl, A. N. Christensen, and V. A. Dahl. Quantifying effects of manufacturing methods on fiber orientation in unidirectional composites using structure tensor analysis. Composites Part A: Applied Science and Manufacturing, 149:106541, 2021.
- Karamov et al. [2020] Radmir Karamov, Luca M. Martulli, Martin Kerschbaum, Ivan Sergeichev, Yentl Swolfs, and Stepan V. Lomov. Micro-CT based structure tensor analysis of fibre orientation in random fibre composites versus high-fidelity fibre identification methods. Composite Structures, 235:111818, 2020.
- Kuznetsova et al. [2020] Alina Kuznetsova, Hassan Rom, Neil Alldrin, Jasper Uijlings, Ivan Krasin, Jordi Pont-Tuset, Shahab Kamali, Stefan Popov, Matteo Malloci, Alexander Kolesnikov, Tom Duerig, and Vittorio Ferrari. The open images dataset V4: Unified image classification, object detection, and visual relationship detection at scale. International Journal of Computer Vision, 128(7):1956–1981, 2020.
- Lee et al. [2021] Seung Hoon Lee, Seunghyun Lee, and Byung Cheol Song. Vision transformer for small-size datasets, 2021.
- Liew et al. [2022] Sook-Lei Liew, Bethany P. Lo, Miranda R. Donnelly, Artemis Zavaliangos-Petropulu, Jessica N. Jeong, Giuseppe Barisano, Alexandre Hutton, Julia P. Simon, Julia M. Juliano, Anisha Suri, Zhizhuo Wang, Aisha Abdullah, Jun Kim, Tyler Ard, Nerisa Banaj, Michael R. Borich, Lara A. Boyd, Amy Brodtmann, Cathrin M. Buetefisch, Lei Cao, Jessica M. Cassidy, Valentina Ciullo, Adriana B. Conforto, Steven C. Cramer, Rosalia Dacosta-Aguayo, Ezequiel de la Rosa, Martin Domin, Adrienne N. Dula, Wuwei Feng, Alexandre R. Franco, Fatemeh Geranmayeh, Alexandre Gramfort, Chris M. Gregory, Colleen A. Hanlon, Brenton G. Hordacre, Steven A. Kautz, Mohamed Salah Khlif, Hosung Kim, Jan S. Kirschke, Jingchun Liu, Martin Lotze, Bradley J. MacIntosh, Maria Mataró, Feroze B. Mohamed, Jan E. Nordvik, Gilsoon Park, Amy Pienta, Fabrizio Piras, Shane M. Redman, Kate P. Revill, Mauricio Reyes, Andrew D. Robertson, Na Jin Seo, Surjo R. Soekadar, Gianfranco Spalletta, Alison Sweet, Maria Telenczuk, Gregory Thielman, Lars T. Westlye, Carolee J. Winstein, George F. Wittenberg, Kristin A. Wong, and Chunshui Yu. A large, curated, open-source stroke neuroimaging dataset to improve lesion segmentation algorithms. Scientific Data, 9:320, 2022.
- Lin et al. [2014] Tsung-Yi Lin, Michael Maire, Serge Belongie, Lubomir Bourdev, Ross Girshick, James Hays, Pietro Perona, Deva Ramanan, C. Lawrence Zitnick, and Piotr Dollár. Microsoft COCO: Common objects in context. arXiv:1405.0312 [cs.CV], 2014.
- Litjens et al. [2017] Geert Litjens, Thijs Kooi, Babak Ehteshami Bejnordi, Arnaud Arindra Adiyoso Setio, Francesco Ciompi, Mohsen Ghafoorian, Jeroen A. W. M. van der Laak, Bram van Ginneken, and Clara I. Sánchez. A survey on deep learning in medical image analysis. Medical Image Analysis, 42:60–88, 2017.
- Liu et al. [2021a] Pengbo Liu, Hu Han, Yuanqi Du, Heqin Zhu, Yinhao Li, Feng Gu, Honghu Xiao, Jun Li, Chunpeng Zhao, Li Xiao, Xinbao Wu, and S. Kevin Zhou. Deep learning to segment pelvic bones: Large-scale CT datasets and baseline models. arXiv:2012.08721 [cs.CV], 2021a.
- Liu et al. [2015] Ziwei Liu, Ping Luo, Xiaogang Wang, and Xiaoou Tang. Deep learning face attributes in the wild. In Proceedings of International Conference on Computer Vision (ICCV), pages 3730–3738. IEEE, 2015.
- Liu et al. [2021b] Ze Liu, Yutong Lin, Yue Cao, Han Hu, Yixuan Wei, Zheng Zhang, Stephen Lin, and Baining Guo. Swin transformer: Hierarchical vision transformer using shifted windows. Proceedings of International Conference on Computer Vision (ICCV), pages 9992–10002, 2021b.
- Liu et al. [2022] Zhuang Liu, Hanzi Mao, Chao Yuan Wu, Christoph Feichtenhofer, Trevor Darrell, and Saining Xie. A ConvNet for the 2020s. In Proceedings of Computer Vision and Pattern Recognition (CVPR), pages 11966–11976. IEEE, 2022.
- Loshchilov and Hutter [2017] Ilya Loshchilov and Frank Hutter. Decoupled weight decay regularization. arXiv:1711.05101 [cs.LG], 2017.
- maintainers and contributors [2022] 3D-CNN-PyTorch maintainers and contributors. 3D-CNN-PyTorch: PyTorch implementation for 3dCNNs for medical images. https://github.com/xmuyzz/3D-CNN-PyTorch, 2022.
- maintainers and contributors [2016] TorchVision maintainers and contributors. TorchVision: PyTorch’s computer vision library. https://github.com/pytorch/vision, 2016.
- Maire and Withers [2014] E. Maire and P. J. Withers. Quantitative X-ray tomography. International Materials Reviews, 59(1):1–43, 2014.
- Marcus et al. [2007] Daniel S. Marcus, Tracy H. Wang, Jamie Parker, John G. Csernansky, John C. Morris, and Randy L. Buckner. Open access series of imaging studies (OASIS): Cross-sectional MRI data in young, middle aged, nondemented, and demented older adults. Journal of Cognitive Neuroscience, 19(9):1498–1507, 2007.
- McInnes et al. [2020] Leland McInnes, John Healy, and James Melville. UMAP: Uniform manifold approximation and projection for dimension reduction. arXiv:1802.03426 [stat.ML], 2020.
- Mei et al. [2021] Jie Mei, Ming-Ming Cheng, Gang Xu, Lan-Ruo Wan, and Huan Zhang. SANet: A slice-aware network for pulmonary nodule detection. IEEE Transactions on Pattern Analysis and Machine Intelligence, 44(8):4374–4387, 2021.
- Menze et al. [2015] Bjoern H. Menze, Andras Jakab, Stefan Bauer, Jayashree Kalpathy-Cramer, Keyvan Farahani, Justin Kirby, Yuliya Burren, Nicole Porz, Johannes Slotboom, Roland Wiest, Levente Lanczi, Elizabeth Gerstner, Marc-Andre Weber, Tal Arbel, Brian B. Avants, Nicholas Ayache, Patricia Buendia, D. Louis Collins, Nicolas Cordier, Jason J. Corso, Antonio Criminisi, Tilak Das, Herve Delingette, Cagatay Demiralp, Christopher R. Durst, Michel Dojat, Senan Doyle, Joana Festa, Florence Forbes, Ezequiel Geremia, Ben Glocker, Polina Golland, Xiaotao Guo, Andac Hamamci, Khan M. Iftekharuddin, Raj Jena, Nigel M. John, Ender Konukoglu, Danial Lashkari, Jose Antonio Mariz, Raphael Meier, Sergio Pereira, Doina Precup, Stephen J. Price, Tammy Riklin Raviv, Syed M. S. Reza, Michael Ryan, Duygu Sarikaya, Lawrence Schwartz, Hoo-Chang Shin, Jamie Shotton, Carlos A. Silva, Nuno Sousa, Nagesh K. Subbanna, Gabor Szekely, Thomas J. Taylor, Owen M. Thomas, Nicholas J. Tustison, Gozde Unal, Flor Vasseur, Max Wintermark, Dong Hye Ye, Liang Zhao, Binsheng Zhao, Darko Zikic, Marcel Prastawa, Mauricio Reyes, and Koen Van Leemput. The multimodal brain tumor image segmentation benchmark (BRATS). IEEE Transactions on Medical Imaging, 34(10):1993–2024, 2015.
- Morozov et al. [2020] S. P. Morozov, A. E. Andreychenko, N. A. Pavlov, A. V. Vladzymyrskyy, N. V. Ledikhova, V. A. Gombolevskiy, I. A. Blokhin, P. B. Gelezhe, A. V. Gonchar, and V. Yu. Chernina. MosMedData: Chest CT scans with COVID-19 related findings dataset. arXiv:2005.06465 [cs.CY], 2020.
- Mota et al. [2024] Tiago Mota, M. Rita Verdelho, Diogo J. Araújo, Alceu Bissoto, Carlos Santiago, and Catarina Barata. MMIST-ccRCC: A real world medical dataset for the development of multi-modal systems. In Proceedings of Computer Vision and Pattern Recognition (CVPR), pages 2395–2403. IEEE, 2024.
- Mridha et al. [2022] M. F. Mridha, Akibur Rahman Prodeep, A. S.M.Morshedul Hoque, Md Rashedul Islam, Aklima Akter Lima, Muhammad Mohsin Kabir, Md Abdul Hamid, and Yutaka Watanobe. A comprehensive survey on the progress, process, and challenges of lung cancer detection and classification. Journal of Healthcare Engineering, 2022(1):5905230, 2022.
- Pieta et al. [2024] Pawel Tomasz Pieta, Anders Bjorholm Dahl, Jeppe Revall Frisvad, Siavash Arjomand Bigdeli, and Anders Nymark Christensen. Feature-centered first order structure tensor scale-space in 2D and 3D. arXiv:2409.13389 [cs.CV], 2024.
- Salvo et al. [2010] Luc Salvo, Michel Suéry, Ariane Marmottant, Nathalie Limodin, and Dominique Bernard. 3D imaging in material science: Application of X-ray tomography. Comptes Rendus Physique, 11(9-10):641–649, 2010.
- Sandler et al. [2018] Mark Sandler, Andrew Howard, Menglong Zhu, Andrey Zhmoginov, and Liang Chieh Chen. MobileNetV2: Inverted residuals and linear bottlenecks. Proceedings of Computer Vision and Pattern Recognition (CVPR), pages 4510–4520, 2018.
- Schoeman et al. [2016] Letitia Schoeman, Paul Williams, Anton du Plessis, and Marena Manley. X-ray micro-computed tomography (CT) for non-destructive characterisation of food microstructure. Trends in Food Science & Technology, 47:10–24, 2016.
- Setio et al. [2017] Arnaud Arindra Adiyoso Setio, Alberto Traverso, Thomas de Bel, Moira S. N. Berens, Cas van den Bogaard, Piergiorgio Cerello, Hao Chen, Qi Dou, Maria Evelina Fantacci, Bram Geurts, Robbert van der Gugten, Pheng Ann Heng, Bart Jansen, Michael M. J. de Kaste, Valentin Kotov, Jack Yu Hung Lin, Jeroen T. M. C. Manders, Alexander Sóñora-Mengana, Juan Carlos García-Naranjo, Evgenia Papavasileiou, Mathias Prokop, Marco Saletta, Cornelia M. Schaefer-Prokop, Ernst T. Scholten, Luuk Scholten, Miranda M. Snoeren, Ernesto Lopez Torres, Jef Vandemeulebroucke, Nicole Walasek, Guido C. A. Zuidhof, Bram van Ginneken, and Colin Jacobs. Validation, comparison, and combination of algorithms for automatic detection of pulmonary nodules in computed tomography images: The LUNA16 challenge. Medical Image Analysis, 42:1–13, 2017.
- Shen et al. [2017] Dinggang Shen, Guorong Wu, and Heung-Il Suk. Deep learning in medical image analysis. Annual Review of Biomedical Engineering, 19(1):221–248, 2017.
- Shen et al. [2004] Hongbin Shen, Steven Nutt, and David Hull. Direct observation and measurement of fiber architecture in short fiber-polymer composite foam through micro-CT imaging. Composites Science and Technology, 64(13-14):2113–2120, 2004.
- Singh et al. [2020] Satya P. Singh, Lipo Wang, Sukrit Gupta, Haveesh Goli, Parasuraman Padmanabhan, and Balázs Gulyás. 3D deep learning on medical images: A review. Sensors, 20(18):1–24, 2020.
- Sutton [2008] Mark D. Sutton. Tomographic techniques for the study of exceptionally preserved fossils. Proceedings of the Royal Society B: Biological Sciences, 275(1643):1587–1593, 2008.
- Tan and Le [2020] Mingxing Tan and Quoc V. Le. EfficientNet: Rethinking model scaling for convolutional neural networks. arXiv:1905.11946 [cs.LG], 2020.
- Tang et al. [2022] Yucheng Tang, Dong Yang, Wenqi Li, Holger R. Roth, Bennett Landman, Daguang Xu, Vishwesh Nath, and Ali Hatamizadeh. Self-supervised pre-training of swin transformers for 3D medical image analysis. In Proceedings of Computer Vision and Pattern Recognition (CVPR), pages 20698–20708. IEEE, 2022.
- Timmins et al. [2021] Kimberley M. Timmins, Irene C. van der Schaaf, Edwin Bennink, Ynte M. Ruigrok, Xingle An, Michael Baumgartner, Pascal Bourdon, Riccardo De Feo, Tommaso Di Noto, Florian Dubost, Augusto Fava-Sanches, Xue Feng, Corentin Giroud, Inteneural Group, Minghui Hu, Paul F. Jaeger, Juhana Kaiponen, Michał Klimont, Yuexiang Li, Hongwei Li, Yi Lin, Timo Loehr, Jun Ma, Klaus H. Maier-Hein, Guillaume Marie, Bjoern Menze, Jonas Richiardi, Saifeddine Rjiba, Dhaval Shah, Suprosanna Shit, Jussi Tohka, Thierry Urruty, Urszula Walińska, Xiaoping Yang, Yunqiao Yang, Yin Yin, Birgitta K. Velthuis, and Hugo J. Kuijf. Comparing methods of detecting and segmenting unruptured intracranial aneurysms on tof-mras: The ADAM challenge. NeuroImage, 238:118216, 2021.
- vit-pytorch maintainers and contributors [2020] vit-pytorch maintainers and contributors. vit-pytorch. https://github.com/lucidrains/vit-pytorch, 2020.
- Walsh et al. [2021] C. L. Walsh, P. Tafforeau, W. L. Wagner, D. J. Jafree, A. Bellier, C. Werlein, M. P. Kühnel, E. Boller, S. Walker-Samuel, J. L. Robertus, D. A. Long, J. Jacob, S. Marussi, E. Brown, N. Holroyd, D. D. Jonigk, M. Ackermann, and P. D. Lee. Imaging intact human organs with local resolution of cellular structures using hierarchical phase-contrast tomography. Nature Methods, 18(12):1532–1541, 2021.
- Warburg et al. [2020] Frederik Warburg, Soren Hauberg, Manuel Lopez-Antequera, Pau Gargallo, Yubin Kuang, and Javier Civera. Mapillary street-level sequences: A dataset for lifelong place recognition. In Proceedings of Computer Vision and Pattern Recognition (CVPR), pages 2626–2635. IEEE, 2020.
- Wasserthal et al. [2023] Jakob Wasserthal, Hanns Christian Breit, Manfred T. Meyer, Maurice Pradella, Daniel Hinck, Alexander W. Sauter, Tobias Heye, Daniel T. Boll, Joshy Cyriac, Shan Yang, Michael Bach, and Martin Segeroth. TotalSegmentator: Robust segmentation of 104 anatomic structures in CT images. Radiology: Artificial Intelligence, 5(5):e230024, 2023.
- Xiao et al. [2017] Han Xiao, Kashif Rasul, and Roland Vollgraf. Fashion-MNIST: a novel image dataset for benchmarking machine learning algorithms. arXiv:1708.07747 [cs.LG], 2017.
- Xie et al. [2017] Saining Xie, Ross Girshick, Piotr Dollár, Zhuowen Tu, and Kaiming He. Aggregated residual transformations for deep neural networks. In Proceedings of Computer Vision and Pattern Recognition (CVPR), pages 5987–5995. IEEE, 2017.
- Xie et al. [2021] Yutong Xie, Jianpeng Zhang, Chunhua Shen, and Yong Xia. CoTr: Efficiently bridging CNN and transformer for 3D medical image segmentation. In Medical Image Computing and Computer Assisted Intervention (MICCAI 2021), pages 171–180. Lecture Notes in Computer Science, Vol. 12903.Springer, 2021.
- Zhou et al. [2021] S. Kevin Zhou, Hayit Greenspan, Christos Davatzikos, James S. Duncan, Bram Van Ginneken, Anant Madabhushi, Jerry L. Prince, Daniel Rueckert, and Ronald M. Summers. A review of deep learning in medical imaging: Imaging traits, technology trends, case studies with progress highlights, and future promises. Proceedings of the IEEE, 109(5):820–838, 2021.
Supplementary Material
8 Data visualization
8.1 Scans
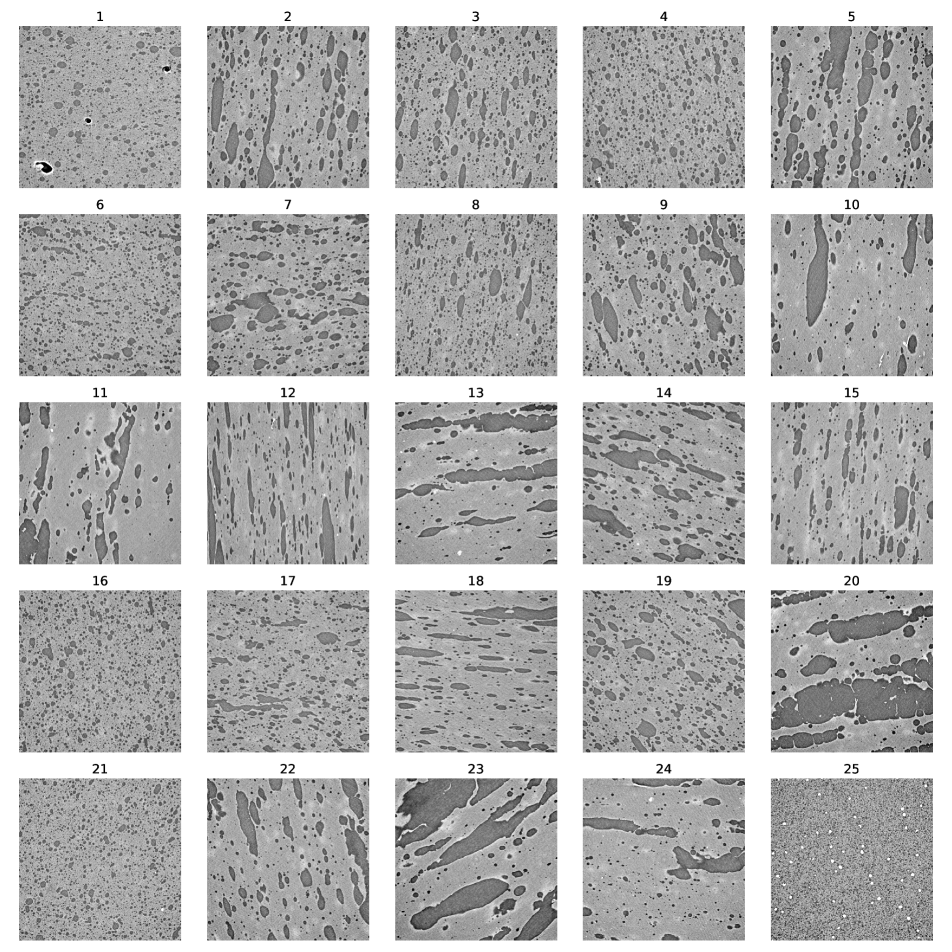
In Fig. 2 we introduce a set of example scan slices that illustrate the structural variability across the cheese samples. Subsequently, in Fig. 5(c) we use slices from all scans to explore the representation learned by one of the models. To provide a clean and comprehensive overview of the variability, the same slices are arranged in an ordered grid in Fig. 6.
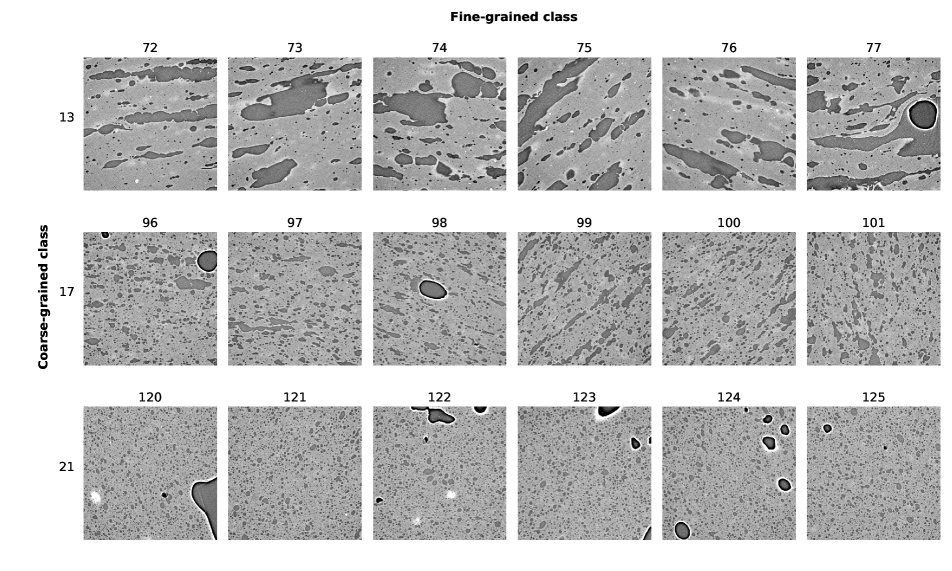
To further supplement the overview of the scanned samples, Fig. 7 showcases example slices from different fine-grained classes. These are organized into sets of six samples originating from the same cheese type, emphasizing their structural similarity and consequent increase in the complexity of the problem. However, it is important to note that a single 2D slice may not fully capture the sample’s structural characteristics, which are likely to be more effectively discerned through a full 3D representation.
8.2 Metadata
In Sec. 3.1, we provide an overview of the metadata including experimental design parameters, which are later visualized in a reduced form in Fig. 4.
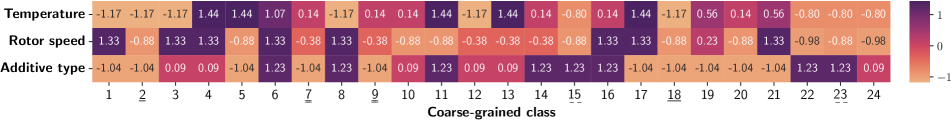
The presented PCA reduction was applied to three parameters: rotor speed, temperature, and additive type. The additive type is a categorical variable with three categories (None, CaCL2, and Citric Acid), to which a unique number is assigned. Each parameter is then normalized to maintain the confidentiality of the exact recipe. The resulting values are presented in Fig. 8, normalized to a zero mean and standard deviation of one.
9 Additional Experiments
9.1 Rotation ablation study
In Sec. 6.1 we discuss structure orientation as a potential source of bias, noting that while sample preparation and data augmentations largely mitigate this issue, it is not systematically addressed in the raw data. To evaluate the impact of volume orientation on the accuracy of the investigated models, we conducted an additional ablation study using a modified set of transforms.
This study focused on the ResNet50 model, given its consistent performance, and utilized the Base dataset as a central, representative example. Both 2D and 3D models were trained for coarse-grained and fine-grained tasks. Apart from the data augmentation, the training setup was exactly the same as in the original experiments.
The modified set of transforms included the following elements:
-
1.
Normalization.
-
2.
Random rotation ().
-
3.
Random flipping in X and Y axis ().
-
4.
Random rotation in a \qtyrange-3030 range ().
Elements 1 and 3 were retained from the original pipeline. The combined set of transforms covers most of the possible structure orientations while minimizing information loss at the most extreme angles.
| Granularity | Coarse | Fine | ||
|---|---|---|---|---|
| Dimensionality | 2D | 3D | 2D | 3D |
| Reference | 0.661 | 0.973 | 0.403 | 0.690 |
| With rotations | 0.738 | 0.971 | 0.428 | 0.600 |
The results of the study (Tab. 4) suggest that volume orientation does not exhibit a clear or consistent impact on training accuracy. While both 2D models appear to perform better with the new setup, the fine-grained 3D model shows a noticeable decline in performance. Overall, the impact on fine-grained models is more negative compared to coarse-grained models, which may be due to fine-grained models relying more heavily on structure orientation, as each sample (fine-grained class) is cut in a single direction, with variation introduced only through data augmentation. However, this effect is not significant enough to undermine the validity of the dataset or the presented results. The moderate improvement in the coarse-grained models is likely attributable to the positive influence of data augmentation on generalization.
9.2 Fine-grained model UMAP
A similar experiment to the one described in 4.4 and visualized in 5 was conducted using the best-performing fine-grained model. The resulting UMAPs are shown in Fig. 9, though the slice-based visualization is omitted here for readability. The colormaps remain consistent with those used in the coarse-grained analysis.

Despite a different target, in most cases the network still groups samples from the same coarse-grained class in close proximity (Fig. 9(a)). This behavior indicates that structural similarities within these samples significantly influence the embedding space constructed by the model. As shown in Fig. 9(b), the alignment with PCA space appears similar or even stronger compared to the coarse-grained model. The UMAP reveals four distinct zones with purple samples in the top-left, orange/red in the bottom-left, green in the bottom-right, and blue on the right. While some exceptions are present, these can often be explained by structural properties that deviate from the PCA parameters, as discussed in Sec. 5.2. This layout suggests that the fine-grained model captures a more nuanced representation of the structural variability, which may result from the need to detect subtler differences between samples and the absence of regularizing constraints imposed by the 25 coarse-grained classes.