language=C++, frame=none, xleftmargin=15pt, stepnumber=1, numbers=left, numbersep=5pt, numberstyle=, belowcaptionskip=captionpos=b, escapeinside=*”*, tabsize=5, emphstyle=, escapechar=!, basicstyle=, keywordstyle=, stringstyle=, commentstyle=, morecomment=[s][]/***/, showspaces=false, columns=flexible, showstringspaces=false, morecomment=[l]//, tabsize=2, breaklines=true, moredelim=[is][]^^
PerfGen: Automated Performance Benchmark Generation for Big Data Analytics
Abstract
Many symptoms of poor performance in big data analytics such as computational skews, data skews, and memory skews are input dependent. However, due to lack of inputs that can trigger such performance symptoms, it is hard to debug and test big data analytics.
We design PerfGen to automatically generate inputs for the purpose of performance testing. PerfGen overcomes three challenges when naively using automated fuzz testing for the purpose of performance testing. First, typical greybox fuzzing relies on coverage as a guidance signal and thus is unlikely to trigger interesting performance behavior. Therefore, PerfGen provides performance monitor templates that a user can extend to serve as a set of guidance metrics for grey-box fuzzing. Second, performance symptoms may occur at an intermediate or later stage of a big data analytics pipeline. Thus, PerfGen uses a phased fuzzing approach. This approach identifies symptom-causing intermediate inputs at an intermediate stage first and then converts them to the inputs at the beginning of the program with a pseudo-inverse function generated by a large language model. Third, PerfGen defines sets of skew-inspired input mutations, which increases the chance of inducing performance problems. We evaluate PerfGen using four case studies. PerfGen achieves at least 43X speedup compared to a traditional fuzzing approach when generating inputs to trigger performance symptoms. Additionally, identifying intermediate inputs first and then converting them to original inputs by pseudo-inverse functions, which only takes up to 2 prompting iterations using a large language model, enables PerfGen to generate such workloads in less than 0.004% of the iterations required by a baseline approach.
I Introduction
As the capacity to store and process data has increased remarkably, large scale data processing has become an essential part of software development. Data-intensive scalable computing (DISC) systems, such as MapReduce [16], Apache Hadoop [1], and Apache Spark [5], have shown great promises to address the scalability challenge. These systems abstract away the complex execution models, deep software stacks, and numerous customizable configurations from users. However, this comes at the cost of performance incomprehensibility, i.e., novice developers lack the necessary knowledge to prevent and correct performance issues. This problem is exacerbated when performance variability is input dependent and existing test data fails to expose pathological performance symptoms.
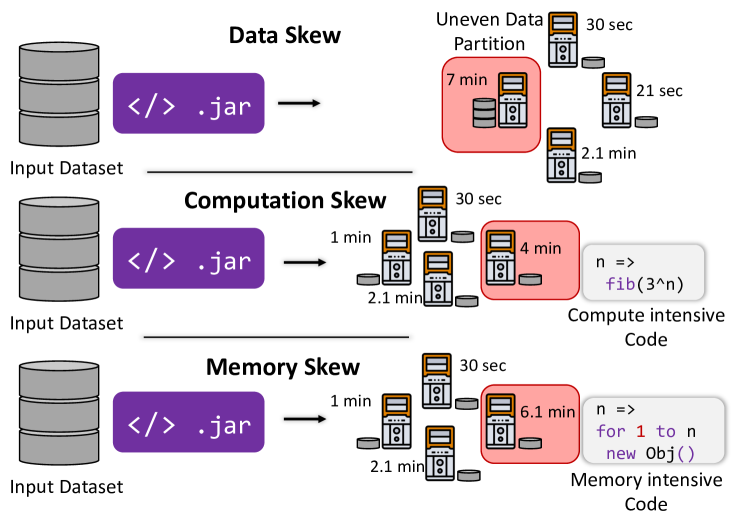
Prior work [46] has discussed several major sources of performance slowdowns in DISC applications. Figure 1 visualizes three kinds of performance problems. Data skew [25] happens when the input is unevenly distributed across computation nodes, leading to a few nodes taking a much bigger workload and becoming stragglers. Computational skew [46] occurs when a normal input triggers an extremely long, intensive computation (e.g., finding the n- Fibonacci number). Memory Skew [11] occurs when a certain record triggers repetitive, memory-intensive operations (e.g., malloc or object creation). Performance skews are often input dependent. Therefore, our goal is to automatically generate test inputs that can trigger performance skews. Such inputs could guide developers in correcting the root cause of performance bottlenecks.
Challenges. The standard practice for testing data-intensive applications today is to select a subset of inputs based on the developers’ hunch with the hope that it will reveal possible performance issues. For example, to test big data applications, developers may use a small sample of data selected via random sampling or top sampling. Not surprisingly, such sampling is unlikely to yield performance skews described above. Developers could always increase the number of samples, or modify the samples in different ways; however, such adhoc test input generation will significantly increase testing time.
Fuzz testing has been proven to be highly effective in revealing a diverse set of bugs, including performance defects [50, 26, 42, 35], correctness bugs [40, 41, 9], and security vulnerabilities [12, 19, 15, 43]. Generally speaking, fuzzing techniques start from a seed input, run the program on the selected input, generate new inputs by mutating the previous input, and add new inputs to the queue if they improve a given guidance metric such as branch coverage. However, it is nontrivial to apply such traditional fuzzing to data-intensive applications for the following reasons.
First, the long latency of big data analytics prohibits repetitively invoking the entire application from the beginning—a common assumption for fuzz testing techniques. Inherently, these are two conflicting goals: eliminating long-latency during testing vs. encountering performance skews that are rare during testing. In particular, when the performance skew symptoms appear at a later computation stage, it is difficult to generate inputs in the beginning of the program, which induce performance problems in the later stage.
Second, to discover pathological inputs that trigger performance symptoms, feedback metrics must account for underlying systems-level metrics such as CPU time and memory usage. Prior work PerfFuzz [26] is limited to simply counting the number of exercised control flow graph edges as feedback (i.e., inducing a longer execution path). To trigger various performance skews in big data analytics, a user should be able to inject performance monitors that can watch partition-level runtime, peak memory usage, and garbage collection time and compare these metrics across multiple partitions.
Third, in terms of input mutation operations, random bit-level input mutations used in traditional fuzzers like AFL [53] may not be effective at exposing real performance problems. This is because the entire running time is strongly influenced by the collective properties of the dataset (e.g., key distribution, garbage collection that depends on the entire dataset’s in-situ memory needs, differences in parallel task execution latency). In other words, input mutations for performance fuzzing must ensure that each record compiles with the input schema and that either the content of data set should be modified in ways that target specific performance symptoms.
Our Solution. PerfGen automatically generates test inputs to trigger a performance skew. In PerfGen, a user can easily specify a performance symptom of interest using pre-defined performance monitors. PerfGen then automatically inserts the corresponding performance monitor and uses it as feedback guidance for grey-box fuzzing. To overcome the aforementioned challenges of adapting fuzz testing for performance workload generation—long latency, lack of performance feedback, and low-level input mutations, PerfGen combines three technical innovations:
First, to trigger a performance symptom appearing in the later computation stage, PerfGen uses a phased fuzzing approach. Deeper program paths cannot be easily reached through input generation; however, it is relatively easier to target a single user-defined function (UDF) in isolation. Our phased fuzzing targets an individual user-defined function at a given stage to gain knowledge about the intermediate inputs that trigger a performance symptom. Then using a pseudo-inverse function that is auto-generated by a large language model GPT-4 [38], PerfGen converts the intermediate inputs to corresponding inputs at the beginning of the program, which are then used as improved seeds for fuzzing the entire program.
Second, PerfGen enables users to specify performance symptoms by implementing customizable monitor templates which provide useful guidance metrics for fuzzing. PerfGen currently supports performance outlier detecting templates for computation, memory, and data skew symptoms. These templates relate symptoms with relevant performance metrics such as partition runtime, memory usage, and shuffle sizes.
Third, PerfGen improves its chances of constructing meaningful inputs with sets of skew-inspired mutations. PerfGen supports a variety of input mutation operations including data replication, column/field-level mutations for multi-value inputs, and mutations that exploit key-value distributions.
Evaluation. We compare the test generation time and the number of iterations required for triggering performance symptoms with and without phased fuzzing. Across our four case studies, PerfGen achieves more than 43X speedup in time and requires less than 0.004% iterations compared to PerfGen without phased fuzzing. Additionally, PerfGen’s template-inspired mutation probabilities result in a 1.81X speedup in input generation time compared to a uniform sampling configuration.
Most fuzzing techniques focus on correctness testing with crash symptoms. Compared to crashes, performance problems are not explored much in automated fuzzing. PerfGen is the first automated fuzzer that can trigger data, memory, and computational skews.
-
•
We present an automated test generation framework that supports various kinds of performance monitors for big data analytics. PerfGen is built on Apache Spark and its key idea generalizes to other data-intensive scalable computing applications such MapReduce and Hadoop.
-
•
We are the first to employ a targeted, phased fuzzing approach to expedite fuzz testing by generating intermediate inputs at a later stage first and then mapping them to the improved seeds by a pseudo-inverse function at the beginning of a program. It only takes up to 2 prompting iterations to generate the pseudo-inverse function and achieves 43X compared to the baseline.
-
•
We are the first to define skew-inducing input mutations for data-intensive analytics. These input mutations duplicate data rows, adjust key-value distributions, or add additional records with the same key while mixing values from other rows. These input mutations differ from typical bit-level mutations and are designed to trigger data, memory, and computation skews easily.
II Motivating Example
To demonstrate the challenges of performance debugging and how PerfGen addresses such challenges, we present a motivating example using a program inspired by [51]. In this example, a developer uses the Collatz program shown in Figure 2. The Collatz program consumes a string dataset of space-separated integers to compute a mathematical result for each distinct integer based on its Collatz sequence length and number of occurrences. For each parsed integer, the program applies a mathematical function solve_collatz (Figure 3) to compute a numerical result based on each integer’s Collatz sequence length, in polynomial time with respect to that length. After applying solve_collatz to each integer, the program then aggregates across each integer and returns the summed result per distinct integer.
Suppose the developer is interested in exploring the performance of this program, particularly the solved variable which applies the solve_collatz funtion. They want to generate an input dataset that will induce performance skew by causing a single data partition to require at least five times the computation time of other partitions. In other words, they wish to find an input that meets the following symptom predicate:
As a starting point, the developer generates an initial input consisting of four single-record partitions: “1”, “2”, “3”, and “4”. However, this simple input does not result in any significant performance skew within the Collatz program.
The developer initially turns to traditional fuzzing techniques for help in generating a skew-inducing input dataset. However, such approaches either flip individual bits or some bytes in the dataset in an attempt to produce new inputs. Because Collatz’s string inputs are parsed into integers, such inputs may not be program-compatible and therefore could not reach the solve_collatz function and induce performance skew. Furthermore, traditional fuzzing techniques typically use code branch coverage as guidance for driving execution towards rare execution paths, and thus do not consider performance metrics.
The developer decides to use PerfGen to generate an input that produces performance skew for the Collatz program. Suppose that the developer suspects that solved UDF may have a performance problem. PerfGen’s phased fuzzing approach first targets this function to generate intermediate inputs. It then uses a pseudo-inverse function to convert the solved’s intermediate inputs to improved seeds for Collatz. For example, Figure 4 shows such a pseudo-inverse function that guesses seed inputs from the intermediate inputs. Such a pseudo-inversion function does not need to be an exact inverse function as its goal is to generate improved seeds for subsequent fuzzing iterations. PerfGen applies the large language model to generate a pseudo-inverse function. As shown in Figure 9, in our case, it took only 1 prompting to create this pseudo inverse function using ChatGPT.
Next, the developer defines their symptom in PerfGen by selecting a monitor template and performance metric from Tables I and II. Based on the symptom predicate described earlier, they choose a NextComparison(5.0) monitor template and the Runtime metric to create the following symptom monitor. is the collection of partition runtimes for a given job execution:
This predicate inspects the partition runtimes for a given job execution and checks if the longest partition runtime is at least five times as long as all other partition runtimes.
Using this symptom monitor, PerfGen produces mutations from Table III for both intermediate solved inputs as well as Collatz program inputs. For example, the mutations for solved’s (Int, Iterable[Int]) inputs include mutations which randomly replace the integer values in record keys or values, or alter the distribution of data by appending newly generated records. In addition to producing mutations, PerfGen also defines mutation sampling probabilities by assigning sampling weights to each mutation based on their alignment with the symptom definition; for example, mutations associated with computation skew have higher sampling probabilities when PerfGen is given a computation skew symptom.
The user-specified target UDF, monitor template, and metric are shown in Figure 5. Using this configuration, PerfGen begins its phased fuzzing approach. It first executes Collatz with the input data until reaching inputs to solved, producing the partitioned UDF input shown in Figure 6. Next, it uses the derived mutations to fuzz solved first. After a few iterations, it produces the symptom-triggering UDF inputs starred in Figure 6 by adding the bolded record. As a result of the key’s long Collatz length and the solve_collatz function, this intermediate input executes slowly for only one of the data partitions and satisfies the performance skew definition.111 ”474680340” has a Collatz sequence length of 192, while the remaining records’ lengths are no more than 7.
Next, PerfGen applies the pseudo-inverse function to this UDF input to produce the Collatz program input shown in Figure 6. Upon testing, PerfGen finds that the converted inputs also exhibit performance skew for the full Collatz and returns the dataset to the user for further analysis. At this point, the user now possesses a Collatz program input triggering a performance skew symptom of interest.
III Approach
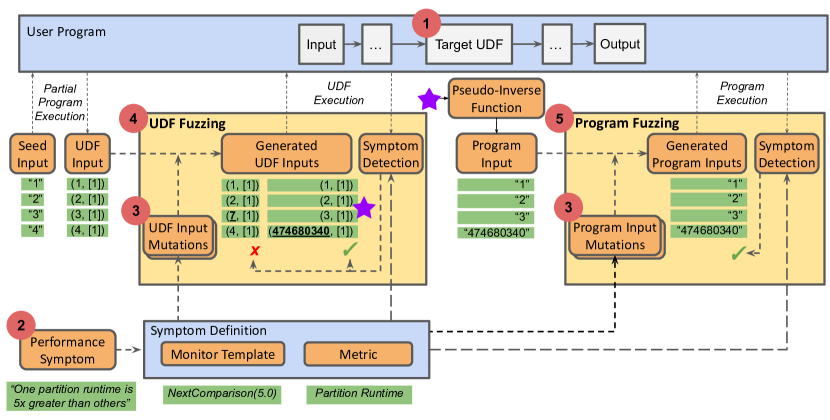
As shown in Figure 6, PerfGen takes as input a DISC application built on Apache Spark, an initial input seed, and a symptom of interest defined using a monitor template.
PerfGen extends a traditional fuzzing workflow with four novel contributions. Section III-A describes PerfGen’s HybridRDD extension to the Spark RDD API in order to support execution of individual UDFs for more precise fuzzing. Section III-B enables a user to specify a desired symptom via execution metrics and predefined monitor templates which define patterns to detect symptoms. Section III-C leverages type knowledge from the isolated UDF as well as the symptom definition to define a set of skew-inspired mutations designed to generate syntactically valid inputs geared towards producing the performance symptom of interest. Finally, Section III-D combines these techniques to find symptom-reproducing UDF inputs first and to produce improved seeds for fuzzing the entire program end to end.
| MaximumThreshold(,) | , where = value threshold | Compares the maximum value of to a threshold . |
| NextComparison(,) | , where = ratio threshold | Computes the ratio between the two largest metric values in and compares it to a threshold . |
| IQROutlier(,) | , where = first and third quartiles of , = IQR distance threshold (default 1.5) | Computes the largest interquartile range (IQR) [2] distance in and compares it to a threshold . |
| Skewness(,) | , where = third central moment of , = standard deviation of , = skewness threshold (default 1.0) | Computes the skewness [4] of and compares it to a threshold . |
| ZScore(,) | , where = mean of , = standard deviation of , = z-score threshold | Computes the largest z-score [6] in and compares it to a threshold . |
| ModZScore(,) | , where = median of , = median absolute deviation of , = modified z-score threshold | Computes the largest modified z-score [3] in and compares it to a threshold . |
| LeaveOneOutRatio(,) | , where = target ratio threshold | Computes the ratio between the largest metric and the average of all other metrics, and compares it to a threshold . |
| ErrorDetection(,, ) | error is thrown and error message contains substring | Monitors for thrown exceptions with error messages containing the specified substring . An underlying monitor template is required to provide a feedback score during fuzzing. |
III-A Enabling an entry point to UDFs
DISC applications have longer latency than other applications, making them unsuitable for iterative fuzz testing end to end [54]. Triggering a performance skew is also an extremely rare event to induce by chance via low-level mutation, when the symptom occurs deep in the program. Fuzzing is easier for a single UDF in isolation than fuzzing an entire application to reach a deep execution path. However, fuzzing a UDF requires having an entry point to the UDF.
Suppose that a user desires to have a direct entry point to a specific UDF of interest (Figure 6 label 1). Existing DISC systems such as Spark define datasets in terms of transformations (including UDFs) directly applied to previous datasets. As a result, such programs do not support decoupling UDFs from input datasets without manual refactoring or system modifications. It is nontrivial to execute a program (or subprogram) with new inputs.222For example, Spark’s various RDD implementations including MapPartitionsRDD and ShuffledRDD capture information about transformations via private, operator-specific objects such as iterator-to-iterator functions or Spark Aggregator instances. Reusing these transformation definitions with new inputs requires direct access to Spark’s internal classes.
To enable a direct entry point to a UDF, PerfGen wraps Spark RDDs with its own HybridRDDs. While HybridRDDs are functionally equivalent to RDDs, they internally separate transformations from the datasets on which they are applied and store information about the corresponding input and output data types. Using this new HybridRDD interface, a user can easily specify a target UDF of interest. Figures 7(a) and 7(b) illustrate the API changes required to leverage PerfGen’s HybridRDD for the Collatz program discussed in Section II. PerfGen automatically decouples the map transformation of solved from its predecessor (grouped) to produce a function of type RDD[(Int, Iterable[Int])] RDD[(Int, Int)] which captures the solve_collatz function used in the map transformation.
III-B Modeling performance symptoms
| Job Execution Time | Computation & Data |
| Garbage Collection Time | Memory |
| Peak Memory Usage | Memory |
| Memory Bytes Spilled on Disk | Memory |
| Input Read Records Count | Data |
| Output Write Records Count | Data |
| Shuffle Read Records Count | Data |
| Shuffle Read Bytes | Data |
| Shuffle Write Records Count | Data |
| Shuffle Write Bytes | Data |
Detecting performance skews often requires monitoring task execution time, the number of records read or written during a shuffle, and memory usage. To guide test generation towards exposing performance skews, PerfGen provides a set of eight customizable monitor templates and ten performance metrics that we constructed using Spark’s Listener API. They are listed in Tables I and II respectively. These metrics are measured at the level of each partition and each stage.
Our insight behind these templates is that DISC performance skews often follow patterns and each performance symptom could be modeled using monitor template with a choice of performance metrics (Figure 6 label 2). PerfGen uses these monitoring templates as both an oracle and a guidance feedback, as opposed to detecting crashes as an oracle and monitoring branch coverage for grey-box fuzzing.
Consider a symptom where any partition’s runtime during a program execution exceeds 100 seconds. This symptom can be defined by using the Runtime metric and MaximumThreshold monitor template, which evaluates the following predicate using the collected partition runtimes from Spark to determine if the performance symptom is triggered:
.
In addition to detecting symptoms, the monitor template also provides a feedback score corresponding to the largest metric (runtime) value observed.
III-C Skew-Inspired Input Mutation Operations
| M1 | ReplaceInteger | Integer | Computation | Replace the input integer with a randomly generated integer value within a configurable range (default: [0, Int.MaxValue)). |
| M2 | ReplaceDouble | Double | Computation | Replace the input double with a randomly generated double value within a configurable range (default: [0, Double.MaxValue)) |
| M3 | ReplaceBoolean | Boolean | Computation | Replace the input boolean with a random boolean value. |
| M4 | ReplaceSubtring | String | Computation | Mutate a string by replacing a random substring (including either empty or the full string) with a newly generated random string of random length within a configurable range (default: [0, 25)). |
| M5 | ReplaceCollectionElement | Collection | Computation | Randomly select and mutate a random element within a collection according to its type. |
| M6 | AppendCollectionCopy | Collection | Computation, Data, Memory | Extend a collection by appending a copy of itself. |
| M7 | ReplaceTupleElement | 2-Element Tuple | Computation | Randomly mutate an element within a two-element tuple according to its type. |
| M8 | ReplaceTripleElement | 3-Element Tuple | Computation | Randomly mutate an element within a three-element tuple according to its type. |
| M9 | ReplaceQuadrupleElement | 4-Element Tuple | Computation | Randomly mutate an element within a four-element tuple according to its type. |
| M10 | ReplaceRandomRecord | Dataset | Computation | Randomly select a record and mutate it according to one of the mutations applicable to the dataset type. For example, this mutation could choose a random integer out of an integer dataset and apply the ReplaceInteger mutation. |
| M11 | PairKeyToAllValues | 2-Element Tuple Dataset | Data, Memory | Randomly select a random record. For each distinct value within that record’s partition, append a new record to the partition consisting of the the selected record’s key and the distinct value, such that the key is paired with every value in the partition. |
| M12 | PairValueToAllKeys | 2-Element Tuple Dataset | Data | Similar to PairKeyToAllValues but instead pairing a random record’s value with all distinct keys in a partition. |
| M13 | AppendSameKey | 2-Element Tuple Dataset | Data, Memory | Randomly select a random record. Append additional records consisting of that record’s key paired with mutations of its value some number of times (default: up to 10% of partition size). |
| M14 | AppendSameValue | 2-Element Tuple Dataset | Data | Similar to AppendSameKey but instead with a fixed value and mutated keys. |
Consider the Collatz program from Section II, which parses strings as space-separated integers. When bit-level or byte-level mutations are applied to such inputs, they can hardly generate meaningful data that drives the program to a deep execution path since bit-flipping is likely to destroy the data format or data type. For example, modifying an input ”10” to ”1a” would produce a parsing error since an integer number is expected. Additionally, DISC applications include distributed performance bottlenecks such as data shuffling that is dependent on the characteristics of the entire dataset and may be difficult or impossible to trigger with only record-level mutations. Designing mutations to detect performance skews in DISC applications requires that (1) mutations must ensure type-correctness, and (2) mutations should be able to manipulate input datasets in ways that comprehensively exercise the performance-sensitive aspects of distributed applications. For example, mutations should shuffle or redistribute data.
For example, PerfGen targets data skew symptoms by defining mutations that alter the distribution of keys and values in tuple inputs, as well as mutations that extend the length of collection-based fields (which might be flattened into multiple records and contribute to data skew later in the application). PerfGen’s mutations alter specific values or elements in tuple and collection datasets. AppendSameKey mutation (M13 in Table III) targets data skew by appending new records for a pre-existing key.
III-D Phased Fuzzing
PerfGen’s phased fuzzing technique generates intermediate inputs to a given UDF and produces improved seeds for fuzzing the entire program, sketched in Figure 8.
Step 1. UDF Fuzzing. PerfGen generates an initial UDF input by partially executing the original program. Using this intermediate result as a seed, it then fuzzes the target UDF using the procedure outlined in Figure 8. The process is illustrated in Figure 6 label 4 with concrete inputs from the motivating example. Two nontrivial outcomes exist for each fuzzing loop iteration: (1) the monitor template detects that the desired symptom is triggered and terminates the fuzzing loop or (2) the monitor template does not detect skew but returns a feedback score that is better than previously observed, so PerfGen adds saves the mutated input, updates the best observed feedback score, and resumes fuzzing with the updated input queue.
Step 2. Pseudo-Inverse Function generation with the Large Language Model. While targeted UDF fuzzing enables PerfGen to generate symptom-triggering intermediate inputs, the final objective is to identify inputs to the entire program. PerfGen uses a pseudo-inverse function to convert intermediate UDF inputs to improved seeds. Such pseudo-inverse function does not need to be an exact inverse function as its goal is to bootstrap seed input generation. Collatz pseudo-inverse function is shown in Figure 4.
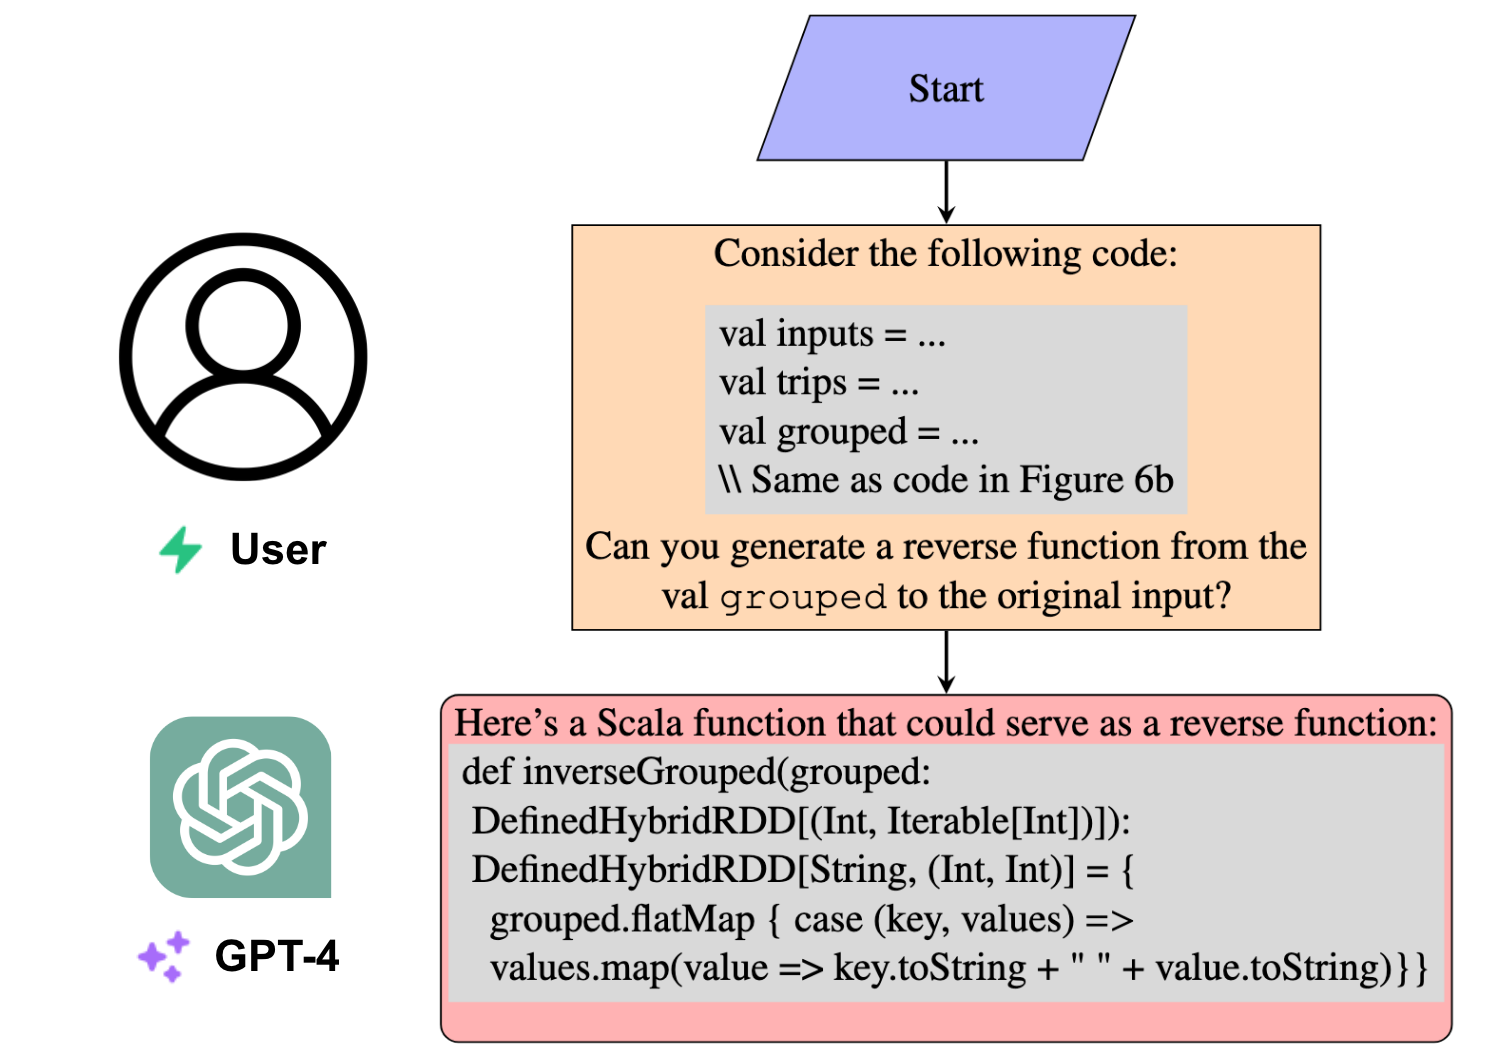
As illustrated in Figure 9, a pseudo-inverse function can be generated by a large language model such as GPT-4. For example, PerfGen prompts the GPT-4 model to generate an inverse function by submitting the source code of Collatz; the request could be framed as, “Could you generate an inverse function that transitions from the RDD grouped to the original input? There is no need to provide the precise reverse function, just try your best.” In response, the AI model will strive to deliver an appropriate inverse function.
Take, for instance, a dataset comprising student grades with an aggregation that computes the mean grade per course. Given an intermediate dataset displaying courses and their average grades, GPT-4 ynthesizes a pseudo-inverse function that outputs a single student grade per course, rounded to the nearest integer equivalent of the average grade. While such a function can only approximate average grades and consequently may not precisely replicate the provided intermediate inputs, the function can still facilitate the production of enhanced seeds.
A pseudo-inverse functions for the portion of a program that precedes the target User Defined Function (UDF), is independent of the target UDF implementation. For example, Figure 4 for the Collatz program in Figure 2 excludes the target UDF solve_collatz. Additionally, a pseudo-inverse function remains unaffected by target symptoms. Therefore, it is external to PerfGen’s phased fuzzing process and in most cases, is simple enough for a large language model to automatically generate an accurate version. In our evaluation, pseudo-inverse functions averaged 6 lines of code.
Step 3. End-to-End Fuzzing with Improved Seeds. As a final step, PerfGen tests the pseudo-inverse function result to see if it is a symptom-triggering input. If not, it uses the derived program input as an improved seed for fuzzing the entire application as shown in Figure 6 label 5. This step resembles UDF fuzzing (Figure 8) and reuses the same monitor template, but initializes with the pseudo-inverse function output as a seed and utilizes a different set of mutations suitable for the entire program’s input data type. PerfGen achieves at least 11x speedup compared to a traditional fuzzing approach when generating inputs to trigger performance symptoms in our case studies.
IV Evaluation
We evaluate PerfGen with the following research questions:
- RQ1
-
How much speedup in total execution time can PerfGen achieve by phased fuzzing?
- RQ2
-
How much reduction in the number of fuzzing iterations does PerfGen provide through improved seeds derived from phased fuzzing?
- RQ3
-
How much improvement in speedup is gained by PerfGen’s adjustment of mutation sampling probabilities based on the target symptom?
RQ1 assesses overall time savings in using PerfGen, while RQ2 measures the reduction in the number of required fuzzing iterations. RQ3 explores the effects of mutation sampling probabilities on test input generation time.
Evaluation Setup. As a baseline, we compare against a simplified version of PerfGen that does not apply phased fuzzing. This is because existing dataflow application fuzzers such as BigFuzz [54] are unable to detect performance symptoms or monitor underlying performance characteristics of Spark programs. The baseline configuration fuzzes the original program with the same monitor template but invokes the entire program with the initial seed input. Similar to the PerfGen setup, the baseline fuzzes the program until a skew-inducing input is identified. As pseudo-inverse functions are not tied to a specific symptom and can be potentially reused, we do not include their derivation times in our results; in practice, we found that each pseudo-inverse function definition required no more than five minutes to implement.
Each evaluation is run for up to four hours, using Spark 2.4.4’s local execution mode on a single machine with 16GB RAM and 2.6 GHz 6-core Intel Core i7 processor.
IV-A Case Study: Collatz Conjecture
The Collatz case study is based on the description in Section II. It parses a dataset of space-separated integers and applies a Collatz-sequence-based mathematical function to each integer. This case study’s symptom definition differs from that in Section II, while other details including pseudo-inverse function and generated datasets remain the same.
The developer is interested in inputs that will exhibit severe computation skew in which one outlier partition takes more than 100 times longer to compute than others due to the solve_collatz function. As this function is called in the transformation that produces solved variable, they specify solved as function of interest for PerfGen’s phased fuzzing. The developer defines their performance symptom by using the Runtime metric with an IQROutlier monitor template, specifying a target threshold of 100.0.
Based on Section III-C, PerfGen produces the following mutations and weights for solved variable and specified skew symptom:
| M10 + M7 + M1 | 1.0 | 11.1% |
| M10 + M7 + M5 + M1 | 5.0 | 55.5% |
| M10 + M7 + M6 | 1.0 | 11.1% |
| M11 | 0.5 | 5.6% |
| M12 | 0.5 | 5.6% |
| M14 | 1.0 | 11.1% |
PerfGen begins to generate test inputs and produces the datasets shown in Figure 6. Its UDF fuzzing phase requires 3 iterations and 41 seconds. Its end-to-end fuzzing phase requires no iterations after the pseudo-inverse function is applied, as improved seeds immediately trigger the symptom of interest.
For comparison, we also evaluate the Collatz program under our baseline configuration and it produces a symptom-triggering input after 12,166 iterations and 15.6 min by changing the ”4” record to ”338”, which has a Collatz length of 50.
Collatz evaluation results are summarized in Table IV, with the progress of IQROutlier feedback scores plotted in Figure 11. Compared to the baseline, PerfGen’s approach produces a 11.17X speedup and requires 0.008% of the program fuzzing iterations. Additionally, PerfGen spends 49.14% of its total input generation time on the UDF fuzzing process. While both configurations can successfully generate inputs that trigger the performance symptom of interest, PerfGen can do more efficiently because its type knowledge allows it to focus on generating integer inputs. The baseline is restricted to string-based mutations which often fail the integer parsing process.
IV-B Case Study: WordCount
Suppose a developer is interested in the WordCount program from [49] . WordCount reads a dataset of Strings and counts how often each space-separated word appears in the dataset. As a starting input dataset, the developer uses a 5MB sample of Wikipedia entries consisting of 49,930 records across 20 partitions.
The developer wants to generate an input for which the number of shuffle records written per partition exhibits a statistical skew value of more than 2. They identify the RDD corresponding to summation operation (implemented by reduceByKey(_+_)) counts variable on line 4 in Figure 10 as the UDF of interest because it induces a data shuffle, and define the desired symptom by using the Shuffle Write Records metric in combination with a Skewness monitor template with a threshold of 2.0.
The target UDF takes as input tuples of the type (String, Integer). Expecting a large number of intermediate records, the developer chooses to configure PerfGen to use a decreased duplication factor of 0.01. As the integer values are fixed to , the developer also disables mutations which modify values in the UDF inputs. In addition to these configurations, PerfGen uses the data skew symptom to produce the following mutations and adjusts their sampling weights to bias towards producing data skew:
| M10 + M7 + M4 | 1.0 | 14.3% |
| M12 | 1.0 | 14.3% |
| M14(duplicationFactor = 0.01) | 5.0 | 71.4% |
Finally, PERFGEN generates a suitable pseudo-inverse function with GPT-4. As there is no way to reliably reconstruct the original strings from the tokenized words, the large language model implements a simple function that constructs input lines from consecutive groups of up to 50 words. ⬇ 1def inverse(udfInput: RDD[(String, Int)]): RDD[String] 2 = {val words = udfInput.map(_._1) 3 words.mapPartitions(wordIter => 4 wordIter.grouped(50).map(_.mkString(" ")))}
PerfGen executes WordCount with the provided input dataset up until the target UDF generates a UDF input seed consisting of each word paired with a ”1”. It then applies mutations to this input until it generates a symptom-triggering UDF input after 37s and 357 iterations. Next, PerfGen applies the pseudo-inverse function to the input from UDF Fuzzing to produce an input for the full WordCount program. It then tests this input and finds that the symptom is triggered, so no additional program fuzzing iterations are required.
For comparison, we evaluate WordCount under the baseline configurations specified earlier in Section IV, using the same sample of Wikipedia data. The baseline times out after approximately 4 hours and 46,884 iterations without producing any inputs that trigger the target symptom.
Table IV summarizes the WordCount evaluation results, and Figure 11 visualizes the progress of the maximum attained skewness statistics determined by the Skewness monitor template. Compared to the baseline which is unable to produce results after 4 hours, PerfGen produces a speedup of at least 37.43X while requiring at most 0.0002% of the program fuzzing iterations. 98.48% of PerfGen’s total execution time is spent on UDF fuzzing.
While PerfGen is able to meet the target skewness threshold of 2.0, the baseline times out while never exceeding a skewnesss of 0.7. This gap in skewness comes from the baseline’s inability to produce large quantities of new words which directly contribute to the number of shuffle records written by Spark. Meanwhile, PerfGen’s M14 mutation produces many distinct words in each iteration, and thus enables PerfGen to quickly trigger the target symptom.
| Program | UDF Fuzzing | Program Fuzzing | PerfGen Total | Baseline | PerfGen vs. Baseline | |||||||
|
Seed Init.
(ms) |
Duration
(ms) |
# Iter. |
P-Inv.
Func. Appl. (ms) |
Duration
(ms) |
# Iter. |
Duration
(ms) |
Duration
(ms) |
# Iter. | Speedup |
Iter. %
Program Fuzzing |
Time %
Phased Fuzzing |
|
| Collatz | 1,259 | 41,221 | 3 | 310 | 41,095 | 1 | 83,888 | 937,071 | 12,166 | 11.17 | 0.008% | 49.14% |
| WordCount* | 4,299 | 378,946 | 357 | 986 | 544 | 1 | 384,778 | 14,401,990 | 46,884 | 37.43 | 0.002% | 98.48% |
| StockBuyAndSell* | 1,450 | 205,084 | 4,775 | 601 | 208 | 1 | 207,346 | 14,402,428 | 40,010 | 69.46 | 0.002% | 98.91% |
| DeptGPAsMedian_courseGpas* | 2,282 | 259,205 | 1,519 | 736 | 638 | 1 | 262,864 | 14,405,503 | 21,575 | 54.80 | 0.005% | 98.61% |
| DeptGPAsMedian_courseGpaAvgs* | 2,616 | 251,612 | 1,306 | 636 | 638 | 1 | 255,502 | 14,405,503 | 21,575 | 56.38 | 0.005% | 98.23% |
| DeptGPAsMedian_deptGpas* | 1,707 | 271,538 | 2,306 | 107 | 638 | 1 | 273,990 | 14,405,503 | 21,575 | 52.57 | 0.005% | 98.09% |
| DeptGPAsMedian_median* | 881 | 292,555 | 1,387 | 852 | 638 | 1 | 294,926 | 14,405,503 | 21,575 | 49.02 | 0.005% | 97.96% |
IV-C Case Study: StockBuyAndSell
Suppose a developer is interested in the StockBuyAndSell program, which is based on the LeetCode problem [7]. Using a dataset of comma-separated strings in the form ”Symbol,Date,Open,High,Low,Close,Volume,OpenInt”, the StockBuyAndSell calculates each stock’s maximum achievable profit with at most three transactions (using a dynamic programming implementation adapted from [8]) by grouping closing prices by stock symbol and sorting within each symbol. As an initial dataset, the developer samples 1% of the 20 largest stock symbols from a Kaggle dataset [32]. The dataset consists of 2,389 records across 20 partitions.
The developer wishes to generate an input that triggers a symptom where one partition increases the maximum observed profit of the dynamic programming loop at least five times more frequently than other partitions. For the target UDF, they specify the RDD variable that is produced from the transformation in which this loop occurs. The developer may use Spark’s Accumulator API [5] to count the number of branch executions to model an increase of the maximum observed profit for each partition. This metric is then passed to a NextComparison monitor template with a ratio of 5.0.
The target UDF takes (String, Iterable[Double]) tuples as input. The developer uses their knowledge of the StockBuyAndSell program to disable key-based mutations for these inputs, as well as impose a restriction that UDF input keys must be unique due to an earlier aggregation. As a result, PerfGen produces the following two mutations: M10 + M7 + M5 + M2 and M10 + M7 + M6.
Finally, PerfGen generates a pseudo-inverse function with GPT-4. The generated function first assigns a chronological date to each price within a stock group. Next, it populates arbitrary values for unused program input fields. Lastly, it joins all values into the comma-separated string format required by StockBuyAndSell.
PerfGen starts generating test inputs by first partially executing StockBuyAndSell on the provided input dataset to produce a UDF input consisting of stock symbols and their chronologically ordered prices. It then applies mutations to this intermediate input and, after 3.4 mins and 4,775 iterations, produces an input which satisfies the monitor template. The result is produced from a M5 which directly affects the developer’s custom metric by modifying individual values in the grouped stock prices.
Next, PerfGen applies the pseudo-inverse function to the UDF input, tests the resulting StockBuyAndSell input, and finds that it also triggers the symptom of interest. As a result, no additional fuzzing iterations are necessary.
For comparison, we evaluate the StockBuyAndSell program using the initially provided input dataset and the baseline configuration discussed at the start of Section IV. After approximately 4 hours and 40,010 iterations, no inputs trigger the symptom of interest.
StockBuyAndSell evaluation results are summarized in Table IV, with the progress of the best observed NextComparison ratios plotted in Figure 11. Compared to the baseline which times out after four hours, PerfGen leads to at least 69.46X speedup and requires at most 0.002% of the program fuzzing iterations. Additionally, 98.91% of PerfGen’s execution time is spent on UDF fuzzing alone.
While PerfGen is able to trigger the performance symptom of interest–a Next Comparison ratio greater than 5.0, the baseline only reaches a ratio of approximately 2.5, indicating a substantial gap in the two approaches’ effectiveness. This is because the baseline is unable to handle fields that are unused or parsed into numbers, nor is it able to significantly affect the distribution of data across each key. In contrast, PerfGen overcomes these challenges through its phased fuzzing and tailored mutations.
IV-D Case Study: DeptGPAsMedian
Consider a scenario in which a developer is examining the DeptGPAsMedian program (as depicted in Figure 12), which is a modified version from [45]. This program operates on a string dataset structured in the format ”studentID,courseID,grade”, and initially computes the average GPA for each course. It then groups these average GPAs based on the department associated with each course and calculates the median average course GPA for each department. In order to scrutinize this program, the developer generates a 40-partition dataset encompassing 5,000 records per partition, thereby amassing a total of 2.8MB data. This dataset comprises five departments, each offering 20 courses, and encompasses 200 distinct students.
In the absence of a specified target stage (as indicated in the preceding three examples), PerfGen targets phase fuzzing at each stage. To better quantify the data skew symptom of interest, the developer seeks to generate a dataset in which a single post-aggregation partition reads a minimum of 100 times the number of shuffle records compared to the other partitions. Leveraging PerfGen, the developer outlines their symptom using the Shuffle Read Records metric and a NextComparison monitor template configured with a target ratio of 100.0. Anticipating small intermediate partitions (with 100-course averages spread across 40 partitions), they adjust PerfGen to use an elevated duplication factor of 5, thereby inducing data skew associated with the Shuffle Read Records metric. Analogous to the earlier example, PerfGen computes relevant mutations and sampling weights, giving data skew-oriented mutations larger weights and, consequently, increased sampling probabilities.
Finally, PerfGen leverages the large language model GPT-4 to generate pseudo-inverse functions that map each stage back to the original input. This is accomplished by prompting the question, “Could you produce inverse functions that transition from val courseGrades/courseGpaAvgs/deptGpas/median to the initial input?” It takes less than 20 seconds and 1 query to get answers for each pseudo-inverse function. The average LoC of pseudo-inverse functions is 6.
For instance, consider the stage val courseGrades. The pseudo-inverse function generated for this stage is as follows:
This pseudo-inverse function generates the original input from the intermediate data ”(courseID, average grades)” to the original input, which is a string in the format ”studentID,courseID,grade” For example, applying this pseudo-inverse function on an RDD containing a single intermediate (UDF) record of (”EE”, 80.7) produces an RDD containing a single DeptGPAsMedian input record of ”42,EE,80”. Running the DeptGPAsMedian program with this input produces an intermediate RDD of a single record, (”EE”, 80.0), which differs from (”EE”, 80.7). Nonetheless, the output of the pseudo-inverse function (i.e., the generated DeptGPAsMedian input RDD) is still a valid, improved seed to the DeptGPAsMedian program.
PerfGen starts generating test inputs by partially executing DeptGPAsMedian on the provided input data to derive UDF inputs consisting of each course’s department name paired with the course’s average grade. It then applies mutations to generate new intermediate inputs and tests them to see if they trigger the target data skew symptom. After 4.3 minutes and 1,519 iterations, PerfGen produces an input by using a M13 mutation which significantly increases the frequency of UDF inputs associated with the ”EE” department. Next, it applies the pseudo-inverse function to this intermediate UDF result to produce a DeptGPAsMedian input which contains thousands of unique courses in the ”EE” department. It then tests this input with the full DeptGPAsMedian program and finds that the target symptom is triggered with no additional modifications.
For comparison, we evaluate DeptGPAsMedian using the same initial dataset and the baseline configuration specified earlier at the start of Section IV. Under these settings, the baseline is unable to generate any symptom-triggering inputs after approximately 4 hours and 21,575 iterations.
The DeptGPAsMedian case study results are summarized in Table IV, and the progress of the best observed NextComparison ratios are displayed in Figure 11. Using PerfGen over the baseline configuration produces at least 54.80X speedup while requiring at most 0.005% of the program fuzzing iterations.PerfGen’s UDF fuzzing process comprises 98.61% of its total execution time.
While PerfGen is able to trigger the performance symptom of interest–Next Comparison ratio greater than 100.0. On the other hand, the baseline is unable to reach even 7% of this threshold. This gap in performance can be attributed to baseline’s inability to target data skew symptoms. On the other hand, PerfGen can precisely target the appropriate stage in the Spark program through its use of UDF fuzzing, and is able to leverage skew-oriented mutations to modify the underlying data distribution, causing data skew.
IV-E Improvement in RQ1 and RQ2
Table IV presents each case study’s evaluation results, and Figure 11 shows each case study’s progress over time. Averaged across all four case studies,333As three of the four case study baselines timed out after four hours, numbers are reported as bounds. PerfGen leads to a speedup of at least 43X while requiring no more than 0.004% of the program fuzzing iterations required by the baseline. Additionally, PerfGen’s UDF fuzzing process accounts for an average 86.28% of its total execution time.
IV-F RQ3: Effect of Mutation Weights
Using the DeptGPAsMedian program, we experiment with the mutation sampling probabilities to evaluate their impact on PerfGen’s ability to generate symptom-triggering inputs. We reuse the same program, monitor template, and performance metric as in the case study (Section IV-D), but vary the weight of the M13 and M14 mutations. As discussed in section III-C, mutation sampling probabilities are determined by weighted random sampling. In addition to the original weight of 5.0 in the case study, we also experiment with weights of 0.1, 0.5, 1.0, 2.5, 7.5, and 10.0 which result in individual mutation probabilities ranging from 2.44% to 71.43%. For each value, we average over 5 executions and report the total time required for PerfGen to generate an input that triggers the original DeptGPAsMedian symptom.
Execution times for each sampling weight are plotted in Figure 13. We find that PerfGen’s template-dependent weight of 5.0 leads to a speedup of 1.81X compared to a configuration in which no extra weight is assigned (i.e., uniform weights of 1.0). More generally, we also observe that the total time required to generate a satisfying input appears to be inversely proportional to the weights of the aforementioned mutations.
In total, the range of execution times for each of the evaluated sampling weights ranged between 23.32% and 564.74% of the time taken for an unweighted evaluation. Compared to an unweighted scenario, reducing the same weights to 0.5 and 0.1 resulted in 123.97% and 464.74% increases in total time.
V Related Work
Performance Analysis of Big Data Systems. Today, big data analytics applications are always composed of both UDF and dataflow operators. Performance analysis has been a long challenge in big data systems [52, 22, 34, 47]. Ernest [47], ARIA [48], and Jockey [17] model job performance by observing system and job characteristics. Starfish [23] constructs performance models and proposes system configurations that either meet the budget or deadline requirements. DAC [52] is a data-size aware auto-tuning approach to efficiently identify the high dimensional configuration for a given Apache Spark program to achieve optimal performance on a given cluster. It builds the performance model based on both the size of input dataset and Spark configuration parameters. Cheng et al. [14] incorporate up to 180 Spark configuration parameters to predict Spark application performance for a given application and dataset size. They do so by training Adaboost ensemble learning models to predict performance at each stage, while minimizing required training data through a data mining technique known as projective sampling.
Kwon et al. present a survey of various sources of performance skew and identify different kinds of data skews [24]. Several works aim to mitigate the performance impacts of data skew by proposing automatic skew mitigation approaches that leverage techniques such as data redistribution and adaptive repartitioning [25, 13, 31, 10, 44, 29]. Mishra et al. [33] conduct a survey of Hadoop-based data skewness mitigation techniques and categorize them based on each technique’s support for map-side and reduce-side data skew.
All these performance analysis techniques assume that benchmarks provide insights about workload characteristics and performance depends on data size and cluster configurations. However, many ignore the fact that performance is often also dependent on input content. They do not auto-generate inputs to trigger performance skews. In contrast, PerfGen automatically generates such performance workload to reproduce a desired performance symptom.
Test Generation for DISC Applications. State of the art test generation techniques for DISC applications fall into two main categories: symbolic-execution based approaches [21, 27, 36] and fuzzing-based approaches [54]. Gulzar et al. model the semantics of these operators in first-order logical specifications alongside with the symbolic representation of UDFs [21] and generate a test suite to reveal faults. Prior DISC testing approaches either do not model the UDF or only model the specifications of dataflow operators partially [27, 36]. Li et al. propose a combinatorial testing approach to bound the scope of possible input combinations [28]. All these symbolic execution approaches generate path constraints up to a given depth and are thus ineffective in generating test inputs that can lead to deep execution and trigger performance skews. To reduce fuzz testing time for dataflow-based big data applications, BigFuzz [54] rewrites dataflow APIS with executable specifications; however, its guidance metric concerns branch coverage only and thus cannot detect performance skews. Additionally, there is no guarantee that the rewritten program preserves the original DISC application’s performance behaviors.
Fuzz Testing for Performance. Fuzzing has gained popularity in both academia and industry due to its black/grey box approach with a low barrier to entry [53]. For example, AFL mutates a seed input to discover previously unseen branch coverage [53]. Instead of using fuzzing for code coverage, several techniques have investigated how to adapt fuzzing for performance testing. PMFuzz [30] generates test cases to test the crash consistency guarantee of programs designed for persistent memory systems. It monitors the statistics of PM paths that consist of program statements with PM operations. PerfFuzz [26] uses the execution counts of exercised instructions as fuzzing guidance to explore pathological performance behavior. MemLock [50] employs both coverage and memory consumption metrics to guide fuzzing; however, it does not leverage a phased fuzzing approach to expedite fuzzing time and is limited to uncontrolled memory consumption bugs only.
Unlike these works, PerfGen tackles the performance testing challenge of DISC applications. It leverages a phased fuzzing approach to expedite the test generation process, uses performance skew symptoms as a fuzzing objective, and generates inputs to replicate these symptoms through custom performance monitoring and skew-inspired mutations.
Program Synthesis for Data Transformation. Inductive program synthesis [20] learns a program (i.e., a procedure) from incomplete specifications such as input and output examples. FlashProfile [39] adapts this approach to the data domain, presents a novel domain-specific language (DSL) for patterns, defines a specification over a given set of strings, and learns a syntactic pattern automatically. PADS [18] provides a data description language allowing users to describe their ad-hoc data for various fields in the data and their corresponding type. The data description is then generated automatically by an inference algorithm. Oncina et al. [37] propose a new algorithm that learns a DFA compatible with a given sample of positive and negative examples. However, a key limitation of prior work is that such data transformation synthesis is not used to speed up fuzz testing. PerfGen addresses this gap and is the first to employ OpenAI’s ChatGPT [38] to generate a pseudo inverse function to produce improved seeds to be used in the beginning of the program and thus reduce the overall fuzz testing time. This approach not only integrates program synthesis with test input generation but also utilizes the power of advanced large language models, providing a more robust and effective solution for data transformation tasks.
VI Conclusion
This paper presents PerfGen, a tool that automatically generates inputs for reproducing a desired performance symptom in a DISC application. PerfGen’s novel phased fuzzing approach addresses the challenge of latency reduction, symptom-specific performance feedback monitoring, and skew-inspired mutations. PerfGen marks the first instance of a tool leveraging a large language model to enhance performance testing, achieved by generating pseudo-inverse functions. Our evaluation shows that PerfGen achieves an average speedup of at least 43X compared to traditional fuzzing approaches when generating workloads that exhibit specified performance skew symptoms. Furthermore, it does so while requiring at most 0.004% of the fuzzing iterations when phased fuzzing is disabled. Finally, our evaluation explores the impact of mutation sampling probabilities on input generation efficiency and finds that PerfGen’s template-inspired mutation probabilities produce a 1.81X speedup in input generation time compared to a uniform sampling approach.
References
- [1] Hadoop. http://hadoop.apache.org/.
- [2] Interquartile_range. https://en.wikipedia.org/wiki/Interquartile\_range.
- [3] Modified z-score. https://www.ibm.com/docs/en/cognos-analytics/11.1.0?topic=terms-modified-z-score.
- [4] Skewness. https://en.wikipedia.org/wiki/Skewness.
- [5] Spark documentation. http://spark.apache.org/docs/1.2.1/.
- [6] Z-score. https://en.wikipedia.org/wiki/Standard\_score.
- [7] https://leetcode.com/problems/best-time-to-buy-and-sell-stock-iii/, 2022.
- [8] https://leetcode.com/problems/best-time-to-buy-and-sell-stock-iii/discuss/39608/A-clean-DP-solution-which-generalizes-to-k-transactions, 2022.
- [9] Domagoj Babić, Stefan Bucur, Yaohui Chen, Franjo Ivančić, Tim King, Markus Kusano, Caroline Lemieux, László Szekeres, and Wei Wang. Fudge: Fuzz driver generation at scale. In Proceedings of the 2019 27th ACM Joint Meeting on European Software Engineering Conference and Symposium on the Foundations of Software Engineering, ESEC/FSE 2019, page 975–985, New York, NY, USA, 2019. Association for Computing Machinery.
- [10] Laurent Bindschaedler, Jasmina Malicevic, Nicolas Schiper, Ashvin Goel, and Willy Zwaenepoel. Rock you like a hurricane: Taming skew in large scale analytics. In Proceedings of the Thirteenth EuroSys Conference, EuroSys ’18, New York, NY, USA, 2018. Association for Computing Machinery.
- [11] Stephen M. Blackburn, Perry Cheng, and Kathryn S. McKinley. Myths and realities: The performance impact of garbage collection. SIGMETRICS Perform. Eval. Rev., 32(1):25–36, June 2004.
- [12] Tegan Brennan, Seemanta Saha, and Tevfik Bultan. Jvm fuzzing for jit-induced side-channel detection. In Proceedings of the ACM/IEEE 42nd International Conference on Software Engineering, ICSE ’20, page 1011–1023, New York, NY, USA, 2020. Association for Computing Machinery.
- [13] Qi Chen, Jinyu Yao, and Zhen Xiao. Libra: Lightweight data skew mitigation in mapreduce. IEEE Transactions on parallel and distributed systems, 26(9):2520–2533, 2014.
- [14] Guoli Cheng, Shi Ying, Bingming Wang, and Yuhang Li. Efficient performance prediction for apache spark. Journal of Parallel and Distributed Computing, 149:40–51, 2021.
- [15] Joeri De Ruiter and Erik Poll. Protocol state fuzzing of tls implementations. In Proceedings of the 24th USENIX Conference on Security Symposium, SEC’15, page 193–206, USA, 2015. USENIX Association.
- [16] Jeffrey Dean and Sanjay Ghemawat. Mapreduce: Simplified data processing on large clusters. Commun. ACM, 51(1):107–113, January 2008.
- [17] Andrew D. Ferguson, Peter Bodik, Srikanth Kandula, Eric Boutin, and Rodrigo Fonseca. Jockey: Guaranteed job latency in data parallel clusters. In Proceedings of the 7th ACM European Conference on Computer Systems, EuroSys ’12, pages 99–112, New York, NY, USA, 2012. ACM.
- [18] Kathleen Fisher and David Walker. The pads project: An overview. In Proceedings of the 14th International Conference on Database Theory, ICDT ’11, pages 11–17, New York, NY, USA, 2011. ACM.
- [19] S. Gan, C. Zhang, X. Qin, X. Tu, K. Li, Z. Pei, and Z. Chen. Collafl: Path sensitive fuzzing. In 2018 IEEE Symposium on Security and Privacy (SP), pages 679–696, 2018.
- [20] Sumit Gulwani. Dimensions in program synthesis. In Proceedings of the 12th International ACM SIGPLAN Symposium on Principles and Practice of Declarative Programming, PPDP ’10, page 13–24, New York, NY, USA, 2010. Association for Computing Machinery.
- [21] Muhammad Ali Gulzar, Madanlal Musuvathi, and Miryung Kim. Bigtest: A symbolic execution based systematic test generation tool for apache spark. In Proceedings of the ACM/IEEE 42nd International Conference on Software Engineering: Companion Proceedings, ICSE ’20, page 61–64, New York, NY, USA, 2020. Association for Computing Machinery.
- [22] Carson Hanel, Arif Arman, Di Xiao, John Keech, and Dmitri Loguinov. Vortex: Extreme-performance memory abstractions for data-intensive streaming applications. In Proceedings of the Twenty-Fifth International Conference on Architectural Support for Programming Languages and Operating Systems, pages 623–638, 2020.
- [23] Herodotos Herodotou, Harold Lim, Gang Luo, Nedyalko Borisov, Liang Dong, Fatma Bilgen Cetin, and Shivnath Babu. Starfish: A self-tuning system for big data analytics. In In CIDR, pages 261–272, 2011.
- [24] YongChul Kwon, Magdalena Balazinska, Bill Howe, and Jerome Rolia. A study of skew in mapreduce applications. Open Cirrus Summit 11, 2011.
- [25] YongChul Kwon, Magdalena Balazinska, Bill Howe, and Jerome Rolia. Skewtune: Mitigating skew in mapreduce applications. In Proceedings of the 2012 ACM SIGMOD International Conference on Management of Data, SIGMOD ’12, pages 25–36, New York, NY, USA, 2012. ACM.
- [26] Caroline Lemieux, Rohan Padhye, Koushik Sen, and Dawn Song. Perffuzz: Automatically generating pathological inputs. In Proceedings of the 27th ACM SIGSOFT International Symposium on Software Testing and Analysis, pages 254–265. ACM, 2018.
- [27] Kaituo Li, Christoph Reichenbach, Yannis Smaragdakis, Yanlei Diao, and Christoph Csallner. Sedge: Symbolic example data generation for dataflow programs. In Automated Software Engineering (ASE), 2013 IEEE/ACM 28th International Conference on, pages 235–245. IEEE, 2013.
- [28] Nan Li, Yu Lei, Haider Riaz Khan, Jingshu Liu, and Yun Guo. Applying combinatorial test data generation to big data applications. In Proceedings of the 31st IEEE/ACM International Conference on Automated Software Engineering, ASE 2016, page 637–647, New York, NY, USA, 2016. Association for Computing Machinery.
- [29] Guipeng Liu, Xiaomin Zhu, Ji Wang, Deke Guo, Weidong Bao, and Hui Guo. Sp-partitioner: A novel partition method to handle intermediate data skew in spark streaming. Future Generation Computer Systems, 86:1054–1063, 2018.
- [30] Sihang Liu, Suyash Mahar, Baishakhi Ray, and Samira Khan. Pmfuzz: test case generation for persistent memory programs. In Proceedings of the 26th ACM International Conference on Architectural Support for Programming Languages and Operating Systems, pages 487–502, 2021.
- [31] Zhihong Liu, Qi Zhang, Mohamed Faten Zhani, Raouf Boutaba, Yaping Liu, and Zhenghu Gong. Dreams: Dynamic resource allocation for mapreduce with data skew. In 2015 IFIP/IEEE International Symposium on Integrated Network Management (IM), pages 18–26. IEEE, 2015.
- [32] Boris Marjanovic. Huge stock market dataset — kaggle, 11 2017.
- [33] Subhankar Mishra, Namita Sethi, and Ayes Chinmay. Various data skewness methods in the hadoop environment. In 2019 International Conference on Recent Advances in Energy-efficient Computing and Communication (ICRAECC), pages 1–4, 2019.
- [34] Khanh Nguyen, Lu Fang, Christian Navasca, Guoqing Xu, Brian Demsky, and Shan Lu. Skyway: Connecting managed heaps in distributed big data systems. ACM SIGPLAN Notices, 53(2):56–69, 2018.
- [35] Yannic Noller, Rody Kersten, and Corina S. Păsăreanu. Badger: Complexity analysis with fuzzing and symbolic execution. In Proceedings of the 27th ACM SIGSOFT International Symposium on Software Testing and Analysis, ISSTA 2018, page 322–332, New York, NY, USA, 2018. Association for Computing Machinery.
- [36] Christopher Olston, Shubham Chopra, and Utkarsh Srivastava. Generating example data for dataflow programs. In Proceedings of the 2009 ACM SIGMOD International Conference on Management of Data, SIGMOD ’09, pages 245–256, New York, NY, USA, 2009. ACM.
- [37] Jose Oncina and Pedro Garcia. Identifying regular languages in polynomial time. In ADVANCES IN STRUCTURAL AND SYNTACTIC PATTERN RECOGNITION, VOLUME 5 OF SERIES IN MACHINE PERCEPTION AND ARTIFICIAL INTELLIGENCE, pages 99–108. World Scientific, 1992.
- [38] OpenAI. Gpt-4 technical report, 2023.
- [39] Saswat Padhi, Prateek Jain, Daniel Perelman, Oleksandr Polozov, Sumit Gulwani, and Todd D Millstein. Flashprofile: Interactive synthesis of syntactic profiles. CoRR, 2017.
- [40] Rohan Padhye, Caroline Lemieux, and Koushik Sen. Jqf: Coverage-guided property-based testing in java. In Proceedings of the 28th ACM SIGSOFT International Symposium on Software Testing and Analysis, ISSTA 2019, page 398–401, New York, NY, USA, 2019. Association for Computing Machinery.
- [41] Rohan Padhye, Caroline Lemieux, Koushik Sen, Mike Papadakis, and Yves Le Traon. Semantic fuzzing with Zest. In Proceedings of the 28th ACM SIGSOFT International Symposium on Software Testing and Analysis, ISSTA 2019, page 329–340, New York, NY, USA, 2019. Association for Computing Machinery.
- [42] Theofilos Petsios, Jason Zhao, Angelos D. Keromytis, and Suman Jana. Slowfuzz: Automated domain-independent detection of algorithmic complexity vulnerabilities. In Proceedings of the 2017 ACM SIGSAC Conference on Computer and Communications Security, CCS ’17, page 2155–2168, New York, NY, USA, 2017. Association for Computing Machinery.
- [43] Juraj Somorovsky. Systematic fuzzing and testing of tls libraries. In Proceedings of the 2016 ACM SIGSAC Conference on Computer and Communications Security, CCS ’16, page 1492–1504, New York, NY, USA, 2016. Association for Computing Machinery.
- [44] Zhuo Tang, Wei Lv, Kenli Li, and Keqin Li. An intermediate data partition algorithm for skew mitigation in spark computing environment. IEEE Transactions on Cloud Computing, 9(2):461–474, 2021.
- [45] Jason Teoh, Muhammad Ali Gulzar, and Miryung Kim. Influence-based provenance for dataflow applications with taint propagation. In Proceedings of the 11th ACM Symposium on Cloud Computing, SoCC ’20, page 372–386, New York, NY, USA, 2020. Association for Computing Machinery.
- [46] Jason Teoh, Muhammad Ali Gulzar, Guoqing Harry Xu, and Miryung Kim. Perfdebug: Performance debugging of computation skew in dataflow systems. In Proceedings of the ACM Symposium on Cloud Computing, SoCC ’19, page 465–476, New York, NY, USA, 2019. Association for Computing Machinery.
- [47] Shivaram Venkataraman, Zongheng Yang, Michael Franklin, Benjamin Recht, and Ion Stoica. Ernest: Efficient performance prediction for large-scale advanced analytics. In Proceedings of the 13th Usenix Conference on Networked Systems Design and Implementation, NSDI’16, pages 363–378, Berkeley, CA, USA, 2016. USENIX Association.
- [48] Abhishek Verma, Ludmila Cherkasova, and Roy H. Campbell. Aria: Automatic resource inference and allocation for mapreduce environments. In Proceedings of the 8th ACM International Conference on Autonomic Computing, ICAC ’11, pages 235–244, New York, NY, USA, 2011. ACM.
- [49] Lei Wang, Jianfeng Zhan, Chunjie Luo, Yuqing Zhu, Qiang Yang, Yongqiang He, Wanling Gao, Zhen Jia, Yingjie Shi, Shujie Zhang, Chen Zheng, Gang Lu, Kent Zhan, Xiaona Li, and Bizhu Qiu. Bigdatabench: A big data benchmark suite from internet services. In 2014 IEEE 20th International Symposium on High Performance Computer Architecture (HPCA), pages 488–499, 2014.
- [50] Cheng Wen, Haijun Wang, Yuekang Li, Shengchao Qin, Yichang Liu, Zhiwu Xu, Hongxu Chen, Xiaofei Xie, Geguang Pu, and Ting Liu. Memlock: Memory usage guided fuzzing. In ICSE 2020, ICSE ’20, page 765–777, New York, NY, USA, 2020. Association for Computing Machinery.
- [51] Hui Xu, Zirui Zhao, Yangfan Zhou, and Michael R. Lyu. Benchmarking the capability of symbolic execution tools with logic bombs. IEEE Transactions on Dependable and Secure Computing, 17(6):1243–1256, 2020.
- [52] Zhibin Yu, Zhendong Bei, and Xuehai Qian. Datasize-aware high dimensional configurations auto-tuning of in-memory cluster computing. In Proceedings of the Twenty-Third International Conference on Architectural Support for Programming Languages and Operating Systems, pages 564–577, 2018.
- [53] Michał Zalewski. American fuzz loop. http://lcamtuf.coredump.cx/afl/, 2021.
- [54] Qian Zhang, Jiyuan Wang, Muhammad Ali Gulzar, Rohan Padhye, and Miryung Kim. Bigfuzz: Efficient fuzz testing for data analytics using framework abstraction. In The 35th IEEE/ACM International Conference on Automated Software Engineering, 2020.