Electrocardiogram-based diagnosis of liver diseases: an externally validated and explainable machine learning approach
Abstract
Background: Liver diseases are a major global health concern, often diagnosed using resource-intensive methods. Electrocardiogram (ECG) data, widely accessible and non-invasive, offers potential as a diagnostic tool for liver diseases, leveraging the physiological connections between cardiovascular and hepatic health.
Methods: This study applies machine learning models to ECG data for the diagnosis of liver diseases. The pipeline, combining tree-based models with Shapley values for explainability, was trained, internally validated, and externally validated on an independent cohort, demonstrating robust generalizability.
Findings: Our results demonstrate the potential of ECG to derive biomarkers to diagnose liver diseases. Shapley values revealed key ECG features contributing to model predictions, highlighting already known connections between cardiovascular biomarkers and hepatic conditions as well as providing new ones. Furthermore, our approach holds promise as a scalable and affordable solution for liver disease detection, particularly in resource-limited settings.
Interpretation: This study underscores the feasibility of leveraging ECG features and machine learning to enhance the diagnosis of liver diseases. By providing interpretable insights into cardiovascular-liver interactions, the approach bridges existing gaps in non-invasive diagnostics, offering implications for broader systemic disease monitoring.
Funding: This research received no external funding.
1 Introduction
Liver diseases represent a significant part of global health challenges, accounting for 2 million deaths annually. They are responsible for 4% of all deaths in 2023 [1]. Despite the prevalence of hepatic conditions and complications, timely diagnosis remains a critical challenge, as existing diagnostic methods require more advanced procedures, such as blood tests, ultrasound, MRI-scans or CT-scans, and biopsies [2] which often show a lack of sensitivity and/or are resource-demanding. Therefore, the need for accessible, non-invasive diagnostic approaches is paramount.
Electrocardiograms (ECG) have long been a cornerstone in diagnosing and monitoring cardiovascular conditions by recording the heart’s electrical activity. Recent advances have expanded the scope of ECG applications, demonstrating their potential to uncover systemic health issues. For instance, ECG-derived models have shown promise in predicting laboratory values abnormalities [3], patient deterioration [4], and non-cardiac conditions as reviewed in [5]. These studies underscore the broader utility of ECG beyond cardiology, particularly in its ability to detect physiological disruptions in interconnected organ systems.
The relationship between liver and cardiovascular health is significant, with liver diseases often presenting cardiovascular complications [6], such as cirrhosis-associated cardiomyopathy, and portopulmonary hypertension. As well as cardiac conditions often causing liver issues [7] including cardiac-induced liver injury and congestive hepatopathy. Furthermore, shared risk factors, such as systemic inflammation and electrolyte disturbances like hypokalemia, also underscore the interrelation of these systems [8].
This study aims to address these gaps by developing a machine learning (ML) model that combines ECG features with demographic data for the diagnoses of liver diseases. Using a tree-based model we seek to create a robust and explainable tool to aid detection of diverse liver conditions. This approach aims to enhance diagnostic capabilities while providing a non-invasive, cost-effective and explainable approach that complements traditional diagnostic methods.
2 Background
2.1 Overview of liver disease diagnoses
Traditional diagnostic methods for liver diseases primarily serum markers, imaging techniques, and liver biopsies. While these methods are effective, they have notable limitations. Serum biomarkers [9], while non-invasive, may lack sensitivity and specificity, particularly in timely-stage disease detection. Imaging techniques [10], such as ultrasound and MRI, are resource-intensive, which often makes them inaccessible. Liver biopsies, considered as gold standard, are invasive and carry risks such as bleeding and infection, making them unsuitable for regular monitoring. These limitations highlight the urgent need for non-invasive, accessible, and cost-effective diagnostic tools to improve diagnoses and facilitate timely intervention.
2.2 ECG as a diagnostic tool
ECG are a cornerstone in the diagnoses and monitoring of cardiovascular conditions, offering a non-invasive method to assess the heart’s electrical activity. Traditionally, ECG has been used to detect arrhythmias, myocardial infarction, and other heart-related disorders by analyzing patterns in electrical signals. Recent research has expanded the utility of ECG beyond cardiology, see [5, 11] for reviews, with researchers exploring its application in systemic health monitoring, see [12] for a recent demonstration of the predictability of wide range of cardiac and non-cardiac conditions from a single ECG within a unified model. Its non-invasive nature, cost-effectiveness, and widespread availability make the ECG a promising candidate for the development of innovative diagnostic models, including those for liver diseases.
2.3 Cardiovascular-liver interactions
The interplay between the liver and the cardiovascular system is well-documented, with liver diseases often manifesting cardiovascular complications [6] and vice versa [7]. For instance, cirrhosis-associated cardiomyopathy, characterized by impaired systolic and diastolic function, exemplifies how chronic liver disease affects heart health. Whereas portopulmonary hypertension, a condition linked to right heart failure, highlights the impact of liver dysfunction on the pulmonary and cardiac systems. Also, chronic liver diseases frequently induce systemic hypotension due to altered vascular resistance. Conversely, heart-related conditions can lead to liver damage. Cardiac-induced liver injury, often termed “cardiac liver,” arises from chronic heart failure, while congestive hepatopathy, or “stasis liver,” results from prolonged venous congestion. Additionally, shared risk factors, such as systemic inflammation and electrolyte disturbances such as hypokalemia, further build this relationship [8].
2.4 Machine learning in liver disease diagnoses
The integration of ML into healthcare has revolutionized the diagnoses and management of complex diseases. Specifically for the diagnoses of liver diseases, at the time of writing, we are aware that ML has been previously used to detect cirrhosis with 12-lead ECG data using convolutional neural networks (CNN) [13]. However, the mentioned work is subject to a number of limitations such as lack of explainability, lack of external validation, and manual class balance across the internal folds. From a different downstream task perspective, other diverse state-of-the-art applications have been developed such as the diagnoses of liver cancer based on blood tests using graph-CNN [14], or with CT scans using transfer learning and CNNs [15], nevertheless, all of these lacking explainability and external validation. See [16] for a review of further inteligent applications on liver disease diagnoses.
3 Methods
3.1 Dataset
| Variable | MIMIC-IV-ECG | ECG-View II |
|---|---|---|
| Gender (%) | ||
| Female | 226,892 (48.50) | 375,733 (48.44) |
| Male | 240,837 (51.49) | 399,802 (51.55) |
| Age (%) | ||
| Median years (IQR) | 66 (25) | 52 (25) |
| Quantile 1 | 18-53 (23.83) | 18-40 (24.03) |
| Quantile 2 | 53-66 (25.16) | 40-52 (25.75) |
| Quantile 3 | 66-78 (25.60) | 52-65 (24.94) |
| Quantile 4 | 78-101 (25.40) | 65-109 (25.28) |
| ECG features (IQR) | ||
| RR-interval | 769 (264) | 857 (227) |
| PR-interval | 158 (38) | 158 (28) |
| QRS-duration | 94 (23) | 90 (14) |
| QT-interval | 394 (68) | 392 (48) |
| QTc-interval | 447 (47) | 421 (37) |
| P-wave axis | 51 (32) | 53 (28) |
| QRS-axis | 13 (61) | 48 (49) |
| T-wave axis | 42 (58) | 44 (33) |
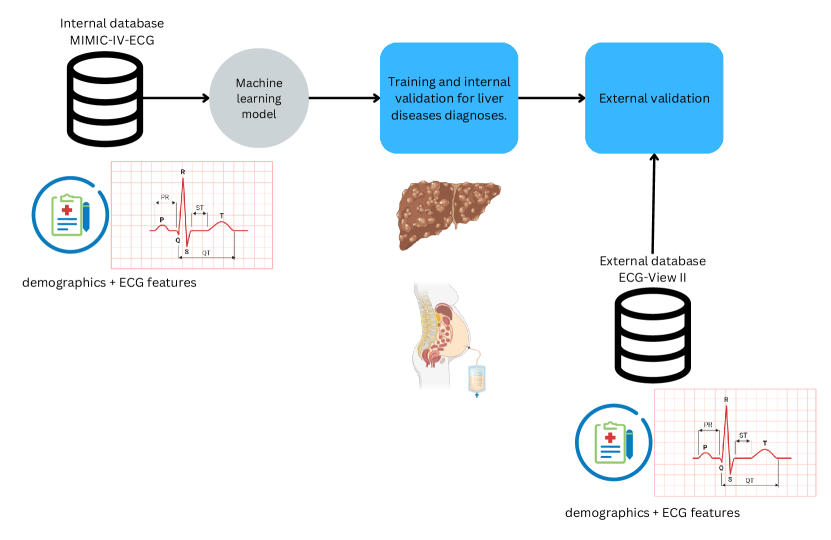
Our primary dataset for training and internal evaluation comes from the MIMIC-IV-ECG database [17, 18] which is a dataset from patients admitted to the Beth Israel Deaconess Medical Center in Boston, Massachusetts, where the population represents admission at the emergency department (ED) and intensive care unit (ICU). We define as target variables discharge diagnoses coded using the International Classification of Diseases Clinical Modification (ICD-10-CM). The investigated codes come from ICD-chapter XI covering diseases of the digestive system: K70, K703, and K7030, for alcoholic liver disease and sub-conditions, as well as K72, K729, and K7290 for hepatic failure and sub-conditions. To build a comprehensive feature set, we align the ECG features from MIMIC-IV to those from the ECG-VIEW-II database [19], our secondary dataset used for external validation, and is a dataset from patients admitted to a South Korean tertiary teaching hospital. The combined feature set includes: ECG metrics (RR interval, PR interval, QRS duration, QT interval, QTc interval in milliseconds; P wave axis, QRS axis, T wave axis in degrees) and basic patient demographics (sex as binary and age as a continuous variable). For the internal dataset, we use stratified folds based on diagnoses, age, and gender distributions, following an 18:1:1 split as described in previous work [12]. For the external dataset, we apply a similar stratification procedure to ensure consistency. We adopt the corresponding order of datasets for internal training and external validation regardless of the sample size given that MIMIC-IV-ECG provides more ethnically diverse data than ECG-View II, enhancing learning across diverse distributions as previously seen in [20]. Our final datasets consist of two large cohorts of 467,729 samples for training and 775,535 samples for external validation.
3.2 Models and evaluation
In this study, we devise individual tree-based models using Extreme Gradient Boosting (XGBoost) to solve binary classification tasks, one for each considered ICD-10-CM code. During training, early stopping is applied with a patience of 10 iterations on the validation fold to prevent overfitting. Model performance is assessed using the area under the receiver operating characteristic curve (AUROC) during training on the validation fold. We report AUROC scores on the internal test set and the external dataset as well as correponding 95% prediction intervals, inferred from empirical bootstrapping using 1000 iterations.
3.3 Explainability
We aim to go beyond a performance evaluation by providing insights into the trained models. To this end, we integrate Shapley values into our pipeline [21]. Shapley values provide a measure of feature importance by quantifying how much each feature contributes to the model prediction.
4 Results
4.1 Predictive performance
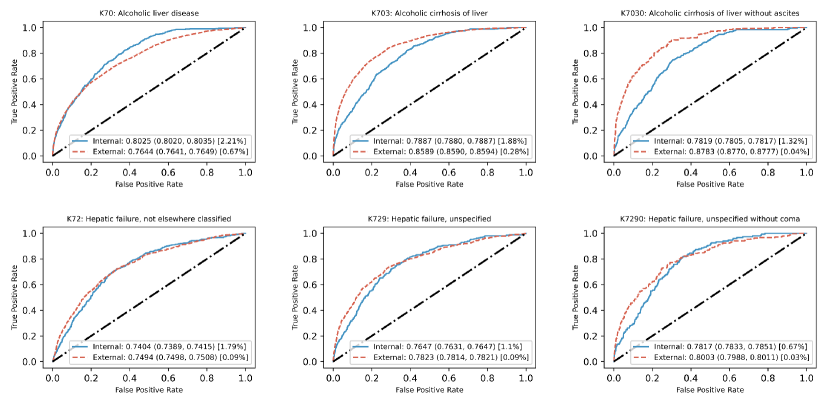
Figure 2 shows the predictive performance of our model across multiple liver conditions, assessed through AUROC scores evaluated on the internal and external test sets. The 95% prediction intervals offer an understanding of the reliability of these metrics. Additionally, we report the class prevalance of each condition in the respective datasets, providing context on their distribution within the studied populations, where the MIMIC cohort shows prevalence between 0.67% to 2.21%, whereas the Korean cohort substancially lower prevalence between 0.03% to 0.67%. Notably, alcoholic liver disease (A) and its sub-conditions (B and C) show higher predictive performance compared to hepatic failure (D) and its sub-categories (E and F). All internal codes demonstrate strong discriminative ability, with AUROC scores in the 0.70s (good) to 0.80s (very good). While external validation scores exhibit some variability, they remain within acceptable ranges, reflecting differences in cohort characteristics and class prevalence ratios. These findings highlight the discriminative power of ECG features in identifying liver diseases and demonstrate the robustness of our approach across diverse populations.
4.2 Explainability
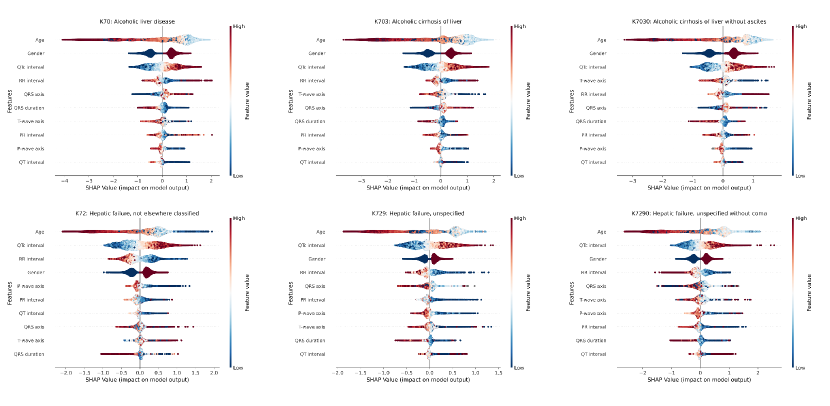
Figure 3 presents the results of the explainability analysis based on Shapley values.
Across all conditions, age emerges as the most important predictor, with a consistent negative effect for both high and low ages, while intermediate ages have a positive effect, except in the case of “hepatic failure not elsewhere classified”, where low age contributes positively. Gender also plays a significant role, with males being the predominant group contributing most. Additionally, high QTc values, which are the most important ECG feature across all conditions, further influence the outcomes.
In alcoholic liver diseases and their sub-conditions, a consistent ranking is observed across all three conditions, with age, gender, QTc, and RR interval having effects as described above, with the exception that T-wave axis features are more important than RR intervals in cases of cirrhosis without ascites. The RR interval shows that both low and very high values contribute positively, with the latter having an even stronger effect. T-wave shows that low values contribute positively for all conditions. The QRS axis predominantly shows high values, although some low values are noted in cases without ascites. Similarly, the QRS duration tends to be low, but higher values are also seen in cases without ascites.
In hepatic failure and its sub-conditions, a consistent ranking is observed across all three conditions, with age, QTc, gender, and RR interval being the top four predictors, where age, gender, and QTc have effects as described above. For the RR interval, low values contribute positively, while high values have a negative impact across all conditions. The QRS axis primarily shows positive contributions from median values in hepatic failure, with high values having a negative effect. In contrast, for hepatic failure without coma, median values still contribute positively, but low values have a negative effect. Regarding the PR interval, median values contribute negatively in hepatic failure, while high values have a negative effect in cases without coma, with low values contributing positively for both. Finally, the P-wave axis shows that low values contribute positively for hepatic failure, with high values contributing negatively, whereas in hepatic failure without coma, some very high values contribute positively.
5 Discussion
ECG biomarkers for non-cardiovascular conditions
Detecting liver diseases through ECG features may initially seem unconventional, as the ECG is traditionally associated with diagnosing cardiovascular conditions. The connection between the heart and liver is less apparant but underscores the importance of biomarkers in diagnostic innovations. While the physiological mechanisms linking liver dysfunction to ECG abnormalities are not yet fully understood, they represent an intriguing area for further research. Our findings reveal specific patterns in the ECG data that act as a distinctive fingerprint for liver diseases. These patterns suggest potential physiological interactions between the heart and liver, detectable through the applied methods. This novel concept highlights the promise of interdisciplinary approaches, bridging cardiology and hepatology, to uncover new diagnostic pathways.
Predictive performance
The exceptional predictive power of a small set of ECG features highlights their ability to detect liver conditions from a single ECG with high accuracy. Robust AUROC values across internal and external validations demonstrate the reliability of these features, even in diverse cohorts. The distinct patterns observed for conditions like alcoholic liver disease and hepatic failure underscore the physiological links between cardiac and hepatic health.
Previous research identified ascites as a significant confounding factor in detecting cirrhosis from ECG [22]. At this point, it is important to stress a difference in the study design compared to the conventional control-group approach that was first pointed out in [12]. Rather than selecting a control group that matches the diseased subgroup according to as many covariates as possible, we use the remainder of the entire study cohorts not associated with the condition under consideration as negatives, which represents the most realistic negative control group conceivable.
Feature importance
The significance of aging is certainly an expected outcome, as it has been previously proved that eldery have more agreement with the inflamm-aging theory, in which aging accrues inflammation [23]. The prevalence of hepatocellular carcinoma (HCC) is higher in men, possibly due to differences in risk factor exposure [24]. This is consistent with findings in cirrhosis and liver failure, where men are more frequently affected due to the progression of liver disease towards HCC. The study also suggests that estrogen may influence HCC pathogenesis, highlighting potential gender differences in the progression of liver disease and its complications, including liver failure.
Previous research [25] highlighted the prevalence of prolonged (high) QTc values in alcoholic cirrhosis within an Asian cohort. A second study [26] found that liver transplantation significantly improved QTc values in about half of the patients, suggesting that liver disease contributes to prolonged QTc but may not be the only factor involved. Our study expands on these findings by examining a diverse cohort across different ethnicities and by including not only cirrhosis but also hepatic failure cases. It supports the idea that while liver disease is a key contributor, the pathogenesis of prolonged QTc is multifactorial. A study by Toma et al [27] found an accentuated deceleration of the T-wave in cirrhotic patients, indicating repolarization abnormalities. Similarly, we observed low T-wave axis values in cirrhosis, confirming this altered repolarization. However, in liver failure complications, we found a novel increase in T-wave axis values, suggesting a shift in repolarization patterns as the disease progresses. Similarly, another study [28] suggested longer RR intervals in cirrhotic patients, here we also confirm the finding on very high values, however, as the T-wave, RR intervals shift directions on complications such as liver failure as low values contribute most positively. To summarize, we observed a shift in T-wave axis values and RR intervals between cirrhotic patients and those with liver failure complications, highlighting evolving repolarization patterns and potential alterations in cardiac rhythm as the disease progresses.
Potential innovations and applications
Firstly, the most promising and direct application would be the development of an externally validated unified AI model that can simultaneously assess liver and heart conditions using the shared systemic effects visible in ECG signals. This approach not only improves diagnostic accuracy, but also reduces the need for multiple separate diagnostic tests, potentially streamlining patient evaluation in busy clinical settings. Secondly, by detecting subtle changes in the ECG that signal early systemic disturbances, such as fluid overload or electrolyte imbalances, the model could enable earlier interventions, which are critical for improving patient outcomes, particularly in cases of liver disease and its complications. Lastly, another application is the ability of the model to guide diagnostic pathways by detecting ECG abnormalities that suggest underlying liver or myocardial dysfunction, which could prompt clinicians to pursue additional investigations, such as imaging or laboratory tests, that would otherwise have been delayed or overlooked. In this way, the model acts as a clinical decision support tool that enhances the diagnostic process, improving both efficiency and accuracy. By integrating insights both from the cardiac and the hepatic systems, this approach could ultimately improve patient monitoring, facilitate earlier disease detection, and reduce healthcare costs associated with misdiagnoses or delayed treatment.
Limitations and future work
While our study highlights the potential of ECGs in detecting, as well as potentially screening and monitoring liver conditions, future work could focus on how ECG abnormalities vary across age groups and how these variations differ from healthy aging features [29]. Also beyond identifying associations, future research could aim to explore causal relationships between ECG patterns and digestive and liver conditions along the lines of [30]. Additionally, an in-depth study on liver diseases based on raw waveforms would be in order extending [12, 4] with proper external validation. In the light of the recent findings on the superiority of raw ECG waveforms compared to ECG features for diagnostic tasks [4], further improvements in diagnostic accuracy are expected in this scenario. Finally, the use of ICD-10-CM codes as the definition for target variables represents an international and well-defined diagnosis scheme. However, as these codes are primarily designed for billing and administrative purposes, they may introduce subtle variations or biases due to differences in coding practices across institutions or regions. Overcoming these shortcomings will require to identify clinically more reliable target variables.
Data and code availability
Code for dataset preprocessing and experimental replications can be found in a dedicated code repository.
Author Contributions
JMLA, and NS conceived and designed the project. JMLA conducted the full experimental analyses, with NS supervising them, and WH providing critical revision of clinical intellectual content. JMLA produced the first draft, NS and WH revised it. All authors critically revised the content and approved the final version for publication.
Declaration of interests
The authors declare no competing interests.
References
- [1] Devarbhavi H, Asrani SK, Arab JP, Nartey YA, Pose E, Kamath PS. Global burden of liver disease: 2023 update. Journal of hepatology 2023;79(2):516–537. Doi: https://doi.org/10.1016/j.jhep.2023.03.017.
- [2] Tapper EB, Parikh ND. Diagnosis and management of cirrhosis and its complications: a review. Jama 2023;329(18):1589–1602. Doi: https://doi.org/10.1001/jama.2023.5997.
- [3] Alcaraz JML, Strodthoff N. Cardiolab: Laboratory values estimation and monitoring from electrocardiogram signals – a multimodal deep learning approach. arXiv preprint arXiv241114886 2024;Doi: https://arxiv.org/abs/2411.14886.
- [4] Alcaraz JML, Strodthoff N. Mds-ed: Multimodal decision support in the emergency department–a benchmark dataset for diagnoses and deterioration prediction in emergency medicine. arXiv preprint arXiv240717856 2024;Doi: https://arxiv.org/abs/2407.17856.
- [5] Topol EJ. What’s lurking in your electrocardiogram? The Lancet 2021;397(10276):785. Doi: https://doi.org/10.1016/S0140-6736(21)00452-9.
- [6] Møller S, Henriksen JH. Cardiovascular complications of cirrhosis. Postgraduate medical journal 2009;85(999):44–54. Doi: https://doi.org/10.1136/gut.2006.112177.
- [7] Naschitz JE, Slobodin G, Lewis RJ, Zuckerman E, Yeshurun D. Heart diseases affecting the liver and liver diseases affecting the heart. American heart journal 2000;140(1):111–120. Doi: https://doi.org/10.1067/mhj.2000.107177.
- [8] Møller S, Bernardi M. Interactions of the heart and the liver. European heart journal 2013;34(36):2804–2811. Doi: https://doi.org/10.1093/eurheartj/eht246.
- [9] Ozer J, Ratner M, Shaw M, Bailey W, Schomaker S. The current state of serum biomarkers of hepatotoxicity. Toxicology 2008;245(3):194–205. Doi: https://doi.org/10.1016/j.tox.2007.11.021.
- [10] Bravo AA, Sheth SG, Chopra S. Liver biopsy. New England Journal of Medicine 2001;344(7):495–500. Doi: https://doi.org/10.1056/NEJM200102153440706.
- [11] Siontis KC, Noseworthy PA, Attia ZI, Friedman PA. Artificial intelligence-enhanced electrocardiography in cardiovascular disease management. Nature Reviews Cardiology 2021;18(7):465–478. Doi: https://doi.org/10.1038/s41569-020-00503-2.
- [12] Strodthoff N, Lopez Alcaraz JM, Haverkamp W. Prospects for artificial intelligence-enhanced electrocardiogram as a unified screening tool for cardiac and non-cardiac conditions: an explorative study in emergency care. European Heart Journal Digital Health 2024;ztae039. Doi: https://doi.org/10.1093/ehjdh/ztae039.
- [13] Ahn JC, Attia ZI, Rattan P, Mullan AF, Buryska S, Allen AM, Kamath PS, Friedman PA, Shah VH, Noseworthy PA, et al. Development of the ai-cirrhosis-ecg score: an electrocardiogram-based deep learning model in cirrhosis. Official journal of the American College of Gastroenterology ACG 2022;117(3):424–432. Doi: https://doi.org/10.14309/ajg.0000000000001617.
- [14] Kim Y, Kim J, Lee S, Ahn S, Kim J, Park S, Cho S. Automatic hepatocellular carcinoma diagnosis using graph convolutional network. In 2022 International Conference on Electronics, Information, and Communication (ICEIC). 2022; 1–4. Doi: https://doi.org/10.1109/ICEIC54506.2022.9748503.
- [15] Yamada A, Oyama K, Fujita S, Yoshizawa E, Ichinohe F, Komatsu D, Fujinaga Y. Dynamic contrast-enhanced computed tomography diagnosis of primary liver cancers using transfer learning of pretrained convolutional neural networks: Is registration of multiphasic images necessary? International Journal of Computer Assisted Radiology and Surgery 2019;14:1295–1301. Doi: https://doi.org/10.1007/s11548-019-01987-1.
- [16] Tian Y, Liu M, Sun Y, Fu S. When liver disease diagnosis encounters deep learning: Analysis, challenges, and prospects. iLIVER 2023;2(1):73–87. Doi: https://doi.org/10.1016/j.iliver.2023.02.002.
- [17] Johnson A, Bulgarelli L, Pollard T, Horng S, Celi LA, Mark R. Mimic-iv. PhysioNet 2020;49–55. Doi: https://doi.org/10.13026/kpb9-mt58.
- [18] Gow B, Pollard T, Nathanson LA, Johnson A, Moody B, Fernandes C, Greenbaum N, Waks JW, Eslami P, Carbonati T, Chaudhari A, Herbst E, Moukheiber D, Berkowitz S, Mark R, Horng S. Mimic-iv-ecg: Diagnostic electrocardiogram matched subset, 2023. Doi: https://doi.org/10.13026/4nqg-sb35.
- [19] Kim YG, Shin D, Park MY, Lee S, Jeon MS, Yoon D, Park RW. Ecg-view ii, a freely accessible electrocardiogram database. PloS one 2017;12(4):e0176222. Doi: https://doi.org/10.1371/journal.pone.0176222.
- [20] Alcaraz JML, Strodthoff N. Estimation of cardiac and non-cardiac diagnosis from electrocardiogram features. arXiv preprint arXiv240817329 2024;Doi: https://arxiv.org/abs/2408.17329.
- [21] Lundberg SM, Erion G, Chen H, DeGrave A, Prutkin JM, Nair B, Katz R, Himmelfarb J, Bansal N, Lee SI. From local explanations to global understanding with explainable ai for trees. Nature machine intelligence 2020;2(1):56–67. Doi: https://doi.org/10.1038/s42256-019-0138-9.
- [22] Ouyang D. The uncanny and unreasonable performance of ai in medical imaging, 2023. Doi: https://sites.google.com/view/causemic.
- [23] Sheedfar F, Biase SD, Koonen D, Vinciguerra M. Liver diseases and aging: friends or foes? Aging cell 2013;12(6):950–954. Doi: https://doi.org/10.1111/acel.12128.
- [24] Hashimoto E, Tokushige K. Prevalence, gender, ethnic variations, and prognosis of nash. Journal of gastroenterology 2011;46:63–69. Doi: https://doi.org/10.1007/s00535-010-0311-8.
- [25] Zhao J, Qi X, Hou F, Ning Z, Zhang X, Deng H, Peng Y, Li J, Wang X, Li H, et al. Prevalence, risk factors and in-hospital outcomes of qtc interval prolongation in liver cirrhosis. The American journal of the medical sciences 2016;352(3):285–295. Doi: https://doi.org/10.1016/j.amjms.2016.06.012.
- [26] Bal JS, Thuluvath PJ. Prolongation of qtc interval: relationship with etiology and severity of liver disease, mortality and liver transplantation. Liver international 2003;23(4):243–248. Doi: https://doi.org/10.1034/j.1600-0676.2003.00833.x.
- [27] Toma L, Stanciu AM, Zgura A, Bacalbasa N, Diaconu C, Iliescu L. Electrocardiographic changes in liver cirrhosis—clues for cirrhotic cardiomyopathy. Medicina 2020;56(2):68. Doi: https://doi.org/10.3390/medicina56020068.
- [28] Lee W, Vandenberk B, Raj SR, Lee SS. Prolonged qt interval in cirrhosis: twisting time? Gut and Liver 2022;16(6):849. Doi: https://doi.org/10.5009/gnl210537.
- [29] Ott G, Schaubelt Y, Lopez Alcaraz JM, Haverkamp W, Strodthoff N. Using explainable ai to investigate electrocardiogram changes during healthy aging—from expert features to raw signals. Plos one 2024;19(4):e0302024. Doi: https://doi.org/10.1371/journal.pone.0302024.
- [30] Alcaraz JML, Strodthoff N. Causalconceptts: Causal attributions for time series classification using high fidelity diffusion models. arXiv preprint arXiv240515871 2024;Doi: https://arxiv.org/abs/2405.15871.