Stellar-gas kinematic misalignments in eagle: lifetimes and longevity of misaligned galaxies
Abstract
The dominant processes by which galaxies replenish their cold gas reservoirs remain disputed, especially in massive galaxies. Stellar-gas kinematic misalignments offer an opportunity to study these replenishment processes. However, observed distributions of these misalignments conflict with current models of gas replenishment in early-type galaxies (ETGs), with longer relaxation timescales suggested as a possible solution. We use the eagle simulation to explore the relaxation of unstable misaligned gas in galaxies with masses of M⊙ between . We extract misalignments from formation to relaxation providing a sample of relaxations. We find relaxation timescales tend to be short-duration, with median lifetimes of Gyr, though with a notable population of unstable misalignments lasting Gyr. Relaxation time distributions show a log-linear relationship, with of unstable misalignments persisting for torquing times. Long-lived unstable misalignments are predominantly found in galaxies with higher stellar masses, lower star-forming gas fractions, higher ongoing gas inflow, and which reside in the centres of dense environments. Mergers only cause of unstable misalignments in eagle. We conclude that, at least in eagle, unstable kinematic misalignments are not predominantly driven by gas-rich minor mergers. Additionally, processes that significantly extend relaxation times are not dominant in the galaxy population. Instead, we see a diverse formation pathway for misalignments such as through hot halo cooling.
keywords:
galaxies: general – galaxies: evolution – galaxies: interactions – galaxies: kinematics and dynamics – galaxies: haloes – methods: numerical1 Introduction
Throughout a galaxy’s lifetime, the supply of gas plays an important role in driving its evolution. Cold, molecular gas in particular plays a key role as it is consumed by galactic processes such as star formation (SF) and active galactic nuclei (AGN) fuelling. However, with gas depletion timescales on the order of a few gigayears, systems must replenish their cold gas reservoirs if they are to maintain the observed levels of SF (e.g. Kennicutt et al., 1994).
Galaxies can replenish their cold gas reservoirs through a variety of processes. Internal replenishment can occur through stellar mass loss (e.g. Parriott & Bregman, 2008; Leitner & Kravtsov, 2011) and the cooling of hot halo gas (e.g. Kereš et al., 2005; Lagos et al., 2014). Cold gas can also be supplied externally through gas-rich galaxy interactions/mergers (e.g. Di Teodoro & Fraternali, 2014; Barrera-Ballesteros et al., 2015) and direct accretion of cold gas from filaments (e.g. Kereš et al., 2005; Brooks et al., 2009). While the supply of cold gas through major mergers is fairly well established, the degree to which cold gas is replenished through other means is less constrained.
Stellar-gas kinematic misalignments (henceforth ‘misaligned galaxies’) have been one laboratory in which the origins of cold gas replenishment has been studied (e.g. Sarzi et al., 2006; Davis et al., 2011; Davis & Bureau, 2016; Bryant et al., 2019; Ruffa et al., 2019b; Duckworth et al., 2020a). Observationally, misalignments are found in of the galaxy population at (Bryant et al., 2019) and show a strong morphological dependence, with of ETGs and of LTGs showing such features (e.g. Davis et al., 2011; Chen et al., 2016; Duckworth et al., 2019; Bryant et al., 2019; Ruffa et al., 2019a; Ristea et al., 2022; Raimundo et al., 2023). Cosmological hydrodynamical simulations, such as eagle (Schaye et al., 2015; Crain et al., 2015) and horizon-agn (Dubois et al., 2014), have also proven to be invaluable to understanding the physical drivers and timescales involved in misalignments, owing to their ability to trace galaxies over time. These have been able to recreate the observed misalignment populations (e.g. Duckworth et al., 2020a; Khim et al., 2020; Casanueva et al., 2022).
The existence of stellar-gas misalignments is predicted by our current Lambda Cold Dark Matter (CDM) cosmological model. Stellar and gaseous components are expected to form an aligned discy structure as a natural consequence of galaxy formation (see tidal torque theory; TTT by Peebles, 1969; Doroshkevich, 1970; White, 1984). As the galaxy evolves, stellar and gas components may decouple and become misaligned, provided that the angular momentum of the existing gas disc is overcome and a new, misaligned disc can form. The stochastic nature of external gas accretion and ability, to first order, accrete with a random angular momentum orientation has led external accretion to become the favoured dominant driver behind many misalignments (e.g. Davis et al., 2011; van de Voort et al., 2015; Starkenburg et al., 2019; Duckworth et al., 2020b; Khim et al., 2021; Casanueva et al., 2022).
Due to their inherent instability, stellar-gas kinematic misalignments are transient phenomena and are not expected to be long-lived (Tohline et al., 1982; Lake & Norman, 1983). Once formed, a misaligned gas disc will continuously dissipate angular momentum until it has settled back into the plane of the stellar disc (assumed to dominate the mass distribution at radii of interest). This produces populations of conventional co-rotating and counter-rotating galaxies. While the former are indistinguishable from secularly evolved galaxies, the latter are long-lived and thought only possible through the relaxation of a previously misaligned gas disc (e.g. Bryant et al., 2019; Duckworth et al., 2020a; Khoperskov et al., 2021). Prolate mass distributions with a polar-ring are also thought to be stable (Tohline et al., 1982), though such systems are not common and constitute only a few percent of observable lenticular galaxies (e.g. Macciò et al., 2006; Bryant et al., 2019). In the absence of processes preserving this misaligned gas disc, relaxation into a stable regime is thought to occur quickly, with idealised theoretical estimates predicting timescales of less than 5 dynamical times (Tohline et al., 1982; Steiman-Cameron & Durisen, 1988). For a typical ETG with a highly spherical mass distribution, this is typically equivalent to Myr (Davis & Bureau, 2016).
A key area of contention lies between the observed shape of the misalignment fraction distributions and those predicted by analytical models. As explored in detail in Davis & Bureau (2016), assuming mergers are the primary driver of misalignments alongside theoretical relaxation timescales (in the absence of smooth accretion), current models significantly overpredict the number of relaxed systems. Recent theoretical findings point to a significantly more diverse formation path for misaligned systems such as through galaxy fly-bys and halo cooling onto gas-poor systems (e.g. Lagos et al., 2015; Bryant et al., 2019; Khim et al., 2021). Likewise, the inclusion of smooth accretion onto an existing misaligned gas disc has been shown to significantly enhance the misalignment timescales beyond theoretical timescales (e.g. van de Voort et al., 2015; Lagos et al., 2015; Ruffa et al., 2019b). This misaligned smooth accretion may be supplied through halo cooling (e.g. Negri et al., 2014; Lagos et al., 2015; Ruffa et al., 2019b; Duckworth et al., 2020a), provided the galaxy hosts a gaseous halo that is kinematically misaligned with respect to its stellar component (e.g. Padilla et al., 2014; Duckworth et al., 2020a). Misaligned smooth accretion may also be supplied from tidal tails from a recent merger which can significantly extend the longevity of a misalignment beyond Gyr (van de Voort et al., 2015). Taken together, these results suggest the processes by which galaxies replenish their cold gas may be more diverse than previously thought. Thus, by investigating the timescales of misalignments in hydrodynamical simulations we can gain insights into gas replenishment processes that may be challenging to detect observationally.
Thus far, the exploration of misalignment timescales has been largely limited to small numbers of galaxies with idealised behaviour. One notable exception is from Khim et al. (2021) who used the horizon-agn simulation to study the lifetimes of misalignments in a sizeable galaxy population. Using a sample of misaligned galaxies at and measuring the population decay, they find a significant population of galaxies with misalignment lifetimes of Gyr with a strong morphological dependence. ETGs were found with characteristic decay timescales of Gyr compared to Gyr for LTGs. Overall, galaxies with lower gas fractions, more early-type morphologies, and those residing in denser environments were found to have longer decay timescales. As these properties are common among ETGs (Dressler, 1980), this is thought to amplify the higher misalignment fractions among ETG populations. Additionally, misalignments formed from interactions between the galaxy and a dense medium (e.g. ram-pressure stripping; Gunn & Gott, 1972) were found to be the most long-lived, with those caused by mergers, galaxy interactions, and remaining processes including halo cooling and filament accretion resulting in faster relaxations.
Another noticeable exception is from Casanueva et al. (2022) who used the eagle simulation to investigate the origin of misaligned galaxies for a representative galaxy population. They find galaxies that remain misaligned between two neighbouring simulation snapshots are typically more spheroidal, dispersion-dominated, and gas-poor. Misalignment formation was found to correlate most strongly with a reduction in cold gas fraction, which was attributed to gas stripping from nearby galaxy interactions. Mergers were found to coincide with misalignment formation in only . Alongside comparable external accretion rates in aligned galaxies, Casanueva et al. (2022) suggest external processes are not the dominant driver of misalignments in eagle, in agreement with Khim et al. (2021).
In this paper, we use the eagle (Evolution and Assembly of GaLaxies and their Environments) suite of cosmological hydrodynamical simulations (Schaye et al., 2015; Crain et al., 2015) to investigate the persistence of stellar-gas kinematic misalignments for a representative galaxy population from . Importantly, our approach differs from that of Khim et al. (2021) as we extract a population of misalignments over a complete window from formation to relaxation, rather than characterising relaxation timescales using a misalignment population decay from a given redshift. Additionally, we study these misalignments as 3D angles, rather than in projection, and treat stable co- and counter-rotating regimes separately. In this way, we create a reliable estimate of the misalignment timescales for a large galaxy sample for the first time. Specifically, we aim to answer the following questions: 1) whether significantly longer relaxation timescales (of order dynamical timescales) as suggested by Davis & Bureau (2016) are seen within eagle; 2) the degree to which relaxation times vary with galaxy properties and environment; and 3) to what extent are mergers associated with misalignment formation.
This paper is organised as follows. In Section 2 we outline the theoretical background regarding predicted relaxation timescales. In Section 3 we give an overview of eagle. In Section 4 we outline the sample of galaxies we use for this work. In Section 5 we give an overview of the galaxy properties we calculate alongside definitions of various parameters we use throughout this work. In Section 6 we present our results and compare these with existing results. Finally, we conclude in Section 7.
2 Theoretical relaxation timescales
As outlined by Tohline et al. (1982), a misaligned disc of gas can be modelled by a series of rings embedded within an ellipsoidal gravitational potential well. These rings of gas have a circular velocity at a radius . The non-zero angular momentum component of this gas will experience a net torque from the existing mass distribution. This results in a precession rate given by {ceqn}
| (1) |
where is the angular velocity of the gas at a given radius, is the coefficient of the quadrupole moment of an ellipsoidal gravitational field, and is the angle between the stellar and cold gas angular momentum vectors.
As the precession rate given by equation 1 increases toward smaller radii, this results in a warped disc. This planar divergence is stronger toward the central regions of the disc and has been well-studied in nearby galaxies such as Centaurus A (e.g. Nicholson et al., 1992). For a misaligned gas disc, neighbouring non-coplanar cold gas clouds will interact and dissipate the perpendicular angular momentum component. This suppresses non-circular orbits and forces radially adjacent rings into co-planar orbits. The angular momentum of a misaligned gas disc is therefore not conserved, with the surrounding stars absorbing the lost angular momentum (Tohline et al., 1982). The loss of angular momentum causes the gas disc to settle into the fundamental plane of the galaxy given by the angular momentum of the mass distribution. As the mass of stars is thought to dominate the mass distributions of the centres of these galaxies, the fundamental plane is assumed to be that of the net stellar angular momentum. A misaligned gas disc is therefore expected to naturally settle into a co- or counter-rotating configuration with respect to the stellar component. As there are no net torque acts on gas discs in co- or counter-rotating configurations, these are expected to be long-lived and stable.
As described by Tohline et al. (1982) and Lake & Norman (1983), in the absence of continued accretion onto the gas disc that may preserve its angular momentum, the time taken for a misaligned disc to relax back into a stable configuration should be governed by the torquing timescale,
| (2) |
where is the stellar ellipticity and the dynamical time of the galaxy is defined as . For a typical ETG with , a disc size of kpc, and km s-1, this implies , corresponding to Gyr.
3 The eagle simulation
The Evolution and Assembly of GaLaxies and their Environments111A full description of models and parameters can be found in Schaye et al. (2015) and Crain et al. (2015), with publicly available data products available from http://eagle.strw.leidenuniv.nl and http://www.eaglesim.org/ and described in McAlpine et al. (2017) (eagle) is a suite of cosmological hydrodynamical simulations described in Schaye et al. (2015) and Crain et al. (2015). These simulations use a modified version of the parallel N-body smoothed particle hydrodynamics (SPH) code Gadget-3 (Springel et al., 2005, 2008) known as Anarchy (see Schaller et al. 2015 for description and analysis). The initial conditions for these simulations were generated using Panphasia (Jenkins & Booth, 2013). A CDM framework is also assumed, with , , , , , and (Planck Collaboration et al., 2014).
eagle uses sub-grid models to capture physical processes below the resolution limit ( pkpc) of the simulation. These include radiative cooling and photoheating (Wiersma et al., 2009a), star formation (Schaye & Dalla Vecchia, 2008), stellar evolution and interstellar medium (ISM) enrichment (Wiersma et al., 2009b), the stochastic thermal stellar feedback by Dalla Vecchia & Schaye (2012), and black hole growth through accretion and mergers and feedback (Springel et al., 2005; Rosas-Guevara et al., 2015). The eagle sub-grid parameters are tuned to reproduce observations of the galaxy stellar mass function and galaxy sizes relation at . The eagle simulations have been successful in reproducing observational mass, size, and morphology distributions (e.g., Schaye et al., 2015; Correa et al., 2017; Trayford & Schaye, 2019; Hill et al., 2021).
In eagle, galaxies and their host halos are identified through a series of stages described in Schaye et al. (2015). In short, dark matter halos are identified in post-processing using the friend-of-friends (FoF) algorithm (Davis et al., 1985), with a linking length of times the mean interparticle separation. Stellar, gas, and black hole particles are then assigned to the same FoF-halo as their nearest DM particle. Substructures within these FoF-halos, called subhalos, are then identified using the subfind algorithm (Springel et al., 2001; Dolag et al., 2009) by identifying gravitationally-bound overdensities by considering both DM and baryonic particles. The subhalo with the lowest value of the gravitational potential within a FoF-halo is assigned as the central galaxy, with the remaining subhalos being designated as satellite galaxies.
Galaxy evolution can be traced using the subhalo merger trees by Qu et al. (2017) that were generated using the D-Trees algorithm (Jiang et al., 2014). The latter links subhalos by establishing the location of the majority of all particles assigned to a particular subhalo between consecutive snapshots222For a more detailed explanation of the D-Trees algorithm and merger tree construction see Jiang et al. (2014) and Qu et al. (2017), respectively. Mergers are treated hierarchically such that two (or more) progenitor galaxies undergoing a merger will form a single descendant galaxy. A merger is defined to occur once the D-Trees algorithm can no longer identify a progenitor subhalo among the subfind catalogues. At this point the subfind algorithm can no longer distinguish the progenitor density profiles, at which point particles from the secondary galaxy are reassigned to the primary galaxy. Occasionally during mergers, the algorithm may switch the primary and secondary galaxies if these are in very close proximity (‘Subhalo switching problem’; see Qu et al., 2017, for details). Regarding this work, a switch between coalescing galaxies in which one galaxy is misaligned may distort the measured misalignment duration. To minimise this effect, we exclude galaxies that experience a spontaneous stellar mass decrease of whilst misaligned. This ensures a spontaneous switch to a low-mass merging satellite is not falsely included as a misalignment. However, we do not find this choice to meaningfully affect our sample or results.
| Parameter | Value |
| Volume | cMpc |
| total particle count | |
| Initial gas particle mass | M⊙ |
| Initial DM particle mass | M⊙ |
| Hubble parameter, | 0.6777 |
| Co-moving gravitational softening length | 2.66 ckpc |
| Max. physical gravitational softening length | 0.7 pkpc |
The eagle simulation is stored in 400 intervals between to . Of these, 29 are "snapshots" with time intervals from to 1 Gyr, which record complete particle properties alongside extensive halo and subhalo property catalogues. Additionally, 400 higher time-cadence "snipshots" are stored with limited catalogues of particle and subhalo properties, though with enough information to calculate misalignment angles. We use 200 of these 400 snipshots for which merger trees were run by Crain et al. (2017), with a mean time cadence of Gyr within our target redshift range. These allow us to distinguish between faster ( Gyr) and longer-lived ( Gyr) misalignments. As we wish to focus on the period in which galaxy growth occurs largely linearly, we limit our data analysis to which provides a wide temporal window over which to measure relaxation timescale distributions. For this work we make use of the largest reference simulation, Ref-L100N1504, which has a box size of 100 co-moving Mpc3 (henceforth ckpc for co-moving and pkpc for proper length-scales). Parameters specific to the Ref-L100N1504 are summarised in Table 1.
4 Sample
The Ref-L100N1504 simulation contains galaxies with a stellar mass M⊙ at . This provides a statistically-significant galaxy population with a range of morphologies and sizes from which to sample misalignments.
In order to select our sample we use similar limits as those adopted by Casanueva et al. (2022) and highlight any differences below. We consider both central and satellite galaxies in our analysis and extract galaxies under the following conditions:
-
1.
A minimum subhalo stellar mass of M⊙ within a spherical aperture size of 30 pkpc, centred on the minimum potential of the galaxy. This mass limit ensures we only include galaxies that are sufficiently resolved.
-
2.
A minimum star-forming gas (gasSF) particle count of 20 for kinematic measurements within the stellar half-mass radius (). We define as the spherical radius enclosing half the stellar mass within 30 pkpc, centred on the stellar centre of mass, which is approximately equivalent to the effective radius in galaxy observations. The low gasSF particle count allows us to probe relatively deep into the low quenched ETG population (that dominates the misaligned population) whilst having a statistically significant particle count from which to extract kinematic information. We note that changing this limit up to 50 or 100 particles leaves the shape and median values of our relaxation timescale distributions unchanged, and thus this choice does not unduly influence our results.
-
3.
A maximum spatial separation between the stellar and gasSF centres of mass within pkpc. This allows us to exclude galaxies featuring highly perturbed cold gas reservoirs that are only loosely associated with the galaxy (see Appendix D in Trayford & Schaye, 2019, for examples of this in high-mass galaxies).
-
4.
A maximum uncertainty of for the misalignment angle using boostrap resampling. This criterion is motivated by the presence of systems that are heavily dispersion-dominated and/or feature relatively few gasSF particles (as is typical for many ETGs).
Unlike Casanueva et al. (2022), we do not impose a direct limit on dispersion-dominated systems through the use of the stellar spin parameters (see Emsellem et al., 2011). Instead, we use bootstrap resampling and take the () percentiles to estimate the uncertainty in the misalignment angle. This uncertainty method will naturally scale with the degree of stellar dispersion in the galaxy, but will also remove a handful of galaxies with chaotic gasSF kinematics that are not captured by the stellar spin parameter. Our uncertainty limit of is motivated by similar uncertainty thresholds used in observational studies (e.g. Davis et al., 2011). At , this criterion reduces our sample size by . The majority of the excluded objects are dispersion-dominated ETGs with low gasSF particle counts.
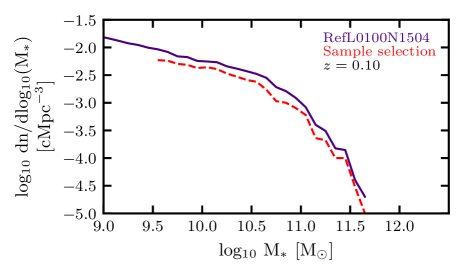
At , this gives us a sample of 5428 galaxies. Similar numbers are obtained at redshifts up to . Overall, the adopted criteria produce galaxy samples that do not show significant bias towards any galaxy mass, for a range of snapshots. For instance, Figure 1 shows the stellar mass function of our final sample at , alongside the total galaxy population in the Ref-L100N1504 reference simulation, which shows that the two populations have a similar mass distribution down to our sample limit.
5 Methodology
5.1 Internal galaxy properties
5.1.1 Star-forming gas and star-forming gas fraction
Observationally, gas kinematics are typically measured by tracing the warm interstellar medium using H. This has been shown to be co-moving with the cold dense phase of the ISM (e.g. Davis et al., 2011). For this work, we assume that the cold gas in a galaxy is described most closely by the properties of the star-forming gas (gasSF) particles in eagle. These are defined as gas particles with a SFR and a minimum density {ceqn}
| (3) |
where is the metal mass fraction (i.e. the gas metallicity). This metallicity-dependant threshold creates a lower threshold for star formation in regions of higher metallicity, as expected by the increased cooling efficiency and shielding provided by dust in enriched gas in the ISM. The exact SFR of gas particles is handled by the subgrid model and described in detail in Schaye & Dalla Vecchia (2008).
We define the star-forming gas fraction of a galaxy as {ceqn}
| (4) |
where , , and are the stellar, gas, and gasSF masses of the galaxy within our kinematic aperture of .
5.1.2 Morphology
We make use of the ratio of the co-rotational kinetic energy fraction, , to distinguish between galaxy morphologies. This describes the ratio of total kinetic energy () that is invested in co-rotation () and is given by {ceqn}
| (5) |
where the sum is over all particles of a given type within a sphere of radius 30 pkpc centred on the minimum potential, is the particle mass, is the net angular momentum, and is the radius from the centre of potential in the plane normal to the rotation axis of the given particle type (Correa et al., 2017). We denote stellar co-rotational kinetic energy fraction as . Similarly, we define the gasSF co-rotational kinetic energy fraction as using all gasSF particles within a sphere of radius .
Correa et al. (2017) found that ‘blue cloud’ discy star-forming galaxies and ‘red sequence’ quiescent spheroidal galaxies can be distinguished using a threshold of for stellar particles in eagle. We use this as a proxy for morphology to distinguish between LTGs with , and ETGs with . Similarly to Jiménez et al. (2023), we find by visual inspection that thin gas discs can be broadly described by .
To characterise the torquing timescale, we make use of a further proxy of galaxy morphology, the stellar ellipticity, which we define as {ceqn}
| (6) |
where and are the major and minor axes of the ellipse, respectively. As opposed to , these use the square root of the eigenvalues of the mass distribution tensor to characterise the morphology of a galaxy within a sphere of 30 pkpc centred on the potential minimum (for details see Correa et al., 2017).
5.1.3 Misalignment angles
We assume the kinematic centre of the galaxy is described by the stellar centre of mass and stellar peculiar velocity within . We additionally impose for both spherical and projected radii to account for artefacts at or near the resolution limit of pkpc.
We assume the kinematics of the particles are captured by the net angular momentum vector. For galaxies meeting our selection criteria, the angular momentum of a component is given by {ceqn}
| (7) |
where the sum is over all particles of a specified type within , is the particle mass, and are the physical position and velocity of the particle, and and are the position and peculiar velocity of the stellar centre of mass within . For dark matter (DM) particles, we extract kinematic properties within a spherical aperture of 30 pkpc.
As we intend to investigate the inherent behaviour and evolution of misaligned disc kinematics, we predominantly work with misalignment angles in three-dimensional (3D) space, as opposed to projected misalignments between position angles (PAs) that are typically used in observational studies. This allows us to measure the relaxation timescales removing the bias of the viewing angle. Misalignment angles are given by the dot product between the angular momentum unit vectors.
We assume the most widely used classification to interpret galaxy kinematics (e.g. Davis et al., 2011), classifying as aligned those galaxies with stellar-gas kinematic angles , misaligned those with angles . Among the misaligned galaxy population, we make a further distinction between unstable misalignments with angles and stable misalignments (i.e. counter-rotation) with angles .
5.2 External properties
We assume that the environment of a galaxy is described by the halo mass, , bound within a radius 200 times the critical density as identified in subfind.
We define galaxy properties related to mergers using the merger trees by Qu et al. (2017). Merger ratios are calculated from values in the merger tree at the point of the maximum stellar mass of the progenitor galaxy within the past 2 Gyr to account for stellar stripping prior to infall (see Rodriguez-Gomez et al., 2015; Qu et al., 2017). We define the mass ratio of a merger as {ceqn}
| (8) |
where and are the stellar masses of the secondary (less massive) and primary (most massive) galaxies, respectively. Major and minor mergers are defined with mass ratios of and respectively. We assume that ratios of are direct accretion events (sometimes called micro-mergers).
5.3 Relaxation times and relaxation paths
5.3.1 Relaxation times
In order to estimate the relaxation time of an unstable misalignment we require galaxies to meet our sample criteria over consecutive snapshots from misalignment formation to relaxation. We also exclude unstable misalignments for which we cannot establish a formation and relaxation point within . By limiting ourselves to galaxies with a complete ‘relaxation window’, we extract a smaller sample of relaxations but are able to establish a more reliable estimate of relaxation times. Additionally, our redshift range naturally places an upper limit on the relaxation time that we can accurately measure in our sample, with approaching the Gyr window between , for a typical ETG.
In previous work using a single galaxy in a zoom-in simulation, van de Voort et al. (2015) define the relaxation time as the time between the formation of the misalignment (an initial sharp peak to ) and the first snapshot with . In contrast, Khim et al. (2021) use a sample of 2177 misalignments with projected PAs at to define the misalignment duration by fitting the remaining fraction of misaligned discs as a function of time. Galaxies are assumed to have relaxed upon first returning back to . While this latter approach is able to mimic observational studies more reliably through the use of PAs, it is explicitly a measure of the duration a galaxy spends misaligned (), rather than the duration a galaxy spends in the unstable misaligned regime. As such, this method does not account for systems that remain in the kinematically stable counter-rotating regime for a considerable time (e.g. Starkenburg et al., 2019).
For this work, we adopt a similar definition and approach as van de Voort et al. (2015), modified for use on a more diverse population of galaxies and misalignments. Our aim here is to generalise relaxation timescales of unstable misalignments for comparison with theoretical predictions (see Section 2), complementing the approach of Khim et al. (2021). As an unstable misalignment may be formed from an existing long-lived counter-rotating system, we define a separate kinematically-stable regime of and . This is motivated by visual inspection of typical galaxies that are found to mostly reside within this regime, with only few outliers caused by random fluctuations. We then require any galaxy leaving the kinematically-stable regime to enter the unstable misaligned regime () in order to be classified as significant deviation from the kinematically-stable regime333Following our existing method, we note that changing the stable regime limits to and , and the unstable misaligned regime to does not meaningfully change our results.. In most cases, the first snipshot in the unstable regime also corresponds to the first snipshot in the unstable misaligned regime. We define the beginning of a relaxation from the first snipshot in the kinematically unstable regime.
As some misalignments may experience a small degree of scatter during relaxation to the stable regime, we introduce a new parameter, the latency time, . This is defined as the minimum amount of time a galaxy must have spent in the stable regime for the unstable misalignment to have truly settled. We set this value to Gyr ( snipshots), again from visual inspection. We define the end of a relaxation as the first snipshot upon returning to the stable regime, so long as the galaxy remains in the stable regime for period of at least another . The relaxation time, , is then defined as the time between the snipshots corresponding to the beginning and end of the misalignment. This gives us an error of approximately Gyr on .
By applying this criterion, we aim to find a balance between extracting numerous short-duration relaxations that may be associated with small fluctuations from a larger overall relaxation, and extracting clearly separate unstable misalignment events as one long relaxation. We demonstrate the reliability of this criterion by showing two example galaxies in Section 6.2 and discuss its implications on our relaxation timescale distribution in Appendix A.
5.3.2 Dynamical and torquing times
Estimates of the and require an estimate of the radius of the gasSF disc. We assume that this radius is broadly described by twice the gasSF half-mass radii () per visual inspection of our sample and from past studies on SF gas discs in eagle (e.g. Hill et al., 2021). We calculate the rotational velocity () assuming a spherical mass distribution at a radius where we have taken into account the stellar half-mass radius () as the aperture of kinematic measurements. This allows us to compensate for galaxies with small gas discs with respect to the aperture of kinematic measurements, as may be found in some ETGs.
The of a galaxy can vary between snipshots due to changes in the gas disc radius and stellar ellipticity. The gas disc radius and stellar ellipticity were found to vary within a standard deviation of between misalignment formation and relaxation in our sample. We express the relaxation time in terms of time passed in Gyr and as normalised values using the the time-averaged dynamical and torquing time taken over the duration of the misalignment, denoted as and , respectively. Following theoretical predictions (see Section 2), normalised relaxation timescales above would be indicative of processes acting to preserve the duration of the misalignment. To account for approximations made, we define long-duration unstable misalignments as those with .
5.3.3 Relaxation paths
Because we define relaxation timescales with respect to galaxies leaving and re-entering the co- and/or counter-rotating regimes, it follows that some unstable misalignments may transition between differing stable regimes. We exclude the meta-stable polar-ring orientation as one of the stable regimes. Indeed, although longer-lived than most misalignment configurations, these are thought to eventually relax into one of the aforementioned long-lived regimes (Tohline et al., 1982; Lake & Norman, 1983). However, because galaxies that transition through this meta-stable regime may be expected to experience longer relaxation times, we choose to distinguish between relaxation paths.
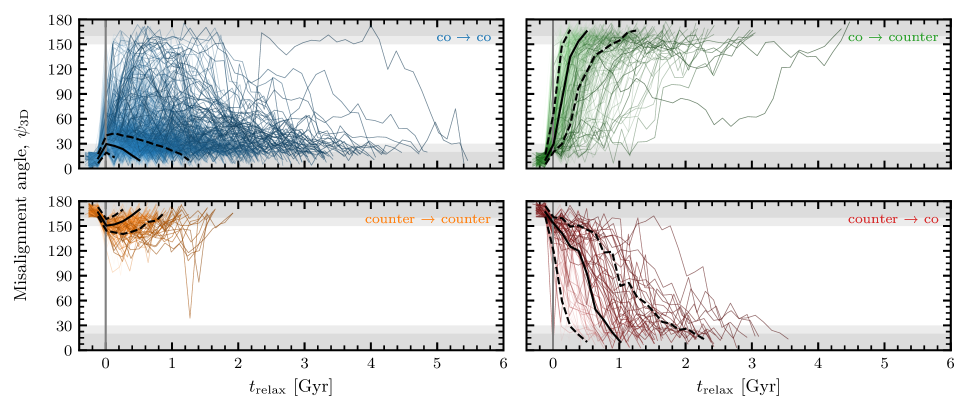
For the majority of our sample, galaxies begin and end in a co-rotating configuration, denoted as co co. However, we also see a variety of other relaxation pathways leading to populations of co-rotating to counter-rotating (co counter), and more rarely counter-rotating to co-rotating (counter co) and counter-rotating to counter-rotating (counter counter) relaxation paths.
5.3.4 Internal galaxy properties during relaxation
Unless stated otherwise, we approximate the internal properties of a galaxy by taking time-averaged values over the duration of the relaxation time. For morphological classifications that may be poorly captured by the time-averaged , we instead consider its morphology pre- and post-misalignment. We take the average for the first Gyr pre- and post-misalignment. We can therefore classify galaxies as a mixture of those that retained their morphological classification before and after misalignment (denoted as e.g. ETG ETG), and those that morphologically transitioned (denoted as e.g. LTG ETG).
6 Results
6.1 Misalignment distributions
For a brief comparison of distribution angles with observations, we make use of projected misalignment angles as viewed from the -axis (), within a projected half-mass radii () in the plane, though our choice of axis is arbitrary as galaxies within eagle have no preferential orientation.
Figure 2 shows the projected and 3D misalignment distributions for LTGs (top) and ETGs (bottom) at , with uncertainties given as Poisson errors. For values in projection, we find of ETGs and of LTGs display stellar-gas kinematic misalignments. Both the fractions of misalignments and the general shape of the misalignment distributions are in good agreement with recent observational results by Bryant et al. (2019). These were obtained using the SAMI galaxy survey (Croom et al., 2012; Bryant et al., 2015), with observational misalignment fractions of (ETG) and (LTG), but with a stellar mass range extending a larger range of galaxy masses M⊙. Our results are also in good agreement with a number of other observational studies (e.g. Davis et al., 2011; Barrera-Ballesteros et al., 2014, 2015; Chen et al., 2016; Jin et al., 2016; Ristea et al., 2022; Raimundo et al., 2023), as well as with predictions from cosmological simulations (e.g. Khim et al., 2020; Casanueva et al., 2022).
We find a small peak in the counter-rotating region for both morphologies, with projected counter-rotating fractions of and for ETGs and LTGs, respectively. These were not reported in previous results in eagle (see Casanueva et al., 2022), or in the horizon-agn simulation (see Khim et al., 2020). We visually inspected our sample of misalignments and confirmed these systems to be physical and misaligned in both 3D and projection. As a whole, we find counter-rotation present in of our sample. To test the significance of this result, we perform a Kolmogorov–Smirnov (KS) test in the range and compare this to a uniform distribution in the same range. We obtain KS-statistic and p-value for ETGs and KS-statistic and p-value for LTGs, indicating a statistically significant population of counter-rotators.
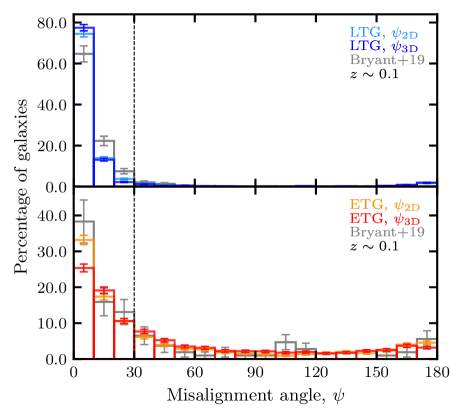
We find a 3D misalignment fraction of for ETGs and for LTGs. The overall shape of the misalignment distribution is similar to that of projected values, being almost identical for LTGs but with a smaller fraction of aligned ETGs in the range . We also see a small decrease in the fraction of counter-rotating systems when measured in 3D, but the number of counter-rotating systems remains significant with respect to to a uniform distribution using a KS test. These results suggest that although bias from projected viewing angles can inflate the number of aligned ETGs, the use of projected angles does not affect the overall shape or significantly reduce the number of misaligned systems.
Notably absent from our results is a small peak in the polar () regime, found in observational results by Bryant et al. (2019). As explained in Khim et al. (2020), this may be due to the resolution limit of pkpc that is used for force calculations in many cosmological simulations. For galaxies with radii pkpc, this leads to significantly thicker overall discs in relation to their extent (known as the ‘thin disc’ problem in simulations; e.g. Trayford et al., 2017). For galaxies that are residing in the polar regime, their relative stability comes from the symmetrical torques experienced by their thin discs. However, with a disc thickness of pkpc, it may become harder to achieve this symmetry and thus meta-stability, with these systems therefore decaying faster when compared to real galaxies.
To justify our decision to consider both the co-rotating and counter-rotating regimes as stable, we show in Figure 3 how the fraction of aligned, misaligned, and counter-rotating systems varies for all snipshots between . We consider the morphology independently and percentages are given with respect to the total number of galaxies of that morphological sub-sample.
For both ETGs and LTGs we see a slight upward trend in the misalignment fraction toward . This increase appears to result overwhelmingly from the build-up of long-lived counter-rotating systems. This is seen most clearly for ETGs, in which the increase in misalignment fraction is captured by an increase in counter-rotating fraction. The build-up of these systems appears to indicate that counter-rotating systems are in fact long-lasting and dynamically stable, in agreement with theoretical predictions (Tohline et al., 1982; Lake & Norman, 1983). We thus decide to treat these as a separate stable regime among the misaligned galaxy population. Some fraction of these systems may return to a co-rotating state upon another stochastic gas accretion event or undergo an apparent stellar angular momentum flip as the gasSF forms a counter-rotating stellar disc that becomes dominant. For this latter process to occur, however, the masses of the counter-rotating gas and the stars have to be similar and the system must remain counter-rotating for long enough to form a dominant population of counter-rotating stars (for an observational counterpart see e.g. NGC 4550; Rubin et al., 1992; Rix et al., 1992; Wiklind & Henkel, 2001). We note that we see these apparent stellar angular momentum flips for several of our galaxies, as shown and discussed in Section 6.2.
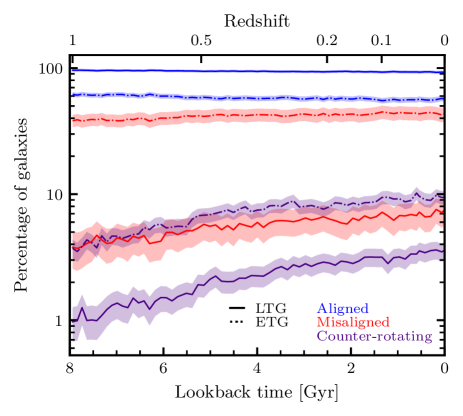
The longevity of counter-rotating systems in eagle is also in agreement with results obtained using other cosmological hydrodynamical simulations, such as those reported by Starkenburg et al. (2019). They used the IllustrisTNG (Nelson et al., 2019) hydrodynamical simulations to investigate the longevity of counter-rotating systems, finding these to be long-lasting relative to other orientations. We note that carrying out a detailed analysis of this behaviour is beyond the scope of this work.
6.2 Formation and relaxation process of stellar-gas kinematic misalignments
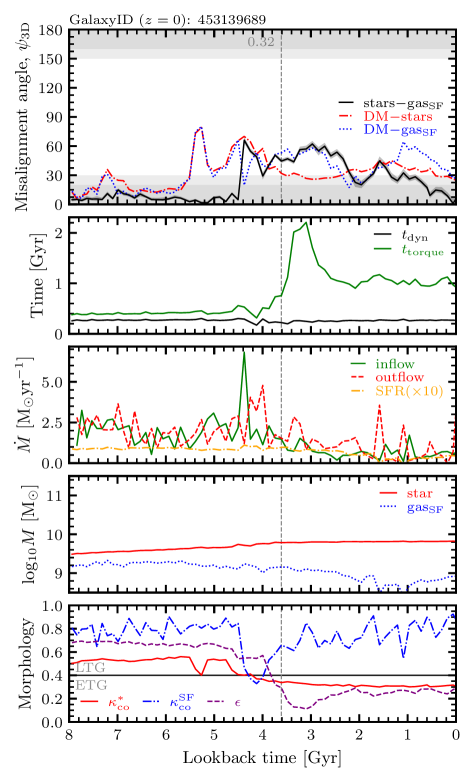
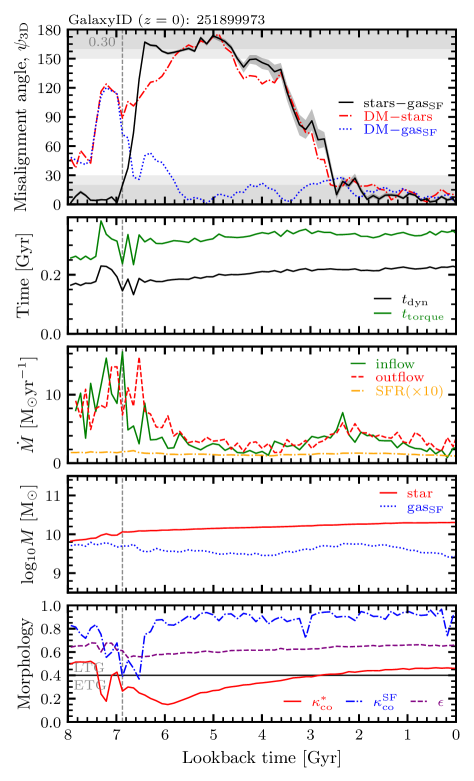
To highlight an example of a long-lived unstable misalignment and to illustrate our method involving the identification and extraction of unstable misalignment timescales, we provide examples of two galaxy evolutions in Figure 4. Both galaxies experience at least one unstable misalignment with a relaxation time Gyr. These galaxies were selected for their interesting stellar-gasSF kinematic evolution and the longevity of their unstable misalignments (as detailed below). We stress that the exceptionally long relaxation times of the two selected galaxies tend to be a rarity among our sample, as we discuss in detail in Section 6.3.
Galaxy A (left panels of Figure 4) is a relatively low-mass galaxy with M⊙ at and with a single long-duration unstable misalignment starting at a lookback time Gyr. Around 1 Gyr before the unstable misalignment, this galaxy experiences a close encounter with a lower-mass satellite which decouples the angular momentum of the galaxy from its wider DM halo (as seen from the DM-stars and DM-gasSF misalignment angles illustrated in the top-left panel of Figure 4). The galaxy remains marginally misaligned with its dark matter halo for the remainder of its evolution, with an average stellar-DM misalignment angle of . A second close fly-by strips a large amount of gas from the satellite which accretes onto the central galaxy (seen as a sharp increase in gas inflow rate), forming the unstable misalignment. This unstable misalignment remains at before beginning to show signs of relaxation at Gyr, eventually settling into the stable co-rotating regime at Gyr with a Gyr. Expressed in terms of time-averaged and we find , indicating this unstable misalignment has persisted for significantly longer than predicted by a purely dynamical settling time.
While in the process of relaxing, the galaxy undergoes a major merger with the previously gas-stripped satellite at Gyr (horizontal dashed line in the left panels of Figure 4) with a stellar mass ratio of . While this merger does not substantially change , it causes a significant morphological transformation from an LTG to an ETG (seen as a decrease in ; bottom-left panel of Figure 4) and a decrease in the stellar ellipticity. This drives a significant and permanent increase in and helps drive an overall longer relaxation time. This behaviour is not uncommon among other long-duration unstable misalignments. We find a decrease in stellar ellipticity between pre- and post-unstable misalignment formation is seen in of Gyr relaxations. Despite the increase in to Gyr, the galaxy remains unable to fully relax for another Gyr.
| Relaxation path | Relaxation time | |||||
| All | LTG LTG | ETG ETG | ||||
| Median | SD | Median | SD | Median | SD | |
| (Gyr) | ||||||
| All | 0.50 | 0.64 | 0.38 | 0.36 | 0.51 | 0.68 |
| co co | 0.47 | 0.66 | 0.31 | 0.34 | 0.51 | 0.68 |
| counter counter | 0.43 | 0.38 | 0.36 | 0.22 | 0.49 | 0.40 |
| co counter | 0.51 | 0.57 | 0.43 | 0.39 | 0.68 | 0.65 |
| counter co | 1.03 | 0.86 | 0.40 | 0.40 | 1.15 | 0.85 |
| All | 3.15 | 5.07 | 2.50 | 3.47 | 3.34 | 5.29 |
| co co | 2.75 | 5.11 | 1.87 | 3.53 | 3.06 | 5.22 |
| counter counter | 3.11 | 2.93 | 2.56 | 1.72 | 3.11 | 3.19 |
| co counter | 4.45 | 4.48 | 3.66 | 3.24 | 5.33 | 4.74 |
| counter co | 9.32 | 7.54 | 3.76 | 3.93 | 10.5 | 7.85 |
| All | 1.41 | 2.09 | 1.38 | 1.95 | 1.36 | 2.01 |
| co co | 1.21 | 1.94 | 1.01 | 1.87 | 1.22 | 1.84 |
| counter counter | 1.45 | 1.45 | 1.27 | 1.03 | 1.44 | 1.56 |
| co counter | 2.41 | 2.09 | 2.14 | 1.94 | 2.59 | 1.70 |
| counter co | 4.69 | 3.66 | 2.43 | 2.43 | 4.86 | 3.80 |
Galaxy B (right panels of Figure 4) shows a very different overall kinematic evolution. Analogous to Galaxy A, this galaxy becomes misaligned with respect to its DM halo shortly before a gas-rich major merger () at Gyr. This merger feeds an inflow of gas to the inner , disrupting the existing gasSF and causing it to settle quickly into a retrograde disc in the short timescale of Gyr . The galaxy remains in a counter-rotating configuration for Gyr. During this time, the retrograde cold gas forms a new counter-rotating component of younger stars alongside the existing older co-rotating stars. This is seen from the steady decrease in gasSF mass and a corresponding increase in stellar mass, together with an increase in stellar co-rotational energy transforming the system back into a rotationally-supported LTG over Gyr. Starting at Gyr, we begin to see an increase in the uncertainty in the stellar-gasSF misalignment angle. This marks the turning point at which the angular momentum of the two stellar components compete over dominance, beginning the second unstable misalignment and realignment into a co-rotational state. This stellar net-angular momentum flip (traced both by the stellar-gasSF angle and stellar-DM angle; see the top-right panel of Figure 4) occurs gradually, as reflected by the long relaxation time Gyr , starting at Gyr.
While both galaxies undergo mergers that coincide with their unstable misalignments, we only attribute a merger origin explicitly to the first unstable misalignment in Galaxy B. Both galaxies also show a prior DM halo decoupling preceding the formation of the misalignment, owing to previous galaxy interactions. As discussed later in Section 6.4, we find that mergers tend to be sub-dominant in the formation of misalignments among our sample.
6.3 Relaxation timescale distributions
Using our selection criteria (see Section 5.3.1) we extract a sample of 3154 unstable misalignment relaxations between . We include each instance of an unstable misalignment separately, even if these occur in the same galaxy (such as Galaxy B described in Section 6.2). Median values and statistics are found in Table 2 and Table 3.
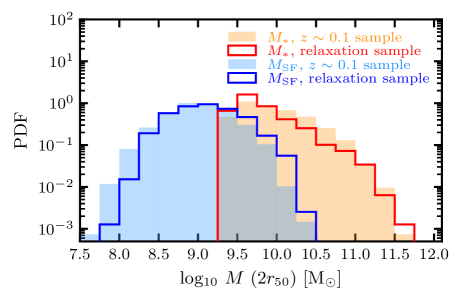
As illustrated in Figure 5, this sample has a stellar and gasSF mass broadly representative of the sample used at , with a small bias towards higher gasSF masses and thus gasSF fractions. This is in part due to the earlier redshifts covered, and partially as a consequence of requiring consecutive snipshots meeting our sample criteria for the duration of the unstable misalignment. In the case of the latter, this removes many galaxies that briefly fall below the minimum gasSF particle count whilst unstably misaligned.
6.3.1 The total galaxy population
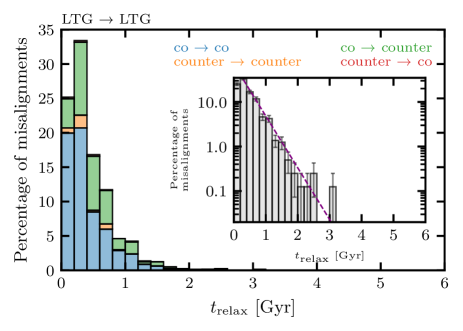
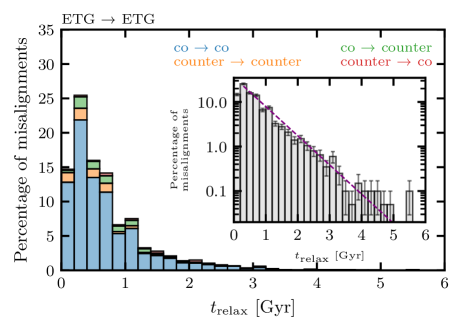
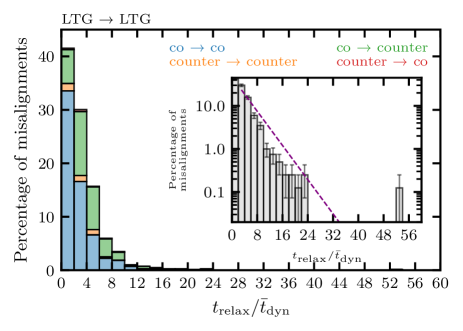
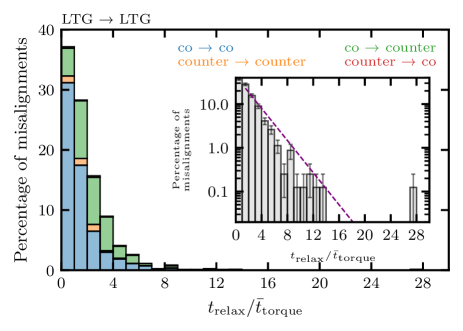
Galaxies in eagle display a variety of relaxation times and pathways (see Figure 7 below). Figure 6 shows the distributions of relaxation times (top), and normalised relaxation times in terms of (middle), and as (bottom) for our total sample of unstable misalignment relaxations. The majority of unstable misalignments in our sample tend to be fairly short-lived, with median relaxation times of Gyr .
Due to time resolution limitations, we naturally underestimate the number of very short-duration unstable misalignments that occur over less than 2 successive snipshots ( Gyr), as seen from the first bin of the top plot in Figure 6. Ignoring this bin, we find unstable misalignment distributions to be described by an approximately log-linear distribution of relaxation timescales (inset figures in Figure 6 with best-fit values given in Table 4). These results (especially the shape of the distribution) suggest that while some galaxies appear to experience unstable misalignments lasting longer than those predicted by theory (Tohline et al., 1982; Lake & Norman, 1983), the majority of unstable misalignments are associated with relaxation times governed by a fast settling time in the absence of ongoing smooth accretion.
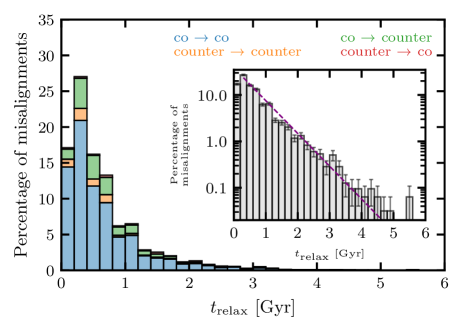
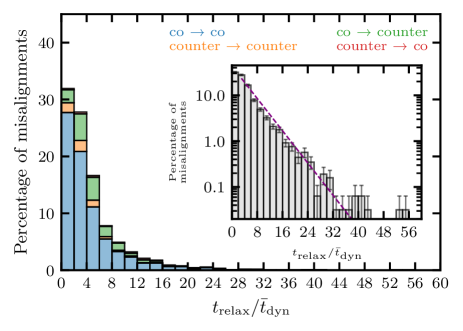

Focusing on the tail-end of the distributions, we find a moderate population () of unstable misalignments persisting for Gyr, with only a handful of examples exceeding . Additionally, we find () instances of unstable misalignments with Gyr (two of which are shown and discussed in Section 6.2) that are approximately of similar duration to the galaxy investigated by van de Voort et al. (2015) in the fire simulations (Hopkins et al., 2014). The population of long-duration unstable misalignments becomes a little clearer when expressed as , with of relaxations lasting more than three times longer () than expected from a purely dynamical relaxation (see Section 2). We note that while our relaxation selection method identifies two unstable misalignments with exceptionally enhanced relaxation timescales of , closer inspection reveals these to be systems that spent considerable time ( Gyr) near the stable counter-rotating regime without settling. We attribute these outliers to the consequences of choosing a non-zero latency time.
| Relaxation type | All | LTG LTG | ETG ETG | |||
| N | N | N | ||||
| All | 3154 | 1.00 | 802 | 1.00 | 2007 | 1.00 |
| co co | 2403 | 0.76 | 501 | 0.62 | 1669 | 0.83 |
| counter counter | 181 | 0.06 | 30 | 0.04 | 137 | 0.07 |
| co counter | 499 | 0.16 | 262 | 0.33 | 146 | 0.07 |
| counter co | 71 | 0.02 | 9 | 0.01 | 55 | 0.03 |
| Relaxation (sub-)sample | |||
| (Gyr) | |||
| All | |||
| LTG LTG | |||
| ETG ETG | |||
6.3.2 Relaxation timescales with relaxation paths
The large majority of unstable misalignments return to their original stability regime with co co and counter counter relaxation paths making up and of our sample respectively (see Table 3). Co counter relaxations make up , while we find only 71 instances () of counter co relaxations. Given that only of galaxies in our sample at a given snipshot are counter-rotating, it is unsurprising that we find significantly fewer unstable misalignments originating from the counter-rotating stable regime.
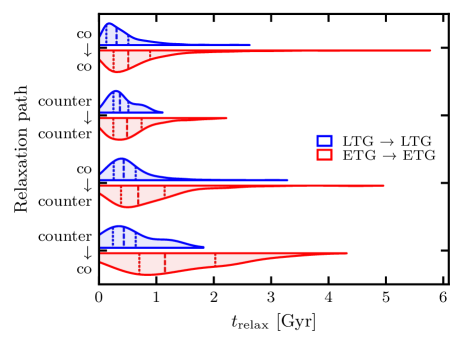
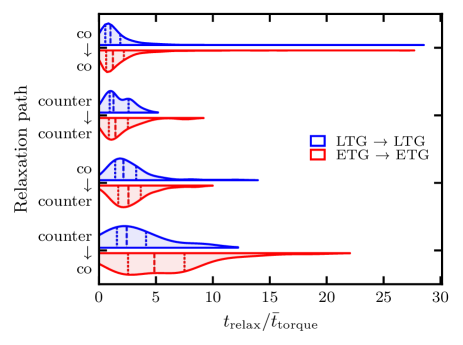
In Figure 7 we visualise the relaxation paths for our total relaxation sample alongside their respective median pathways. We find the relaxation time to vary depending on the relaxation path taken (Table 2). Unstable misalignments that returned to their original stability regime (co co and counter counter) tend to relax faster while unstable misalignments that end up transitioning between stability regimes (co counter and counter co) tend to be longer in duration. This trend is also seen for normalised relaxation timescales. Expressed in terms of , we find relatively short median relaxation timescales for co co () and counter counter () relaxation paths, and relatively long median relaxation timescales for co counter () and counter co ().
This result is not surprising given an unstable misaligned gas disc displaced by a larger angle from being coplanar with the stellar disc must dissipate more angular momentum to relax (see Appendix 2 of Bryant et al., 2019). We briefly highlight this behaviour using our sample of co co and counter counter relaxations in Figure 8, as these paths return to the original stability regime from which they were displaced. This allows us to characterise a maximum displaced angle from coplanarity with the stellar disc (i.e. for co co and for counter counter relaxations).
We see a clear positive relationship between the relaxation time and the displaced angle up to , showing that unstable misalignments displaced by a larger amount from the nearest stability regime will take longer to relax. We also see a population of unstable misalignments that return to their original stability regime despite being displaced angles of . To first order, unstable misalignments are expected to relax toward the nearest stable regime. This population of unstable misalignments displaced by is, therefore, indicative of additional processes acting on the gas (e.g. smooth misaligned accretion) that prevent it from relaxing toward the nearest dynamically stable regime. Unstable misalignments displaying this behaviour tend to show significant enhancements to their relaxation timescales with .
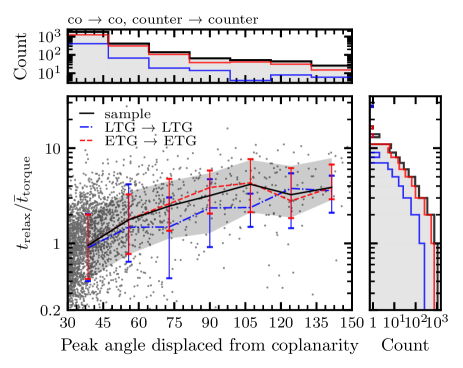
We see from Figure 7 that co co and counter counter relaxation paths show similar behaviour and the majority are displaced by only a small angle from the stable co- and counter-rotating regimes, respectively. As small displacements require less angular momentum dissipation, shorter relaxation timescales are expected for the average co co and counter counter relaxation paths in our sample. For instance, the large majority () of relaxations are displaced by an angle of from coplanarity.
For relaxations that transition between stable regimes, this automatically involves displaced angles of . As more angular momentum must be dissipated in order to relax into one of the stable regimes, co counter and counter co relaxation paths are expected to return longer relaxation timescales. We also see that co co and counter counter relaxations follow similar paths. This makes sense as eagle models stellar particles as non-collisional. Thus, to first order, co-rotating and counter-rotating systems can be considered dynamically-equivalent from the perspective of a misaligned gas particle in a polar orbit.
Interestingly, we do not see the same similarity between co counter and counter co relaxation paths, with the latter taking significantly longer to relax back into a co-rotating state. From visual inspection of our sample of 71 counter co misalignments, we find that over half are likely driven primarily through changes in the net stellar angular momentum rather than explicit gas-disc relaxations (as found in Galaxy B in Figure 4). These ‘apparent’ relaxations would be expected to relax on timescales on the order of Gyr, governed by the rate of conversion of counter-rotating star-forming gas into a dominant population of counter-rotating stars. This process is largely exclusive to counter co relaxations given that it requires a substantial counter-rotating gas reservoir to begin with.
6.3.3 Morphological dependence on relaxation timescales
We established in Section 6.1 that there is a significant morphological dependence on the fraction and shape of the misalignment distributions in eagle, echoing prior observational results (e.g. Bryant et al., 2019; Ristea et al., 2022; Casanueva et al., 2022). We therefore also consider a possible morphological difference in relaxation time distributions and composition of relaxation paths between ETGs and LTGs. Henceforth we refer to ETG relaxations as those that explicitly begin and end their relaxation as ETGs (denoted as ETG ETG), and similarly for LTGs (see Section 5.3.4 for details). We find a total of 802 LTG and 2007 ETG relaxations in our sample (see Table 3), with the remaining 345 classified as having transitioned between morphologies after relaxation.
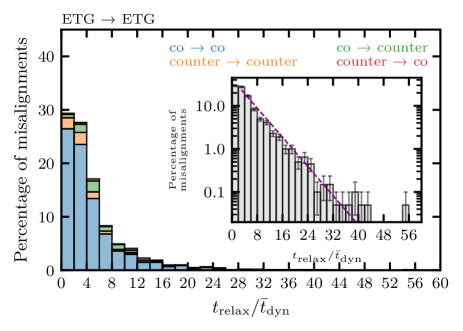
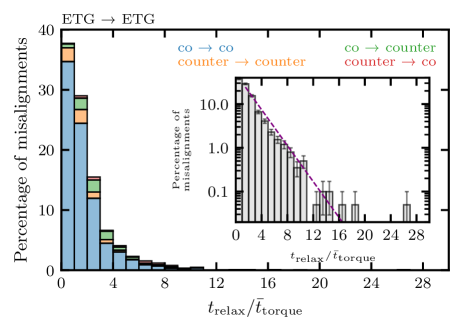
In Figure 9, we show the relaxation time and normalised relaxation time distributions split according to morphology. Median and standard deviations for these distributions are listed in Table 2. We find some notable differences between LTG and ETG relaxation distributions, though both continue to be best described by log-linear distributions (see Table 4). ETGs show on average longer relaxation times ( Gyr) compared to LTGs ( Gyr), with a shallower log-linear best-fit relationship. This distinction between ETGs and LTGs becomes weaker once the relaxation time is normalised in terms of and , taking into account the impact of stellar morphology on the theoretical relaxation timescales.
To test for significance between these distributions, we run a two-sample KS test between LTG and ETG distributions. We find significant results for (KS-test statistic , p-value ), with a decreasing significance for (KS-test statistic , p-value ). We find no significant difference between morphologies in terms of (KS-test statistic , p-value ). This likely encapsulates the greater ability of to account for dynamical and morphological properties of galaxies. We find no changes in the significance of the results using a stricter morphological classification of for ETGs and for LTGs.
Interestingly, while the shape of the distributions and the gradient of the log-linear relationship describing the distribution is similar between morphologies, the composition of relaxation paths is different (as seen clearly in Figure 9, with compositional fractions in Table 3). For instance, co counter relaxations constitute of detected LTG misalignments, compared to only in ETGs. The longer inherent relaxation times of co counter relaxation paths (as highlighted in Section 6.3.2) dominate the tail-end of the distributions for LTGs. This tends to increase the overall median relaxation time of LTGs ( Gyr).
At first glance, this path dichotomy between ETGs and LTGs appears unusual considering we also see times the number (262) of co counter relaxations in LTGs compared to ETGs, but this is not seen for any other relaxation path (see Table 3). This is despite our sample containing more than double the number of ETGs compared to LTGs. These results may suggest that LTGs preferentially transition between regimes, more so than ETGs. This seems unintuitive at first glance, given the typically larger gas discs in LTGs sets a larger angular momentum threshold needed to be overcome by accreting misaligned gas (Khim et al., 2021). This, in turn, should make these systems more resilient to larger misalignments that may cause the gas disc to become counter-rotating.
A physical explanation may lie in the underlying differences in size and mass of the gasSF disc between morphologies. Given LTGs typically host larger star-forming gas discs, this sets a larger gas accretion threshold for the formation of unstable misalignments. This likely lowers the relative number of co co misalignments that are otherwise common among ETGs. This could suggest larger stochastic accretion events such as gas-rich mergers or accretion through galaxy interactions are be responsible for many of these misalignments in LTGs.
LTGs and gas-rich galaxies are also found to preferentially reside in field and group environments (Dressler, 1980). Compared to virialized clusters (which are dominated by ETGs and gas-poor galaxies), galaxy interaction rates are expected to be higher in group environments (with the exception of the central massive galaxy). Likewise, the larger gas discs found in many LTGs create larger collisional cross-sections for gas stripping and mass exchange during close encounters with nearby gas-rich satellites. These encounters can significantly perturb the outskirts of the gas disc, which can manifest as an observable stellar-gas misalignment (e.g. Lu et al., 2021; Khim et al., 2021). As gas accretion from galaxy encounters can be more stochastic and violent (compared to the smooth accretion of e.g. halo cooling), these encounters may have a greater likelihood to flip the star-forming gas disc into a counter-rotating state, which disproportionately affects LTGs. This may hint at an underlying difference in drivers of misalignments between morphologies depending on the large-scale environment.
6.3.4 Relaxation paths and morphology
In Figure 10 we compare the relaxation times of individual relaxation paths between morphologies. Considering relaxation paths separately, we see a trend toward longer median relaxation times in ETGs compared to LTGs (see Table 2). For the dominant co co relaxation paths in our sample, ETGs take times longer to relax compared to LTGs. Testing for significance between morphologies in terms of returns significant results for each path; co co (KS-test statistic , p-value ), counter counter (KS-test statistic , p-value ), co counter (KS-test statistic , p-value ), and counter co (KS-test statistic , p-value ).
While we found no significant difference between morphologies in the overall normalised relaxation time distributions in terms of (see Section 6.3.3), we do find a difference when co co relaxation paths are considered separately. For co co relaxation paths, ETGs experience times longer normalised relaxation times compared to LTGs and this result is significant (KS-test statistic , p-value ). Median co counter relaxation paths in ETGs are also longer compared to LTGs in terms of . However, this result narrowly falls outside of being significant (KS-test statistic , p-value ). The remaining relaxation paths do not show any differences between ETGs and LTGs that return significant KS-test results.
These results suggest that differences in overall median relaxation time values for ETGs and LTGs are driven in large part by morphological differences in the mass distributions of these systems. However, at least for co co relaxation paths, we see a small preference toward processes preferentially preserving unstable misalignments in ETGs. As these constitute a large fraction () of the overall relaxation sample, this may help account for the morphological dichotomy in the instantaneous misalignment distributions (see Section 6.1).
6.3.5 Gas fraction dependence on relaxation timescales
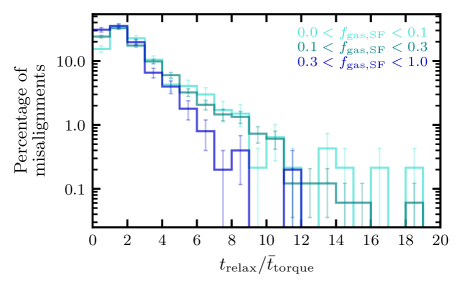
In Figure 11 we show the variation in normalised relaxation time for a range of gasSF fractions within , independent of morphology. Henceforth we exclude short-duration unstable misalignments close to the resolution limit (i.e. Gyr), due to the incompleteness and the larger uncertainties associated with relaxation timescales in this range. We retain a sample of 2614 relaxations, of which 466 lie within , 1646 within , and 502 within .
We see a trend toward longer-duration unstable misalignments for lower . This is seen clearly between the middle and highest sub-samples (two-sample KS-test statistic and p-value ), and less strongly for the lowest and middle sub-samples (two-sample KS-test statistic and p-value ). This is also reflected in the median normalised relaxation times, with medians of , , and for increasing sub-samples. These results are unchanged when considering only co co and counter counter relaxations, and we conclude that bias from different relaxation path compositions is negligible. We expect these results to correlate with morphology because ETGs in eagle typically host lower star-forming gas fractions compared to LTGs (e.g. Casanueva et al., 2022), echoing existing observational results (see e.g. Ruffa et al., 2019a, b).
We attribute the observed anti-correlation between and ratios to the lower gas disc angular momentum of gas-poor systems. These systems are affected more strongly by accretion onto the gas disc that may supply sufficient angular momentum through smooth accretion in order extend the lifetime of an unstable misalignment. If this smooth accretion is predominantly supplied by halo cooling (from a misaligned gaseous halo) we could expect longer normalised relaxation timescales in systems with 1) higher halo cooling (typically those with a higher halo mass) and 2) that have experienced more galaxy mergers and interactions (needed to misalign the halo). Both of these are preferentially found in ETGs. Indeed, galaxies in the range are predominantly gas-poor ETGs.
It is worth noting that our strict criterion for relaxations creates a bias toward higher . This significantly reduces the number of gas-poor systems in our sample with , which may otherwise show even longer unstable misalignment durations.
6.3.6 Central vs satellite galaxy dependence on relaxation timescales
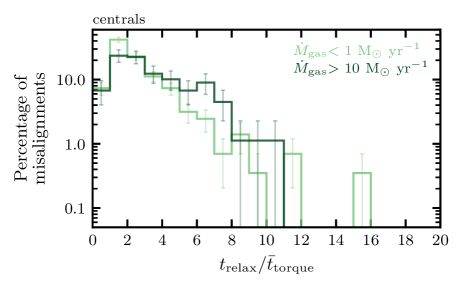
To investigate the effect of the environment on the relaxation distributions, we use 2470 relaxations for which the central or satellite galaxy classification remains unchanged for the duration of . The application of this criterion returns 1699 centrals and 711 satellites.
We find a small trend toward longer normalised relaxation times in central galaxies compared to satellite galaxies with median relaxation times of and , respectively (not shown). Comparing the distributions of normalised relaxation times between central and satellite galaxies we find this difference is significant (two-sample KS-test statistic and p-value ).
These results indicate that central galaxies appear to be more prone to additional physical processes extending the lifetimes of their misaligned gas compared to satellite galaxies.
6.3.7 Ongoing gas inflow rate dependence on relaxation timescales
Ongoing accretion has been shown to extend the lifetime of an unstable misalignment beyond theoretical predictions (e.g. van de Voort et al., 2015). Here, we aim to verify whether this behaviour is also present in eagle.
We estimate the ongoing gas inflow rate by tracing gas particles entering a sphere with a radius of . This allows us to consider gas accretion onto gas discs that extend beyond our kinematic aperture (). From visual inspection, we ignore the gas inflow over the first 0.3 Gyr post-formation, which sets a lower limit of Gyr. This allows us to largely ignore the initial gas accretion that may have formed the misalignment and focus on ongoing gas accretion. We time-average the gas inflow rate, , for the remainder of the relaxation. We limit our analysis to central galaxies because a significant proportion of unstable misalignments in satellite galaxies are likely affected by gas-stripping (e.g. ram-pressure stripping; Khim et al., 2021) rather than gas accretion. We use 1148 relaxations for which the central galaxy classification remains unchanged for the duration of and for which the ongoing gas inflow rates can be estimated. Of these, 286 have ongoing gas accretion rates of M⊙ yr-1, 773 lie within M⊙ yr-1, and 89 have higher ongoing accretion rates of M⊙ yr-1.
In Figure 12 we show how the normalised relaxation time varies with the time-averaged ongoing gas inflow rate (where we have omitted the intermediate inflow range for clarity). Central galaxies with higher gas inflow rates show longer-lived unstable misalignments. We find median normalised relaxation times of , , and for M⊙ yr-1 to M⊙ yr-1 to M⊙ yr-1, respectively. This effect is seen most clearly in the range . The difference between the lower and higher inflow galaxies result is significant (two-sample KS-test statistic and p-value ). Further splitting the sample among ETGs and LTGs reveals the significance of this result to be driven primarily by central ETGs rather than central LTGs (not shown). Averaging the gas inflow rate after a longer time since initial misalignment formation (e.g. Gyr) strengthens the dichotomy between low- and high-inflow unstable misalignments.
These results suggest that galaxies experiencing higher ongoing gas accretion onto a misaligned gas disc can have their relaxation timescales enhanced. However, due to the resolution limitations of large-scale cosmological simulations, we caution against this result as a conclusive indicator of a relationship between enhanced relaxation times and ongoing inflow rates.
6.3.8 Environmental dependence on relaxation timescales
Finally, smooth accretion from misaligned halo cooling has been suggested as both a formation path of misalignments (e.g. Lagos et al., 2015), and a means to extend the lifetimes of an existing unstable misalignment (e.g. Bryant et al., 2019). Thus, we consider the effects of overall environment density on the relaxation distribution by using the halo mass, , as a proxy. These results are shown in Figure 13.
We limit ourselves to central galaxies for this analysis as gas cooling from a hot halo will primarily accrete onto the central galaxy (e.g. Fabian et al., 1984; Negri et al., 2014; Gaspari et al., 2017). We consider two mass ranges broadly corresponding to low-mass halos ( M⊙) and intermediate to high-mass halos ( M⊙). This provides a sample of 1699 relaxations with sub-sample sizes of 1615 (low-mass) and 84 (intermediate/high-mass). Because we find only 2 instances of central cluster galaxies (assumed to be M⊙), we only distinguish between low- and intermediate-mass environments.
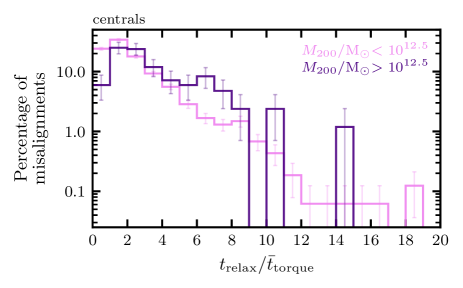
We find a strong and significant difference between the two halo masses considered (two-sample KS-test statistic and p-value ) showing a positive correlation between halo mass and the normalised relaxation time (in terms of ). This is seen in both the overall shape of the distributions in Figure 13 and in the median relaxation times which correspond to (low-mass) and (intermediate/high-mass). Low-mass halos are dominated by short-duration normalised relaxation times, suggesting processes that preserve unstable misalignments (e.g. smooth accretion) are rare in this mass regime. On the other hand, intermediate/high-mass halos have a considerably flatter distribution and dominate the long-duration normalised relaxation timescales beyond . This behaviour becomes more pronounced when considering central galaxies with M⊙ (not shown).
Although not shown, we also find a strong positive relationship between normalised relaxation times (in terms of ) and stellar mass within . increases from 1.6 to 2.5 to 3.7 for mass ranges of M⊙, M⊙ M⊙, and M⊙, respectively. Again, these results are largely unchanged when considering only co co and counter counter relaxation paths.
Together, these results point toward halo cooling (from misaligned halos) being an important driver of long-duration misalignments in higher-mass systems in eagle. However, we stress that a more thorough analysis needs to be done to confirm the significance of accretion from misaligned halo cooling as a driver of misalignments within eagle and similar cosmological simulations.
6.4 Incidence of mergers with misalignment formation
In this section, we briefly explore the incidence of mergers with the formation of unstable misalignments. For this analysis, we consider galaxies with M⊙ in order to more accurately resolve minor mergers in the merger tree. This gives us a sample of 718 relaxations, with statistics given in Table 5. The behaviour of median values for ETGs and LTGs are comparable to those of our original sample, with a trend toward a larger and flatter distribution of and as expected from our results in Section 6.3.8.
The incidence of mergers and the formation of unstable misalignments will be sensitive to the time window over which we associate these two events. We search for mergers with stellar mass ratios of within windows of 0.4 Gyr, 0.6 Gyr, and 1.0 Gyr centred on the first snipshot to enter the unstable [] regime. As galaxies tend to become unstably misaligned quickly, this snipshot overwhelmingly coincides with the first unstable misalignment []. Focusing primarily on the 0.6 Gyr window size, we aim to capture unstable misalignment formations that are explicitly associated with a direct merger origin (such as the first unstable misalignment in Galaxy B in Figure 4) and exclude unstable misalignment formations associated with an accretion event from an initial fly-by (such as Galaxy A in Figure 4). By setting this window to 0.6 Gyr we search for mergers within snipshots on either side of the kinematic instability. This gives us a small degree of flexibility with regard to the exact timing of the merger according to the existing merger trees, and gives the gas a short window within which to settle and form an unstable misaligned disc. As minor merger signatures are typically visible for Gyr, we reason that any unstable misalignments associated with mergers in our sample would likely be classified similarly in optical counterparts.
| Relaxation timescales | All | LTG LTG | ETG ETG | |||
| Median | SD | Median | SD | Median | SD | |
| (Gyr) | 0.38 | 0.62 | 0.26 | 0.34 | 0.48 | 0.72 |
| 3.47 | 6.03 | 2.71 | 4.57 | 3.95 | 6.75 | |
| 1.87 | 2.86 | 1.59 | 2.54 | 1.85 | 3.04 | |
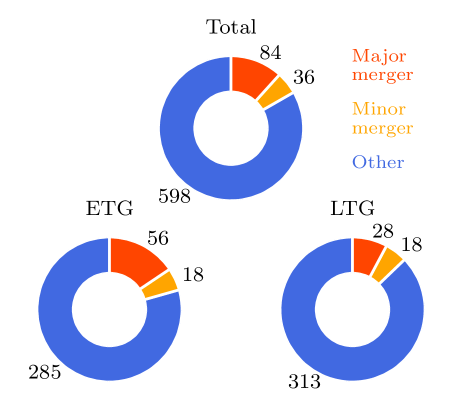
In Figure 14 we visualise the fraction of unstable misalignments associated with major and minor mergers for our 0.6 Gyr window according to our total sample and with the morphology before any misalignment (e.g. ETG LTG relaxations are classified under ‘ETG’). In total, of our sample is associated with a merger origin, with major mergers () dominating this fraction over minor mergers () in both morphologies. Of these, unstable misalignments in ETGs show slightly higher merger-origin fractions () over LTGs () which may be due to ETGs being more susceptible to misalignments from stochastic external accretion owing to lower gasSF fractions. Changing the window size does not change the relative proportions of major and minor mergers nor the higher incidence in ETGs, but does affect the incidence of mergers with and for windows of size 0.4 Gyr and 1.0 Gyr, respectively. These results imply that major mergers are more effective at driving unstable misalignments than minor mergers, as the latter may lack sufficient gas to meaningfully change the angular momentum of the in-situ gas.
We conclude that galaxy mergers are not the primary driver behind stellar-gas misalignments in eagle galaxies. This once again points toward significant contributions of other processes that form unstable misalignments, which are in agreement with results from Casanueva et al. (2022). However, given that misaligned halos are often associated with galaxy encounters and mergers (e.g. Bett & Frenk, 2012), external processes may remain dominant in misalignment formation but these may only be weakly connected temporally.
6.5 Discussion and comparison to existing results
One of the key issues in this field in recent years has been the inability of current models to accurately reproduce the observed misalignment distribution at (e.g. Lagos et al., 2015; Davis & Bureau, 2016). In this section, we put our results in the context of the proposed solutions to this discrepancy.
As explored in detail in Davis & Bureau (2016), assuming misalignments to be formed primarily through mergers alongside theoretical relaxation timescales (in the absence of smooth gas accretion), analytical models significantly overproduce the fraction of counter-rotating (relaxed) ETGs and under-produce the fraction of unstable misaligned (un-relaxed) ETGs (Davis & Bureau, 2016). While shorter gas depletion timescales can be invoked to reproduce observed distributions, such that a misaligned disc is depleted before it can relax, this solution is not favoured. This is because it requires both a significantly higher merger rate ( times larger than predicted from CDM) to supply frequent misaligned gas alongside a higher efficiency of processes to deplete it (e.g. increased AGN activity or star-formation efficiency) that far exceeds values measured for typical ETGs.
One solution presented by Davis & Bureau (2016) suggests that the relaxation timescales of many ETGs may be significantly underestimated due to significant smooth accretion onto unstable misaligned gas discs. Assuming mergers to be the dominant driver of misalignments, relaxation timescales times higher () could broadly reproduce the observed ETG misalignment angle distributions. This behaviour was studied by van de Voort et al. (2015) using the zoom-in fire simulations. Following a gas-rich merger, an unstable misaligned gas disc persisted for Gyr attributed to low levels of smooth accretion onto the misaligned disc from tidal tails. This significantly extended the lifetime of the misalignment for the first Gyr before a decrease in accretion rate led to an eventual decoupling between the misaligned disc and accretion flow, followed by a relaxation.
An alternative solution suggests that there may be additional processes forming misalignments besides mergers. For instance, galaxies that are already gas-poor (such as red-sequence ETGs; Davis et al., 2022) have a lower angular momentum threshold needed to misalign the gas disc. This may make these systems more susceptible to becoming misaligned from other sources of misaligned accretion (e.g. Lagos et al., 2018; Khim et al., 2021; Casanueva et al., 2022). Indeed, recent results from semi-analytical models and simulations have shown the formation pathways for misalignments to be significantly more diverse than previously assumed in earlier observational studies. Using the galform semi-analytical model (Cole et al., 2000) and assuming mergers to be the only source of misalignments, Lagos et al. (2015) found misalignments in only of ETGs at . However, when additionally considering isotropic smooth accretion from halo cooling, the fraction of misaligned ETGs increased to of ETGs bringing this value significantly closer to observational results (e.g. Davis et al., 2011; Bryant et al., 2019; Ristea et al., 2022). More recently, Khim et al. (2021) use the horizon-agn simulation to investigate the origins and timescales of misalignments for a sample of galaxies. They report four main formation paths for misalignments: mergers (), gas stripping and interactions with the environment (), interactions with other galaxies (), and secular evolution such as filament accretion or misaligned halo cooling ().
Overall, our results tend to be in agreement with the presence of additional drivers of misalignments, rather than a dominant population of significantly longer-lived unstable misalignments in ETGs. From our results in Section 6.3.3, we find that the vast majority of unstable misalignments in ETGs relax within . These relaxations do not show substantially enhanced relaxation times compared to LTGs once timescales are normalised with respect to . While we do see a population of fairly long-duration unstable misalignments with Gyr (of comparable duration to van de Voort et al., 2015), and a population with enhanced relaxation timescales of beyond theoretical timescales (Tohline et al., 1982; Lake & Norman, 1983), these are not dominant among our sample. Furthermore, the relatively low incidence of mergers () with the formation of unstable misalignments in ETGs suggests misalignments form through diverse formation pathways and may occur more frequently than previously assumed. Thus, at least in eagle, we conclude that a population of long-duration unstable misalignments formed through mergers in ETGs, as suggested by Davis & Bureau (2016), is not the main driver behind the misalignment distributions at .
In qualitative terms, our relaxation timescales agree with those investigated in horizon-agn by Khim et al. (2021). Using a sample of misaligned () galaxies and characterising relaxation timescales as a population decay, they find longer characteristic decay timescales in ETGs ( Gyr) compared to LTGs ( Gyr). This gives ETGs a times longer misalignment duration. By tracing the longevity of individual unstable misalignments in eagle, we tend to find on average shorter relaxation timescales overall. However, we also find longer relaxation times in ETGs ( Gyr) compared to LTGs ( Gyr). Besides underlying differences in approach (e.g. use of a decay timescale) and the different mass ranges considered, the longer relaxation times found in horizon-agn may be due to numerous reasons. Firstly, horizon-agn contains a larger number of M⊙ galaxies () compared to eagle () at . These galaxies typically reside in denser environments in horizon-agn compared to eagle (e.g. Khim et al., 2020). This, in turn, may increase relaxation times due to increased galaxy encounters and smooth accretion events (Khim et al., 2021). Secondly, as the time intervals between successive simulation outputs is about twice as long in horizon-agn compared to eagle, galaxies in our sample are required to meet our sample criteria over a greater number of consecutive snapshots. The lower time resolution in horizon-agn may also obfuscate many shorter-duration misalignments that we are able to resolve. Thirdly, Khim et al. (2021) make use of projected 2D misalignment angles. While we found no substantial changes in the shape of the misalignment distribution at between 2D and 3D misalignment angles (see Figure 2), it is clear that the use of 3D misalignment angles is preferred when characterising relaxation timescales with respect to theoretical predictions (see Section 2). Finally and most importantly, while we aim to measure the relaxation timescales of unstable misalignments (), Khim et al. (2021) measure the longevity of misaligned galaxies (). As a consequence, galaxies that spend considerable time in the stable counter-rotating regime (e.g. Galaxy B in Figure 4) would have characteristic misalignment timescales ( Gyr) far exceeding the relaxation timescales that we measure ( Gyr and Gyr).
Bryant et al. (2019) highlight that it is difficult to achieve the observed dichotomy between ETG and LTG misalignment distributions at through differences in theoretical relaxation timescales. Using a slightly modified expression for and assuming a standard ellipticity of 0.2 and 0.8 for ETGs and LTGs respectively, they find a theoretically maximum longer relaxation time in ETGs. Thus, if morphology is the primary driver of the observed dichotomy and assuming unstable misalignments are formed at the same rate in ETGs and LTGs, we should expect more misaligned ETGs than LTGs. Further considering variations in the typical size and radial velocity of gas discs and taking ellipticity values from a full realistic population of galaxies, this ratio drops to . In eagle, we find a similarly low ratio of ( for co co relaxation paths) between median relaxation times of ETGs and LTGs. Crucially, these ratios are significantly lower than the observed ratio of misaligned gas between ETGs and LTGs () in SAMI and similar studies. Likewise, we find a misaligned gasSF ratio of between ETGs and LTGs (see Figure 2). Thus, we concur with Bryant et al. (2019) that differences in theoretical relaxation timescales between ETGs and LTGs are not the dominant driver behind the observed misalignment distributions. Instead, we suggest that a higher frequency of misalignment events in ETGs is likely a dominant driver behind the observed misalignment distributions.
We find a relatively low incidence of mergers and the formation of unstable misalignments (), highlighting the presence of additional processes forming unstable misalignments. These results are also in qualitative agreement with recent work in cosmological simulations (e.g. Starkenburg et al., 2019; Khim et al., 2021; Casanueva et al., 2022), as well as semi-analytical models (e.g. Lagos et al., 2015). For instance, in earlier work using eagle, Casanueva et al. (2022) report only of misalignments () coinciding with mergers and highlight the importance of gas depletion (possibly through outflows or stripping) to form misalignments through galaxy interactions and encounters. Quantitative differences are likely caused by our different methods (as we use eagle snipshots and utilise a time window within which to identify a merger-driven origin). The mass range of galaxies considered is also different, with Casanueva et al. (2022) including many dwarf galaxies ( M⊙) that may be located in isolated environments with few merger opportunities. Our results are also in good agreement with Khim et al. (2021) who found a major (minor) merger-incidence of () using a modified major and minor merger ratio definition of and , respectively. For comparison, we find a major (minor) merger-incidence of (). Quantitative differences likely arise from the inclusion of smaller merger ratios in their method alongside the aforementioned higher environment density of galaxies in horizon-agn, prompting more frequent mergers and galaxy encounters. Our results also show some agreement with recent observational results in SAMI, with a likely merger-origin associated with of misalignments in galaxies with a mass range of M⊙ (Ristea et al., 2022).
Finally, we find a qualitative agreement with Khim et al. (2021) on the relation between long-lived misalignments and environment density. While we find no significant difference between the of low and medium/high-mass halos (as a proxy for environment density), we do find a strong positive correlation between and halo mass. We also find a positive correlation between and higher ongoing gas accretion rates among central galaxies. Alongside Khim et al. (2021), we attribute the positive correlation between environment density and longer-lived unstable misalignments to both a higher incidence of interactions and gas stripping events in denser environments, as well as higher quantities of halo cooling. For the latter, an unstable misalignment in a more massive halo may be preserved through significant misaligned smooth gas accretion, provided the gaseous halo is misaligned. For instance, stellar-gas misalignments were found to be more common in galaxies with misaligned halos in the IllustrisTNG simulation (Duckworth et al., 2020a). The combination of lower gasSF masses and a higher frequency of halo angular momentum decoupling likely makes ETGs more prone to unstable misalignments from processes besides mergers. These conclusions are also in agreement with those by Casanueva et al. (2022).
We note that a possible limiting factor in our analysis is due to our strict relaxation sample criteria. As a natural consequence of requiring consecutive criteria-meeting snipshots for the duration of the unstable misalignment, the chances of us excluding a relaxation increase significantly for longer-duration relaxations. Long-duration unstable misalignments in ETGs are especially vulnerable to this, given that typical ETGs in eagle have both lower gasSF particle counts and host longer-duration unstable misalignments. Similarly, there is likely an additional population of unstable misalignments in galaxies with ongoing mergers. For example, Khim et al. (2021) find misalignments driven by group interactions to have the longest duration. However, as these relaxations contain snipshots that do not meet our sample criteria, or fail to relax before merging, we reason that any estimate of the relaxation time in these galaxies is unreliable.
As highlighted in Appendix A, we find no substantial difference in the number of long-lived ( Gyr) unstable misalignments identified through use of a 0, 0.1 or 0.2 Gyr latency time. Thus, we rule out the possibility of missing a significant number of long-lived unstable misalignments due to our choice of Gyr. Finally, our sample redshift window of ( Gyr) naturally limits the number of complete misalignments we can measure from formation to relaxation, with being an approximate upper limit. However, considering the limitations imposed by our relaxation sample criteria, the fact we still find a moderate population of long-lived misalignments suggests that misalignment-preserving processes are nevertheless present and that these may be more widespread than previously assumed.
7 Conclusions
In this work, we have used the eagle cosmological simulations to investigate the longevity of unstable stellar-gas kinematic misalignments in galaxies with mass M⊙. We use samples of galaxies for each snapshot to investigate the distribution and variation in misalignment fraction between . We then construct a sample of 3154 misalignment relaxations for which we can reliably estimate the relaxation times. Using this sample, we established the distribution of relaxation timescales for a variety of galaxy properties including morphology, star-forming gas fraction, and environment. Next, we briefly investigated the correlation between the incidence of mergers and the formation of unstable stellar-gas kinematic misalignments. Finally, we compare our results to theoretical predictions and interpret these in the context of driving the observed misalignment distribution at . Our results can be summarised as follows:
-
•
For both ETGs and LTGs, the fraction of 3D misalignments () increases slightly toward lower redshifts, driven by the build-up of long-lasting counter-rotating () systems. By , we find counter-rotating gas discs present in of our sample.
-
•
The majority of unstable misalignments () relax on short timescales, with median relaxation times of Gyr . These indicate the majority of unstable misalignments do not experience significantly enhanced relaxation timescales of due to continued smooth accretion, as suggested by Davis & Bureau (2016) to explain the shape of the ETG misalignment distribution at .
-
•
ETGs take longer to relax compared to LTGs. However, accounting for differences in dynamical timescales and mass distributions between morphologies, ETGs show no significant preference over LTGs toward longer-lived unstable misalignments.
-
•
We find a population () of long-duration relaxations with . Galaxies with these long-duration unstable misalignments tend to have lower star-forming gas fractions, above-average stellar mass, and higher ongoing gas inflow rates.
-
•
We find a positive correlation between halo mass and normalised relaxation timescales, with central galaxies residing in intermediate/high-mass environments ( M⊙) showing clear signs of processes preserving unstable misalignments beyond theoretical predictions. We speculate some of these extended lifetimes may be driven by the cooling of hot gas from a misaligned halo.
-
•
Among galaxies with M⊙, mergers coincide with the formation of an unstable misalignment in of cases in broad agreement with recent observational and simulation work. Major mergers are more effective at forming unstable misalignments and dominate the formation of unstable misalignments () compared to minor mergers (). Mergers contribute toward the formation of unstable misalignments more in ETGs () than in LTGs ().
Taken as a whole, these results point toward a more complex picture regarding the origins and drivers of kinematic misalignments in galaxies than previously considered. Given the relatively low incidence of mergers with misalignment formation, alongside only moderately extended misalignment lifetimes, misalignments are likely occurring more frequently in ETGs given the smaller gas discs in these systems are more susceptible to perturbations. However, with our results pointing toward significant contributions of smooth accretion from the cooling of a hot misaligned halo, we likely still require galaxy interactions to misalign the halo in the first place. In this sense, misalignments are still formed primarily through external processes, but they are not necessarily temporally connected. Thus, the star-forming gas replenishment mechanisms in galaxies likely occur through a diverse source rather than a prevalence toward gas-rich minor mergers (as suggested for red-sequence ETGs).
More work needs to be done in this field to fully understand the drivers of these misalignments to discern the main ISM replenishment mechanisms of ETGs. Future observational surveys with e.g. ALMA and JWST alongside upcoming next-generation cosmological hydrodynamical simulations with a multiphase ISM offer an opportunity to explore these unique systems in more detail.
Acknowledgements
We acknowledge support from the UK Science Technologies and Facilities Council (STFC) for PhD studentship funding and support for TAD through grant ST/W000830/1. We acknowledge the Virgo Consortium for making their simulation data available and thank Robert Crain and Liverpool John Moores University for providing the eagle snipshots. The eagle simulations were performed using the DiRAC-2 facility at Durham, managed by the ICC, and the PRACE facility Curie based in France at TGCC, CEA, Bruyères-le-Châtel. FvdV is supported by a Royal Society University Research Fellowship (URF\R1\191703).
Data Availability
The eagle simulations and database are publicly available at: http://icc.dur.ac.uk/Eagle/database.php. Detailed guides to simulation parameters, models, and how to access and query data can be found in The EAGLE team (2017) and McAlpine et al. (2017). eagle "snipshots" are available on request from members of the eagle team. Data and results used in this work can be provided upon request to the author.
References
- Barrera-Ballesteros et al. (2014) Barrera-Ballesteros J. K., et al., 2014, A&A, 568, A70
- Barrera-Ballesteros et al. (2015) Barrera-Ballesteros J. K., et al., 2015, A&A, 582, A21
- Bett & Frenk (2012) Bett P. E., Frenk C. S., 2012, MNRAS, 420, 3324
- Brooks et al. (2009) Brooks A. M., Governato F., Quinn T., Brook C. B., Wadsley J., 2009, ApJ, 694, 396
- Bryant et al. (2015) Bryant J. J., et al., 2015, MNRAS, 447, 2857
- Bryant et al. (2019) Bryant J. J., et al., 2019, MNRAS, 483, 458
- Casanueva et al. (2022) Casanueva C. I., Lagos C. d. P., Padilla N. D., Davison T. A., 2022, MNRAS, 514, 2031
- Chen et al. (2016) Chen Y.-M., et al., 2016, Nature Communications, 7, 13269
- Cole et al. (2000) Cole S., Lacey C. G., Baugh C. M., Frenk C. S., 2000, MNRAS, 319, 168
- Correa et al. (2017) Correa C. A., Schaye J., Clauwens B., Bower R. G., Crain R. A., Schaller M., Theuns T., Thob A. C. R., 2017, MNRAS, 472, L45
- Crain et al. (2015) Crain R. A., et al., 2015, MNRAS, 450, 1937
- Crain et al. (2017) Crain R. A., et al., 2017, MNRAS, 464, 4204
- Croom et al. (2012) Croom S. M., et al., 2012, MNRAS, 421, 872
- Dalla Vecchia & Schaye (2012) Dalla Vecchia C., Schaye J., 2012, MNRAS, 426, 140
- Davis & Bureau (2016) Davis T. A., Bureau M., 2016, MNRAS, 457, 272
- Davis et al. (1985) Davis M., Efstathiou G., Frenk C. S., White S. D. M., 1985, ApJ, 292, 371
- Davis et al. (2011) Davis T. A., et al., 2011, MNRAS, 417, 882
- Davis et al. (2022) Davis T. A., et al., 2022, MNRAS, 512, 1522
- Di Teodoro & Fraternali (2014) Di Teodoro E. M., Fraternali F., 2014, A&A, 567, A68
- Dolag et al. (2009) Dolag K., Borgani S., Murante G., Springel V., 2009, MNRAS, 399, 497
- Doroshkevich (1970) Doroshkevich A. G., 1970, Astrofizika, 6, 581
- Dressler (1980) Dressler A., 1980, ApJ, 236, 351
- Dubois et al. (2014) Dubois Y., et al., 2014, MNRAS, 444, 1453
- Duckworth et al. (2019) Duckworth C., Tojeiro R., Kraljic K., Sgró M. A., Wild V., Weijmans A.-M., Lacerna I., Drory N., 2019, MNRAS, 483, 172
- Duckworth et al. (2020a) Duckworth C., Tojeiro R., Kraljic K., 2020a, MNRAS, 492, 1869
- Duckworth et al. (2020b) Duckworth C., Starkenburg T. K., Genel S., Davis T. A., Habouzit M., Kraljic K., Tojeiro R., 2020b, MNRAS, 495, 4542
- Emsellem et al. (2011) Emsellem E., et al., 2011, MNRAS, 414, 888
- Fabian et al. (1984) Fabian A. C., Nulsen P. E. J., Canizares C. R., 1984, Nature, 310, 733
- Gaspari et al. (2017) Gaspari M., Temi P., Brighenti F., 2017, MNRAS, 466, 677
- Gunn & Gott (1972) Gunn J. E., Gott J. Richard I., 1972, ApJ, 176, 1
- Hill et al. (2021) Hill A. D., Crain R. A., Kwan J., McCarthy I. G., 2021, MNRAS, 505, 65
- Hopkins et al. (2014) Hopkins P. F., Kereš D., Oñorbe J., Faucher-Giguère C.-A., Quataert E., Murray N., Bullock J. S., 2014, MNRAS, 445, 581
- Jenkins & Booth (2013) Jenkins A., Booth S., 2013, arXiv e-prints, p. arXiv:1306.5771
- Jiang et al. (2014) Jiang L., Helly J. C., Cole S., Frenk C. S., 2014, MNRAS, 440, 2115
- Jiménez et al. (2023) Jiménez E., Lagos C. d. P., Ludlow A. D., Wisnioski E., 2023, MNRAS, 524, 4346
- Jin et al. (2016) Jin Y., et al., 2016, MNRAS, 463, 913
- Kennicutt et al. (1994) Kennicutt Robert C. J., Tamblyn P., Congdon C. E., 1994, ApJ, 435, 22
- Kereš et al. (2005) Kereš D., Katz N., Weinberg D. H., Davé R., 2005, MNRAS, 363, 2
- Khim et al. (2020) Khim D. J., et al., 2020, ApJ, 894, 106
- Khim et al. (2021) Khim D. J., Yi S. K., Pichon C., Dubois Y., Devriendt J., Choi H., Bryant J. J., Croom S. M., 2021, ApJS, 254, 27
- Khoperskov et al. (2021) Khoperskov S., et al., 2021, MNRAS, 500, 3870
- Lagos et al. (2014) Lagos C. d. P., Davis T. A., Lacey C. G., Zwaan M. A., Baugh C. M., Gonzalez-Perez V., Padilla N. D., 2014, MNRAS, 443, 1002
- Lagos et al. (2015) Lagos C. d. P., Padilla N. D., Davis T. A., Lacey C. G., Baugh C. M., Gonzalez-Perez V., Zwaan M. A., Contreras S., 2015, MNRAS, 448, 1271
- Lagos et al. (2018) Lagos C. d. P., et al., 2018, MNRAS, 473, 4956
- Lake & Norman (1983) Lake G., Norman C., 1983, ApJ, 270, 51
- Leitner & Kravtsov (2011) Leitner S. N., Kravtsov A. V., 2011, ApJ, 734, 48
- Lu et al. (2021) Lu S., et al., 2021, MNRAS, 503, 726
- Macciò et al. (2006) Macciò A. V., Moore B., Stadel J., 2006, ApJ, 636, L25
- McAlpine et al. (2017) McAlpine S., Bower R. G., Harrison C. M., Crain R. A., Schaller M., Schaye J., Theuns T., 2017, MNRAS, 468, 3395
- Negri et al. (2014) Negri A., Posacki S., Pellegrini S., Ciotti L., 2014, MNRAS, 445, 1351
- Nelson et al. (2019) Nelson D., et al., 2019, Computational Astrophysics and Cosmology, 6, 2
- Nicholson et al. (1992) Nicholson R. A., Bland-Hawthorn J., Taylor K., 1992, ApJ, 387, 503
- Padilla et al. (2014) Padilla N. D., Salazar-Albornoz S., Contreras S., Cora S. A., Ruiz A. N., 2014, MNRAS, 443, 2801
- Parriott & Bregman (2008) Parriott J. R., Bregman J. N., 2008, ApJ, 681, 1215
- Peebles (1969) Peebles P. J. E., 1969, ApJ, 155, 393
- Planck Collaboration et al. (2014) Planck Collaboration et al., 2014, A&A, 571, A1
- Qu et al. (2017) Qu Y., et al., 2017, MNRAS, 464, 1659
- Raimundo et al. (2023) Raimundo S. I., Malkan M., Vestergaard M., 2023, Nature Astronomy, 7, 463
- Ristea et al. (2022) Ristea A., et al., 2022, MNRAS, 517, 2677
- Rix et al. (1992) Rix H.-W., Franx M., Fisher D., Illingworth G., 1992, ApJ, 400, L5
- Rodriguez-Gomez et al. (2015) Rodriguez-Gomez V., et al., 2015, MNRAS, 449, 49
- Rosas-Guevara et al. (2015) Rosas-Guevara Y. M., et al., 2015, MNRAS, 454, 1038
- Rubin et al. (1992) Rubin V. C., Graham J. A., Kenney J. D. P., 1992, ApJ, 394, L9
- Ruffa et al. (2019a) Ruffa I., et al., 2019a, MNRAS, 484, 4239
- Ruffa et al. (2019b) Ruffa I., et al., 2019b, MNRAS, 489, 3739
- Sarzi et al. (2006) Sarzi M., et al., 2006, MNRAS, 366, 1151
- Schaller et al. (2015) Schaller M., Dalla Vecchia C., Schaye J., Bower R. G., Theuns T., Crain R. A., Furlong M., McCarthy I. G., 2015, MNRAS, 454, 2277
- Schaye & Dalla Vecchia (2008) Schaye J., Dalla Vecchia C., 2008, MNRAS, 383, 1210
- Schaye et al. (2015) Schaye J., et al., 2015, MNRAS, 446, 521
- Springel et al. (2001) Springel V., White S. D. M., Tormen G., Kauffmann G., 2001, MNRAS, 328, 726
- Springel et al. (2005) Springel V., Di Matteo T., Hernquist L., 2005, MNRAS, 361, 776
- Springel et al. (2008) Springel V., et al., 2008, MNRAS, 391, 1685
- Starkenburg et al. (2019) Starkenburg T. K., Sales L. V., Genel S., Manzano-King C., Canalizo G., Hernquist L., 2019, ApJ, 878, 143
- Steiman-Cameron & Durisen (1988) Steiman-Cameron T. Y., Durisen R. H., 1988, ApJ, 325, 26
- The EAGLE team (2017) The EAGLE team 2017, arXiv e-prints, p. arXiv:1706.09899
- Tohline et al. (1982) Tohline J. E., Simonson G. F., Caldwell N., 1982, ApJ, 252, 92
- Trayford & Schaye (2019) Trayford J. W., Schaye J., 2019, MNRAS, 485, 5715
- Trayford et al. (2017) Trayford J. W., et al., 2017, MNRAS, 470, 771
- White (1984) White S. D. M., 1984, ApJ, 286, 38
- Wiersma et al. (2009a) Wiersma R. P. C., Schaye J., Smith B. D., 2009a, MNRAS, 393, 99
- Wiersma et al. (2009b) Wiersma R. P. C., Schaye J., Theuns T., Dalla Vecchia C., Tornatore L., 2009b, MNRAS, 399, 574
- Wiklind & Henkel (2001) Wiklind T., Henkel C., 2001, A&A, 375, 797
- van de Voort et al. (2015) van de Voort F., Davis T. A., Kereš D., Quataert E., Faucher-Giguère C.-A., Hopkins P. F., 2015, MNRAS, 451, 3269
Appendix A Variation of latency time on our unstable misalignment relaxation sample
The requirement of a latency time in our relaxation time method is a compromise between extracting many short relaxations (that may belong to the same overall relaxation) or extracting fewer but longer-duration relaxations (in which we merge many of these small-duration unstable misalignments). Our latency time ( Gyr) was chosen by manual inspection of unstable misalignment evolution to reflect this compromise.
Varying this latency time has several effects. Firstly, by increasing , we remove an increasing fraction of short-duration relaxations as successive relaxations become merged into longer relaxations. Secondly, this also significantly reduces our sample size by requiring a longer time gap between the next unstable misalignment, as well as requiring a larger window of snipshots over which to meet our sample criteria. The interplay between these selection effects sets the overall relaxation time distribution.
We explore the selection effects of varying the latency time between Gyr, with statistics shown in Table 6. While increasing comes at a significant cost to our overall sample size, we find no significant change in the overall shape of our relaxation timescale distribution besides an increase in the relative fraction of Gyr relaxations for Gyr and subsequently decreased median relaxation time. As expected, this is driven primarily by substantial increase in the relative number of short-duration unstable misalignments rather than a significant decrease in the number of long-duration unstable misalignments. We therefore rule out the possibility of missing any substantial population of long-duration unstable misalignments due to variations in .
| (Gyr) | N | (Gyr) | Gyr relaxations | |
| count | fraction | |||
| 0 | 6343 | 0.36 | 681 | 0.104 |
| 0.1 | 3154 | 0.50 | 635 | 0.200 |
| 0.2 | 1983 | 0.55 | 535 | 0.270 |
| 0.5 | 865 | 0.55 | 267 | 0.309 |