On the Orbital Effects of Stellar Collisions in Galactic Nuclei:
Tidal Disruption Events and Ejected Stars
Abstract
Dense stellar clusters surround the supermassive black holes (SMBH) in galactic nuclei. Interactions within the cluster can alter the stellar orbits, occasionally driving a star into the SMBH’s tidal radius where it becomes ruptured. This proof-of-concept study examines the orbital effects of stellar collisions using a semianalytic model. Both low and high speed collisions occur in the SMBH’s sphere of influence. Our model treats stars in low speed collisions as sticky spheres. For high-speed collisions, we develop a simple prescription based on the limiting case of a hyperbolic encounter. We test a range of collision treatments and cluster conditions. We find that collisions can place stars on nearly radial orbits. Depositing stars within the tidal radius, collisions may drive the disruption of stars with unusual masses and structures: depending on the nature of the collision, the star could be the product of a recent merger, or it could have lost its outer layers in a high speed impact, appearing as a stripped star. We also find that high speed collisions near the periapsis of an eccentric orbit can unbind stars from the SMBH. However, dissipation during these high-speed collisions can substantially reduce the number of unbound stars achieved in our simulations. We conclude that TDEs and ejected stars, even in the hypervelocity regime, are plausible outcomes of stellar collisions, though their frequency in a three-dimensional nuclear star cluster are uncertain. Future work will address the rates and properties of these events.
1 Introduction
A supermassive black hole resides at the center of most galaxies, where it is surrounded by a dense stellar cluster (e.g. Ferrarese & Ford, 2005; Kormendy & Ho, 2013; Schödel et al., 2003; Ghez et al., 2005, 2008; Gillessen et al., 2009, 2017; Neumayer et al., 2020). A tidal disruption event (TDE) occurs when a star from the cluster passes within a critical distance from the SMBH and becomes ruptured by tidal forces (e.g., Hills, 1975; Rees, 1988; Alexander, 1999; Magorrian & Tremaine, 1999; Wang & Merritt, 2004; MacLeod et al., 2012). The SMBH then accretes the stellar material, producing an electromagnetic signature (e.g., Guillochon & Ramirez-Ruiz, 2013). Spectra of these events encode valuable information about the mass, structure, and composition of the ruptured star (e.g., Kochanek, 2016a, b; Yang et al., 2017; Mockler et al., 2022; Miller et al., 2023). Observations of TDEs represent a powerful way to probe the stellar populations in galactic nuclei and the processes that shape them.
Amongst these physical processes are direct collisions. Collisions can occur within the sphere of influence of the SMBH due to the high densities and velocity dispersion (e.g., Freitag & Benz, 2002; Dale et al., 2009; Dale & Davies, 2006; Rubin & Loeb, 2011; Balberg et al., 2013; Balberg, 2024; Mastrobuono-Battisti et al., 2014; Rose & MacLeod, 2024). These events may produce electromagnetic signatures, both from the collisions themselves and from interactions between liberated material and the SMBH (e.g., Rosswog et al., 2009; Lee et al., 2010; Balberg et al., 2013; Dessart et al., 2024; Ryu et al., 2024b, a; Brutman et al., 2024), though it is difficult to ignite a main-sequence star with compression (Guillochon et al., 2009). They can also shape the stellar population. Both low and high speed collisions can alter the mass of a star – the latter can destroy stars completely and the former can give rise to blue stragglers in dense stellar systems (e.g., Lai et al., 1993; Rauch, 1999; Sills et al., 1997, 2001; Lombardi et al., 2002; MacLeod et al., 2013; Leigh et al., 2016; Rose et al., 2023). Recently, Gibson et al. (2024) have shown that high speed collisions can also produce stripped stars similar to what might be seen through binary evolution.
Collisions that produce stellar mergers or stripped stars may explain recent unexpected TDE observations. For example, detections of high nitrogen-to-carbon (N/C) ratios in TDEs point to the disruption of more stars that burn on the CNO cycle (as first proposed by Kochanek, 2016a, b), and that are (Kochanek, 2016a; Yang et al., 2017; Gallegos-Garcia et al., 2018; Mockler et al., 2023) than is predicted by the host galaxies’ stellar populations (Mockler et al., 2023). One particular TDE has such an extremely high N/C abundance ratio that it is difficult to explain with single stellar evolution alone (Miller et al., 2023), but could be the result of the disruption of a stripped star that has lost its nitrogen-poor envelope (Mockler et al., 2024). Additionally, a recently discovered population of extremely bright nuclear transients has also been suggested to originate from the disruption of high mass stars (e.g. , Subrayan et al., 2023; Hinkle et al., 2024). Because stars that end in disruptions are expected to be drawn approximately at random from the stellar mass function (with small adjustments for stellar type, MacLeod et al., 2012), this preference for higher mass stars may imply that the mass function in galactic nuclei is more top-heavy (and/or bottom-light) than in the rest of the galaxy (see e.g., Lu et al., 2013; Hosek et al., 2019).
The potential link between TDEs and collisions is intriguing: collisions can simultaneously affect both the properties of the stars and their orbits about the SMBH. MacLeod et al. (2012) first considered collisions, particularly destructive ones, in the context of the TDE rate. Changes to a star’s trajectory from collisions have also been considered in general dynamical models of dense stellar systems (e.g., Sanders, 1970; Rauch, 1999; Freitag & Benz, 2002; Kremer et al., 2020; González et al., 2021; Rodriguez et al., 2022). In this proof-of-concept study, we study the orbital effects of stellar collisions in galactic nuclei. We assess whether the collisions that produce unusual stars could plausibly deposit those same stars onto TDE-producing orbits. Our models leverage simple, intuitive treatments for collision outcomes and fitting formulae from previous studies (e.g. Lai et al., 1993; Rauch, 1999). We test a range of initial conditions and nuclear star cluster properties. Our paper is organized as follows:
In Section 2, we discuss our general approach to modeling the Milky Way’s nuclear star cluster. Section 3 describes the treatment of various physics in our code, with Section 3.2 in particular outlining our methodology for updating the stellar orbits post collision. These orbital changes represent the most major addition to the code as compared to previous iterations (Rose et al., 2022, 2023). Section 4 presents simulated results for direct collisions. Sections 4.1, 4.2, and 4.3 discuss the implications for TDEs, orbital properties of collision-affected stars, and unbound and hypervelocity stars. We then incorporate relaxation into our simulations in addition to stellar collisions and present results in Section 5. Lastly, we summarize the scope and findings of our study in Section 6.
2 Model Nuclear Star Cluster
We leverage semi-analytic models to study the effects of collisions on the nuclear star cluster. Our fiducial model uses the conditions and properties of the Milky Way’s GN, whose proximity makes it the best studied galactic center. We follow a sample of stars embedded in a fixed, unevolving cluster. For simplicity, both the evolving sample and the surrounding cluster are composed of M⊙ stars. The cluster can be understood in two key properties, density and velocity dispersion, which govern the dynamical processes unfolding within it.
The stellar density sets the the frequency with which stars interact. We describe the stellar density as a function of distance from the SMBH using a power law:
| (1) |
where is the slope and , distance from the SMBH. Based on observations of the cluster within the sphere of influence, this equation is normalized using at (Genzel et al., 2010). Our fiducial model uses a slope of , the expectation for a single-mass population (Bahcall & Wolf, 1976), consistent with the fact that our simple model cluster has only solar mass stars. However, in order to capture the range of theoretical predictions and observational constraints on the stellar cusp (e.g., Bahcall & Wolf, 1976; Gallego-Cano et al., 2018a; Linial & Sari, 2022), we also test a few simulations with , shown in Appendix A. We assume that the slope of the stellar cusp is roughly constant, or varying slowly, over the timescales of interest in our simulations.
The velocity dispersion within the cluster also influences the frequency and nature of stellar interactions. It decreases with distance from the SMBH:
| (2) |
where is the slope of the density profile and is the mass of the SMBH (Alexander, 1999; Alexander & Pfuhl, 2014). We take to be M⊙, like the Milky Way’s SMBH (e.g., Ghez et al., 2003). For a uniform mass cluster of M⊙ stars, the number density is simply .
3 Semianalytic Model
We follow a sample of M⊙ tracer stars embedded in our model cluster. We draw their orbital eccentricities from a thermal distribution. We select their semimajor axes so that they lie on a cusp with slope , matching the background cluster. These stars are allowed to evolve under the influence of two main dynamical processes, direct collisions and two-body relaxation, using a model first developed by Rose et al. (2022, 2023).
3.1 Collisions
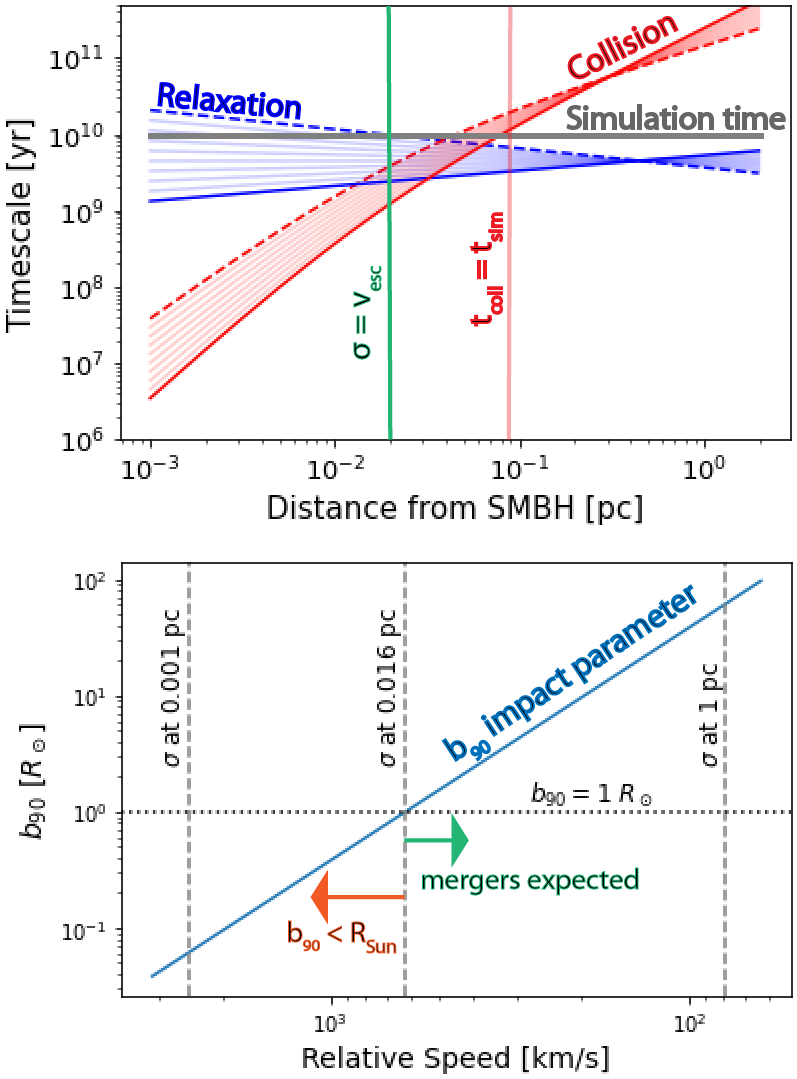
Direct collisions occur over a characteristic timescale , where is the cross-section of interaction, is the number density, and is the velocity dispersion. For an impact to occur, is the physical cross-section enhanced by gravitational focusing. The collision timescale also depends weakly on the star’s orbital eccentricity and can be written as:
| (3) | |||||
where and are equations 20 and 21 from Rose et al. (2020), is the gravitational constant, and is the star’s semimajor axis. is the sum of the radii of the colliding stars, or for a uniform population of solar mass stars. We plot this timescale in red in the upper panel of Figure 1. We consider a range of slopes for the stellar density profile, spanning (dashed line) to (solid line). The horizontal grey line shows the total simulation time, included to guide the eye. Where the collision timescale is less than the simulation time, within pc of the SMBH, collisions become important to understanding the evolution of the cluster (e.g., Rose & MacLeod, 2024).
We treat stellar collisions using a statistical approach. We begin by computing the probability that a star in our sample will experience a collision. Over a timestep , this probability equals . is taken to be years so that the probability is always less than one; years for the parameter space we consider. The code then draws a random number between and , which, if less than or equal to the collision probability , means a collision has occurred. We repeat this prescription until the desired simulation runtime or the star’s main-sequence lifetime has been reached, whichever is shorter.
If a collision has occurred over a given timestep, we update the mass and age of the star using a prescription detailed in Rose et al. (2023). A full discussion of our approach can be found in previous papers (Rose et al., 2023; Rose & MacLeod, 2024). In brief, we combine fitting formulae from hydrodynamics simulations of stellar collisions (Rauch, 1999; Lai et al., 1993) with heuristic arguments to (1) determine if a given collision will result in a merger and (2) determine the amount of mass lost from either the merger product or the unbound individual stars. Since speeds in galactic nuclei often exceed hundreds of kilometers per second, collisions can eject anywhere from a percent to all of the star’s mass, effectively blowing it up (Spitzer & Saslaw, 1966; Lai et al., 1993; Balberg et al., 2013; Balberg, 2024; Brutman et al., 2024). Mergers with minimal mass loss are most likely to occur outside of about pc, where the relative speeds tend to be less than the escape speed from the stars. Within pc, however, velocities exceed the escape speed from the stars, and collisions can result in peculiar, low-mass “stripped stars” (Rose et al., 2023; Rose & MacLeod, 2024; Gibson et al., 2024).
In practice, the outcome of a collision is more complex to determine, depending on properties such as the impact parameter and stellar structure (e.g., Freitag & Benz, 2005; Gibson et al., 2024, Rose et al. in prep.). For the purposes of this study, which focuses on the general implications of collisions for stellar orbits in galactic nuclei, the specific mass loss and merger prescriptions should not qualitatively change our results. Unless otherwise specified, all simulations shown herein use fitting formulae from Rauch (1999) for the mass loss and escape speed arguments to determine whether or not a collision results in a merger (Rose et al., 2023).
In previous iterations of this code, the collision speed was taken to be simply the velocity dispersion at the star’s distance from the supermassive black hole, given by Eq. (2) (Rose et al., 2022, 2023). However, this approach is insufficient for studying the effects of collisions on stellar orbits. In this study, we draw the orbit of the second colliding star, using a procedure detailed below.
3.2 Orbital Dynamics
If a star in our sample with semimajor axis and eccentricity collides over timestep , we find a plausible orbit for the second colliding star. As we operate under the assumption that the cluster is composed of a uniform stellar population, we always take the second star to have M⊙. We then draw semimajor axes and eccentricities from the cluster’s property distributions, as described in Section 2, until we find an orbit that intersects with that of our tracer star. Our code assumes that the cluster is spherically symmetric and only tracks the semimajor axis and eccentricity of each tracer star. In this set up, our tracer star always has argument of periapsis equal to zero, however the second colliding star’s periapsis need not be aligned with it. The angle between them is drawn from a uniform distribution. The orbits are always assumed to be coplanar.
Observations suggest that a subset of the stars in the Milky Way’s galactic center reside in a disk, while others have an isotropic distribution (e.g., Levin & Beloborodov, 2003; Ghez et al., 2003, 2005; Gillessen et al., 2009; Paumard et al., 2006; Lu et al., 2009; Bartko et al., 2009; Yelda et al., 2014). In our co-planar physical picture, we have two options: either both of the colliding stars can orbit in the same direction about the supermassive black hole, or they can be equally likely to be prograde or retrograde. We test two extremes to capture the effects of different orbital orientations. Our first case, “disk-like”, has the two colliding stars orbiting the SMBH in the same direction. In the second case, “isotropic-like”, we assume that fifty percent of the time the two stars orbit the SMBH in the same direction and fifty percent of the time in opposite directions. The latter orientation means that the orbital angular momentum vectors are anti-parallel to one another.
Once we have found an intersecting orbit for our colliding tracer star, we determine the intersection point and compute the velocity vectors of the two stars at that point. The relative speed tells us whether or not a merger occurs and the degree of fractional mass loss from the system (see above section). From here, determining the final orbit(s) will depend on the type of outcome and therefore the relative speed.
3.2.1 Final Orbit in Merger Case
A stellar merger is the natural outcome of a low-speed collision. We calculate the final mass, age, and now trajectory of the product assuming the stars act as “sticky spheres” (e.g., Rodriguez et al., 2022; Rose et al., 2023). The two stars approach each other with velocity vectors and as determined by the intersection point of their orbit. Momentum conservation demands that the final velocity of the merger product, , equals . Based on hydrodynamics studies of stellar mergers, the mass loss in these collisions should be low (e.g.., Lai et al., 1993; Rauch, 1999, Rose et al. in prep.). With the final velocity, mass, and location of the collision – the intersection point of the original orbits – we can calculate the new orbit of the merger product about the SMBH.
3.2.2 Final Orbits Following a High-Speed Collision
Orbital changes from high-speed collisions are much more difficult to determine in the absence of hydrodynamics simulations. However, we present a framework for treating these interactions. In order to understand these collisions, we start at the limit where the two stars barely graze. This interaction should unfold as a hyperbolic encounter. In the center of mass frame of the two stars, their speeds remain constant, but their velocity vectors are deflected by angle . can be found analytically:
| (4) |
where is the impact parameter and is defined as the impact parameter needed for a deflection. equals , where is the relative speed between the two stars (e.g., Binney & Tremaine, 2008).
We plot as a function of the relative speed in the bottom panel of Figure 1. In the nuclear star cluster, the velocity dispersion can be understood as the characteristic relative speed between stars at a given distance from the SMBH (see Eq. 2). We have therefore inverted the x-axis of the bottom plot to parallel that of the upper plot, distance from the SMBH, and marked the velocity dispersion at key distances using vertical dashed lines. In both the upper and lower plots, we also indicate the regions in which we expect mergers versus high-speed collisions, which leave the stars unbound from each other. Interestingly, for most of the parameter space where these high-speed, non-sticky sphere collisions occur, is less than the star’s radius. Another way of interpreting this statement is that at high speeds, physical collisions are required for a strong-angle deflection.
If the stars were point particles, the impact parameter could be arbitrarily small and the interaction would still unfold as a hyperbolic encounter. Two Sun-like stars begin to touch when R⊙. With R⊙, the stars physically impede each other as they interact, leading to a smaller deflection angle than the one given in Eq. (4). Furthermore, if the stars approach each other perfectly head-on with , the center of mass velocity is and there is no angular momentum. In this case, there would be no deflection. Heuristically, then, we expect the deflection angle to be given by Eq. (4) for grazing encounters, and some fraction of this angle for encounters with . That fraction should decrease with impact parameter until they are both zero. The precise dependence is impossible to determine in the absence of hydro simulations, but we define a collision deflection angle that meets the two limiting criterion:
| (5) |
where is the sum of the radii of the two colliding stars.
It is reasonable to expect that the collision affects the stars’ speeds as well. Even more so than the deflection angle, changes in speed can only be understood through hydrodynamic simulations. In our models, we simply test three cases: one in which the speed is not affected at all, one in which the speed in the center of mass frame is always reduced by , and one in which it is always reduced by a factor of .
We treat these collisions as follows: at the intersection point of the orbits of the two colliding stars, we calculate their center of mass velocity. We transform to the center of mass frame. Only then do we rotate and scale their velocity vectors. While we only track semimajor axes and eccentricities, we do allow the deflections to be three dimensional, with components out of the plane. The final velocity can be any vector, chosen randomly, along a cone defined by angle with respect to the original velocity. Isotropizing the deflection is important because otherwise the colliding stars would always be scattered exactly towards or away from the SMBH, leading to an gross overestimate of TDE rates. We then transform back to the frame of the SMBH and calculate the new orbits given the velocity and position vectors.
We note that our calculation assumes that the center of mass is not moving in the frame of the supermassive black hole. In actuality, the center of mass of the two stars would orbit the supermassive black hole, but the effects will be negligable due to the high collision speeds.
3.3 Two-Body Relaxation
In addition to collisions, stars in the cluster experience the weak gravitational effects of nearby neighbors. The effects of these interactions can accumulate, eventually changing the star’s orbital energy and angular momentum by order of itself. The original orbit is “erased” over a characteristic timescale:
| (6) |
where is the average star’s mass, here taken to be M⊙, and is the coulomb logarithm (e.g., Binney & Tremaine, 2008; Merritt, 2013). Figure 1 shows the relaxation timescale as a function of distance from the SMBH in blue for a range of stellar density profiles.
We account for relaxation by allowing the orbital eccentricity and semimajor axis of each of our tracer stars to slowly evolve. Once per orbit, we apply a small instantaneous change in velocity to each star (e.g., Bradnick et al., 2017; Lu & Naoz, 2019; Rose et al., 2022, 2023; Naoz et al., 2022, see the latter for the full set of equations). The kick is calibrated so that , and if , is of order of the velocity. This prescription simulates the diffusion of the orbital orbital parameters over time from interactions with other stars in the cluster. Previously, it has been used in studies of TDEs and extreme mass ratio inspirals of stellar mass black holes into the SMBH (Naoz et al., 2022; Melchor et al., 2024).
3.4 Orbital Stopping Conditions
As noted in Section 3.1, we terminate the simulation when the desired runtime of billion years is reached or when the time elapsed has exceeded the star’s main-sequence lifetime, whichever comes first. However, orbital changes from collisions or relaxation can also send stars into the tidal radius, where they will be destroyed. We trigger a stopping condition if the star’s periapsis becomes less than twice the tidal radius from the SMBH, (e.g., Guillochon & Ramirez-Ruiz, 2013; Mockler et al., 2023). Tidal disruption events can be characterized by impact parameter . Our stopping condition corresponds to , allowing us to capture partial as well as full disruptions.
Because both direct collisions and relaxation processes can place a star onto a nearly radial orbit, we log whether the critical orbit was reached through a direct collision or our relaxation prescription. A star that becomes a TDE due to relaxation processes can still have experienced one or more collision previously in its life. However, a star that collides and becomes a TDE due to the collision itself may still be inflated from the impact when it reaches its periapsis. In this case, the stopping condition noted above may be conservative; the is simply the radius expected using a mass-radius relation for a main-sequence star of mass .
High-speed collisions, unlike those that result in mergers, can also cause stars to be ejected from the nuclear star cluster. Consider two stars that collide on elliptical orbits that intersect near periapsis. As the eccentricity approaches unity, the speed at periapsis approaches the escape speed, just shy of becoming an unbound, parabolic orbit. In the limit of a hyperbolic encounter, the speeds of the stars are unchanged in the center of mass frame, but they undergo a deflection. In the frame of the SMBH, this change can boost one star’s speed enough to unbind it from the SMBH, while the other star ends up on a more tightly bound orbit. Close encounters have previously been shown to eject stars from dense stellar systems (e.g., Henon, 1969; Lin & Tremaine, 1980). Additionally, high-speed collisions often lead to mass loss, which can unbind the orbit not unlike a supernova (e.g., Lu & Naoz, 2019). Therefore, we include a stopping condition for orbital energy and eccentricity . We do not consider stars that become unbound after losing mass in a tidal disruption, as proposed by Manukian et al. (2013).
4 Numerical Results without Relaxation
We run large sets of tracer stars and let them evolve over billion years. We begin by presenting simulated results without our relaxation prescription. These simulations allows us to isolate the orbital effects of collisions unobscured by relaxation. As in a nuclear star cluster, most of our tracer stars reside near pc, the edge of the sphere of influence. About of our tracer stars, or of the sample, lie within pc, where collisions are most common (see Figure 1). Sampling in this way gives a more complete picture of the relative rates of each outcome.
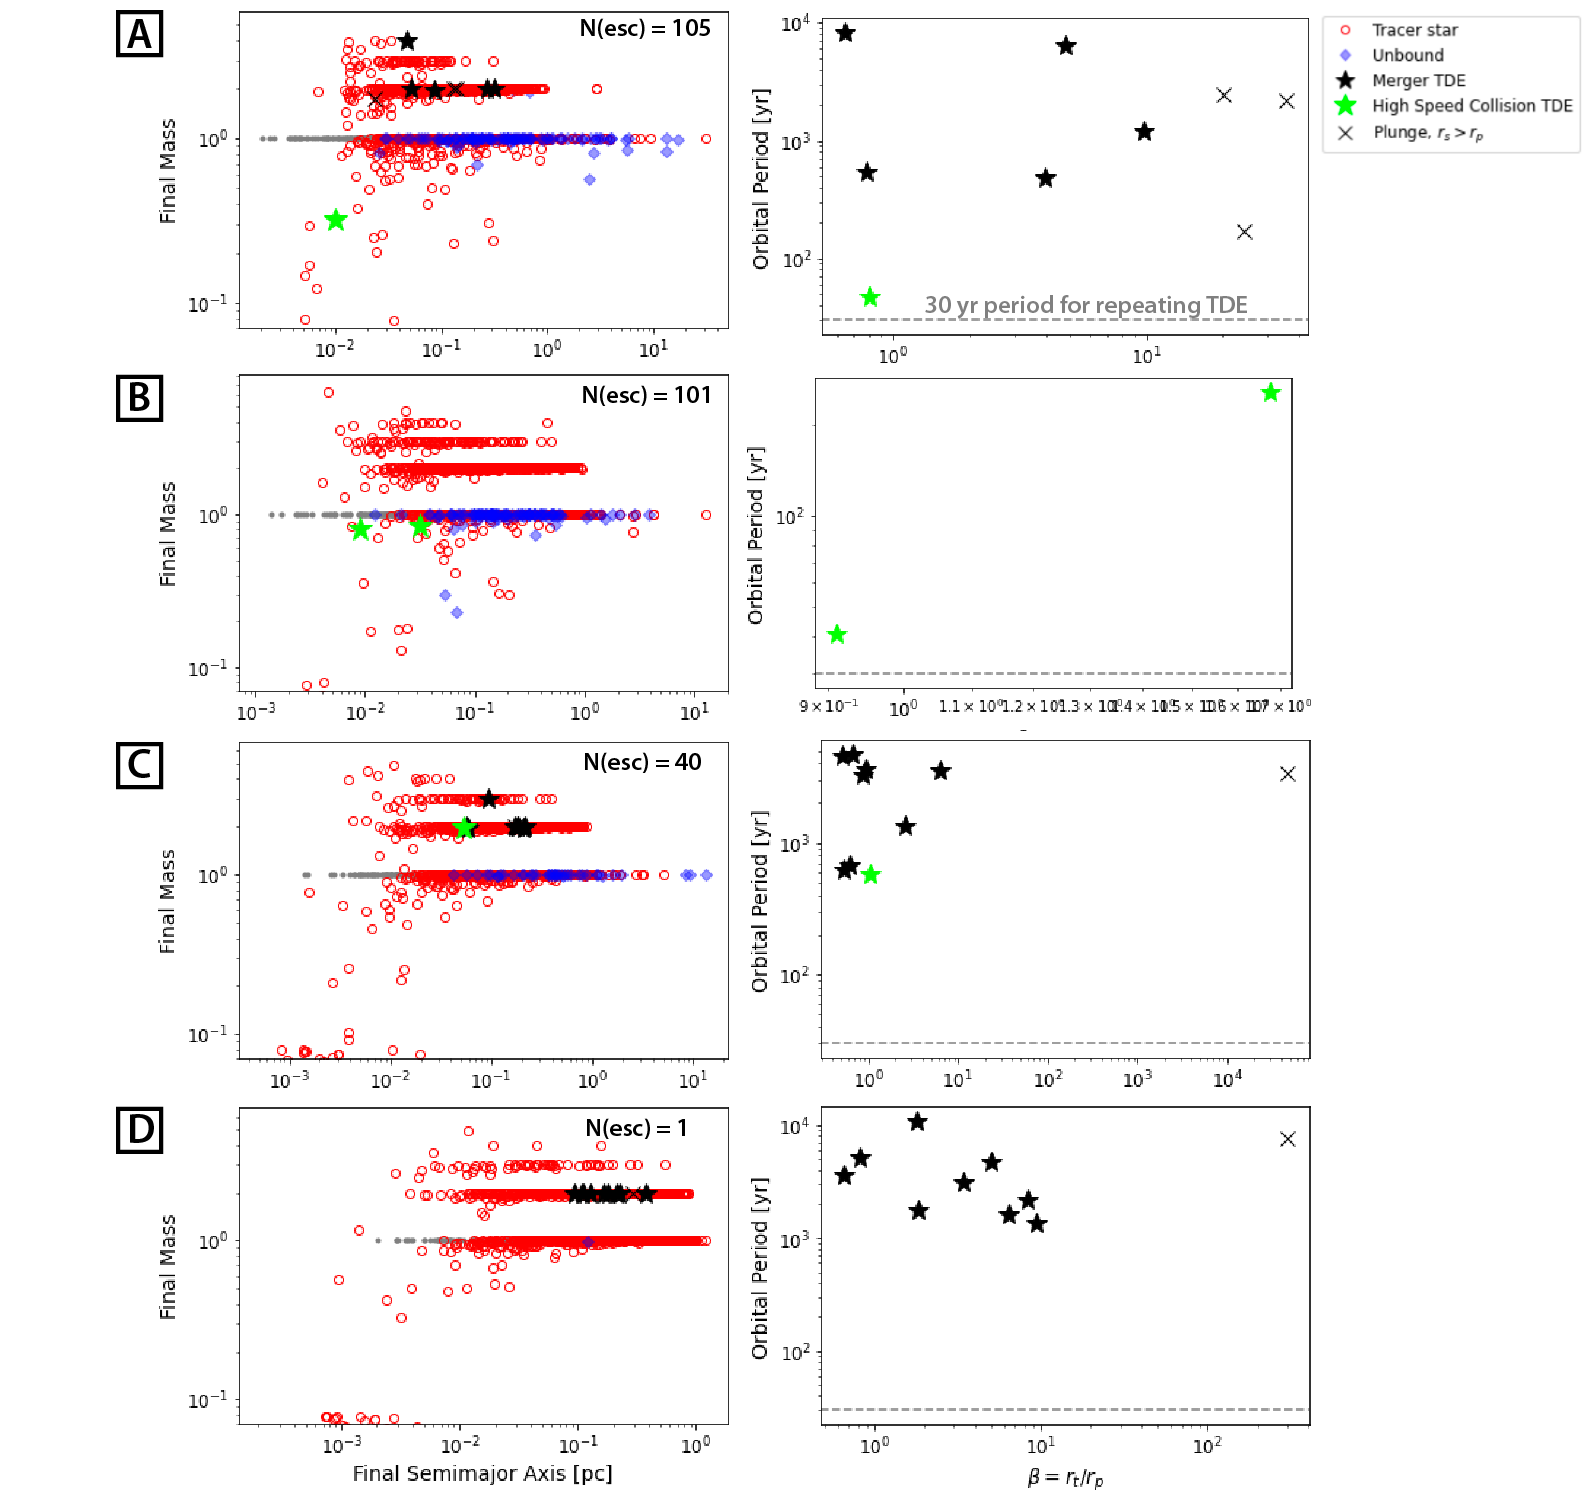
Figure 2 juxtaposes results for slightly different treatments of the collision physics, labeled as follows:
Type A: In this simulation, two colliding stars have a chance of orbiting the SMBH in the same direction and a chance of orbiting in opposite directions. The final velocities after a high-speed collision are calculated using Eq. 5. We assume that these high speed collisions do not impact the speed of the stars in their center of mass frame.
Type B: Simulations with type B conditions differ from type A by assuming that all stars orbit the SMBH in the same direction.
Type C: These simulations are identical to type A, except high speed collisions decrease the speeds in the stars’ center of mass frame by . In other words, we scale the velocity vectors of the stars by before tranforming back to the frame of the SMBH.
Type D: These conditions are identical to types A and C except high speed collisions drecrease the speed in the center of mass frame by .
The left column of Figure 2 shows the final masses and semimajor axes of the tracer stars. Red open circles represent stars at the end of the simulation or their main-sequence lifetime, whichever came first. Grey points represent the initial conditions. Blue diamonds indicate stars that were placed on unbound orbits by high speed collisions. Note that unbound orbits have negative semimajor axes, so we plot the absolute value. We provide the total number of stars that escape on unbound orbits in the upper right corner of each plot. In addition to these unbound orbits, collisions can also place stars on orbits with semimajor axes outside the inner pc.
TDEs from direct collisions are represented by the star shaped symbols. The color indicates the type of collision responsible for the radial orbit: low-speed collisions, which we refer to as merger TDEs, are shown in black, while lime represents high speed collisions. Some of these orbits are so extreme that the periapsis distance lies within the Schwarzschild radius. We mark these plunging stars using an “x” symbol.
The right column shows the properties of the TDEs and plunges for each simulation. The y-axis shows the orbital period of the final orbit, which carries them into the tidal radius. On the x-axis, we plot the parameter , which quantifies how deeply the orbit penetrates the tidal radius. indicate a partial disruption. To guide the eye, grey dashed line marks where the orbital period equals yr. TDEs with periods less than this could conceivably be observed as a repeating TDE. We discuss the implications for TDEs below.
4.1 Tidal Disruption Events
Collision-induced mergers can result in TDEs under conditions A, C, and D, but not B. These merged stars are placed on nearly radial orbits when the colliding stars are orbiting in opposite directions. Their angular momenta vector are anti-aligned, giving a low angular momentum to the final orbit of the merger product. Under type B collision conditions, in contrast, there are no merger TDEs. The orbital angular momenta are never in a position to cancel each other out.
Fewer TDEs result from high speed collisions. The relative abundances reflect the relative frequency of each type of collision. High speed collisions tend to occur near the SMBH where speeds are sufficiently high, but fewer stars reside. These high speed TDEs are relatively rarer because this type of collision is relatively rarer. Collisions in general tend to become common within the inner pc of the cluster. However, only about stars from our sample lie in this region. We find that when we sample this region in greater detail, both high and low speed collision TDEs become more common. One high speed collision even produced a repeating TDE (see additional simulations in Section A.2). Others were close to our repeating TDE threshold with - yr periods.
There are some initial conditions that consistently fail to produce high speed collision TDEs, notably Type D conditions. A shallower density profile will also lead to a lower collision rate overall because the timescale is longer (see Figure 1), in turn reducing the rate of collision TDEs (see Appendix A.2). Additionally, we note that our prescription for determining whether or not a merger results from a collision may over-predict the number of mergers. We use fitting formulae from Rauch (1999) to determine the mass loss in a collision and heuristic arguments, similar to the aforementioned study, to determine if a merger occurs. Previous studies with this code (Rose et al., 2023; Rose & MacLeod, 2024) have also tested simulations using fitting formulae from Lai et al. (1993), who include a fitting formula for the merger capture radius. Their formula leads to fewer mergers compared to our first approach. However, collision-induced mergers would still be viable as a mechanism to create TDEs; they would simply occur at a much lower rate. As with other additional simulations, we show examples using the Lai et al. (1993) fitting formulae in the Appendix (Figure 8) to avoid overcrowding the main text.
4.2 Orbital Changes from Collisions
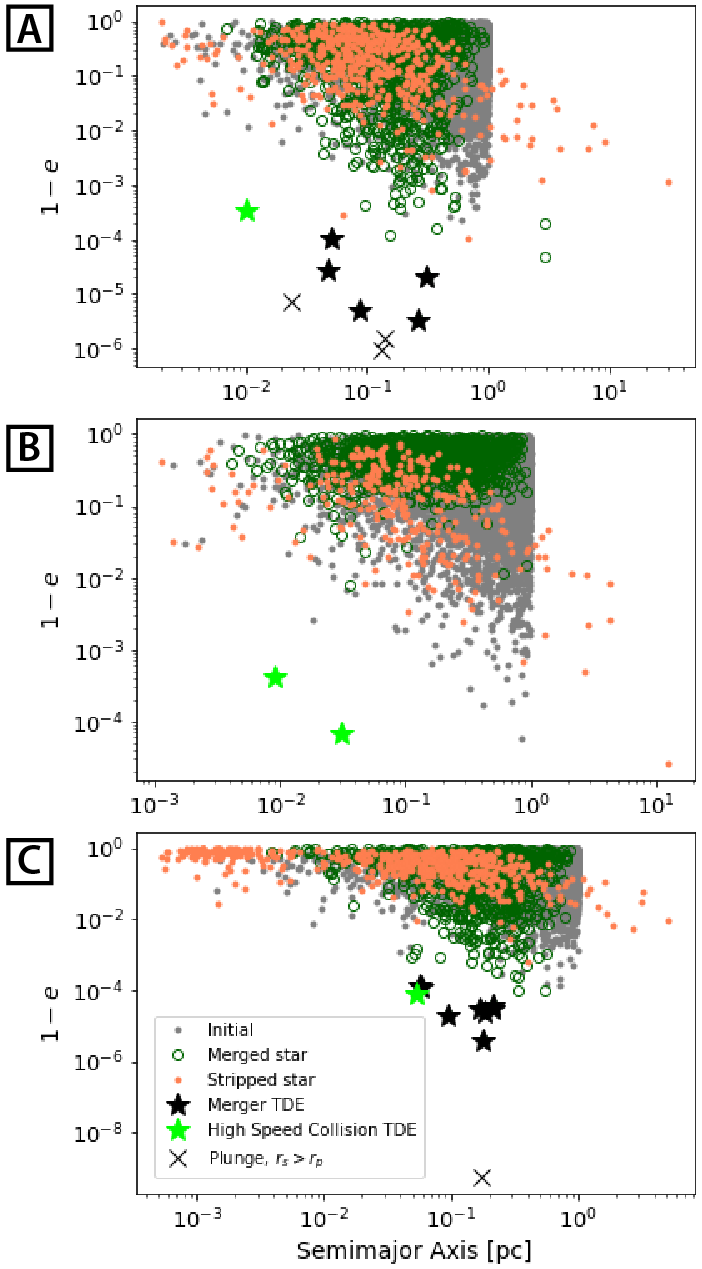
We consider general trends in the effects of collisions on the orbital properties of the stars. We do this by examining sub-populations of the tracer stars based on their final mass. We stress that this classification does not necessarily give the full picture of a star’s collision history. While all stars with M⊙ must have undergone a merger – recall that all stars in are cluster are initially M⊙ – and stars with M⊙ must have lost mass in a high speed collision, these two populations are not mutually exclusive. A single star can experience both types of collisions over its lifetime depending on where it is in its orbit and the orbit of the second colliding star. However, final mass still represents the best “observable” probe of a star’s collision history. We compare the semimajor axis versus of the stars in Figure 3, the latter being proportional to the periapsis. Grey dots show the initial conditions for all the stars. Green circles represent stars with M⊙, while orange dots represent stars with M⊙. TDEs and unbound stars are represented using the same symbols as in previous figures. We confirm that the TDEs in our simulation do indeed come from nearly radial orbits.
Mergers and high speed collisions differ in terms of their orbital outcomes. Conservation of energy demands that mergers always shrink the semimajor axis, while high speed collisions can place stars on both wider or smaller orbits by facilitating an energy exchange between the two stars. These trends are visible in the Figure. The green open circles are mostly confined to the inner cluster, while orange dots have an extended distribution. A few merged stars lie outside our initial cluster. These merged stars experienced a high speed collision that deflected them onto wider orbits.
In simulations A and B, a roughly equal number of stripped stars moved to more (less) tightly bound orbits. We count unbound stars in the less tightly bound category because their final orbital energies are larger than the initial values. Additionally, about stars are placed on orbits with semimajor axes outside of pc. This result suggests that there may be collision-affected stripped stars masquerading outside of the sphere of influence. Including a treatment for dissipation during a high speed collision, simulation C presents a different story. The orbits of stripped stars are more likely to shrink and become more circular. About become more tightly bound. Additionally, a population of short period stripped stars emerges. These stars likely experienced multiple high speed collisions, giving them multiple opportunities to shrink their semimajor axes. The effects are even more pronounced for simulation D (not shown). Under type D conditions, stripped stars are overwhelmingly on less eccentric orbits, explaining why the high speed collision TDE rate for these conditions are so low.
Eccentricity trends can also be gleaned from Figure 3. For type B conditions, mergers always act to make the orbit more circular. In addition to energy, angular momentum must be conserved. For stars orbiting in the same direction, their angular momentum vectors are always aligned. Since the semimajor axis shrinks after a collision, the eccentricity must decrease to conserve angular momentum. This effect can be seen in vertical extent of the green circles in B compared to A. The most eccentric orbits for merged stars in B have been largely removed. We reiterate that the results are somewhat muddied by the occurrence of high speed collisions in a subset of this population. Under type A conditions, low speed collisions both decrease and increase the orbital eccentricity. The most eccentric final orbits become TDEs or plunges, removing the stars from the population. We note that in actuality, the orbital properties of the stars can be modified by resonant and non-resonant relaxation processes, not accounted for in these results (e.g., Rauch & Tremaine, 1996; Hopman & Alexander, 2006; Kocsis & Tremaine, 2011).
4.3 Unbound Stars
High speed collisions can unbind stars from the SMBH. These interactions, treated similarly to a hyperbolic encounter, can place one star on a more tightly bound orbit while giving the other star a positive orbital energy. We show properties of the unbound stars from simulations A and B in Figure 4. The initial orbits tend to be eccentric. We also confirmed by inspection of specific cases that the collisions tend to occur near periapsis. For the most part, the final orbits have eccentricity just above unity. We calculate the speed at infinity, , for these stars based on their final orbital energy and color code the points in Figure 4 based on its value. Typical speeds range from to km/s, but occasionally one star will have a above km/s, as was the case in simulation B. For simulation C, which includes some form of dissipation during high speed collisions, there were fewer unbound stars overall, but their distribution was similar. The maximum was km/s. The single unbound star from the fourth row of Figure 2 (simulation D) had equal to km/s.
These maximum values suggest that high speed collisions may represent another mechanism to launch hypervelocity stars from galactic nuclei. The most famous of these mechanisms is the Hills Mechanism, in which a binary is disrupted by the SMBH such that one star is ejected at high speed while the other is retained on a tightly bound orbit (e.g., Hills, 1988; Generozov & Madigan, 2020), though other mechanisms exist (e.g., Yu & Tremaine, 2003; Perets, 2009a). Close encounters between single stars are known to eject stars from dense stellar clusters (Henon, 1969; Lin & Tremaine, 1980), and in fact Yu & Tremaine (2003) consider such interactions as a means of producing hypervelocity stars. Omitting collisions, they find a low ejection rate at speeds km/s. We consider collisions exclusively and treat them as modified close encounters. While our largest speed is consistent with those generated by the Hill’s Mechanism ( km/s, Hills, 1988), about have km/s. Observations of hypervelocity stars with origins pointing to the Galactic center exhibit a range of speeds, from the hundreds to thousands of km/s (e.g., Brown et al., 2005, 2018; Koposov et al., 2020; Generozov & Perets, 2022, to quote from the latter, stars need ejection speed km/s from the Galactic center to have km/s at kpc). The of our stars shown in Figure 4 do not account for any additional terms in the potential beyond the SMBH. We reserve a detailed comparison of our results to observations for future work.
The mass loss fitting formulae from Rauch (1999) give very low mass loss for larger impact parameter collisions () at moderately high speeds ( km/s); generally, the fractional mass loss in these cases is less than a percent, and unbound stars in Figure 2 appear as if they have not lost any mass at all. However, fitting formulae from high speed collisions can be unreliable (Freitag & Benz, 2005). We therefore refrain from commenting on the masses of the unbound stars in detail except to state that some of them may look like stripped stars (Gibson et al., 2024).
As can be seen in Figure 2, a maximum of of the stars in the inner parsec region may become unbound from the SMBH. This number far exceeds those that become TDEs through high speed collisions. Furthermore, this outcome represents a surprisingly high fraction of stars that experience such collisions: about a fifth of stars that experience high speed collisions become unbound. This high number may owe to a few conspiring conditions:
For reasons discussed in Section 3.4 and as supported by Figure 4, unbound stars tend come from high speed collisions near the periapsis of eccentric orbits. Near periapsis, a small boost in the frame of the SMBH can tip the star’s speed over the escape speed. However, the merger-to-high speed collision boundary also lies around km/s. The velocity dispersion only exceeds this value within about pc, and the vast majority of stars reside outside this distance. In consequence, most high speed collisions can only occur near periapsis, where speeds are high enough to no longer be in the merger regime and also where unbinding the star from the SMBH becomes a more favorable outcome. Our thermal initial eccentricity distribution ensures that plenty of stars begin on very eccentric orbits (see Appendix A.1 for the impact of the eccentricity distribution).
Dissipation during the collision can reduce the number of unbound stars. As discussed in Section 3.2.2, it is possible that high speed direct collisions reduce the speeds of the stars in their center of mass frame. The physical impact of the collision may reduce the number of stars that get enough of a boost to escape the inner parsec. Type C and D collision conditions test the limits of this mechanism in producing unbound stars. Notably, if high speed collisions reduce the post-collision speed by in the center of mass frame, only a few tenths of a percent of the cluster stars escape.

5 Numerical Results with Relaxation
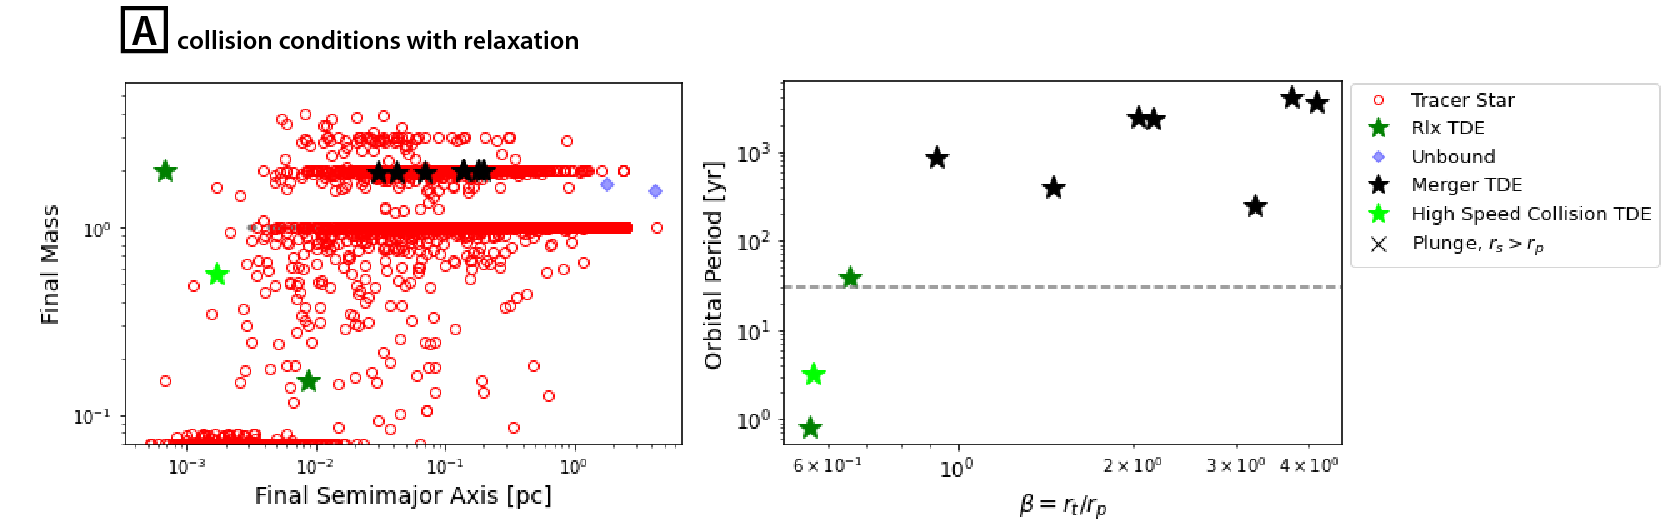
Now that we have built a physical picture of how collisions shape the stellar cluster, we turn on our prescription for two-body relaxation in the code. These simulations take longer to run, so the sample size of the tracer stars presented herein number at instead of . We present results in Figure 5. The symbols are all the same as in previous figures, with one addition: stars that became TDEs through two body relaxation are shown in dark green. The orbital evolution of these stars where still affected by collisions, as can be seen by their masses. Interestingly, the stripped star that became a TDE via relaxation had experienced a collision within the same timestep. The collision had placed it on an eccentric orbit just shy of the tidal radius, periapsis of AU versus AU needed for partial disruption. Had the star been inflated at all from the collision, material would have been siphoned off by the SMBH. As the star’s parameters did not trigger the stopping condition, our relaxation prescription tipped the star into the tidal radius.
We place a caveat on the TDE inside pc. The closest known star to the Milky Way’s SMBH has a periapsis just under pc (e.g., Gillessen et al., 2017). It is questionable whether our two-body relaxation prescription applies within this radius. However, this star too experienced a collision in the previous timestep which, had the star been inflated, would have led to a disruption. Altogether, our results suggest that collisions represent a viable mechanism to preferentially deposit stars that are (1) more massive than the surrounding population due to a merger or (2) stripped stars into the tidal radius. Some of these TDEs could be observed as repeating TDEs. Additionally, we may be missing disruptions from stars that are inflated post collision, leading to qualitatively different electromagnetic signatures (e.g., MacLeod et al., 2013; Gibson et al., 2024).
The unbound stars present something of a puzzle. Even accounting for the difference in sample size, we find much fewer compared to Figure 2 (no relaxation). There are a few possible explanations. First, the relaxation prescription changes the orbital energy by roughly order of itself over the relaxation timescale, which is less than Gyr in the model cluster. Stars at larger radii can therefore wander towards the SMBH, where destructive collisions become possible. Once in this “danger zone”, they can experience enough high-speed collisions to become destroyed. Roughly stars were destroyed over this simulation. While this process is slow (see e.g., Rose & MacLeod, 2024), it does drain stars from the sample population. In the simulation without relaxation, the majority of stars began and remained outside of this region. Only stars were destroyed, a much smaller fraction of the sample, and most unbound stars had initial semimajor axes outside of pc (see Appendix A.4).
The reduction of unbound stars may also be related to the interplay between the two dynamical processes. We speculate on why this second option might be true. Collisions are discrete events. Relaxation, in contrast, is a diffusion process that slowly alters a star’s orbital parameters. This timescale is less than the collision timescale for most of the stars in our sample (see Figure 1), particularly where the unbound stars originate in our earlier simulations. The implication is that when a collision does occur, it may be less likely to catch the orbit in a state favorable for unbinding the star. The last possibility is that there is something in our relaxation prescription which we have yet to detect that is artificially suppressing the unbound stars.111We did test modifications to the treatment of relaxation near the boundaries of our cluster. However, only a few stars were unbound in these tests. Regardless, the interplay of relaxation and collisions merit a more thorough examination. We reserve a detailed study for future work.
6 Conclusions
Collisions between main-sequence stars occur in the nuclear star cluster and become common within the inner pc (e.g., Rose & MacLeod, 2024). In this proof-of-concept study, we examine the orbital changes that result from these collisions. Specifically, we assess whether physical collisions can contribute to the production of TDEs and ejected stars. Collisions in galactic nuclei can be understood in two types.
In the first type, the relative speed between the stars is low and the collision results in a merger. Little mass loss occurs (e.g., Lai et al., 1993) and we can treat the stars as sticky spheres (e.g., Kremer et al., 2020; González et al., 2021). Conservation of momentum allows us to calculate the final orbit of the merged star. The second type of collision occurs at speeds that exceed the escape velocity from the stars. While the high speeds ensure that the stars remain unbound from each other, they can also drive mass loss from the stars, in some cases producing a stripped star (e.g., Lai et al., 1993; Rauch, 1999; Freitag & Benz, 2005; Gibson et al., 2024). We use fitting formulae from Rauch (1999) to calculate the mass loss. However, we refrain from commenting in detail on the final masses of these stars because fitting formulae are not always accurate for collisions in galactic nuclei (Freitag & Benz, 2005). We are examining these collisions further using sph simulations in forthcoming work (Rose et al. in prep.).
We use limiting cases and heuristic arguments to determine the final orbits from high speed collisions. If the stars were point masses, these interactions would unfold as a hyperbolic encounter in the center of mass frame of the stars. As an upper limit, we could calculate the deflection angle using Eq. 4. However, while a grazing collision approaches the limit given by Eq. 4, a head-on collision should not result in any deflection at all. We therefore adopt Eq. 5, which meets both criteria. We also test the role of dissipation by reducing the speeds of the stars post-collision in their center of mass frame.
Our simulations follow a sample of tracer stars embedded in a fixed, uniform cluster. We test a variety of cluster conditions and find the following:
-
1.
Tidal disruption events: We find that both high and low speed collisions can produce TDEs by placing stars on highly eccentric orbits. Certain conditions, however, can be prohibitive to this mechanism. If stars all orbit the SMBH in the same direction, for example, collision-induced mergers cannot produce TDEs because the orbital angular momentum vectors of the colliding stars are aligned. If high speed collisions are highly dissipative, then TDEs from this class of collisions are similarly suppressed. The overall rates of collision TDEs remain to be seen. Generally, however, our results mean that collision-affected stars can be delivered to the tidal radius by the collisions themselves, in addition to standard two-body relaxation that affects the population at large. The TDEs immediately post-collision versus after the star has relaxed may look quite difficult (see discussion of imminent versus eventual TDEs in Gibson et al., 2024), adding to the richness of the observations that this dynamical process can yield.
-
2.
Unbound stars: High speed collisions can place stars on unbound orbits, especially if the collisions occur near the periapsis of an eccentric orbit. As evidenced by the low mass loss in Figure 2, these collisions tend to have larger impact parameter. These grazing collisions approach the limit given by Eq. 4. Of course, in a physical collision, stars impede each other’s motion. We test simple cases in which the star is only deflected a fraction of the angle and its speed is reduced post-collision. Despite these changes, the unbound stars persist, albeit in much lower numbers. We reserve a precise examination of their rates and properties for future work, though some may look like stripped stars (Gibson et al., 2024). In the optimistic case, stellar collisions represent a mechanism to launch hypervelocity stars from galactic nuclei, joining the list of existing mechanisms (e.g., Hills, 1988; Yu & Tremaine, 2003; Ginsburg & Loeb, 2007; Perets, 2009a, b; Generozov & Madigan, 2020). The Hills Mechanism elegantly explains both the origins of the S-star cluster, young-seeming massive stars in the vicinity of the SMBH, and hypervelocity stars using the same dynamical process (e.g., Hills, 1988; Ghez et al., 2003; Ginsburg & Loeb, 2007; Perets et al., 2007; Madigan et al., 2009; Löckmann et al., 2009; Generozov & Madigan, 2020; Generozov, 2021). Collisions present another possibility, where S-stars are the high-mass tail of the merger products created by successive low-speed collisions (see e.g., Rose et al., 2023), and hypervelocity stars trace to high speed collisions near periapsis. However, the viability of this ejection mechanism still faces tests in the form of dissipation during collisions, a stellar mass function, interplay with other dynamical processes such as relaxation, and overall rates in a three-dimensional cluster.
Appendix A Supplemental Figures
A.1 Role of the Initial Eccentricity Distribution
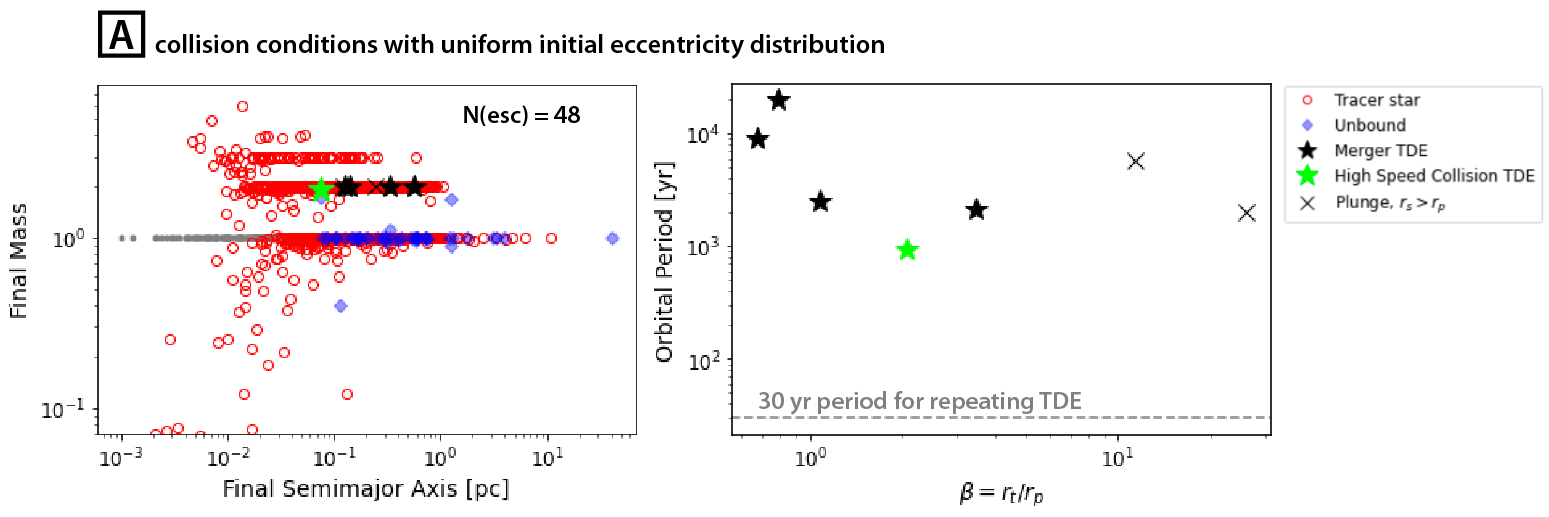
Less eccentric orbits on average should result in fewer unbound stars. We test this hypothesis by drawing the eccentricities of tracer stars from a uniform distribution (average ) instead of a thermal one (average ). We compare the results in the first row of Figure 2, which uses a thermal initial eccentricity distribution, to that shown in Figure 6. Despite both having type A initial conditions, changing the eccentricity distribution to uniform reduces the number of unbound stars by about a factor of . There were also fewer high speed collisions overall, a reduction. These results come from reducing the number of stars with speeds at periapsis that place them in the high speed collision regime.
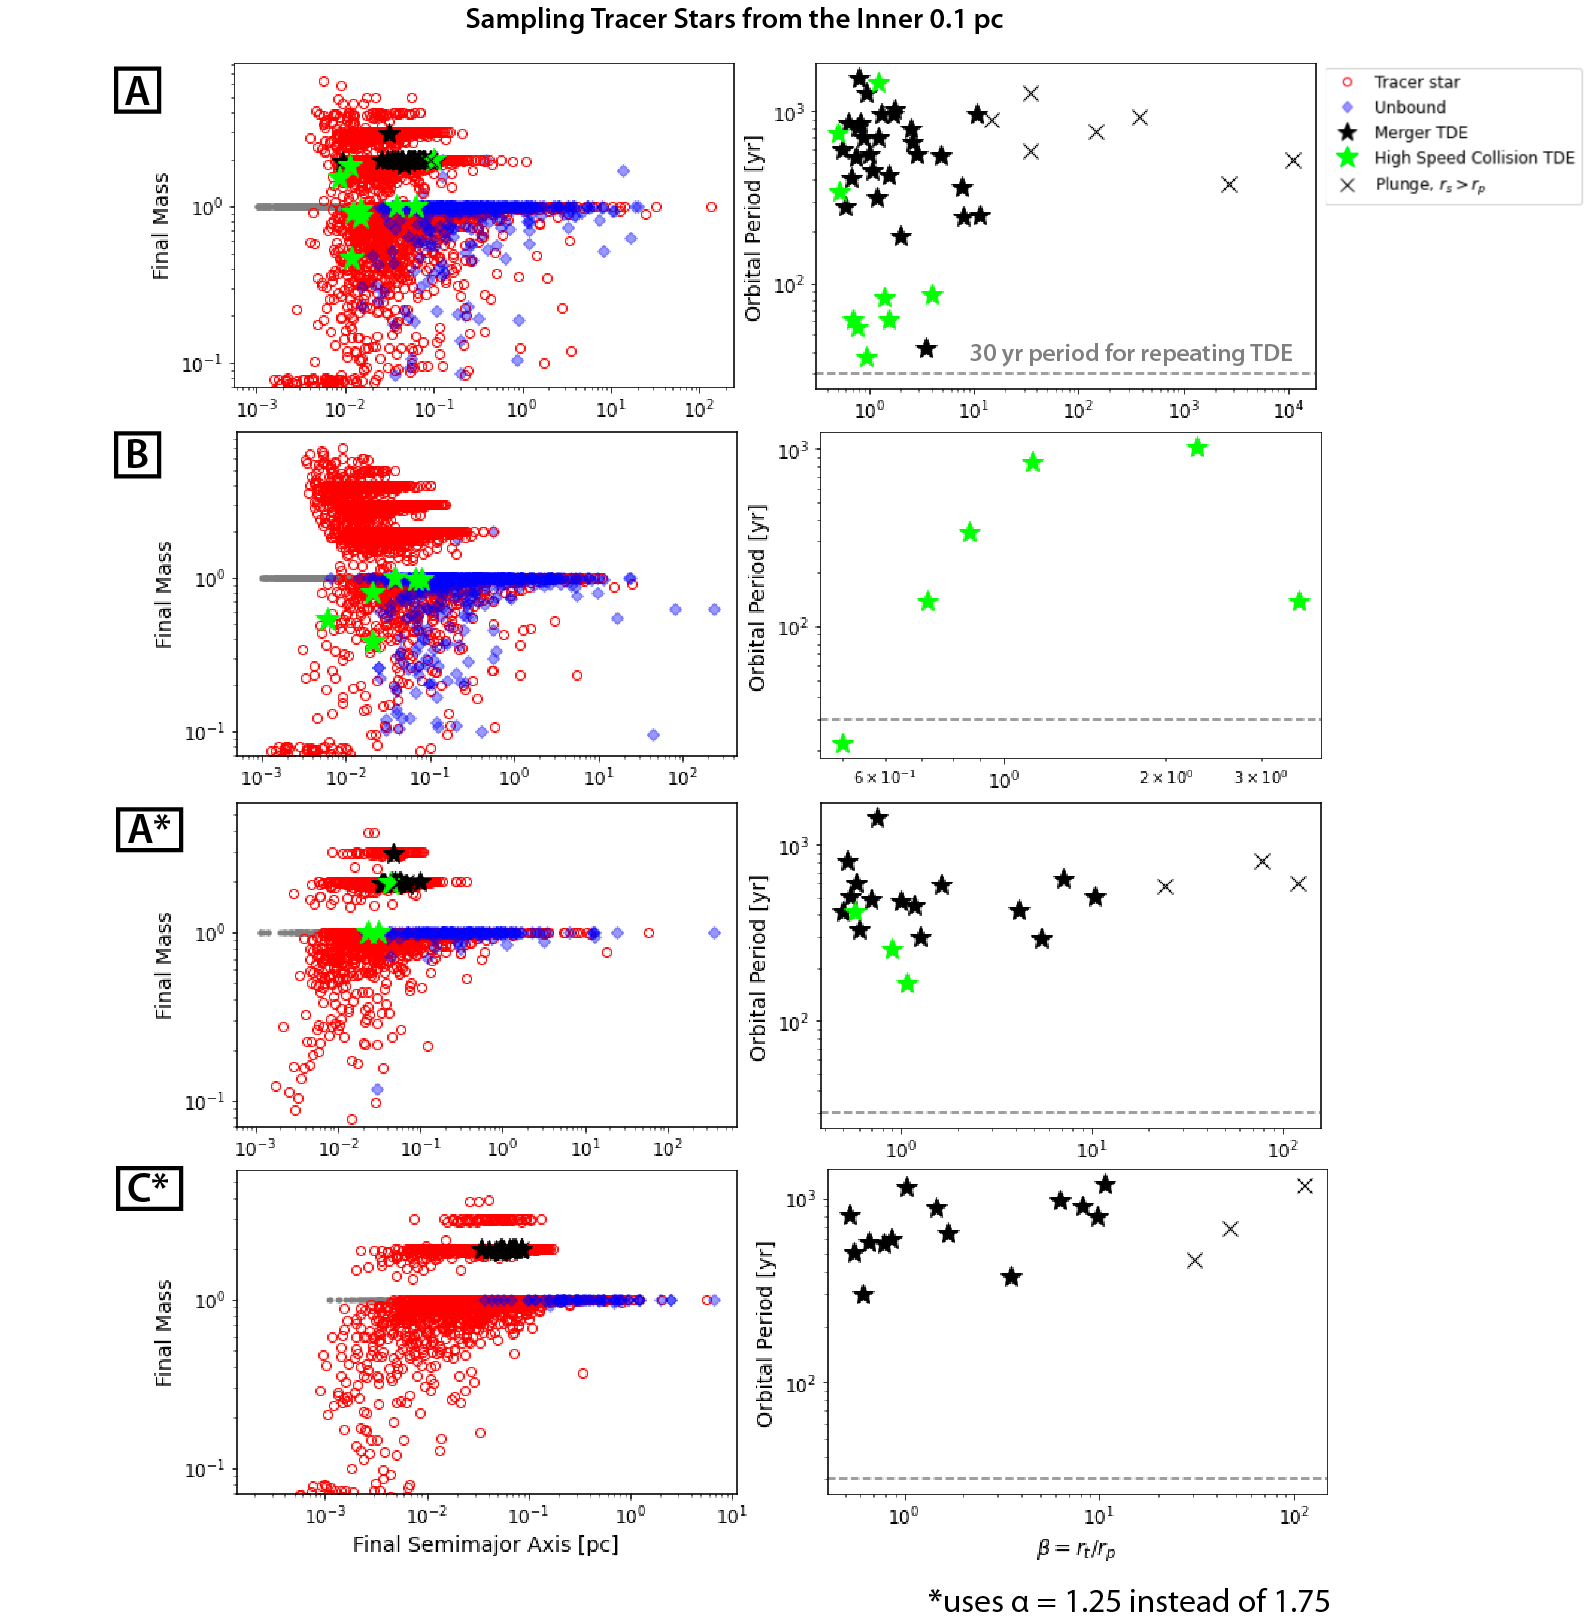
A.2 Sampling the Inner Collision-dominated Region
Most collisions occur in the inner parsec of the nuclear star cluster, where the collision timescale becomes shorter than Gyr. In order to probe this region in greater detail, we run a similar set of simulations to those shown in Figure 2, but with the stars sampled from to pc. We note that a cusp with slope results in a very high density in this region. The actual cusp in the Galactic center may be closer to (Gallego-Cano et al., 2018b). Additionally, collisions themselves can deplete the cusp in the inner pc. A shallower cusp would lead to a lower collision rate. We therefore test with the idea that reality may lie somewhere in the middle. These simulations are marked with an asterisk in Figure 7. The shallower profile means that the collision timescale is longer and that fewer collisions occur within the cluster over the integration time. However, as can be seen in the Figure, the collisions that do occur can stil produce TDEs. Additionally, type B conditions, which prohibit merger TDEs, can still have collision-driven TDEs of a different kind.
A.3 Alternative Fitting Formulae
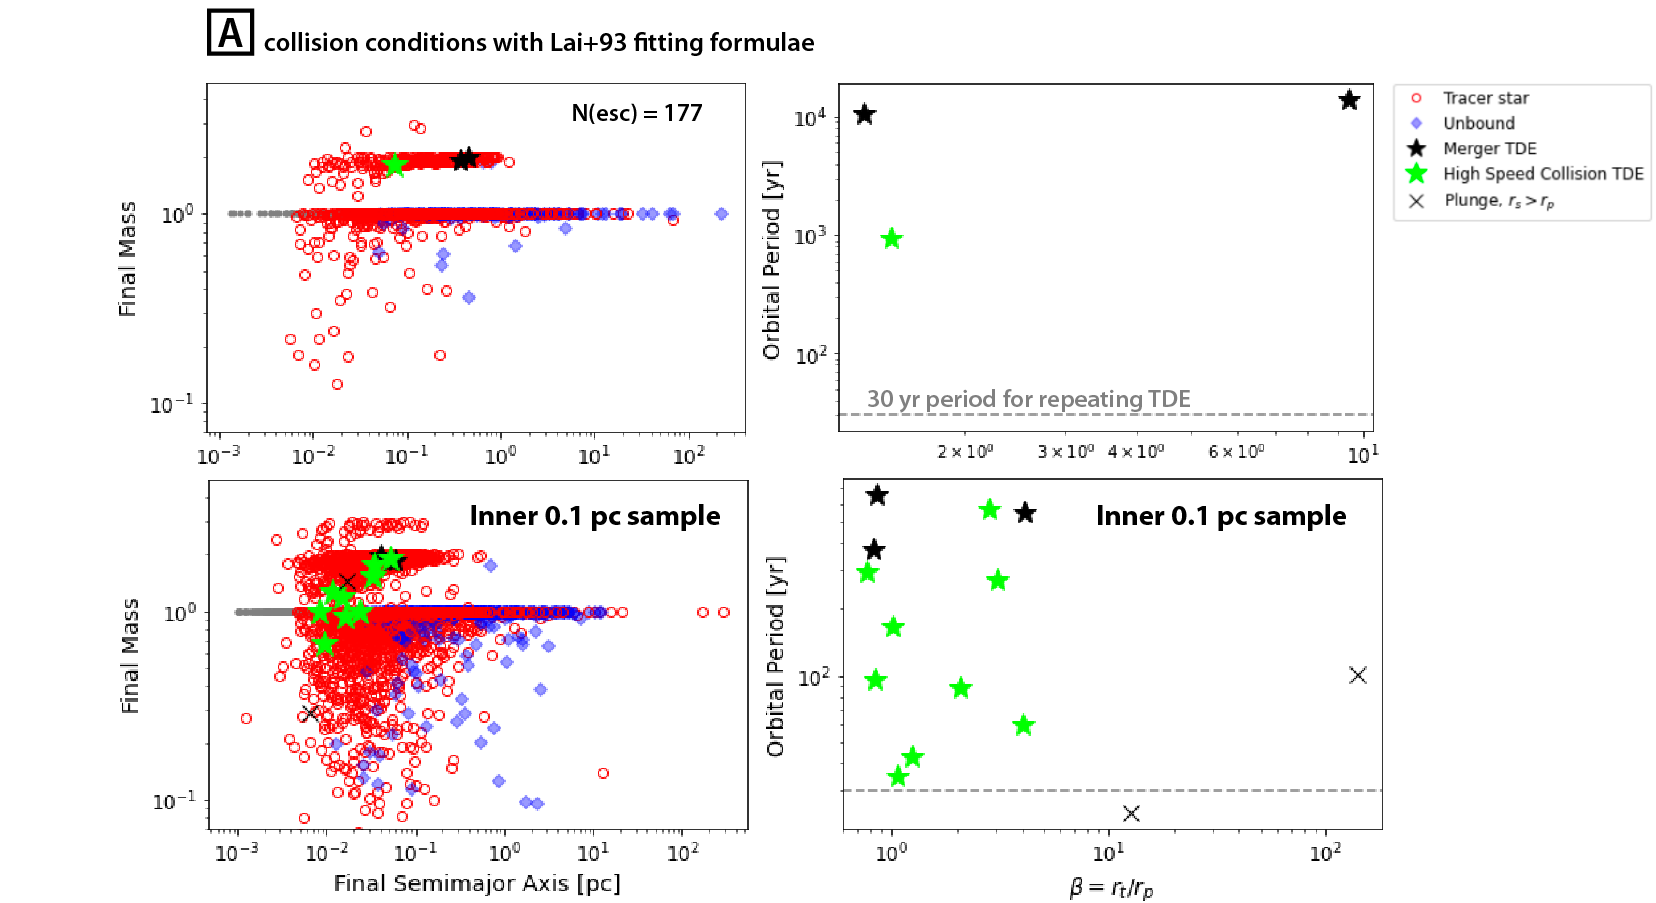
As mentioned in Section 3.1, we leverage fitting formulae and intuitive toy models to calculate the mass loss from a collision and determine whether a merger occurs. Simulations shown in the main text and in Figure 7 use fitting formulae from Rauch (1999) and heuristic arguments to determine if a merger occurs. In this section, we present simulations with type A collision conditions that use fitting formulae from Lai et al. (1993). Lai et al. (1993) include fitting formula for the capture radius, a function of the relative speed between the stars and their impact parameter. This formula leads to less mergers than the simple prescription that we use in the main text of this paper, which is also similar to the prescription used in Rauch (1999) (see for a full discussion Rose et al., 2023). We present the results of two simulations using the Lai et al. (1993) formulae in Figure 8. The upper row samples tracer stars on a cusp from to pc, while the second row focuses on the inner pc. As expected, with the overall reduction in mergers – they instead are treated as high speed collisions – there are fewer merger TDEs. However, it is still possible to get TDEs of all types and unbound stars.
A.4 Orbital Parameters
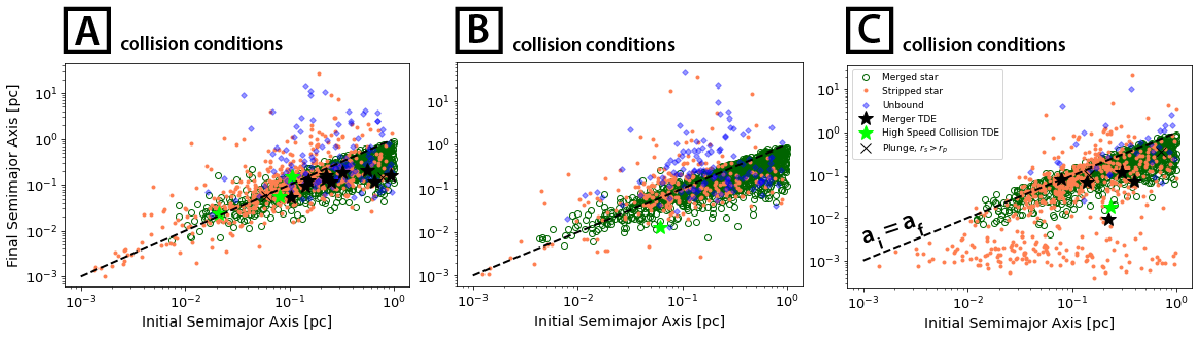
We expand upon Section 4.2 in this appendix. We compare the final semimajor axes versus the initial semimajor axes of the stars in Figure 9. As is our convention in the main text, green circles represent stars with M⊙, while orange dots have M⊙. TDEs and unbound stars are represented using stars and diamonds. The black dashed line shows where the initial and final semimajor axes are equal.
Mergers work to shrink the semimajor axis, while high speed collisions can increase or decrease it, as is visible in the Figure. For the most part, green circles lie below the black dashed lines. A few lie above the black line, mostly within pc, because they also experienced a high speed collision. They initially resided within pc, where high speed collisions become more likely.
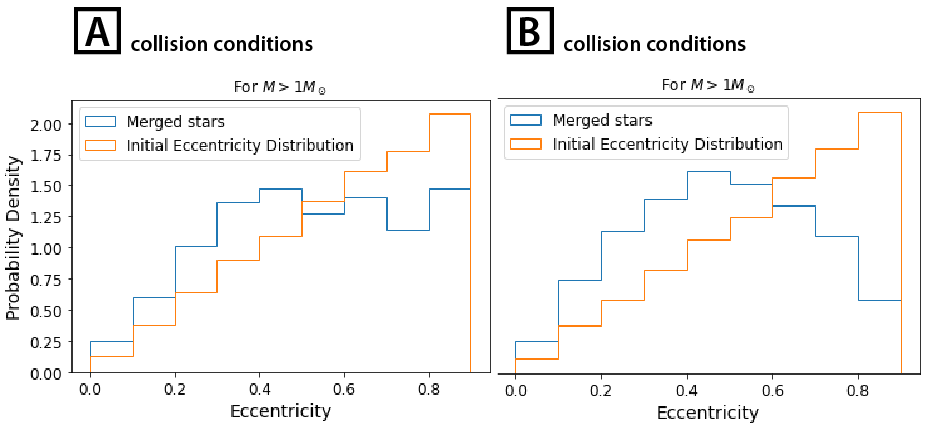
We examine the final eccentricities for merger-affected stars in Figure 10. We compare the final eccentricity distribution to the initial thermal distribution. For reasons outlined in Section 4.2, type B mergers circularize orbits. This effect can be seen in Figure 10, where there is a dearth of eccentric orbits.
The effects on eccentricity in type A conditions are harder to tease out. of the time the orbits are aligned and the eccentricity decreases. The other of the time, the angular momenta vector are anti-aligned, so even though the semimajor axis still shrinks, the eccentricity can increase. The most eccentric merged stars are removed from the population because they become TDEs or plunges. The result is an eccentricity distribution that flattens at high () eccentricities. However, the actual number of merged star orbits that became more (less) eccentric are similar.
References
- Alexander (1999) Alexander, T. 1999, ApJ, 527, 835, doi: 10.1086/308129
- Alexander & Pfuhl (2014) Alexander, T., & Pfuhl, O. 2014, ApJ, 780, 148, doi: 10.1088/0004-637X/780/2/148
- Bahcall & Wolf (1976) Bahcall, J. N., & Wolf, R. A. 1976, ApJ, 209, 214, doi: 10.1086/154711
- Balberg (2024) Balberg, S. 2024, ApJ, 962, 150, doi: 10.3847/1538-4357/ad1690
- Balberg et al. (2013) Balberg, S., Sari, R., & Loeb, A. 2013, MNRAS, 434, L26, doi: 10.1093/mnrasl/slt071
- Bartko et al. (2009) Bartko, H., Martins, F., Fritz, T. K., et al. 2009, ApJ, 697, 1741, doi: 10.1088/0004-637X/697/2/1741
- Binney & Tremaine (2008) Binney, J., & Tremaine, S. 2008, Galactic Dynamics: Second Edition
- Bradnick et al. (2017) Bradnick, B., Mandel, I., & Levin, Y. 2017, MNRAS, 469, 2042, doi: 10.1093/mnras/stx1007
- Brown et al. (2005) Brown, W. R., Geller, M. J., Kenyon, S. J., & Kurtz, M. J. 2005, ApJ, 622, L33, doi: 10.1086/429378
- Brown et al. (2018) Brown, W. R., Lattanzi, M. G., Kenyon, S. J., & Geller, M. J. 2018, ApJ, 866, 39, doi: 10.3847/1538-4357/aadb8e
- Brutman et al. (2024) Brutman, Y., Steinberg, E., & Balberg, S. 2024, arXiv e-prints, arXiv:2408.16383, doi: 10.48550/arXiv.2408.16383
- Dale & Davies (2006) Dale, J. E., & Davies, M. B. 2006, MNRAS, 366, 1424, doi: 10.1111/j.1365-2966.2005.09937.x
- Dale et al. (2009) Dale, J. E., Davies, M. B., Church, R. P., & Freitag, M. 2009, MNRAS, 393, 1016, doi: 10.1111/j.1365-2966.2008.14254.x
- Dessart et al. (2024) Dessart, L., Ryu, T., Amaro Seoane, P., & Taylor, A. M. 2024, A&A, 682, A58, doi: 10.1051/0004-6361/202348228
- Ferrarese & Ford (2005) Ferrarese, L., & Ford, H. 2005, Space Sci. Rev., 116, 523, doi: 10.1007/s11214-005-3947-6
- Freitag & Benz (2002) Freitag, M., & Benz, W. 2002, A&A, 394, 345, doi: 10.1051/0004-6361:20021142
- Freitag & Benz (2005) —. 2005, MNRAS, 358, 1133, doi: 10.1111/j.1365-2966.2005.08770.x
- Gallego-Cano et al. (2018a) Gallego-Cano, E., Schödel, R., Dong, H., et al. 2018a, A&A, 609, A26, doi: 10.1051/0004-6361/201730451
- Gallego-Cano et al. (2018b) —. 2018b, A&A, 609, A26, doi: 10.1051/0004-6361/201730451
- Gallegos-Garcia et al. (2018) Gallegos-Garcia, M., Law-Smith, J., & Ramirez-Ruiz, E. 2018, ApJ, 857, 109, doi: 10.3847/1538-4357/aab5b8
- Generozov (2021) Generozov, A. 2021, MNRAS, 501, 3088, doi: 10.1093/mnras/staa3851
- Generozov & Madigan (2020) Generozov, A., & Madigan, A.-M. 2020, ApJ, 896, 137, doi: 10.3847/1538-4357/ab94bc
- Generozov & Perets (2022) Generozov, A., & Perets, H. B. 2022, MNRAS, 513, 4257, doi: 10.1093/mnras/stac1108
- Genzel et al. (2010) Genzel, R., Eisenhauer, F., & Gillessen, S. 2010, Reviews of Modern Physics, 82, 3121, doi: 10.1103/RevModPhys.82.3121
- Ghez et al. (2005) Ghez, A. M., Salim, S., Hornstein, S. D., et al. 2005, ApJ, 620, 744, doi: 10.1086/427175
- Ghez et al. (2003) Ghez, A. M., Duchêne, G., Matthews, K., et al. 2003, ApJ, 586, L127, doi: 10.1086/374804
- Ghez et al. (2008) Ghez, A. M., Salim, S., Weinberg, N. N., et al. 2008, ApJ, 689, 1044, doi: 10.1086/592738
- Gibson et al. (2024) Gibson, C., Kıroğlu, F., Lombardi, J. C., J., et al. 2024, arXiv e-prints, arXiv:2410.02146, doi: 10.48550/arXiv.2410.02146
- Gillessen et al. (2009) Gillessen, S., Eisenhauer, F., Trippe, S., et al. 2009, ApJ, 692, 1075, doi: 10.1088/0004-637X/692/2/1075
- Gillessen et al. (2017) Gillessen, S., Plewa, P. M., Eisenhauer, F., et al. 2017, ApJ, 837, 30, doi: 10.3847/1538-4357/aa5c41
- Ginsburg & Loeb (2007) Ginsburg, I., & Loeb, A. 2007, MNRAS, 376, 492, doi: 10.1111/j.1365-2966.2007.11461.x
- González et al. (2021) González, E., Kremer, K., Chatterjee, S., et al. 2021, ApJ, 908, L29, doi: 10.3847/2041-8213/abdf5b
- Guillochon & Ramirez-Ruiz (2013) Guillochon, J., & Ramirez-Ruiz, E. 2013, ApJ, 767, 25, doi: 10.1088/0004-637X/767/1/25
- Guillochon et al. (2009) Guillochon, J., Ramirez-Ruiz, E., Rosswog, S., & Kasen, D. 2009, ApJ, 705, 844, doi: 10.1088/0004-637X/705/1/844
- Henon (1969) Henon, M. 1969, A&A, 2, 151
- Hills (1975) Hills, J. G. 1975, Nature, 254, 295, doi: 10.1038/254295a0
- Hills (1988) —. 1988, Nature, 331, 687, doi: 10.1038/331687a0
- Hinkle et al. (2024) Hinkle, J. T., Shappee, B. J., Auchettl, K., et al. 2024, arXiv e-prints, arXiv:2405.08855, doi: 10.48550/arXiv.2405.08855
- Hopman & Alexander (2006) Hopman, C., & Alexander, T. 2006, ApJ, 645, L133, doi: 10.1086/506273
- Hosek et al. (2019) Hosek, Jr., M. W., Lu, J. R., Anderson, J., et al. 2019, The Astrophysical Journal, 870, 44, doi: 10.3847/1538-4357/aaef90
- Kochanek (2016a) Kochanek, C. S. 2016a, Monthly Notices of the Royal Astronomical Society, 458, 127, doi: 10.1093/mnras/stw267
- Kochanek (2016b) —. 2016b, Monthly Notices of the Royal Astronomical Society, 461, 371, doi: 10.1093/mnras/stw1290
- Kocsis & Tremaine (2011) Kocsis, B., & Tremaine, S. 2011, MNRAS, 412, 187, doi: 10.1111/j.1365-2966.2010.17897.x
- Koposov et al. (2020) Koposov, S. E., Boubert, D., Li, T. S., et al. 2020, MNRAS, 491, 2465, doi: 10.1093/mnras/stz3081
- Kormendy & Ho (2013) Kormendy, J., & Ho, L. C. 2013, ARA&A, 51, 511, doi: 10.1146/annurev-astro-082708-101811
- Kremer et al. (2020) Kremer, K., Spera, M., Becker, D., et al. 2020, ApJ, 903, 45, doi: 10.3847/1538-4357/abb945
- Lai et al. (1993) Lai, D., Rasio, F. A., & Shapiro, S. L. 1993, ApJ, 412, 593, doi: 10.1086/172946
- Lee et al. (2010) Lee, W. H., Ramirez-Ruiz, E., & van de Ven, G. 2010, ApJ, 720, 953, doi: 10.1088/0004-637X/720/1/953
- Leigh et al. (2016) Leigh, N. W. C., Antonini, F., Stone, N. C., Shara, M. M., & Merritt, D. 2016, MNRAS, 463, 1605, doi: 10.1093/mnras/stw2018
- Levin & Beloborodov (2003) Levin, Y., & Beloborodov, A. M. 2003, ApJ, 590, L33, doi: 10.1086/376675
- Lin & Tremaine (1980) Lin, D. N. C., & Tremaine, S. 1980, ApJ, 242, 789, doi: 10.1086/158513
- Linial & Sari (2022) Linial, I., & Sari, R. 2022, ApJ, 940, 101, doi: 10.3847/1538-4357/ac9bfd
- Löckmann et al. (2009) Löckmann, U., Baumgardt, H., & Kroupa, P. 2009, MNRAS, 398, 429, doi: 10.1111/j.1365-2966.2009.15157.x
- Lombardi et al. (2002) Lombardi, James C., J., Warren, J. S., Rasio, F. A., Sills, A., & Warren, A. R. 2002, ApJ, 568, 939, doi: 10.1086/339060
- Lu & Naoz (2019) Lu, C. X., & Naoz, S. 2019, MNRAS, 484, 1506, doi: 10.1093/mnras/stz036
- Lu et al. (2013) Lu, J. R., Do, T., Ghez, A. M., et al. 2013, ApJ, 764, 155, doi: 10.1088/0004-637X/764/2/155
- Lu et al. (2009) Lu, J. R., Ghez, A. M., Hornstein, S. D., et al. 2009, ApJ, 690, 1463, doi: 10.1088/0004-637X/690/2/1463
- MacLeod et al. (2012) MacLeod, M., Guillochon, J., & Ramirez-Ruiz, E. 2012, The Astrophysical Journal, 757, 134, doi: 10.1088/0004-637X/757/2/134
- MacLeod et al. (2013) MacLeod, M., Ramirez-Ruiz, E., Grady, S., & Guillochon, J. 2013, The Astrophysical Journal, 777, 133, doi: 10.1088/0004-637X/777/2/133
- Madigan et al. (2009) Madigan, A.-M., Levin, Y., & Hopman, C. 2009, ApJ, 697, L44, doi: 10.1088/0004-637X/697/1/L44
- Magorrian & Tremaine (1999) Magorrian, J., & Tremaine, S. 1999, MNRAS, 309, 447, doi: 10.1046/j.1365-8711.1999.02853.x
- Manukian et al. (2013) Manukian, H., Guillochon, J., Ramirez-Ruiz, E., & O’Leary, R. M. 2013, ApJ, 771, L28, doi: 10.1088/2041-8205/771/2/L28
- Mastrobuono-Battisti et al. (2014) Mastrobuono-Battisti, A., Perets, H. B., & Loeb, A. 2014, ApJ, 796, 40, doi: 10.1088/0004-637X/796/1/40
- Melchor et al. (2024) Melchor, D., Mockler, B., Naoz, S., Rose, S. C., & Ramirez-Ruiz, E. 2024, ApJ, 960, 39, doi: 10.3847/1538-4357/acfee0
- Merritt (2013) Merritt, D. 2013, Dynamics and Evolution of Galactic Nuclei (Princeton University Press)
- Miller et al. (2023) Miller, J. M., Mockler, B., Ramirez-Ruiz, E., et al. 2023, ApJ, 953, L23, doi: 10.3847/2041-8213/ace03c
- Mockler et al. (2024) Mockler, B., Gallegos-Garcia, M., Götberg, Y., Miller, J. M., & Ramirez-Ruiz, E. 2024, ApJ, 973, L9, doi: 10.3847/2041-8213/ad6c34
- Mockler et al. (2023) Mockler, B., Melchor, D., Naoz, S., & Ramirez-Ruiz, E. 2023, ApJ, 959, 18, doi: 10.3847/1538-4357/ad0234
- Mockler et al. (2022) Mockler, B., Twum, A. A., Auchettl, K., et al. 2022, ApJ, 924, 70, doi: 10.3847/1538-4357/ac35d5
- Naoz et al. (2022) Naoz, S., Rose, S. C., Michaely, E., et al. 2022, ApJ, 927, L18, doi: 10.3847/2041-8213/ac574b
- Neumayer et al. (2020) Neumayer, N., Seth, A., & Böker, T. 2020, A&A Rev., 28, 4, doi: 10.1007/s00159-020-00125-0
- Paumard et al. (2006) Paumard, T., Genzel, R., Martins, F., et al. 2006, ApJ, 643, 1011, doi: 10.1086/503273
- Perets (2009a) Perets, H. B. 2009a, ApJ, 698, 1330, doi: 10.1088/0004-637X/698/2/1330
- Perets (2009b) —. 2009b, ApJ, 690, 795, doi: 10.1088/0004-637X/690/1/795
- Perets et al. (2007) Perets, H. B., Hopman, C., & Alexander, T. 2007, ApJ, 656, 709, doi: 10.1086/510377
- Rauch (1999) Rauch, K. P. 1999, ApJ, 514, 725, doi: 10.1086/306953
- Rauch & Tremaine (1996) Rauch, K. P., & Tremaine, S. 1996, New A, 1, 149, doi: 10.1016/S1384-1076(96)00012-7
- Rees (1988) Rees, M. J. 1988, Nature, 333, 523, doi: 10.1038/333523a0
- Rodriguez et al. (2022) Rodriguez, C. L., Weatherford, N. C., Coughlin, S. C., et al. 2022, ApJS, 258, 22, doi: 10.3847/1538-4365/ac2edf
- Rose & MacLeod (2024) Rose, S. C., & MacLeod, M. 2024, ApJ, 963, L17, doi: 10.3847/2041-8213/ad251f
- Rose et al. (2020) Rose, S. C., Naoz, S., Gautam, A. K., et al. 2020, ApJ, 904, 113, doi: 10.3847/1538-4357/abc557
- Rose et al. (2022) Rose, S. C., Naoz, S., Sari, R., & Linial, I. 2022, ApJ, 929, L22, doi: 10.3847/2041-8213/ac6426
- Rose et al. (2023) —. 2023, arXiv e-prints, arXiv:2304.10569, doi: 10.48550/arXiv.2304.10569
- Rosswog et al. (2009) Rosswog, S., Ramirez-Ruiz, E., & Hix, W. R. 2009, The Astrophysical Journal, 695, 404, doi: 10.1088/0004-637X/695/1/404
- Rubin & Loeb (2011) Rubin, D., & Loeb, A. 2011, Advances in Astronomy, 2011, 174105, doi: 10.1155/2011/174105
- Ryu et al. (2024a) Ryu, T., Amaro Seoane, P., Taylor, A. M., & Ohlmann, S. T. 2024a, MNRAS, 528, 6193, doi: 10.1093/mnras/stae396
- Ryu et al. (2024b) Ryu, T., Perna, R., & Cantiello, M. 2024b, ApJ, 965, L25, doi: 10.3847/2041-8213/ad3946
- Sanders (1970) Sanders, R. H. 1970, ApJ, 162, 791, doi: 10.1086/150711
- Schödel et al. (2003) Schödel, R., Genzel, R., Ott, T., & Eckart, A. 2003, Astronomische Nachrichten Supplement, 324, 535, doi: 10.1002/asna.200385048
- Sills et al. (2001) Sills, A., Faber, J. A., Lombardi, James C., J., Rasio, F. A., & Warren, A. R. 2001, ApJ, 548, 323, doi: 10.1086/318689
- Sills et al. (1997) Sills, A., Lombardi, James C., J., Bailyn, C. D., et al. 1997, ApJ, 487, 290, doi: 10.1086/304588
- Spitzer & Saslaw (1966) Spitzer, Lyman, J., & Saslaw, W. C. 1966, ApJ, 143, 400, doi: 10.1086/148523
- Subrayan et al. (2023) Subrayan, B. M., Milisavljevic, D., Chornock, R., et al. 2023, The Astrophysical Journal, 948, L19, doi: 10.3847/2041-8213/accf1a
- Wang & Merritt (2004) Wang, J., & Merritt, D. 2004, ApJ, 600, 149, doi: 10.1086/379767
- Yang et al. (2017) Yang, C., Wang, T., Ferland, G. J., et al. 2017, ApJ, 846, 150, doi: 10.3847/1538-4357/aa8598
- Yelda et al. (2014) Yelda, S., Ghez, A. M., Lu, J. R., et al. 2014, ApJ, 783, 131, doi: 10.1088/0004-637X/783/2/131
- Yu & Tremaine (2003) Yu, Q., & Tremaine, S. 2003, ApJ, 599, 1129, doi: 10.1086/379546