Thermal Vision: Pioneering Non-Invasive Temperature Tracking in Congested Spaces
Abstract
Non-invasive temperature monitoring of individuals plays a crucial role in identifying and isolating symptomatic individuals. Temperature monitoring becomes particularly vital in settings characterized by close human proximity, often referred to as dense settings. However, existing research on non-invasive temperature estimation using thermal cameras has predominantly focused on sparse settings. Unfortunately, the risk of disease transmission is significantly higher in dense settings like movie theaters or classrooms. Consequently, there is an urgent need to develop robust temperature estimation methods tailored explicitly for dense settings.
Our study proposes a non-invasive temperature estimation system that combines a thermal camera with an edge device. Our system employs YOLO models for face detection and utilizes a regression framework for temperature estimation. We evaluated the system on a diverse dataset collected in dense and sparse settings. Our proposed face detection model achieves an impressive mAP score of over 84 in both in-dataset and cross-dataset evaluations. Furthermore, the regression framework demonstrates remarkable performance with a mean square error of 0.18∘C and an impressive score of 0.96. Our experiments’ results highlight the developed system’s effectiveness, positioning it as a promising solution for continuous temperature monitoring in real-world applications. With this paper, we release our dataset and programming code publicly.
Index Terms:
Non-invasive temperature estimation, thermal camera, dense settingsI Introduction
Non-invasive temperature monitoring plays a crucial role in identifying and isolating symptomatic individuals. Thermal cameras have become widely used during the COVID-19 pandemic and are typically positioned at building entrances to provide a one-time temperature reading [1, 2, 3]. These cameras are commonly deployed at airports, universities, and retail outlets111https://www.flir.in/instruments/public-safety/environmental-health-and-safety. While thermal cameras have proven effective in detecting symptomatic individuals, it is important to recognize that building occupants can develop and exhibit disease-related symptoms at any point during their work hours. Therefore, it is imperative to monitor building occupants throughout their workday seamlessly. Relying solely on entry-level temperature screening is insufficient for identifying and isolating symptomatic individuals to prevent the spread of the disease among other occupants. Additional measures should be implemented to enable ongoing monitoring and timely intervention. This may include incorporating wearable temperature monitoring devices or implementing regular temperature checks throughout the day. By adopting a comprehensive approach to temperature monitoring, we can enhance the effectiveness of our efforts to curb the transmission of diseases and safeguard the health and well-being of all building occupants.
Temperature estimation can be performed in either sparse or dense settings [4, 5, 6, 7, 8, 9]. Sparse settings occur when a camera’s frame captures only a few individuals in it’s field of view (FOV), while dense settings involve multiple persons situated in close proximity, engaging in activities such as sitting, standing, or walking. Currently, a significant portion of research on temperature estimation from thermal images focuses on sparse settings. However, real-world scenarios, such as offices, movie theaters, classrooms, labs, and airports, often present dense settings where the risk of disease transmission is heightened. Consequently, continuous non-invasive monitoring methods are required to address these settings. Hence, developing a non-invasive temperature estimation technique specifically tailored for dense settings is imperative.
Existing research on temperature estimation faces several challenges, including: (i) Using expensive thermal cameras and complex machine learning models with limited scalability due to their high cost [8, 10, 11, 12]. (ii) Some approaches rely on using separate regular RGB cameras for face detection and thermal cameras for temperature estimation, introducing the need for two different cameras, which increases the cost of overall setup and potentially results in inaccuracies as the model is not specifically trained on thermal images [13, 14]. (iii) Many studies rely on offline datasets for both training and testing, lacking evaluation in real-world settings [8, 11, 12, 14, 15]. (iv) Fixed R, G, and B threshold-based approaches are sometimes employed, which can be impractical to calibrate a thermal camera to a black body and can be affected by environmental conditions, leading to changes in pixel values of the images [16, 14]. (v) Certain methodologies employ complex 3D head models for mapping facial features and estimating temperature. However, this process is time-consuming and prone to inconsistent mapping of features, resulting in mapping errors and inaccurate temperature measurements [13]. (vi) Several studies developed non-generalizable systems for specific use cases [17, 18]. Such systems perform poorly on unseen data and can’t be adapted to other temperature monitoring applications.
This paper presents a novel non-invasive temperature monitoring system designed for both dense and sparse settings. Our system utilizes a FLIR Lepton 3.5 thermal camera with an embedded edge device (Raspberry Pi). Our work addresses the limitations of previous research through a multifaceted approach. The camera captures live data, and face detection is performed using a lightweight YOLOv5n model [19], while temperature estimation is carried out through the regression framework, all on the edge device in realtime. The system’s design ensures its suitability for various embedded applications. Additionally, we establish a versatile temperature monitoring pipeline capable of seamless adaptation to a wide range of temperature monitoring applications, ensuring its broad applicability and usability. To train our model, we have curated a diverse thermal image dataset collected under various conditions. The system monitors real-time temperature by displaying bounding boxes and estimated temperatures around each face in the live video stream, making it highly suitable for real-time applications.
The contributions of our work are as follows:
-
1.
We have created a non-invasive embedded temperature monitoring system capable of continuously displaying people’s temperatures within the camera’s FOV. The system requires mounting on a wall and an external display to view real-time temperature readings. With this paper, we release the programming code publicly [20].
-
2.
We have thoroughly evaluated the system in both dense and sparse settings, ensuring its effectiveness. We have conducted evaluations within the dataset and across different datasets to assess the system’s robustness.
-
3.
We have collected a large-scale thermal image dataset with varying settings. In this paper, we publicly release the dataset, making it available to the research community [20].
II Experimental Setup & Data Collection
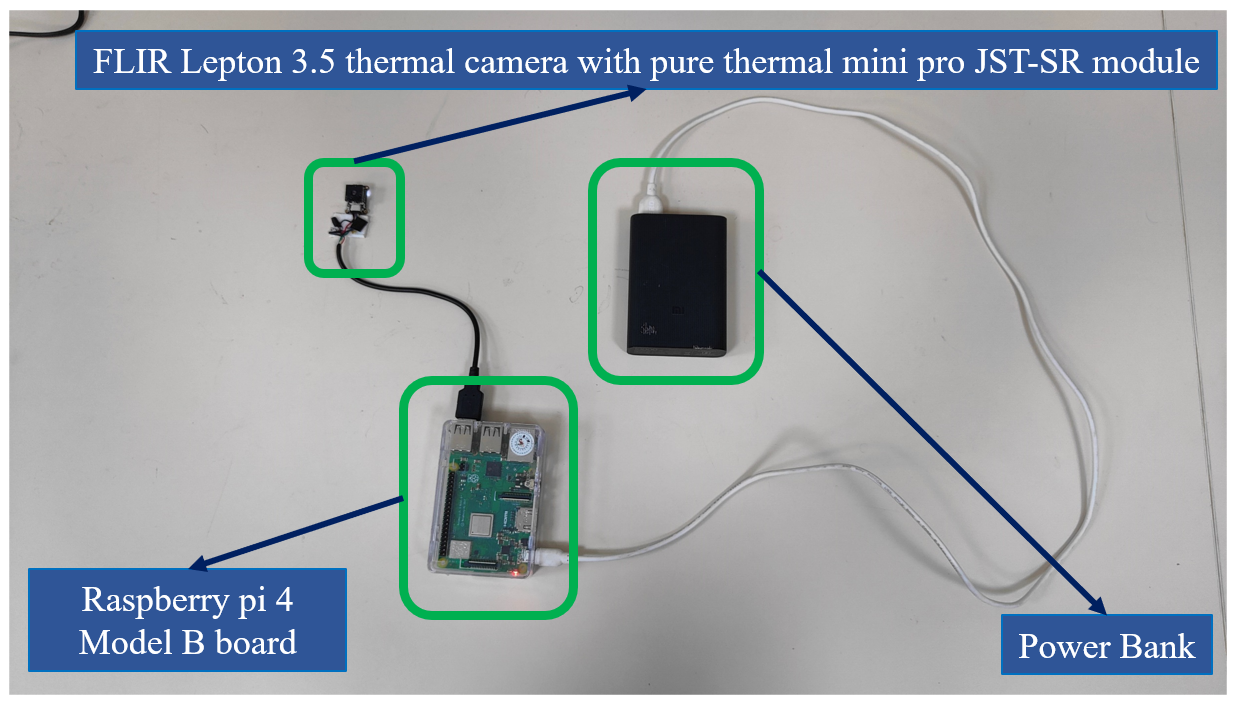
We collected thermal images with a FLIR Lepton 3.5 thermal camera connected to Raspberry Pi 4B. The Raspberry Pi was powered up with a power bank, as shown in Figure 1. We used the GuvcView library and custom Python scripts to collect the data from the camera. VNC viewer was used to connect to the Raspberry Pi remotely and collect data.
Dataset: We collected data from a classroom and a research lab. Classroom represents dense settings, where students sit close to one another, while lab represents sparse settings, where occupants sit or walk at a distance from one another. In both settings, the setup was mounted on a wall and the occupants maintained a distance from the setup. The camera’s FOV captured 12 to 15 students in a classroom setup. The classroom settings included cases of occlusion, varying densities, different head orientations, and students with/without glasses. While in the lab, occupants did different activities like standing, sitting, and walking with varying head poses and with/without glasses. The camera captured a maximum of 6 occupants in its FOV, showcasing different head orientations and varying distances from the camera.
We collected 2735 images from the classroom and 2844 images from the lab, thus resulting in a raw dataset of 5579 images. The raw datasets comprised of BGR thermal images with dimensions of 160 x 120 pixels, which is the resolution of the FLIR thermal camera. We created eight different combinations of datasets from our collected data (both classroom and lab), shown in Table I. We created these combinations to check the generalizability and performance of our models for varying environmental conditions. The original images were very small, i.e., 160 x 120, thus making it difficult for the models to identify faces in thermal images. Therefore, we resized the images to a size of 640 x 640, which helped models to get trained on a significant region of interest (ROI), achieve uniformity, and generalize well for thermal face detection in the wild. Also, augmented datasets were created by using the Horizontal flipping technique. Data augmentation was used to increase the dataset size and create thermal image variations that mimic unseen real-world data that the model might come across and, in turn, help increase the model’s precision, robustness, and generalizability. With this paper, we release the dataset publicly [20].
| DATASET | ALIAS | # |
|---|---|---|
| Raw classroom data | D1 | 2735 |
| Resized classroom data | D2 | 2735 |
| Resized and augmented classroom data | D3 | 4799 |
| Raw lab data | D4 | 2844 |
| Resized lab data | D5 | 2844 |
| Resized and augmented lab data | D6 | 4962 |
| Resized combined data | D7 | 5579 |
| Resized and augmented combined data | D8 | 9761 |
Ground truth data: We collected a separate dataset from two participants required for mapping pixel values of thermal images to body temperature. During the data collection, one participant used a 1000W hair dryer to raise his forehead temperature, while the other participant maintained a normal body temperature by remaining idle. The participants sat three meters away from the fixed setup and maintained a gap of one meter between themselves. We collected 100 images in batches of five. These batches alternated between five images with normal temperature readings, where both participants had normal body temperatures, and five images with abnormal high-temperature readings, where one participant had a normal body temperature and the other subject increased his forehead temperature. Additionally, we captured thermal images of a water bottle to simulate low-temperature scenarios. For these images, the maximum pixel value represents the surrounding temperature, and the minimum pixel value represents the water bottle’s temperature. The collected dataset has minimum, maximum, standard deviation, and mean temperatures as 25.8∘C, 38.8∘C, 2.26∘C, and 36.6∘C, respectively.
Furthermore, we measured the actual (ground truth) temperature of the two participants and the water bottle with an infrared contactless thermometer (Walnut Medical Thermosure). During data analysis, we calibrated FLIR thermal camera images by mapping pixel values to corresponding temperature values based on the recorded ground truth temperatures. The calibration process was performed using the proposed regression framework, to be discussed in the next section.
III Methodology
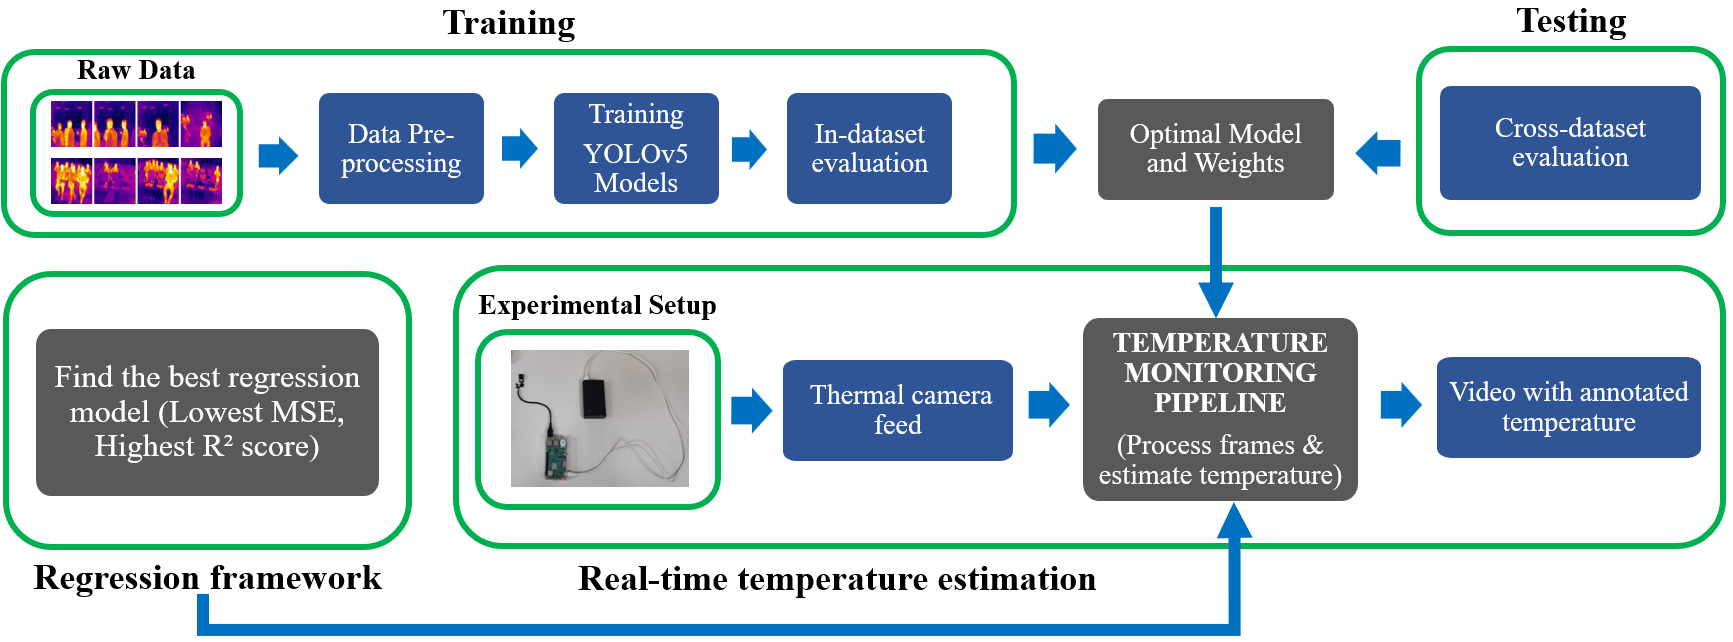
Figure 2 shows a flowchart of our methodology for estimating face temperature from thermal feeds. Following is a description of different modules present within the system.
III-A Training & Testing
Initially, we pre-processed the collected thermal images by constructing rectangular bounding boxes (bbox) around the faces of people using the LabelImg tool222https://github.com/heartexlabs/labelImg. These bounding boxes became our ROI. Moreover, each image’s bounding box labels (i.e., bbox coordinates) were converted into the YOLO format required for training the YOLO models. Next, we followed two different evaluation strategies: (i) In-dataset evaluation and (ii) Cross-dataset evaluation. In In-dataset, the same dataset was used for training and testing, while in cross-dataset evaluation, different datasets were used for training and testing purposes. Following are the combinations of the cross-dataset evaluations: (i) C1: classroom data X lab data, (ii) C2: classroom data X combined data, (iii) C3: lab data X classroom data (iv) C4: lab data X combined data, (v) C5: combined data X classroom data, and (vi) C6: combined data X lab data. In the mentioned combinations, the notation X indicates that the best model trained on the data is later used for conducting inference on the validation set of the data. The cross-dataset evaluation is important to check the model’s robustness and generalizability.
Finally, the best and last weights of all the trained models were stored for inferencing faces from thermal images, videos, and live thermal camera feeds.
| MODEL | PARAMETERS | DATASET | PRECISION | RECALL | mAP0.5 | mAP0.5:0.95 |
|---|---|---|---|---|---|---|
| YOLOv5s | Image size- 120x120 | D1 | 86.3 | 85.9 | 84.7 | 31.7 |
| YOLOv5s | - | D2 | 89.5 | 90.3 | 90.1 | 37.2 |
| YOLOv5s | - | D3 | 89.9 | 91.1 | 91.2 | 39.9 |
| YOLOv5s | Epochs- 200 | D3 | 90.7 | 91.7 | 90.7 | 43.3 |
| YOLOv5s | Optimizer- Adam | D3 | 88.3 | 90.1 | 89.1 | 35.5 |
| YOLOv5n | - | D3 | 90.3 | 91.4 | 91.1 | 39.3 |
| YOLOv5n | Optimizer- Adam | D3 | 88.5 | 89.7 | 89.1 | 35.6 |
| YOLOv5m (15 layers frozen) | - | D3 | 88.5 | 88.9 | 88.9 | 35.4 |
| YOLOv5m (10 layers frozen ) | - | D3 | 88.8 | 90.1 | 89.3 | 36.7 |
| YOLOv5m (5 layers frozen) | - | D3 | 90.1 | 91.2 | 90.3 | 39..7 |
| YOLOv5m (not frozen) | - | D3 | 90.6 | 91.8 | 90.9 | 41.8 |
III-B Regression Framework
The following equation represents a simple linear regression model for mapping pixel to temperature values.
| (1) |
Where represents ground truth temperature and is the maximum pixel value within the ROI. The equation might change depending on the regression model used for predicting the temperature. The maximum pixel value was used to estimate the highest temperature within the ROI, thus enabling identifying individuals exhibiting unusual or elevated body temperatures.
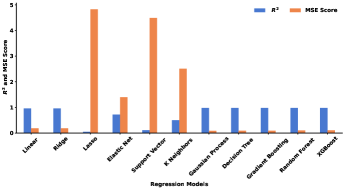
We evaluated 11 different regression models for estimating temperature: Linear, Ridge, Lasso, Elastic net, Support vector, K Neighbors, Gaussian process, Decision tree, Gradient Boosting, Random Forest, and XGBoost. The models were evaluated using Mean Squared Error (MSE) and score defined as follows
| (2) |
| (3) |
Where , represents ground truth and the regressor estimated temperature, respectively. is the mean temperature of all the readings used for temperature estimation. An ideal regression model should result in the highest score and the minimum MSE. Optimal parameters of regression models were obtained with cross-validation and hyperparameter tuning. The framework resulted in the best regression model with estimated coefficients (, ) and loss ().
III-C Real-time Temperature Estimation
We transferred the best thermal face detection and regression models to a Raspberry Pi. We also transferred the best weights obtained from the most optimal model for thermal face detection to the Raspberry pi, enabling real-time temperature monitoring using live feeds captured by a thermal camera.
Temperature Monitoring Pipeline: The temperature monitoring pipeline was meticulously designed to streamline the temperature monitoring process, ensuring its adaptability to any dataset and experimental setup. It employs the most optimal models from the regression framework and thermal face detection, along with their corresponding weights, and utilizes the live camera feed as input to estimate temperatures based on the maximum pixel value within the ROI.
The pipeline commences with the input thermal video undergoing essential pre-processing steps. These include: (i) loading the image, video, or live feed, (ii) filling empty frames (without any person) with null labels, and (iii) pairing the corresponding thermal image frames with their respective bounding box (bbox) labels. Additionally, BGR frames are converted to grayscale for consistent processing.
The YOLO model’s detect script is employed for facial region detection, leveraging the optimal model’s best weights to predict bbox around facial regions. These predicted YOLO bbox labels are then denormalized to their original bbox labels. The next step involves cropping the ROI from each frame to extract the maximum pixel value. To address edge cases that involve excessively small bounding boxes, a minimum thresholding area is implemented for each bbox. This ensures more robust temperature estimation in dense scenarios. The temperature labels of the ROI are estimated using the best regression model obtained from the regression framework.
These estimated temperature labels are then added to each frame, enabling the generation of a new output video. The new output video showcases both bounding boxes and corresponding temperature labels for each individual in the frame.
Finally, we get a live video feed with bbox around the facial regions and their estimated temperatures overlaid on each bbox.
| MODEL | PARAMETERS | DATASET | PRECISION | RECALL | mAP0.5 | mAP0.5:0.95 |
|---|---|---|---|---|---|---|
| YOLOv5s | Image size- 120x120 | D4 | 83.1 | 86.7 | 85.6 | 34.1 |
| YOLOv5s | - | D5 | 89.6 | 89.4 | 90.3 | 37.2 |
| YOLOv5s | - | D6 | 91.3 | 91.4 | 92.3 | 42.4 |
| YOLOv5n | - | D6 | 91.0 | 90.8 | 91.7 | 40.7 |
| MODEL | PARAMETERS | DATASET | PRECISION | RECALL | mAP0.5 | mAP0.5:0.95 |
|---|---|---|---|---|---|---|
| YOLOv5n | Epochs- 20 | D7 | 88.0 | 88.9 | 88.9 | 35.6 |
| YOLOv5n | Epochs- 100 | D7 | 89.5 | 89.5 | 89.9 | 37.1 |
| VALIDATION | TYPE | TRAINED ON CLASSROOM DATA | TRAINED ON LAB DATA | TRAINED ON COMBINED DATA | |||||||||
| DATASET | Precision | Recall | mAP0.5 | mAP0.5:0.95 | Precision | Recall | mAP0.5 | mAP0.5:0.95 | Precision | Recall | mAP0.5 | mAP0.5:0.95 | |
| Lab Data | D4 | 75.1 | 58.1 | 59.9 | 18.9 | - | - | - | - | 87.9 | 81.3 | 85.2 | 35.1 |
| D5 | 75.4 | 63.7 | 67.5 | 28.9 | - | - | - | - | 90.5 | 91.4 | 91.8 | 40.2 | |
| D6 | 75.9 | 63.3 | 66.8 | 20.8 | - | - | - | - | 90.7 | 90.4 | 91.9 | 40.5 | |
| Classroom Data | D1 | - | - | - | - | 60.4 | 45.5 | 41.4 | 11.4 | 85.3 | 84.7 | 84.8 | 31.2 |
| D2 | - | - | - | - | 71.0 | 61.8 | 60.0 | 17.6 | 90.1 | 91.1 | 91.1 | 39.6 | |
| D3 | - | - | - | - | 70.7 | 61.0 | 59.1 | 17.4 | 89.3 | 90.5 | 90.5 | 38.2 | |
| Combined data | D7 | 84.8 | 81.5 | 82.2 | 33.0 | 80.6 | 72.1 | 71.7 | 27.5 | - | - | - | - |
| D8 | 85.2 | 82.7 | 81.6 | 32.8 | 80.8 | 72.6 | 72.3 | 27.9 | - | - | - | - | |
IV Experimental settings & Evaluation metrics
We trained our models on YOLOv5[19], its lightweight variants, YOLOv5s (small), and YOLOv5n (nano). The lightweight variants are suitable for deployment on edge devices like Raspberry Pi. We also used the medium YOLOv5m for training to assess performance discrepancies between the lightweight and larger models. YOLOv5m’s frozen layers effectively reduced the number of parameters and size of the models, facilitating comparison with the lightweight models. We gradually unfroze the layers until the entire model was unfrozen. The unfreezing operation allowed us to observe the impact of increasing parameters and the model’s overall size.
The models’ performance was assessed based on the mAP score, where a higher score indicates better performance. The metrics include precision (TP/TP+FP), recall (TP/TP+FN), mAP@0.5, and mAP@0.5:0.95 scores. The mAP@0.5 score and the mAP@0.5:0.95 scores indicate the mean average precision at an intersection over union (IOU) threshold (IOU = area of overlap / total area of union) of 0.5 and a range of variable IOU thresholds from 0.5 to 0.95, respectively. The mAP score represents the area under the precision-recall curve, averaged over all the classes in the dataset.
Note: We could not evaluate our methods on existing datasets as there are no publicly available datasets with dense settings.
V Results
In this section, firstly, we will present the face detection results (In and Cross-dataset) and, later the temperature monitoring results.
V-A Thermal face detection results
In-dataset evaluation:
Tables II, III, and IV show the results obtained during training on the validation data of classroom, lab, and combined (both classroom and lab) datasets, respectively, using various parameter configurations and models. Table II shows that the YOLOv5s model, trained on the D3 dataset (i.e., resized and augmented classroom dataset), emerges as the best model for the classroom data. This model was trained for 100 epochs, utilizing a batch size of 16 and the SGD optimizer.
Table III shows that the best model for the lab data is the YOLOv5s model. This model was trained for 100 epochs, employing a batch size of 16 and the SGD optimizer. It was trained on the D5 dataset (i.e., resized and augmented lab dataset). Table IV shows the best model for the combined data is YOLOv5n model. This model was trained for 100 epochs, utilizing a batch size of 8 and the SGD optimizer. It was trained on the D7 dataset (i.e., resized combined dataset).
Cross-dataset evaluation: Table V shows the cross-dataset evaluation results for lab, classroom, and combined data. In this evaluation, the bounding boxes around the faces in the validation sets were predicted using the best weights obtained from the training models on lab, classroom, and combined data. Results show that the model trained on the combined dataset outperformed the models trained on the individual classroom and lab datasets. This signifies the model’s capacity to generalize well to unseen data.
In and cross-dataset evaluation results revealed that the best-performing model was trained on the resized combined data, employing 100 epochs, a batch size of 8, and the SGD optimizer. It exhibited a remarkable mAP@0.5 score of 89.9, shown in Table IV while keeping a mAP@0.5 score of above 84.8 for all the cross-dataset combinations shown in Table V. This indicates the robust ability of the model to detect thermal faces in varying environments and conditions.
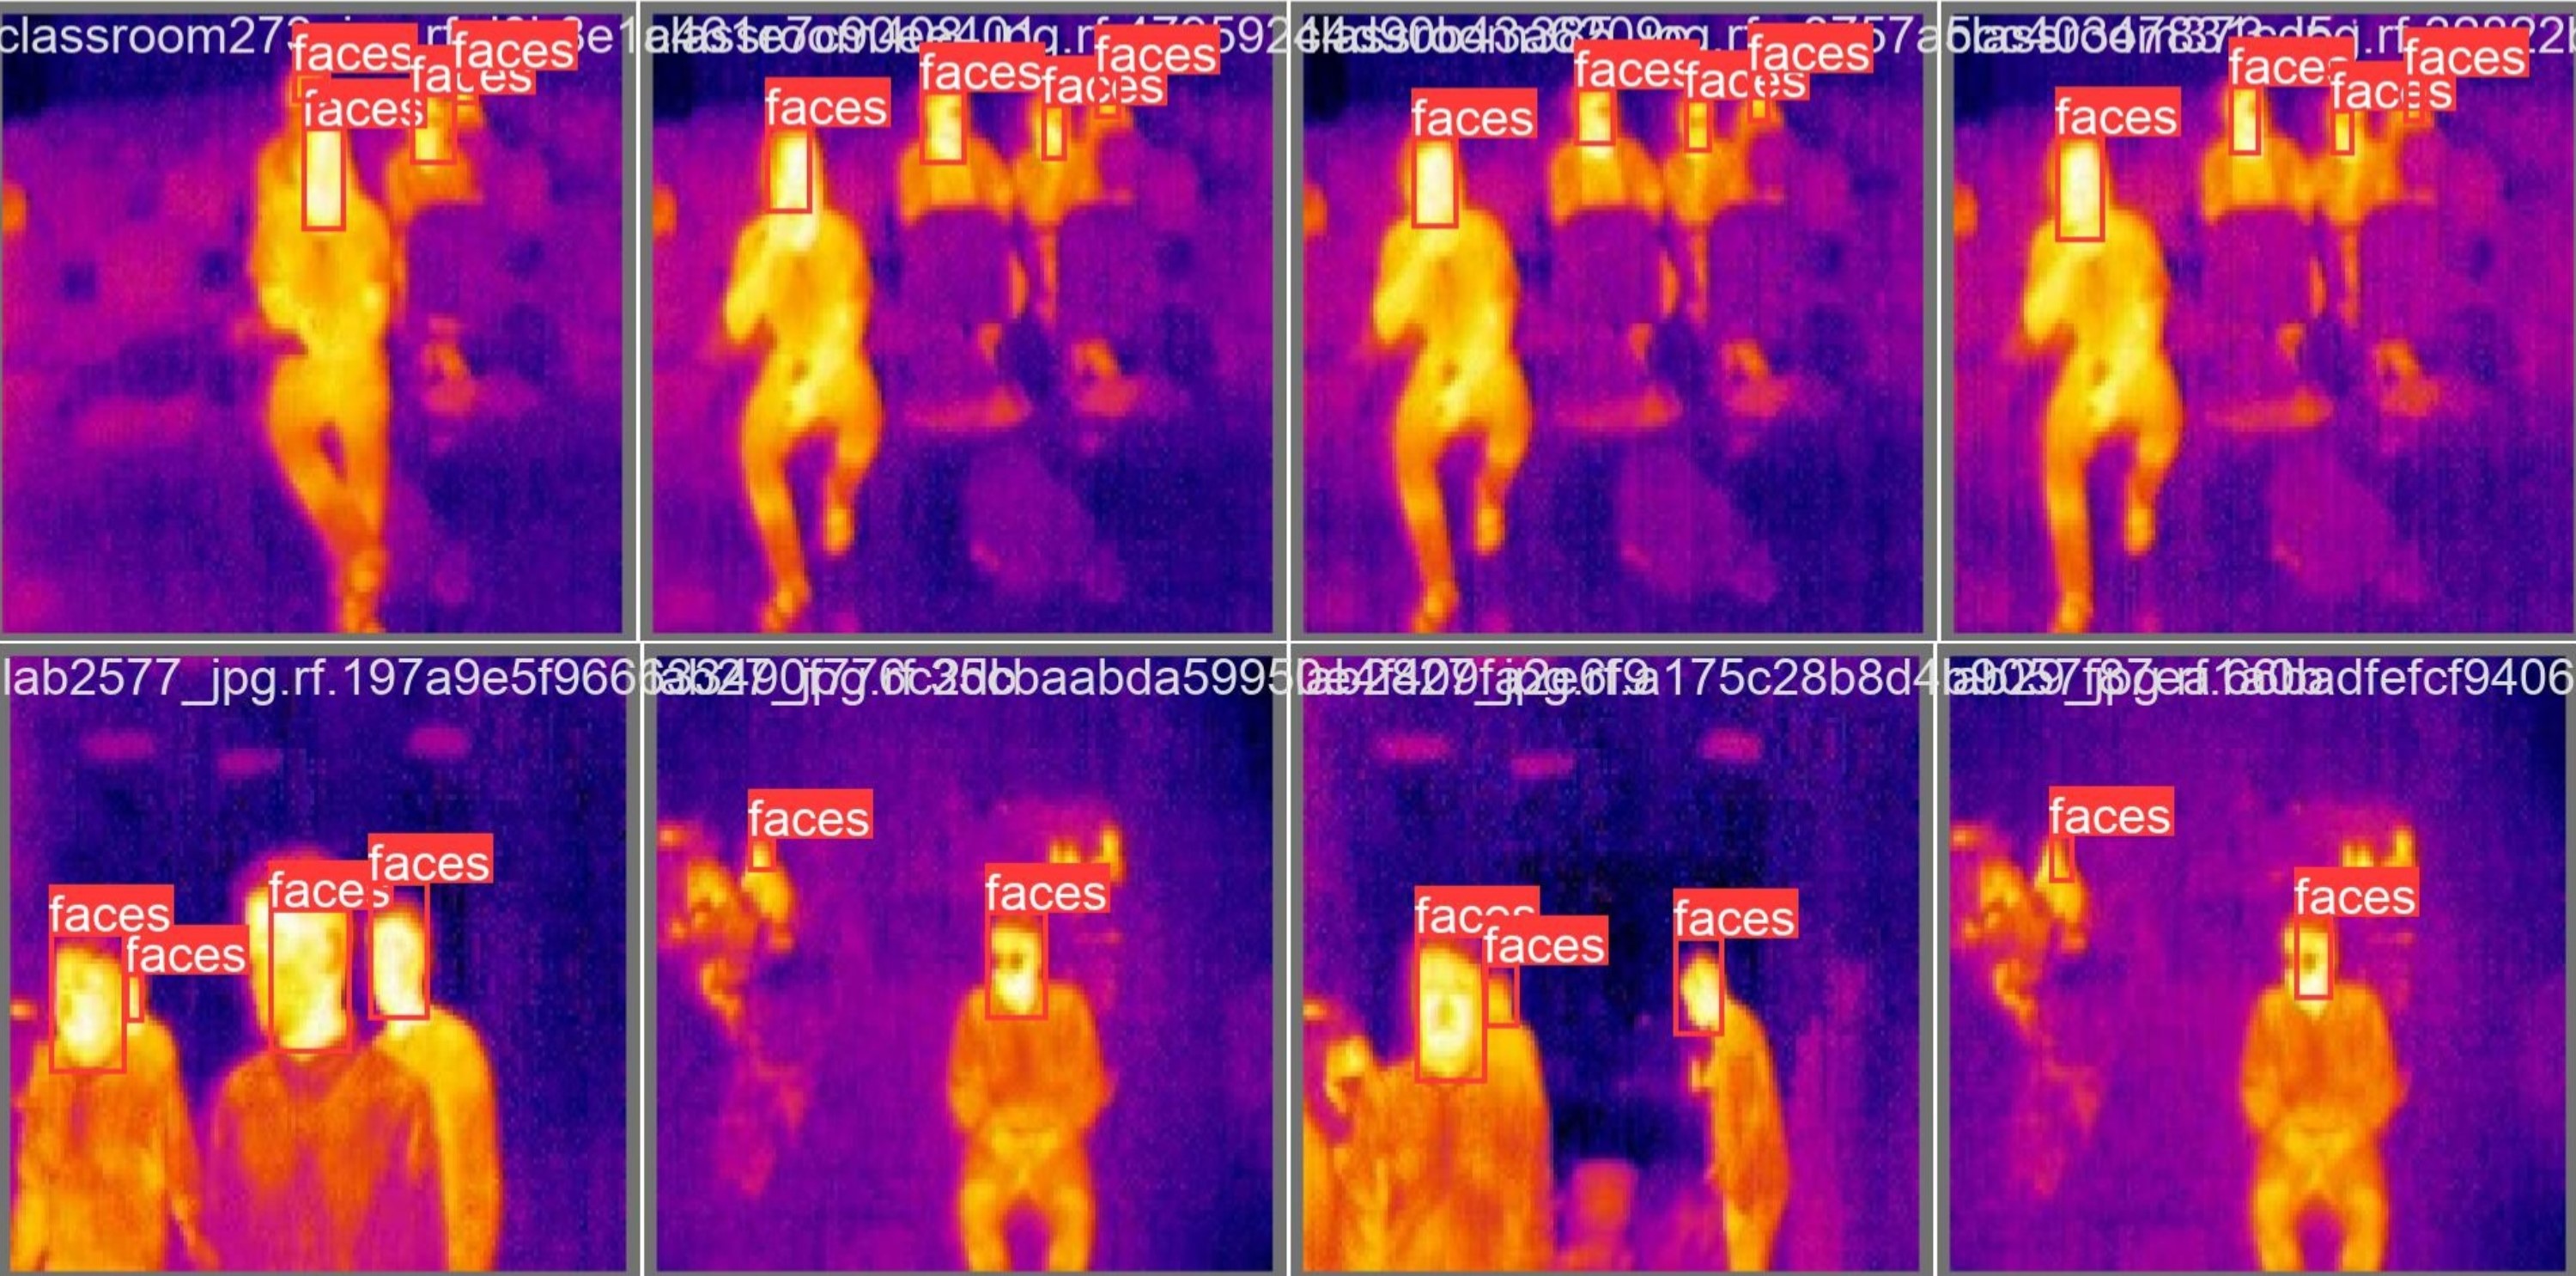
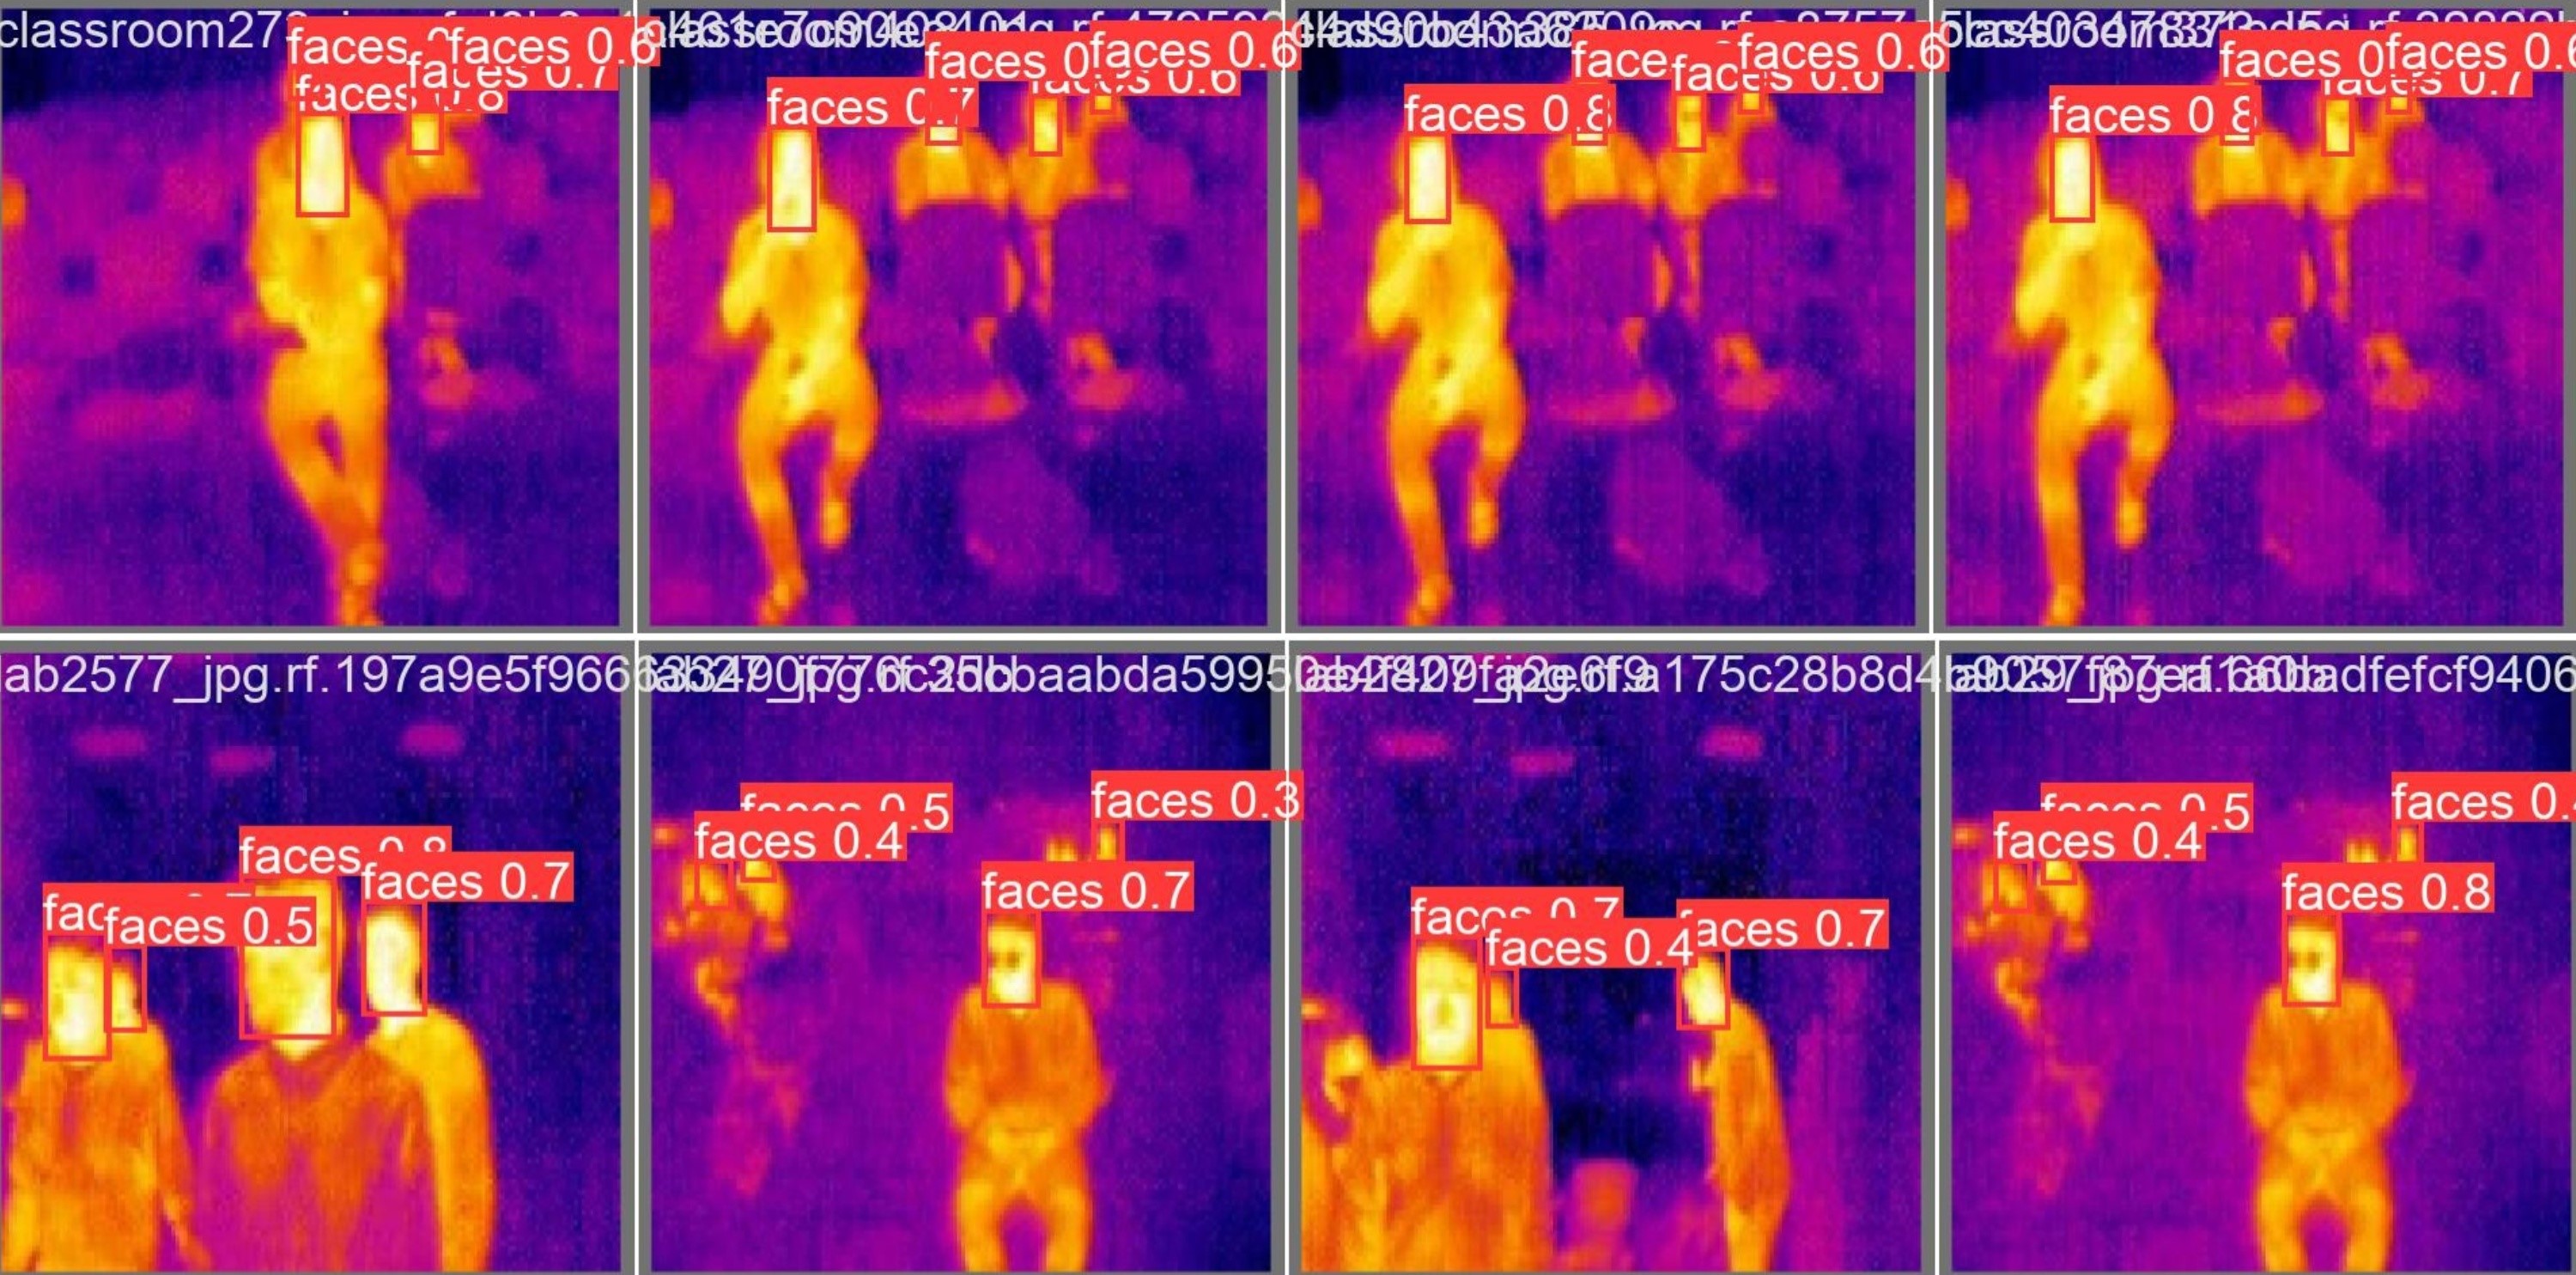
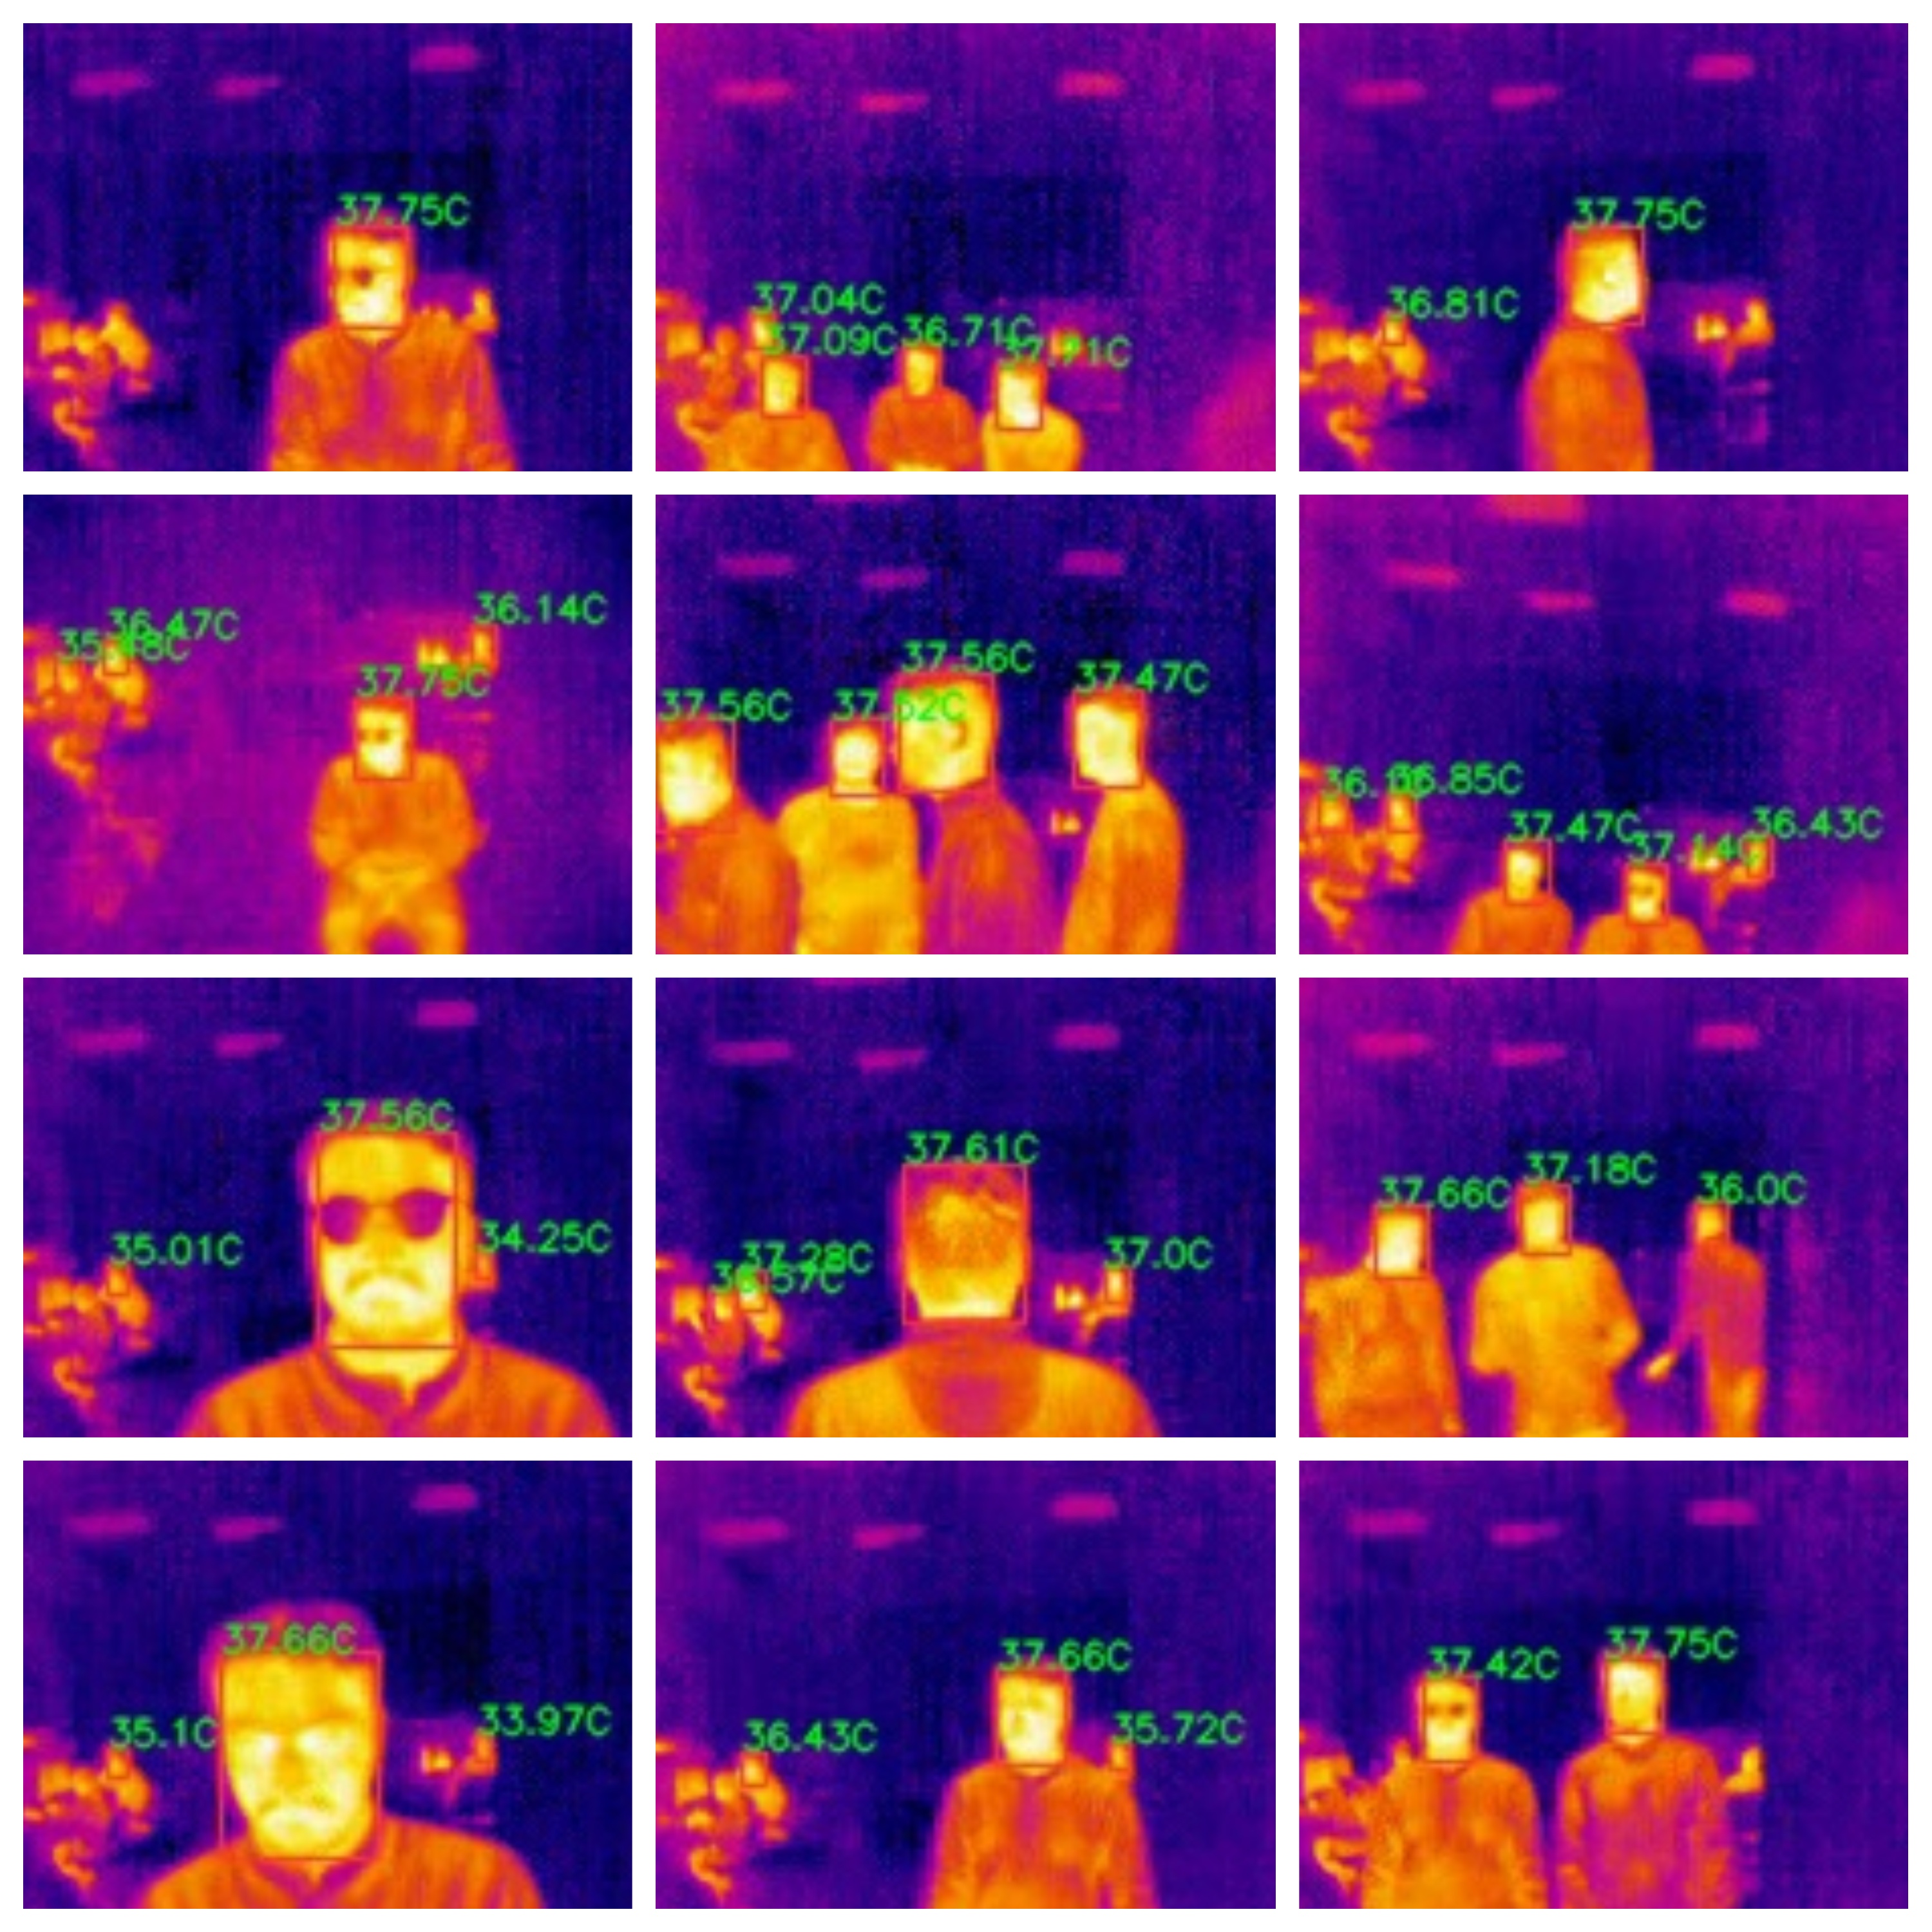
Figure 3 shows actual and predicted bounding boxes obtained with the best model (YOLOv5n) on test data. Predicted bounding boxes with probability scores show the probability of capturing a face correctly within the bounding box.
V-B Temperature monitoring results
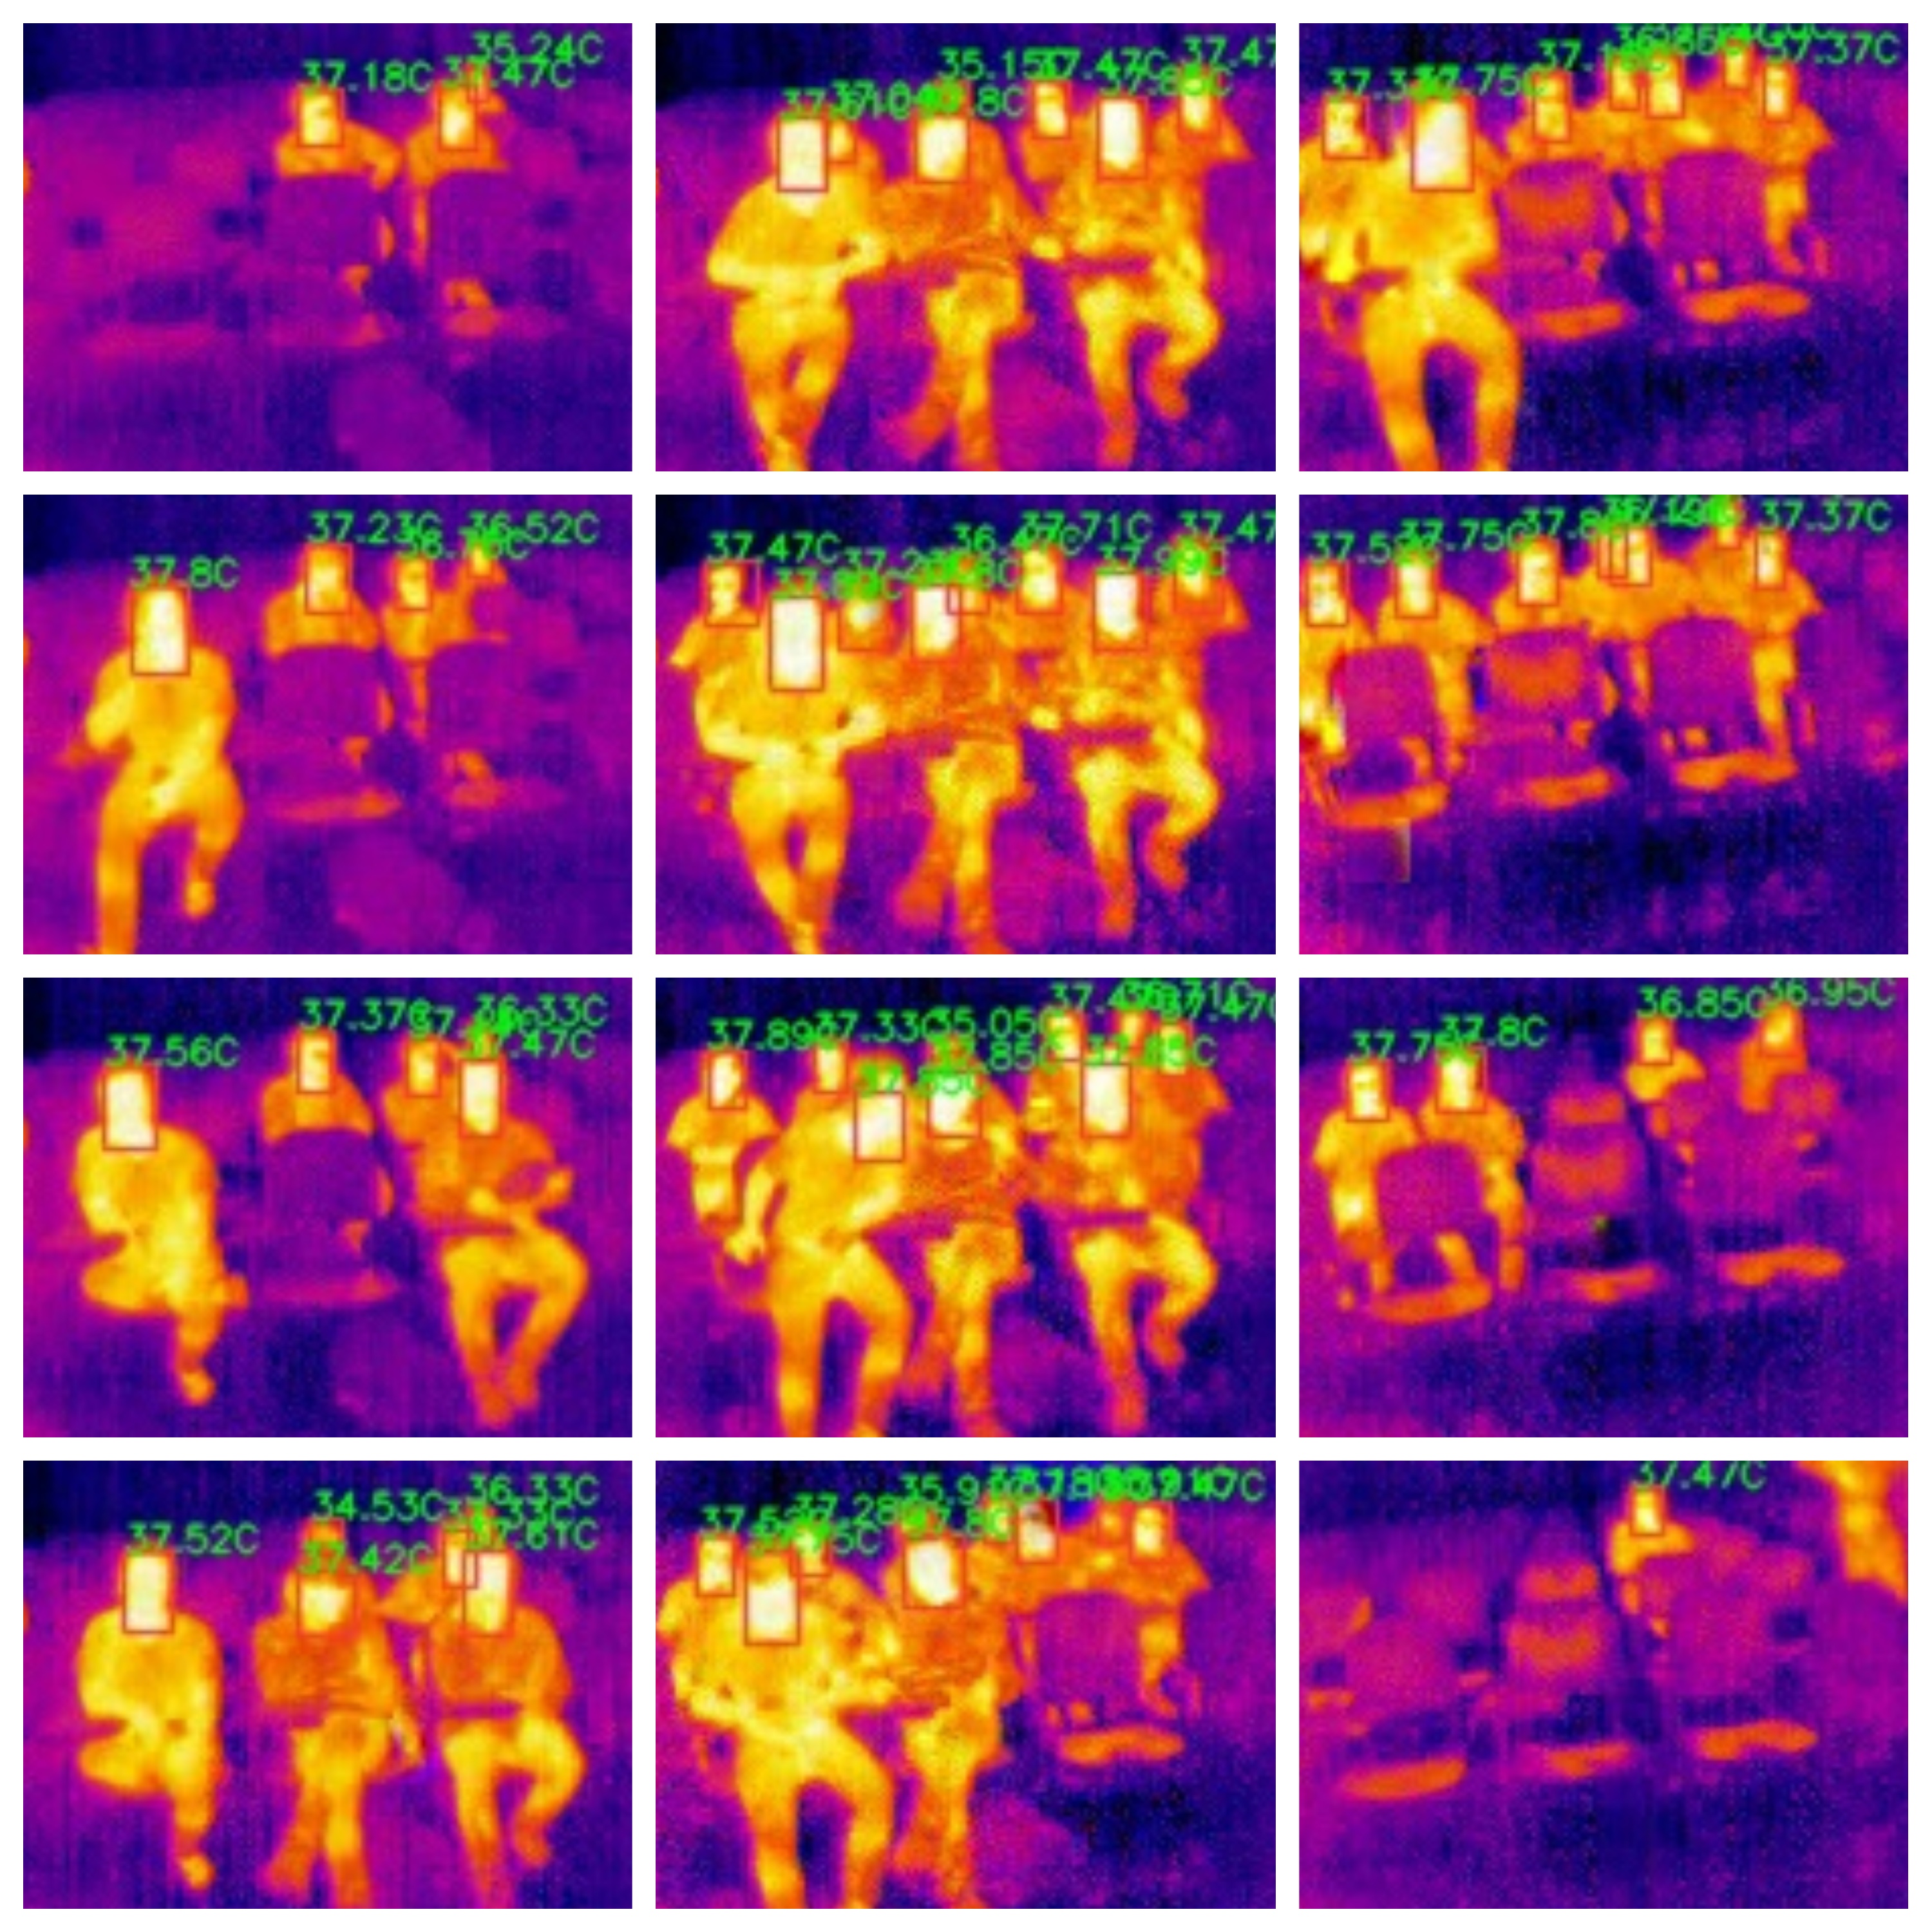
Figure 4 shows the score and MSE of different regression models. Gaussian process regressor emerged as the most proficient regression model for the captured data, with the highest score and the lowest MSE. However, when we tested it on the classroom and lab data, it predicted temperatures higher than 38∘C, which does not align with the actual temperatures as nobody in the classroom or lab had a fever or any medical condition having elevated body temperature. As a result, we opted for ridge regression. This model exhibited a reasonable score and MSE. We applied Ridge regression to the captured images, videos, and live thermal camera feeds to predict the temperature of each individual within the frame. Figure 5 shows some classroom and lab images with bbox labels and temperatures predicted in real-time. This model enabled real-time temperature estimation without introducing any lag in the original live video feed.
VI Discussion
VI-A Thermal face detection
A thorough analysis of both In-dataset and Cross-dataset evaluation showed that the YOLOv5n model trained on the combined dataset outperformed other models. This is because it was trained on the combined dataset with both the lab and classroom data. It also captured the effects of varying distances from the experimental setup, densities, people postures, head orientations, and conditions. This lightweight model boasts fewer parameters, rendering it highly suitable for deployment in low-hardware power setups, such as our experimental setup. Through extensive training, we ensured that the model could handle challenging scenarios, including occlusion, individuals wearing glasses, and completely dark environments. As a result, our trained models achieved precise ROI predictions on unseen real-world data.
VI-B Temperature monitoring pipeline & Regression framework
The developed temperature monitoring pipeline demonstrates robustness in handling diverse datasets and experimental setups, making it adaptable to variable scenarios. To build the regression framework, we collected a specific dataset from a lab setting involving two subjects: one with a normal and another with an abnormally high temperature. By capturing an image that included both individuals in the same frame, we could observe the relative change in pixel values between the high-temperature and normal-temperature subjects. This approach was necessary due to the characteristics of thermal images represented in the BGR format, which maps temperature values within the range of 0-255, regardless of the actual temperature magnitude. By analyzing the pixel value variations in the presence of both subjects, we gained insights into accurately estimating temperatures in such scenarios.
Among the regression models, the Gaussian process regressor performed the best but was not used for temperature estimations due to its tendency to estimate abnormally high temperatures for certain subjects. This behavior might be attributed to overfitting on the training dataset and the model’s limited ability to generalize to unseen data from other challenging scenarios. Other models, such as the decision tree, gradient boosting, random forest, and XGBoost regressor, performed similarly to the Gaussian process regressor in terms of MSE and scores. However, these models were computationally expensive and unsuitable for estimating temperatures in real-time from live video feeds in the experimental setup. The predictions from these models introduced a delay in the video output as subsequent frames had to be processed, resulting in a time lag. To address these limitations, we ultimately opted for ridge regression, a linear regression variation incorporating an L2 regularization term in its loss function, which effectively addressed the problem of overfitting. The ridge regression model exhibited a reasonable score and MSE compared to the Gaussian process regressor. Furthermore, it produced temperature values in close proximity to actual human body temperatures as captured in the ground truth dataset. The selection of this model was further motivated by its simplicity and suitability for online temperature estimation, overcoming the challenges faced by models such as random forest, decision tree, gradient boosting, and XGBoost regressor.
VI-C Sensitivity analysis
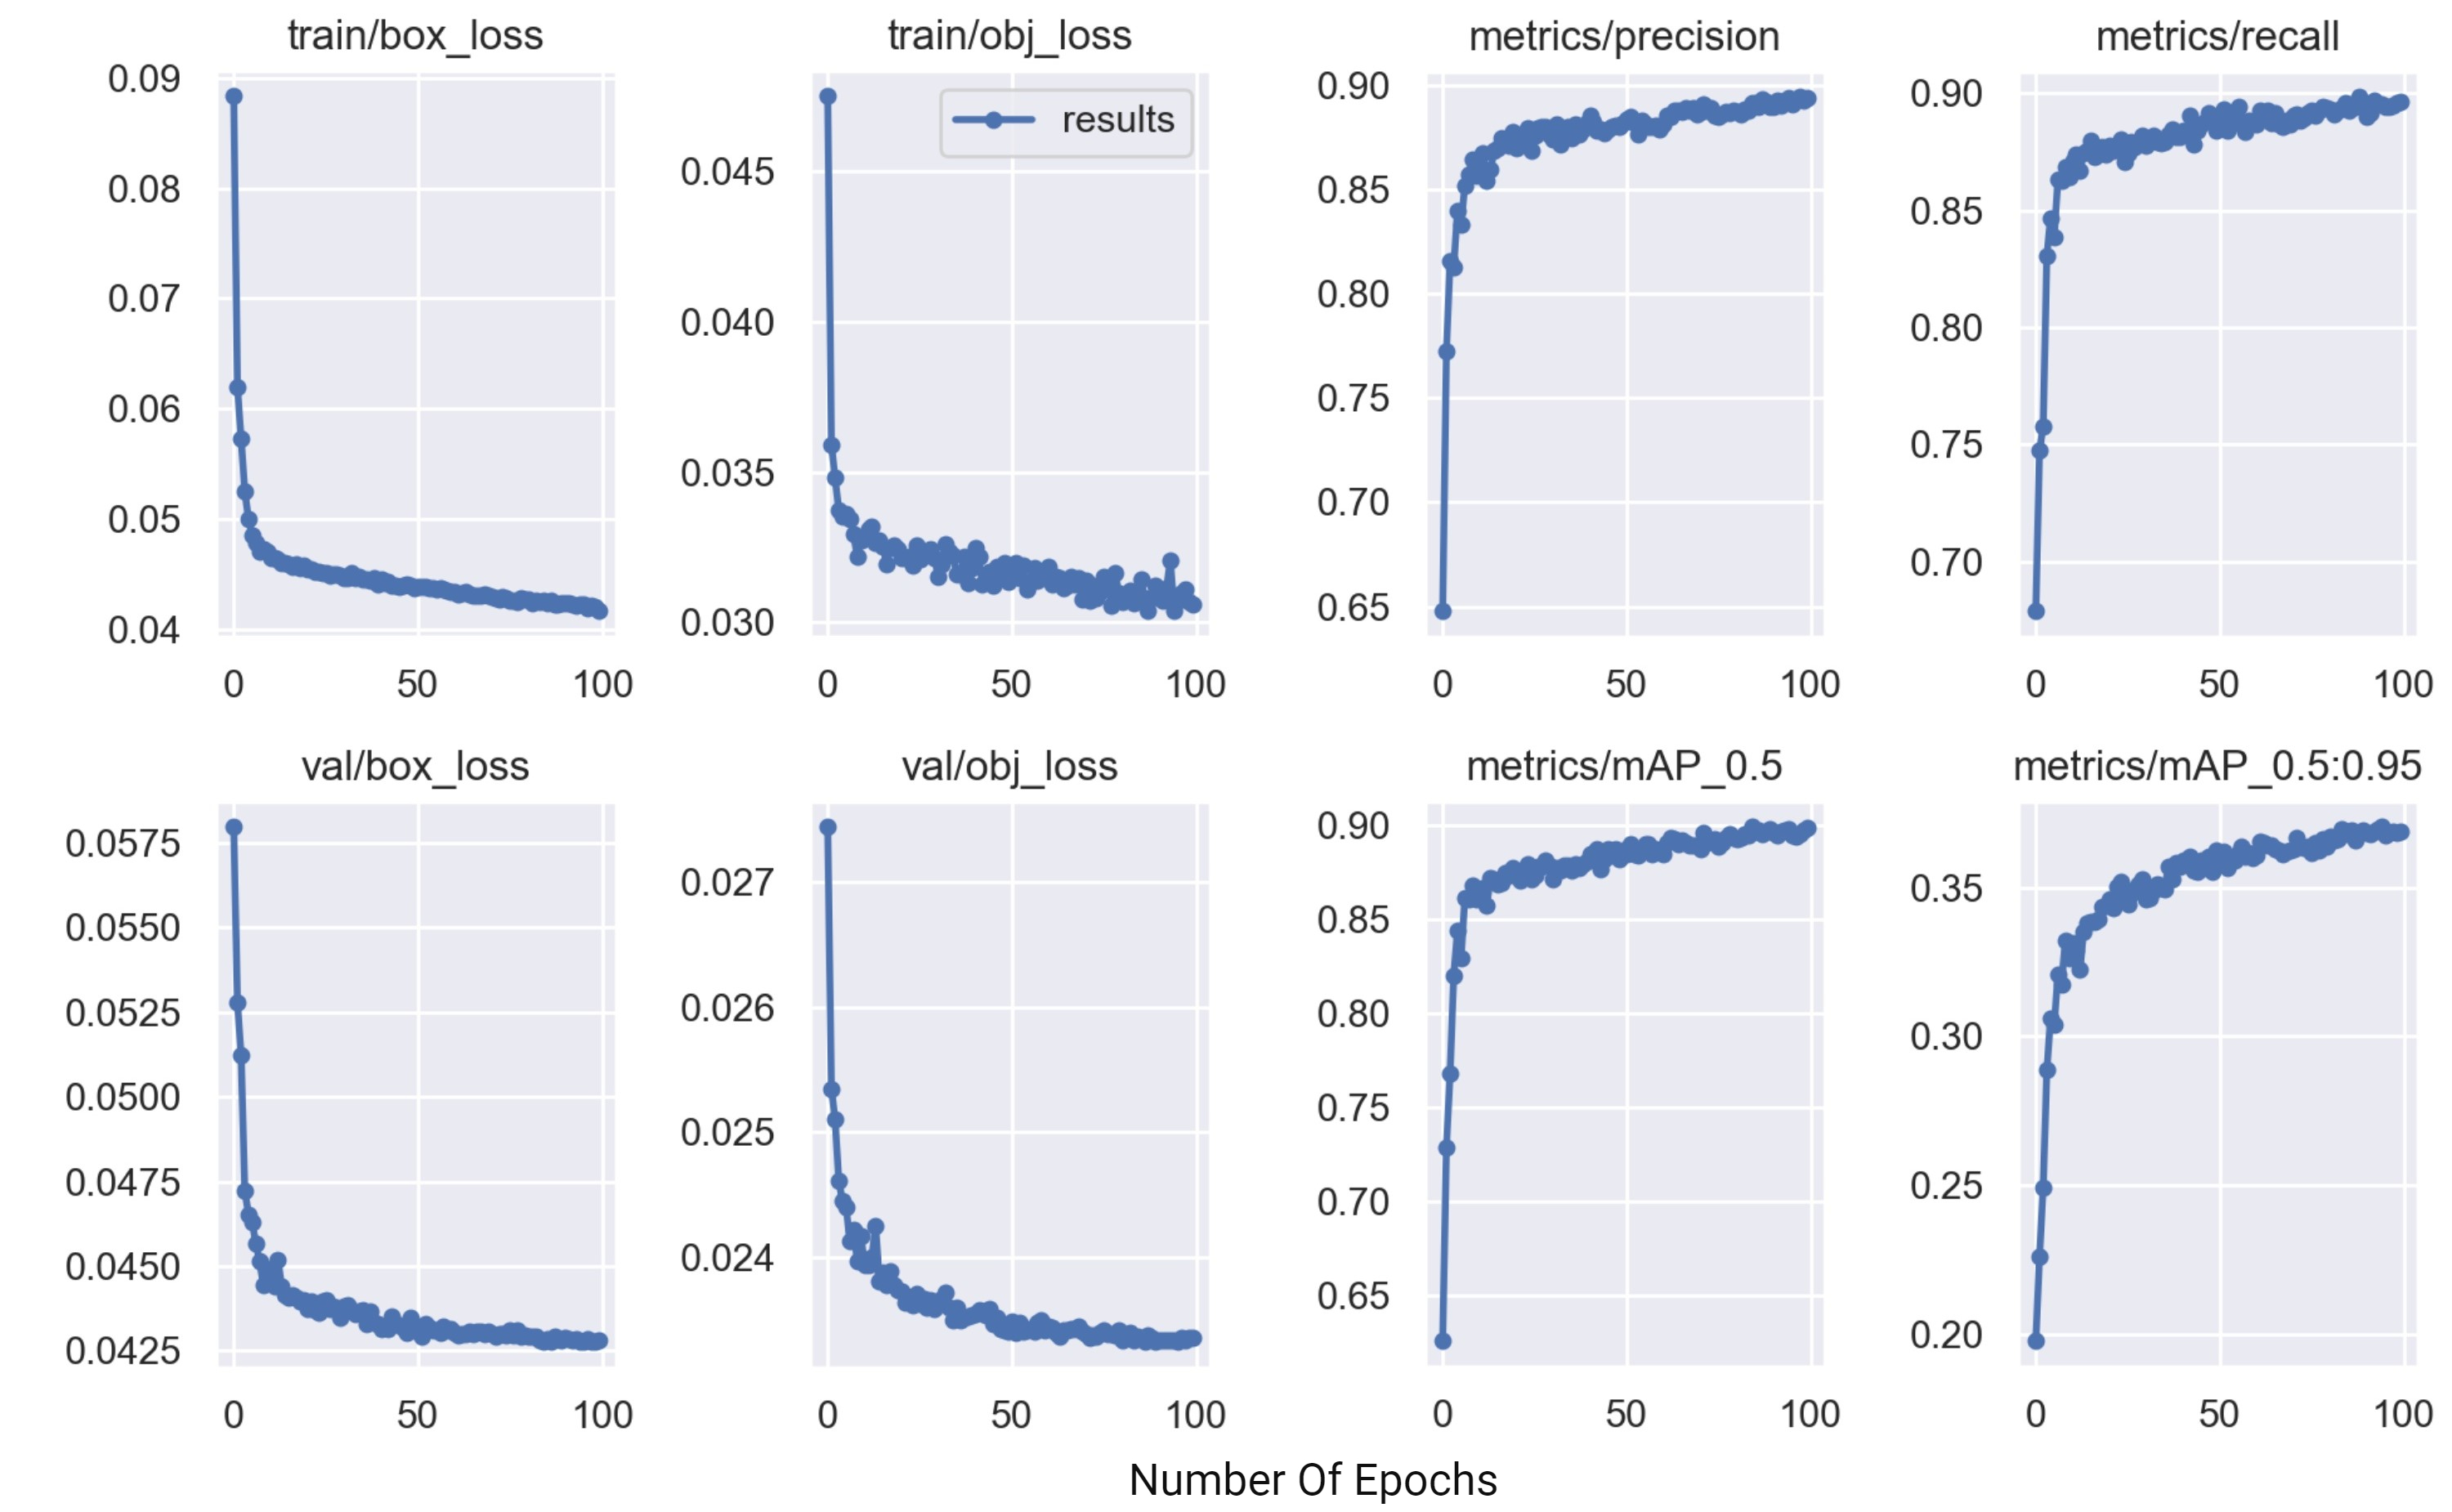
We conducted an analysis to determine the optimal model by examining the effects of varying epochs, optimizers, and batch sizes. Our primary evaluation metric was mAP@0.5 scores. Increasing the number of epochs had a positive impact on both the mAP@0.5 score and mAP@0.5:0.95, as depicted in Figure 6(a). However, once we surpassed 100 epochs, there was no significant improvement in the mAP@0.5 score, as indicated in Table II. This suggests that the results reach a saturation point after 100 epochs.
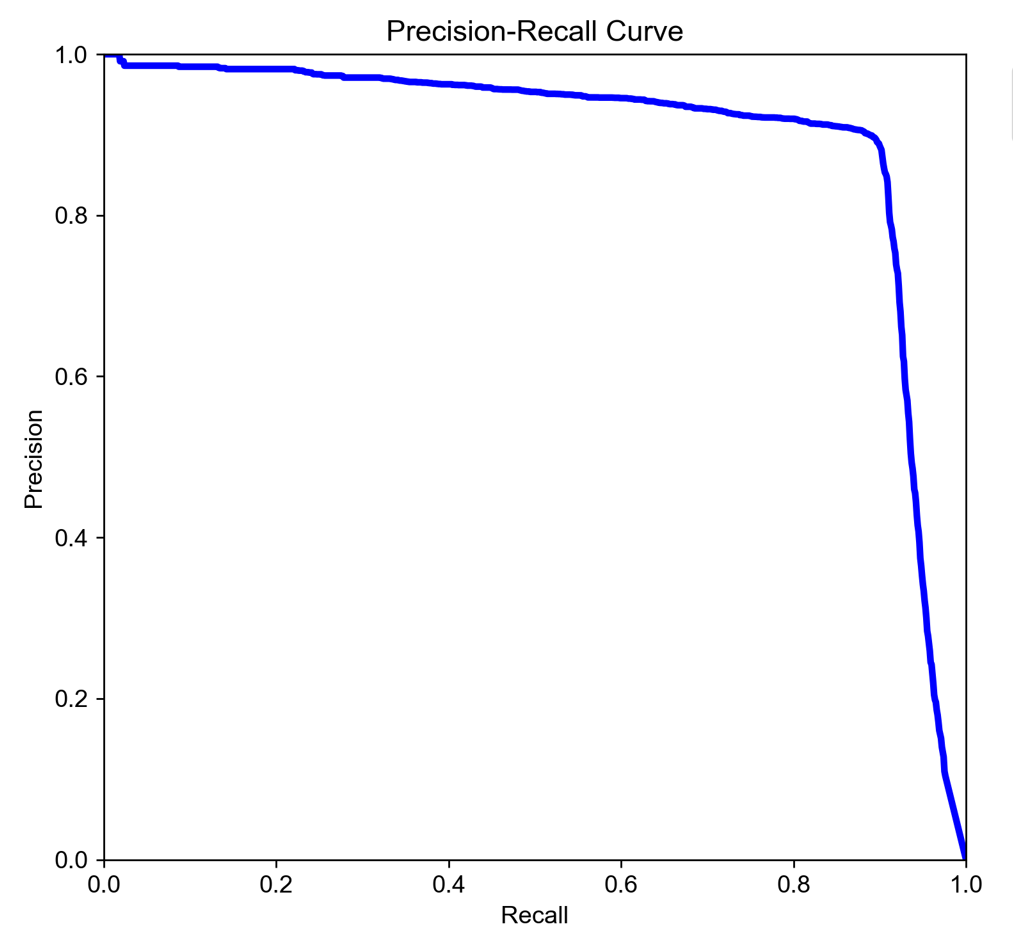
Regarding optimizers, models trained with SGD outperformed those trained with Adam, as shown in Table II. Interestingly, the medium-sized models did not exhibit a noteworthy enhancement in mAP@0.5 scores. This implies that the small and nano models can be used for thermal face detection with comparable efficiency to the medium models, with fewer parameters, lower computational costs, and shorter evaluation time. Precision-recall analysis (Figure 6(a)) revealed that the area under the curve increased with more epochs, positively impacting the mAP scores. Additionally, the object loss and box loss decreased with each epoch.
Furthermore, we conducted a comprehensive comparison of regression models, incorporating hyperparameter tuning (such as K value, C, epsilon, max_depth, n_estimators, criterion, etc.). This allowed us to derive the best parameter configurations for the regression models, resulting in superior temperature estimation from pixel values in thermal images, videos, and live thermal camera feeds.
VII Conclusion & Future work
This work introduced a novel non-invasive temperature monitoring system with several distinctive aspects, including (i) The system operates on an edge device, eliminating the need for cloud computational power. It uses a lightweight YOLO model for face detection and then combines that with the regression framework for estimating the temperature of each individual in real-time. (ii) It is a stand-alone system; however, it offers the possibility of creating a distributed network of similar edge devices to monitor large areas or buildings through a unified dashboard. (iii) The system is portable, exhibiting superior performance in sparse and dense settings. Additionally, it can be deployed on a wall and powered by various sources, such as a power bank.
The system was evaluated on a diverse thermal image dataset. As no publicly available dataset with dense settings is present, we made the dataset publicly accessible. We aim to encourage and facilitate further research by releasing the dataset.
In future endeavors, we plan to explore various advanced object detection models for thermal face detection. We will develop a specialized, innovative model architecture to detect faces in small and low-resolution thermal images. Additionally, we will investigate domain adaptation, few-shot learning, and self-supervised learning techniques to address the challenges encountered in thermal face detection within real-world environments. Furthermore, we are interested in experimenting with simple thermography models to estimate the temperatures. Such models would be computationally inexpensive and can estimate temperatures in real-time.
References
- [1] R. Y. Brzezinski, N. Rabin, N. Lewis, R. Peled, A. Kerpel, A. M. Tsur, O. Gendelman, N. Naftali-Shani, I. Gringauz, H. Amital et al., “Automated processing of thermal imaging to detect covid-19,” Scientific Reports, vol. 11, no. 1, p. 17489, 2021.
- [2] B. J. Quilty, S. Clifford, S. Flasche, R. M. Eggo et al., “Effectiveness of airport screening at detecting travellers infected with novel coronavirus (2019-ncov),” Eurosurveillance, vol. 25, no. 5, p. 2000080, 2020.
- [3] Y. Zhou, P. Ghassemi, M. Chen, D. McBride, J. P. Casamento, T. J. Pfefer, and Q. Wang, “Clinical evaluation of fever-screening thermography: impact of consensus guidelines and facial measurement location,” Journal of Biomedical optics, vol. 25, no. 9, p. 097002, 2020.
- [4] D. Li, C. C. Menassa, and V. R. Kamat, “Robust non-intrusive interpretation of occupant thermal comfort in built environments with low-cost networked thermal cameras,” Applied energy, vol. 251, p. 113336, 2019.
- [5] J. Ranjan and J. Scott, “Thermalsense: determining dynamic thermal comfort preferences using thermographic imaging,” in Proceedings of the 2016 ACM International Joint Conference on Pervasive and Ubiquitous Computing, 2016, pp. 1212–1222.
- [6] P. Wei, C. Yang, and X. Jiang, “Low-cost multi-person continuous skin temperature sensing system for fever detection,” in Proceedings of the 18th Conference on Embedded Networked Sensor Systems, 2020, pp. 705–706.
- [7] P. Ghassemi, T. J. Pfefer, J. P. Casamento, R. Simpson, and Q. Wang, “Best practices for standardized performance testing of infrared thermographs intended for fever screening,” PloS one, vol. 13, no. 9, p. e0203302, 2018.
- [8] J.-W. Lin, M.-H. Lu, and Y.-H. Lin, “A thermal camera based continuous body temperature measurement system,” in Proceedings of the IEEE/CVF International Conference on Computer Vision Workshops, 2019, pp. 0–0.
- [9] A. Somboonkaew, S. Vuttivong, P. Prempree, R. Amarit, S. Chanhorm, K. Chaitavon, S. Porntheeraphat, and S. Sumriddetchkajorn, “Temperature-compensated infrared-based low-cost mobile platform module for mass human temperature screening,” Applied Optics, vol. 59, no. 17, pp. E112–E117, 2020.
- [10] R. S. Maguire, M. Hogg, I. D. Carrie, M. Blaney, A. Couturier, L. Longbottom, J. Thomson, N. Baxter, A. Thompson, C. Warren et al., “Thermal camera detection of high temperature for mass covid screening,” medRxiv, pp. 2021–05, 2021.
- [11] Y. K. Cheong, V. V. Yap, and H. Nisar, “A novel face detection algorithm using thermal imaging,” in 2014 IEEE Symposium on Computer Applications and Industrial Electronics (ISCAIE). IEEE, 2014, pp. 208–213.
- [12] J. W. Chin, K. L. Wong, T. T. Chan, K. Suhartono, and R. H. So, “An infrared thermography model enabling remote body temperature screening up to 10 meters,” in Proceedings of the IEEE/CVF conference on computer vision and pattern recognition, 2021, pp. 3875–3881.
- [13] K. Hou, Y. Liu, P. Wei, C. Yang, H. Kang, S. Xia, T. Spada, A. Rundle, and X. Jiang, “A low-cost in-situ system for continuous multi-person fever screening,” in 2022 21st ACM/IEEE International Conference on Information Processing in Sensor Networks (IPSN). IEEE, 2022, pp. 15–27.
- [14] M. F. A. Mushahar and N. Zaini, “Human body temperature detection based on thermal imaging and screening using yolo person detection,” in 2021 11th IEEE International Conference on Control System, Computing and Engineering. IEEE, 2021, pp. 222–227.
- [15] A. Kuzdeuov, D. Aubakirova, D. Koishigarina, and H. A. Varol, “Tfw: Annotated thermal faces in the wild dataset,” IEEE Transactions on Information Forensics and Security, vol. 17, pp. 2084–2094, 2022.
- [16] Vendian.org 2021. “What color is a blackbody? - some pixel RGB values”. http://www.vendian.org/ mncharity/dir3/blackbody/ [Accessed 9 Nov. 2023].
- [17] S.-S. Guo, K.-H. Lee, L. Chang, C.-D. Tseng, S.-J. Sie, G.-Z. Lin, J.-Y. Chen, Y.-H. Yeh, Y.-J. Huang, and T.-F. Lee, “Development of an automated body temperature detection platform for face recognition in cattle with yolo v3-tiny deep learning and infrared thermal imaging,” Applied Sciences, vol. 12, no. 8, p. 4036, 2022.
- [18] W.-T. Sung, C.-H. Lin, and S.-J. Hsiao, “Image recognition based on deep learning with thermal camera sensing,” Computer Systems Science and Engineering, pp. 505–520, 2023.
- [19] G. Jocher, A. Chaurasia, A. Stoken, J. Borovec, NanoCode012, Y. Kwon, K. Michael, TaoXie, J. Fang, imyhxy, Lorna, Z. Yifu, C. Wong, A. V, D. Montes, Z. Wang, C. Fati, J. Nadar, Laughing, UnglvKitDe, V. Sonck, tkianai, yxNONG, P. Skalski, A. Hogan, D. Nair, M. Strobel, and M. Jain, “ultralytics/yolov5: v7.0 - YOLOv5 SOTA Realtime Instance Segmentation,” Nov. 2022. [Online]. Available: https://doi.org/10.5281/zenodo.7347926
- [20] Dataset and Code, “Thermal Images Dataset,” https://drive.google.com/drive/folders/1oUEuMD2z5CW77bY6zr5pXjJSnr5Di90S?usp=sharing, 2023.