Local vs. Global: Local Land-Use and Land-Cover Models Deliver Higher Quality Maps
Abstract
In 2023, of the African population experienced moderate to severe food insecurity, with facing severe food insecurity. Land-use and land-cover maps provide crucial insights for addressing food insecurity by improving agricultural efforts, including mapping and monitoring crop types and estimating yield. The development of global land-cover maps has been facilitated by the increasing availability of earth observation data and advancements in geospatial machine learning. However, these global maps exhibit lower accuracy and inconsistencies in Africa, partly due to the lack of representative training data. To address this issue, we propose a data-centric framework with a teacher-student model setup, which uses diverse data sources of satellite images and label examples to produce local land-cover maps. Our method trains a high-resolution teacher model on images with a resolution of and a low-resolution student model on publicly available images with a resolution of . The student model also utilizes the teacher model’s output as its weak label examples through knowledge transfer. We evaluated our framework using Murang’a county in Kenya, renowned for its agricultural productivity, as a use case. Our local models achieved higher quality maps, with improvements of in the score and in Intersection-over-Union, compared to the best global model. Our evaluation also revealed inconsistencies in existing global maps, with a maximum agreement rate of among themselves. Our work provides valuable guidance to decision-makers for driving informed decisions to enhance food security.
Keywords Food Security Land-Use Land-Cover Maps Local vs. Global Models Knowledge Transfer
1 Introduction
Land-Use and Land-Cover (LULC) maps are critical for monitoring 14 of the 17 United Nations Sustainable Development Goals (SDGs) [1]. LULC maps enable informed resource management, urban planning, environment monitoring to enhance food security [2]. In Africa, of the population experienced moderate to severe food insecurity in 2023, while faced severe food insecurity, suggesting that by 2030, of the global population facing hunger will be concentrated in the continent [3]. In addition, most of the economies in Sub-Saharan Africa (SSA) are dependent on the agriculture sector [4, 5]. For example, in Kenya, the sector generates of foreign exchange, accounts for of employment, produces approximately of total government revenue, and supplies of raw materials for industry [6]. However, the sector faces multiple challenges, such as unpredictable weather, soil degradation, competing land use, and inadequate agricultural extension service, often exacerbated by adverse climate impacts and expansion in population settlements - resulting in a growing prevalence of food insecurity [7].
Other challenges to the sector in the SSA include the European Union Anti-deforestation Law (EUAL) that aims to block agricultural products grown on deforested lands from accessing European markets [8]. EUAL poses a risk for small scale farmers that are limited in technological resources but still are the leading agricultural producers. For example, of the coffee consumed worldwide is produced by smallholder farmers [9], and seven out of the top ten global coffee markets for Kenya are in the European economic zone [10].
LULC maps play a vital role in supporting the agriculture sector by first characterizing land uses and land covers, such as croplands, forests, and water bodies, and subsequently automating downstream tasks like crop mapping, monitoring, and yield estimation [11, 2]. The growing availability of remotely sensed data, along with geospatial machine learning models, helps to build global LULC maps [12]. These include Google’s Dynamic World (GDW) [11], European Space Agency’s (ESA) WorldCover [13], and Environmental Systems Research Institute’s (ESRI) LULC [14]. However, there is still a significant disparity in LULC mapping efforts in Africa when compared to Europe and North America [1, 15, 16, 17]. In addition, the global maps are reported to exhibit lower accuracy and inconsistencies in Africa [2, 18], partly due to the lack of quality data representing the region [1] or failure of global models to capture meaningful variation within sub-regions [18]. The performance and trustworthiness of ML models depend critically on the quality of data [19, 18, 20]. While satellite images with a sub-meter resolution offer high quality details to achieve accurate LULC maps, their accessibility is often limited and expensive compared to lower-resolution data. The collection of lower-resolution products is typically scheduled and can be used in various applications. However, the collection of high-resolution products is task-driven and usually time-sensitive. Recently, there has been a growing interest to use both high-and lower-resolution data, e.g., using a teacher-student model setup [21]. A teacher-student model is a machine learning framework where a larger or more complex model, also known as the “teacher” model, is used to train a smaller or simpler “student” model [22].
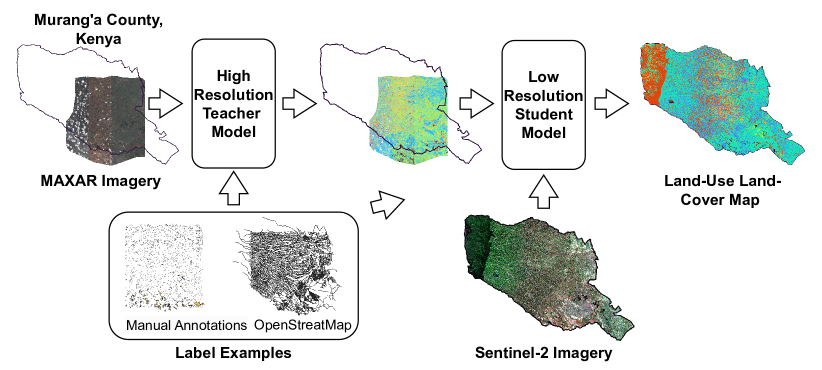
To this end, we propose DAta-centric framework with a Teacher-student model Setup (DATS), which uses diverse data sources of satellite images and label examples to produce high-quality and local LULC maps (see Fig. 1). The models are implemented with deep learning-based semantic segmentation architectures. We selected Murang’a county in Kenya, renowned for its agricultural productivity, as our Area of Interest (AOI). The county is situated between latitudes and , and longitudes and . The county spans a total area of approximately . Here are the specific contributions of this work:
-
1.
We propose a framework with a teacher-student model setup to build a local LULC map that uses diverse datain image resolutions and sources of label examples. Specifically, we train the teacher model using a high-resolution Maxar imagery ( ) with limited spatial coverage, which produces a high-resolution LULC map for a portion of our AOI. We then train the student model using lower-resolution Sentinel-2 imagery ( ) and the predictions from the teacher model as weak labels in the form of knowledge transfer [22].
-
2.
We evaluate the performance of our framework using different validation sets in a close collaboration with domain experts. Our approach has resulted in the production of a high-quality LULC map that covers Murang’a county in Kenya. This map is now being used for downstream agricultural tasks such as crop type mapping and yield estimation by partner organizations.
-
3.
We compare the maps generated by our local model with those generated by multiple existing global models. Our analysis highlights the limitations of the global models in Africa, including lower accuracy and inconsistencies. Our model achieves improvements of 0.14 in the score and 0.21 in Intersection-over-Union, compared to the best global model.
2 Data
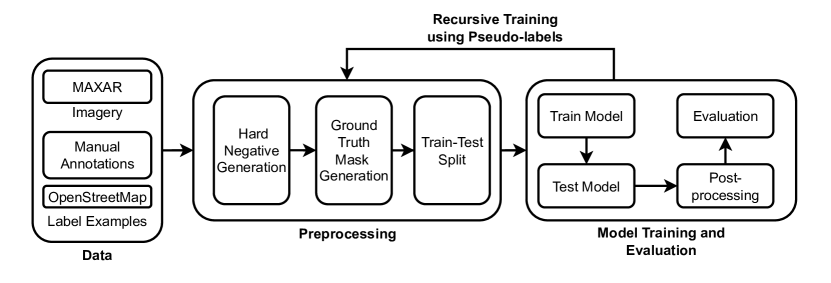
Our framework, shown in Fig. 1, uses raw Satellite Imagery and Label Examples (annotations), collected from different sources, to train and test the models.
2.1 Satellite Imagery
Our teacher and student models use imagery sources with different resolutions. The teacher model uses a high-resolution Maxar imagery, with resolution and red, green and blue channels, collected in 2022. However, it only covers of our AOI. In addition to its limited coverage, access to the high-resolution Maxar imagery is expensive which limits scalability. For example, Maxar’s GeoEye-1 and WorldView-2-4 50 cm 3-Band satellite imagery products have a minimum cost of and per , respectively, for archived and new imagery [23]. To this end, we use a student model that takes publicly available multispectral Sentinel-2 images, with m/pixel. We derived the median composite from all the Sentinel-2 images from 2022 for the entire AOI, including the red, green, blue, near infrared and short-wave infrared channels.
| Teacher Model | Student Model | ||
|---|---|---|---|
| LULC class | # of polygons | LULC class | # of polygons |
| Bare Ground | 1356 | Bare Ground | 187163 |
| Built-up | 2158 | Built-up | 276411 |
| Crop | 1814 | Crop | 483263 |
| Flooded Vegetation | 308 | Grass | 169395 |
| Grass | 1288 | Road | 256147 |
| Shrub & Scrub | 1438 | Shrub & Scrub | 289540 |
| Trees | 1796 | Trees | 235708 |
| Water | 1224 | Water | 28409 |
| Total | 11382 | Total | 1892036 |
2.2 Label Examples
The LULC classes in this work are adopted from [11]: Bare Ground, Built-up, Crop, Flooded Vegetation, Grass, Shrub & Scrub, Trees and Water. Given the diverse nature of built-up areas, we split the Built-up class into separate classes of Building and Road during the training of the teacher model. We adopted two strategies to collect label examples for our models. First, domain experts were recruited to annotate label examples as polygons, primarily using the high-resolution Maxar imagery. We used Microsoft’s satellite imagery labeling toolkit [24] for our annotation efforts. The domain experts annotated geographically diverse polygons, and the distribution of the polygons across the LULC classes is shown in Table 1. Second, we used existing layers in OpenStreetMap [25] to extract and polygons for Building and Road layers, respectively. This increased our total annotated polygons from to .
To achieve better delineation of LULC classes, we generated hard Negative examples as buffers of Building (with m buffer) and Road (with m buffer) classes, resulting a total of polygons as label examples (see Table 1). These labels are sparse and covered just of the pixels in the Maxar imagery, and they are used to train and test the models. The domain experts further annotated and polygons for the two main LULC classes of interest: Building and Crop labels, respectively - used as External validation set. We excluded the Flooded Vegetation class from our subsequent analysis due to the low quality of its corresponding label examples.
3 Methodology
Our methodology involves a knowledge transfer framework [22, 26, 27], using High-Resolution Teacher Model and Low-Resolution Student Model. We describe the details of these models below.
3.1 High-Resolution Teacher Model
Figure 2 shows the block diagram of the high-resolution teacher model. The input data include high-resolution Maxar images and label examples for a portion of our AOI. The model produces a high-resolution LULC map. We describe below the remaining steps: Preprocessing and Model Training and Evaluation.
Preprocessing
Includes Hard Negative Generation, Ground Truth Mask Generation and Train-Test Split. We added a buffer zone for each of the Building and Road polygons to generate hard negative examples (see Sec. 2.2). The added Negative class minimizes the over-dominance of these two classes due to their over-representation in the training data and improves delineation of LULC classes. We generated a ground truth mask from the annotations by mapping each labeled pixel to its class index and assigning zero to the remaining unlabeled pixels. We split the input data into train and test sets by considering the high diversity across the vertical slices of the input Maxar imagery (see Fig. 1), partly due to their different acquisition dates. For example, the left part of the imagery includes multiple cloud instances compared to the right part. As a result, we adopted a - vertical split of the data to train and test the model, respectively.
Model Training and Evaluation
We adopted a deep learning-based semantic segmentation framework to implement the teacher model, comprising a U-Net [28] with a ResNet-50 [29] backbone pre-trained on the ImageNet [30] dataset. We only considered errors from labeled pixels during training by ignoring errors from pixels with zero values in the mask. We adopted a recursive training for our models, using the predicted labels from the initial model as pseudo-labels for the second round of training. The evaluation step involves testing the model’s performance in detecting the LULC classes at a pixel level. We evaluated our approach using different validation sets: Whole (using all the available label examples as shown in Table 1), Test (using only the test split), and External (using an external validation set collected for the top priority labels for the partner organization, i.e., Building and Crop).
3.2 Low-Resolution Student Model
The student model uses the publicly available Sentinel-2 images that cover the entire AOI. We used a set of label examples consisting of manually annotated labels, pseudo-labels from the teacher model, and labels from existing OpenStreetMap layers. This results in polygons across eight LULC classes (see Table 1). During the generation of the ground truth mask for the student model, we down-sampled the high-resolution labels because the model works on the lower-resolution Sentinel-2 imagery.
We also implement the student model with deep learning-based semantic segmentation architectures, comprising U-Net [28] with a backbone of a 5-layer fully connected convolutional neural network (FCN) provided in TorchGeo library [31]. The student model setup uses the same - train-test split as the teacher model. The evaluation of the student model includes a post-processing step where the Road and Building LULC classes are merged back into the Built-up class to be consistent with existing global maps for the comparison.
4 Experimental Setup
In this Section, we present Baselines (the existing global LULC maps used for comparison with our map), Training Setup and Evaluation Setup and Metrics.
4.1 Baselines
We used existing global models as baselines to compare their corresponding LULC maps with our map produced with the student model. These existing maps are Google’s Dynamic World (GDW) [11], European Space Agency’s (ESA) WorldCover [13], and Environmental Systems Research Institute’s (ESRI) LULC [14]. GDW[11] is a near real-time land cover mapping tool that uses deep learning models and Sentinel-2 imagery. GDW provides global maps with LULC classes, updating every to days, aggregated using top-1 mode composite for the AOI in 2022. ESA [13]is a global land cover dataset derived from Sentinel-1 and Sentinel-2 data. ESA offers resolution and produces detailed coverage of land types annually. ESRI [14] is created using multi-source satellite imagery and contains a resolution annually 2017-2023.
We used GDW’s LULC types as the classes in our work except for the Flooded Vegetation class. These were excluded due to quality issues observed in the manually annotated polygons by domain experts. We aligned classes from different maps based on their definitions. To maintain a consistent set of LULC classes across the maps, we excluded Snow and Ice, Herbaceous Wetland, Mangroves, and Moss and Lichen labels from ESA’s map, and Snow/Ice, Clouds, Herbaceous Wetland, Mangroves, Moss and Lichen, and Shadow from ESRI’s map. During evaluation, the excluded classes were relabeled as Others.
4.2 Training Setup
We adopted a similar training setup for our teacher and student models, involving class weighting, patch size = , batch size = , minimum epochs = , maximum epochs = , learning rate = , and the cross-entropy loss. We used a sequence of augmentation steps including and rotations, horizontal and vertical flips - all with a probability of .
4.3 Evaluation Setup and Metrics
During evaluation, pixels predicted as the Negative class with the highest probability are relabeled with the second-highest probable class. To ensure a consistent set of LULC classes across maps, we merged the Building and Road classes into a single Built-up class during the evaluation of the student model output. The metrics include Accuracy, Precision, Recall, score and Intersection over Union (IoU). We computed these metrics for each LULC class, using one-vs-all strategy, and reported the Macro average. We used confusion matrices to understand the misclassification of pixels across the LULC classes. We also used an agreement matrix as a measure of consistency across the LULC maps.
5 Results

5.1 High-Resolution Teacher Model
The teacher model produces a high-resolution LULC map for a portion of our AOI (see Fig. 3). A subsequent zoom on imagery from the held-out test set shows a well-delineated classification of LULC classes. This result supports our approach to treat Building and Road LULC classes as separate classes by reducing ambiguity and improving delineation.

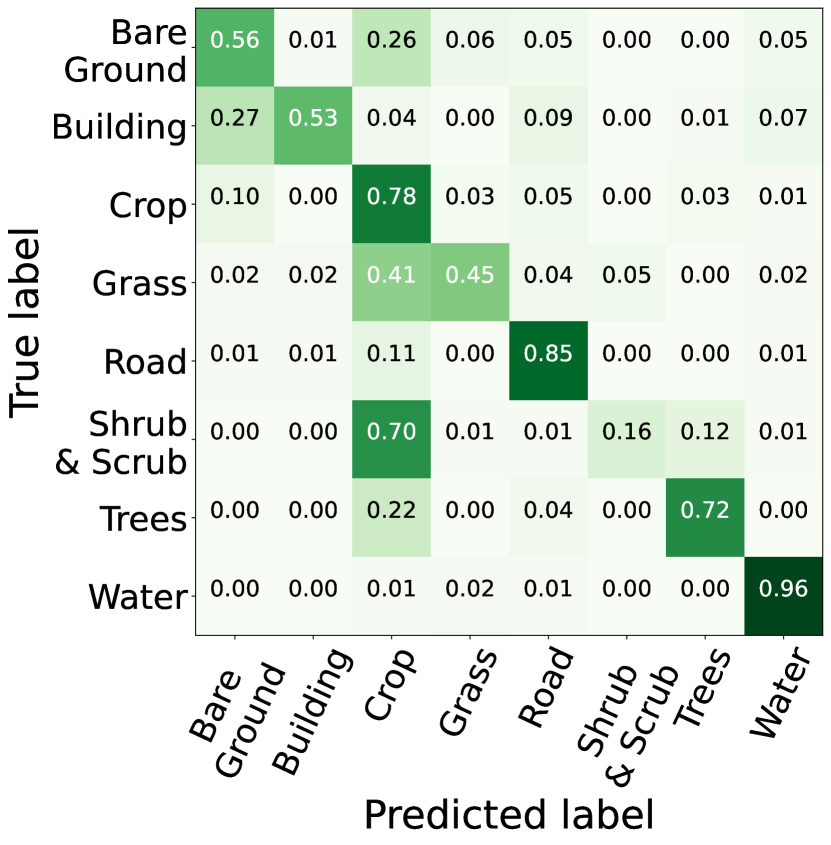
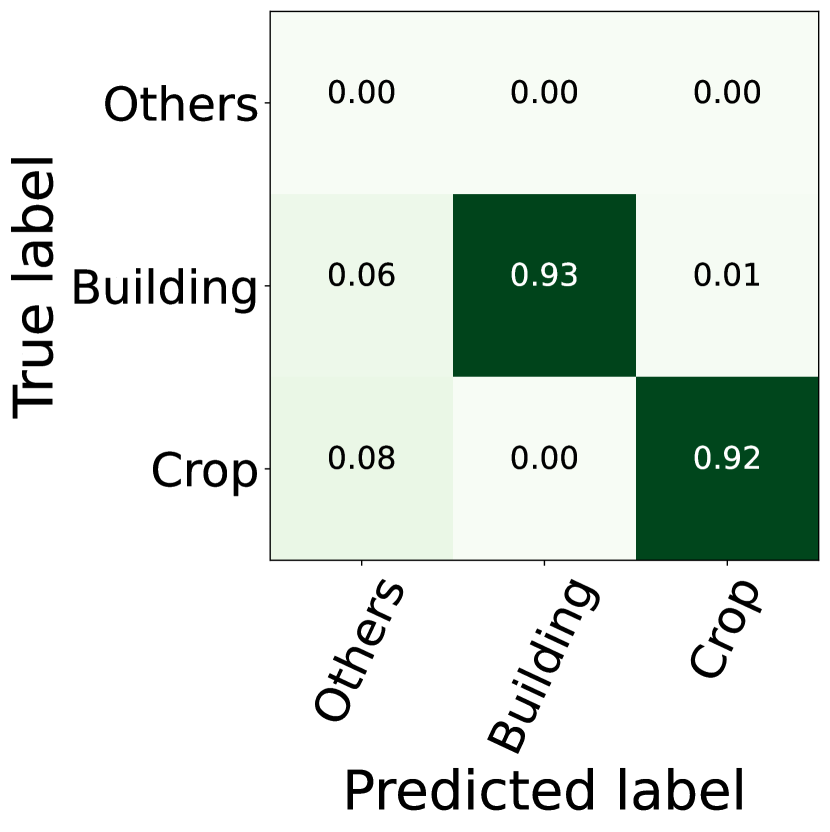
The confusion matrices in Fig. 4 show the classification accuracy among the classes, while also highlighting the misclassifications of Bare Ground, Grass, Trees, and Shrubs as Crop. The results derived from the Test set follow the trend observed in the Whole set, but the confusion between Shrub & Scrub and Crop classes worsens. The performance of detecting the priority classes: Building and Road, using the External set, is even higher as shown in Fig. 4 (c). Table 2 shows the metrics of the teacher model when evaluated on different validation sets. The results are encouraging for the Test set, while the performance on the External set is even higher with and of score and IoU, respectively.
| Validation Set | Accuracy | Precision | Recall | score | IoU |
|---|---|---|---|---|---|
| Whole | 0.95±0.06 | 0.44±0.32 | 0.73±0.13 | 0.50±0.27 | 0.59±0.18 |
| Test | 0.94±0.06 | 0.40±0.42 | 0.62±0.26 | 0.40±0.36 | 0.5±0.27 |
| External | 0.96±0.02 | 1.0±0.0 | 0.92±0.01 | 0.96±0.0 | 0.86±0.01 |


5.2 Low-Resolution Student Model
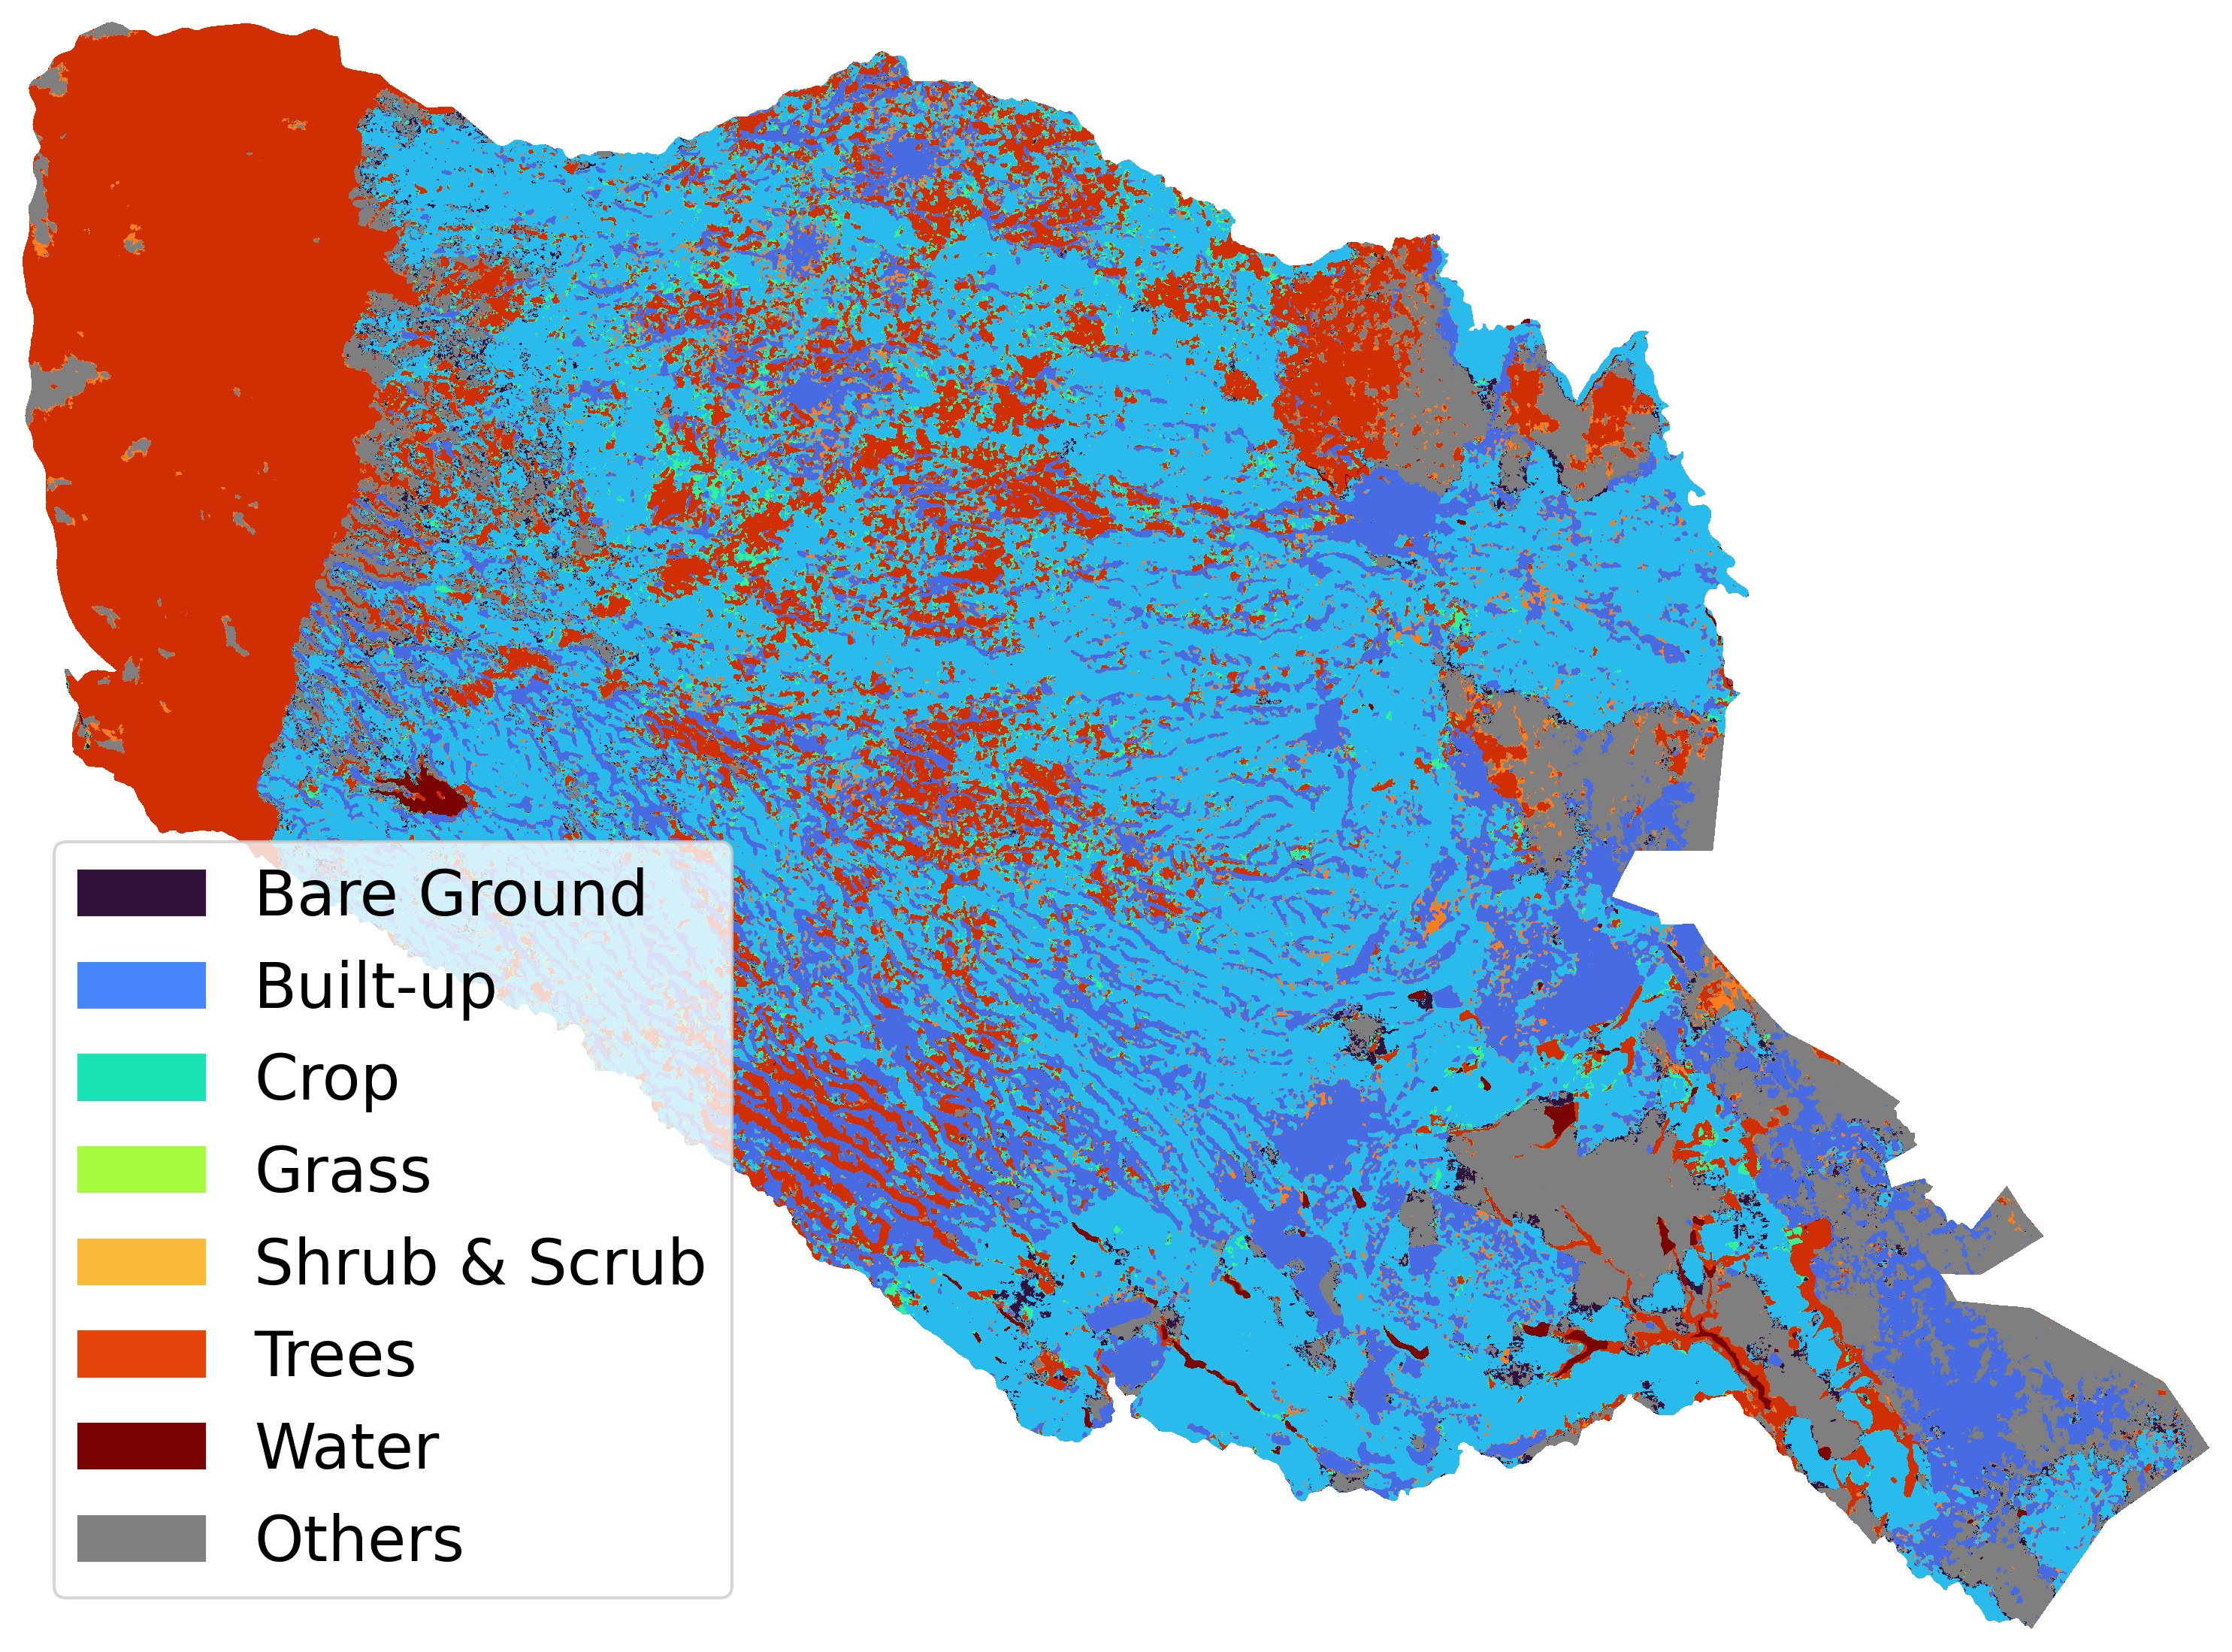
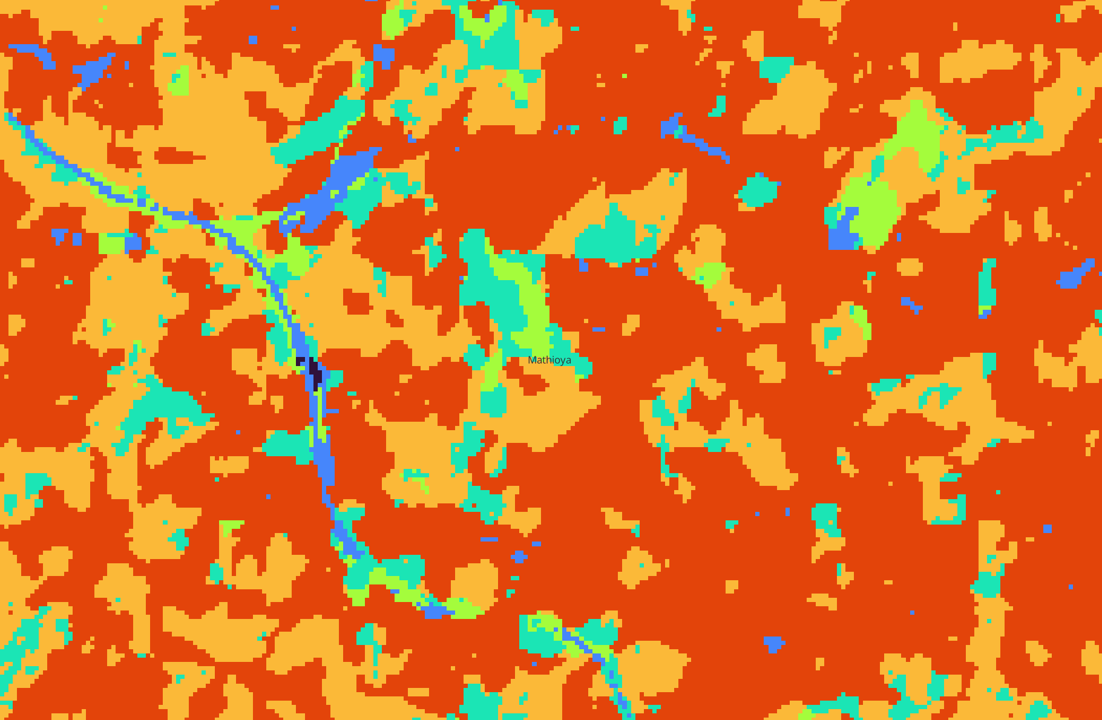
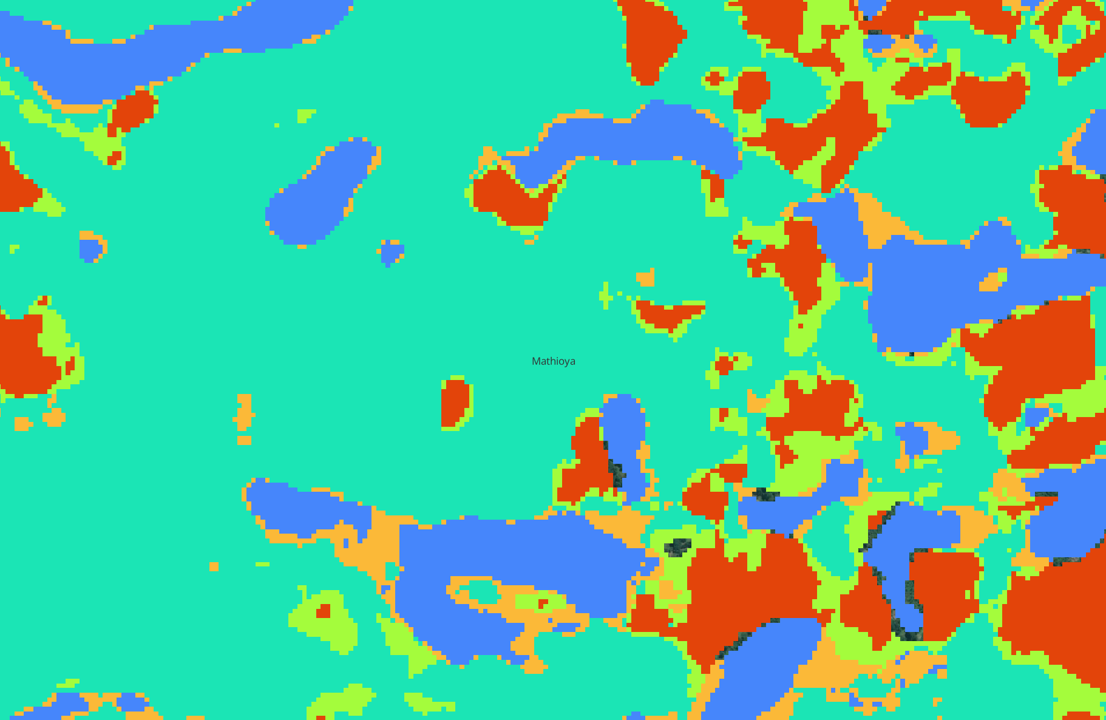
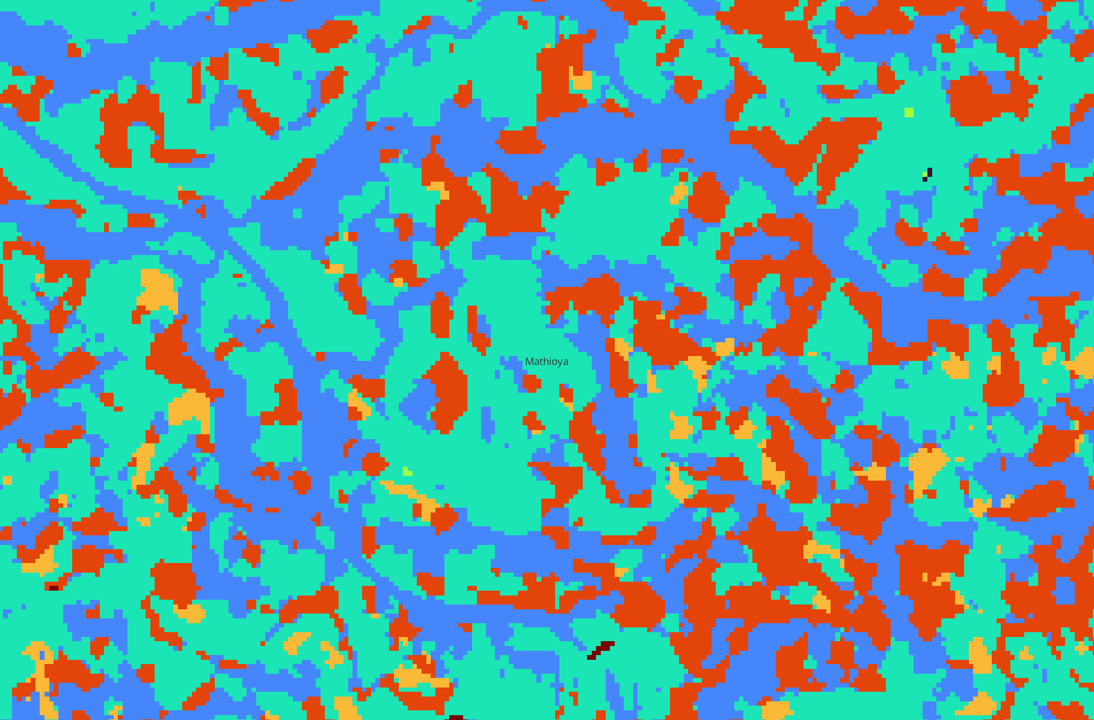
The advantage of our student model is its ability to generate the LULC map for the entire AOI, i.e., the Murang’a county of Kenya, as it uses publicly available Sentinel-2 images. Figure 5 shows different LULC maps of the AOI including the map from the student model of the proposed DATS and Baseline maps: GDW [11], ESA [13] and ESRI [14]. The GDW and ESA maps, shown in Fig. 5 (a) and (b), respectively, have similar trends of overestimation of Trees, particularly in the northern and eastern parts of the county. The ESA map further shows an overestimation of the Shrub & Scrub class across the county, while the Built-up class is underestimated. On the other hand, the ESRI and our (DATS) maps, shown in Fig. 5 (c) and (d), respectively, exhibit similar trends, including widespread Crop and Built-up classes. The DATS map demonstrates high-quality patterns, including the Built-up class. The Others class in ESRI’s map includes labels that were dropped from the evaluation, such as Flooded Vegetation, Snow/Ice, Clouds and Shadow, as described in Sec. 4. Figure 6 shows the closer look of these maps zoomed in around Mathioya town, in northern part of the county, known for its agricultural activities. The qualitative comparison of the maps further confirms the patterns observed in Fig. 5. The existing GDW, ESA and ESRI maps, produced by the corresponding global models, shown in Fig. 6 (c) - (e), exhibit lower quality compared to the DATS map, produced using our local model, shown in Fig. 6 (f). The GDW and ESA maps predominantly show Trees, whereas the ESA map distinctively shows a higher observation of Shrub & Scrub around Mathioya. The ESRI map, shown in Fig. 6 (e), indicates an overestimation of Croplands while Trees and Built-up areas are underestimated. Our DATS map, shown in Fig. 6 (f), presents a balanced view of Crop, Trees and Built-up classes. All the existing global maps show poor quality in mapping Built-up instances such as buildings and roads. Even the highway from northeast to south Mathioya, see Fig. 6 (a), was rarely detected by the global models. Existing LULC maps also fail to correctly map buildings that follow roads across the region.
Table 3 shows the evaluation metrics computed from the Whole set and averaged across the seven LULC classes considered. The results demonstrate that our map achieves the highest performance across all the evaluation metrics, with improvements of in the score and in Intersection-over-Union, compared to the map produced by the best global model, i.e., ESRI [14]. Table 4 shows the maps evaluated on the External set. The results once again confirm the superior quality of our map over the existing global maps.
| LULC Map | LULC class | Accuracy | Precision | Recall | score | IoU |
|---|---|---|---|---|---|---|
| GDW [11] | Built-up | 0.472 | 0.403 | 0.737 | 0.521 | 0.584 |
| Crop | 0.416 | 0.664 | 0.09 | 0.158 | 0.047 | |
| ESA [13] | Built-up | 0.612 | 0.516 | 0.029 | 0.055 | 0.015 |
| Crop | 0.46 | 0.566 | 0.491 | 0.526 | 0.325 | |
| ESRI [14] | Built-up | 0.665 | 0.543 | 0.892 | 0.675 | 0.806 |
| Crop | 0.652 | 0.904 | 0.481 | 0.628 | 0.317 | |
| DATS (ours) | Built-up | 0.898 | 0.82 | 0.945 | 0.878 | 0.896 |
| Crop | 0.891 | 0.963 | 0.853 | 0.905 | 0.744 |
6 Discussion
6.1 Inconsistencies and Reduced Accuracy Highlight Limitations of Global LULC Maps
Venter et al. [15] reported higher accuracy and agreement-level of existing global LULC maps when validated globally and in Europe. But when we validated these maps in the Murang’a county of Kenya in Africa, they exhibit poor performance (see Sec. 5) and inconsistencies (see Fig. 7). Our map achieves the highest agreement rate of with the ESRI [14] map, followed by with the GDW [11] map. The ESA [13] map, which tends to over-predict the Trees and Shrub & Scrub classes as shown in Fig. 5 (b), has the least agreement with the remaining maps. This also further supports the limitations of these global maps reported in prior research [2].

Table 5 highlights the variability in area coverages for the LULC classes across the maps. For example, the Built-up class covers a significant area except in the ESA [13] map, with our map indicating a coverage of km2 (representing of the county), similar to a coverage of km2 () in the GDW [11] map. The ESA [13] map underestimates the Built-up class, with only km2 () coverage. GDW underestimates Crop coverage, whereas both the ESRI and DATS maps show similar coverage distribution. We noted discrepancies in the estimations of Trees coverage across the maps. GDW map’s km2 (), compared to our map’s km2 (), indicates an overestimation by GDW [11] —a pattern consistently observed in Fig. 5 and Fig. 6. The ESA [13] map shows a km2 () coverage of Shrub & Scrub, which is an overestimation compared to the remaining maps.
| Maps | ||||||||
|---|---|---|---|---|---|---|---|---|
| GDW [11] | ESA [13] | ESRI [14] | DATS (ours) | |||||
| LULC class | ||||||||
| Bare Ground | 1.03 | 0.04 | 2.74 | 0.11 | 39.20 | 1.55 | 10.01 | 0.40 |
| Built-up | 501.71 | 19.86 | 42.55 | 1.68 | 443.21 | 17.54 | 529.64 | 20.96 |
| Crop | 335.99 | 13.30 | 431.04 | 17.06 | 1019.88 | 40.37 | 1290.75 | 51.09 |
| Grass | 80.91 | 3.20 | 202.61 | 8.02 | 77.78 | 3.08 | 14.32 | 0.57 |
| Shrub & Scrub | 131.23 | 5.19 | 844.24 | 33.42 | 74.39 | 2.94 | 158.34 | 6.27 |
| Trees | 1461.64 | 57.85 | 993.27 | 39.31 | 590.35 | 23.37 | 510.92 | 20.22 |
| Water | 13.37 | 0.53 | 9.62 | 0.38 | 11.06 | 0.44 | 11.75 | 0.47 |
| All | 2525.88 | 99.98 | 2526.07 | 99.98 | 2255.87 | 89.29 | 2525.73 | 99.97 |
6.2 Impact
Methodological Impact
The lower accuracies of global LULC maps, compared to the map produced by our local model, emphasize the importance of developing local models for more accurate LULC maps. The observed inconsistencies among these global maps underscore their limitations in African contexts, which pose adverse impacts on policy formulation and decision-making when these less accurate maps are used. Additionally, our modeling framework, comprising teacher and student models, underscores the need to effectively use diverse and growing data sources for LULC mapping. Knowledge transfer from the teacher model to the Sentinel-based student model achieves a more accurate LULC map, with the potential to scale due to the freely available nature of Sentinel-2 imagery.
Environmental and Agricultural Impact
Given the low resources available for decision makers in governmental organizations in SSA, including Murang’a county of Kenya, LULC maps provide basic insights by characterizing land cover types, enabling data-driven interventions and policy designs. Agriculture is a critical sector for most economies in SSA and hence the increased need for data-driven insights to improve it. However, the sector faces multiple challenges, including climate change resulting in rising food insecurity. LULC maps help to achieve most of the SDGs, particularly SDG 2: Zero Hunger, by enhancing food security, e.g., through efficient land use, automated crop mapping, and monitoring. Additionally, LULC maps support the compliance process to other challenges, such as the European Union’s Anti-deforestation Law [32], by analyzing longitudinal changes of croplands.
Cross Collaborations among Diverse Organizations
This work involved a close collaboration of diverse teams of domain experts from industry, academia, and government organizations. Our local partner, The Kenya Space Agency, selected Murang’a county for the pilot study. Such a collaborative effort enhances the trustworthiness of the developed product and increases the likelihood of its deployment for practical impacts. We involved end users, including the Murang’a county Government, throughout the development process. The preliminary version of our solution is deployed at the Kenya Space Agency [33]. Partnering organizations are also using it for downstream tasks of crop type mapping, monitoring, and yield estimation.
6.3 Limitations
Data
As any machine learning framework that takes data as its main input, our framework is clearly dependent on the quality of data being used to train our models. The high-resolution Maxar imagery exhibits a heavy presence of clouds, which affects the annotation effort and minimizes the size of imagery that can be used for model training. There are still quality gaps for some of the label examples, collected from manual annotations by domain experts, partly due to the intrinsic similarity of a few LULC classes, e.g., Grasslands vs. Shrub & Scrub. It is partly due to such annotation quality that we discarded the Flooded Vegetation class from our analysis. Thus, more quality assurance measures could be put in place to alleviate the problem.
Methodological
Our methodology did not use the temporal information in our analysis, which is important for understanding croplands as their appearance changes across different seasons. For example, a cropland may appear as Bare Ground before planting/seeding and as Grassland or Shrubland early after the seeding season. Thus, the work could be extended to include longitudinal changes.
Evaluation
While we adopt different evaluation sets, such as Whole, Test, and External sets, and several metrics to evaluate the performance of our LULC maps, care must be taken as all the quantitative metrics are derived from a small set of manually annotated labels. These labels are sparse and only constitute a smaller percentage of the whole imagery. Further collections of label examples, from multiple annotators and the use of other existing layers, could be made to increase the size of the validation set. Thus, a more exhaustive evaluation step, including on-ground verification, is necessary for more confident validation.
7 Conclusion and Future Work
Food security remains a significant challenge, particularly in the Global South, including Sub-Saharan Africa, partly due to adverse climate impacts and population growth. Earth observation technologies provide a promising opportunity to improve food security by generating diverse insights using increasingly available resources, such as Sentinel images, and deep learning models. Land-use and Land-cover (LULC) maps are instrumental in resource management and environmental monitoring by characterizing key land cover types. However, existing global LULC maps were reported to be lower in accuracy and inconsistent when validated in Africa. The alarming trend of food insecurity in Africa necessitates the need for accurate LULC maps to support the agriculture sector through informed decisions for crop mapping, monitoring, and yield estimation.
In this work, we proposed a data-centric framework to build a local LULC mapping model with a setup of teacher and student models. We used Murang’a county in Kenya as our area of interest (AOI). Our framework facilitated the efficient utilization of satellite images with varying scales of resolution and availability. We used Maxar images, with resolution, to train the teacher model and Sentinel-2 images, with resolution, to train the student model. While the availability of Maxar images is tasked, expensive and limited to only the portion of our AOI, the Sentinel-2 images are freely accessible. Thus, our framework enables effective utilization of diverse data sources and build a more accurate LULC map, when we compared it with existing global maps: GDW [11], ESA [13], and ESRI [14]. Additionally, we observed that existing global maps not only exhibited lower accuracy but also showed inconsistencies with low agreement among themselves. Future work includes scaling the framework to generate a LULC map for the entire country. We also plan to use temporal information to understand longitudinal changes of LULC. Temporal LULC maps can also aid in addressing compliance requirements with the recent EU Anti-deforestation Law, which poses additional challenges for small-scale farmers and producers in Africa and beyond.
References
- [1] Hamed Alemohammad and Kevin Booth. LandCoverNet: A global benchmark land cover classification training dataset. arXiv preprint arXiv:2012.03111, 2020.
- [2] Hannah Kerner, Catherine Nakalembe, Adam Yang, Ivan Zvonkov, Ryan McWeeny, Gabriel Tseng, and Inbal Becker-Reshef. How accurate are existing land cover maps for agriculture in Sub-Saharan Africa? Scientific Data, 11(1):486, 2024.
- [3] Food and Agriculture Organization of the United Nations (FAO), United Nations Children s Fund (UNICEF), World Food Programme (WFP), International Fund for Agricultural Development (IFAD) and World Health Organization (WHO). The state of food security and nutrition in the world, 2024. Accessed: 2024-12-05.
- [4] Gilles Quentin Hacheme, Akram Zaytar, Girmaw Abebe Tadesse, Caleb Robinson, Rahul Dodhia, Juan M Lavista Ferres, and Stephen Wood. Weak labeling for cropland mapping in africa. arXiv preprint arXiv:2401.07014, 2024.
- [5] Xinshen Diao, Peter Hazell, and James Thurlow. The role of agriculture in African development. World Development, 38(10):1375–1383, 2010.
- [6] Richard Wamalwa Wanzala, Nyankomo Marwa, and Elizabeth Nanziri Lwanga. Impact of agricultural credit on coffee productivity in kenya. World Development Sustainability, 5:100166, 2024.
- [7] Ken E. Giller. The food security conundrum of Sub-Saharan Africa. Global Food Security, 26:100431, 2020.
- [8] Roldan Muradian, Raras Cahyafitri, Tomaso Ferrando, Carolina Grottera, Luiz Jardim-Wanderley, Torsten Krause, Nanang I. Kurniawan, Lasse Loft, Tadzkia Nurshafira, Debie Prabawati-Suwito, Diaz Prasongko, Paula A. Sanchez-Garcia, Barbara Schröter, and Diana Vela-Almeida. Will the eu deforestation-free products regulation (eudr) reduce tropical forest loss? insights from three producer countries. Ecological Economics, 227:108389, 2025.
- [9] DW Trade Africa. EU deforestation law means uncertainty for African coffee. https://www.dw.com/en/eu-deforestation-law-means-uncertainty-for-african-coffee/a-68095185, 2024. Accessed: 2024-11-02.
- [10] Food Business Africa. EU regulations to ban Kenyan coffee from deforested land. https://www.foodbusinessafrica.com/eu-regulations-to-ban-kenyan-coffee-from-deforested-land/, 2024. Accessed: 2024-11-02.
- [11] Christopher F Brown, Steven P Brumby, Brookie Guzder-Williams, Tanya Birch, Samantha Brooks Hyde, Joseph Mazzariello, Wanda Czerwinski, Valerie J Pasquarella, Robert Haertel, Simon Ilyushchenko, et al. Dynamic world, near real-time global 10 m land use land cover mapping. Scientific Data, 9(1):251, 2022.
- [12] Esther Rolf, Konstantin Klemmer, Caleb Robinson, and Hannah Kerner. Mission critical–satellite data is a distinct modality in machine learning. arXiv preprint arXiv:2402.01444, 2024.
- [13] Daniele Zanaga, Ruben Van De Kerchove, Dirk Daems, Wanda De Keersmaecker, Carsten Brockmann, Grit Kirches, Jan Wevers, Oliver Cartus, Maurizio Santoro, Steffen Fritz, et al. ESA WorldCover 10 m 2021 v200. 2022.
- [14] Krishna Karra, Caitlin Kontgis, Zoe Statman-Weil, Joseph C Mazzariello, Mark Mathis, and Steven P Brumby. Global land use/land cover with Sentinel-2 and deep learning. In IEEE International Geoscience and Remote Sensing Symposium, pages 4704–4707, 2021.
- [15] Zander S Venter, David N Barton, Tirthankar Chakraborty, Trond Simensen, and Geethen Singh. Global 10 m land use land cover datasets: A comparison of Dynamic World, World cover and ESRI land cover. Remote Sensing, 14(16):4101, 2022.
- [16] Yidi Xu, Le Yu, Duole Feng, Dailiang Peng, Congcong Li, Xiaomeng Huang, Hui Lu, and Peng Gong. Comparisons of three recent moderate resolution African land cover datasets: CGLS-LC100, ESA-S2-LC20, and FROM-GLC-Africa30. International Journal of Remote Sensing, 40(16):6185–6202, 2019.
- [17] Mohsen Nabil, Miao Zhang, José Bofana, Bingfang Wu, Alfred Stein, Taifeng Dong, Hongwei Zeng, and Jiali Shang. Assessing factors impacting the spatial discrepancy of remote sensing based cropland products: A case study in Africa. International Journal of Applied Earth Observation and Geoinformation, 85:102010, 2020.
- [18] Esther Rolf, Ben Packer, Alex Beutel, and Fernando Diaz. Striving for data-model efficiency: Identifying data externalities on group performance. arXiv preprint arXiv:2211.06348, 2022.
- [19] Luis Oala, Manil Maskey, Lilith Bat-Leah, Alicia Parrish, Nezihe Merve Gürel, Tzu-Sheng Kuo, Yang Liu, Rotem Dror, Danilo Brajovic, Xiaozhe Yao, et al. Dmlr: Data-centric machine learning research–past, present and future. arXiv preprint arXiv:2311.13028, 2023.
- [20] Weixin Liang, Girmaw Abebe Tadesse, Daniel Ho, Li Fei-Fei, Matei Zaharia, Ce Zhang, and James Zou. Advances, challenges and opportunities in creating data for trustworthy ai. Nature Machine Intelligence, 4(8):669–677, 2022.
- [21] Wojciech Sirko, Emmanuel Asiedu Brempong, Juliana TC Marcos, Abigail Annkah, Abel Korme, Mohammed Alewi Hassen, Krishna Sapkota, Tomer Shekel, Abdoulaye Diack, Sella Nevo, et al. High-resolution building and road detection from sentinel-2. arXiv preprint arXiv:2310.11622, 2023.
- [22] Lin Wang and Kuk-Jin Yoon. Knowledge distillation and student-teacher learning for visual intelligence: A review and new outlooks. IEEE Transactions on Pattern Analysis and Machine Intelligence, 44(6):3048–3068, 2021.
- [23] LandInfo Mapping LLC. Buying satellite imagery: Pricing information for high resolution satellite imagery. https://landinfo.com/satellite-imagery-pricing/, 2024. Accessed: 2024-11-02.
- [24] Microsoft. Satellite imagery labeling toolki. https://github.com/microsoft/satellite-imagery-labeling-tool, 2023. Accessed: 2024-11-02.
- [25] OpenStreetMap. Welcome to OpenStreetMap! https://www.openstreetmap.org/#map=6/0.17/37.90, 2024. Accessed: 2024-11-02.
- [26] Tao Huang, Shan You, Fei Wang, Chen Qian, and Chang Xu. Knowledge distillation from a stronger teacher. Advances in Neural Information Processing Systems, 35:33716–33727, 2022.
- [27] Lucas Beyer, Xiaohua Zhai, Amélie Royer, Larisa Markeeva, Rohan Anil, and Alexander Kolesnikov. Knowledge distillation: A good teacher is patient and consistent. In Proceedings of the IEEE/CVF Conference on Computer Vision and Pattern Recognition, pages 10925–10934, 2022.
- [28] Olaf Ronneberger, Philipp Fischer, and Thomas Brox. U-net: Convolutional networks for biomedical image segmentation. In Medical Image Computing and Computer-assisted Intervention–MICCAI, pages 234–241, 2015.
- [29] Kaiming He, Xiangyu Zhang, Shaoqing Ren, and Jian Sun. Deep residual learning for image recognition. In Proceedings of the IEEE conference on Computer Vision and Pattern Recognition, pages 770–778, 2016.
- [30] Jia Deng, Wei Dong, Richard Socher, Li-Jia Li, Kai Li, and Li Fei-Fei. Imagenet: A large-scale hierarchical image database. In 2009 IEEE Conference on Computer Vision and Pattern Recognition, pages 248–255, 2009.
- [31] Adam J. Stewart, Caleb Robinson, Isaac A. Corley, Anthony Ortiz, Juan M. Lavista Ferres, and Arindam Banerjee. TorchGeo: Deep learning with geospatial data. In Proceedings of the 30th International Conference on Advances in Geographic Information Systems, SIGSPATIAL ’22, pages 1–12, Seattle, Washington, November 2022. Association for Computing Machinery.
- [32] Lisa Heldt. Space Technology and Supply Chain Sustainability: Satellite-Based Due Diligence and the EU Deforestation Regulation, pages 109–134. 2024.
- [33] Kenya Space Agency. Agriculture Information Management system (AIMS) - Murang’a County. https://eo4agric.ksa.go.ke/muranga, 2024. Accessed: 2024-11-02.