Multi-wavelength Study of Dust Emission in the Young Edge-on Protostellar Disk HH 212
Abstract
Grain growth in disks around young stars plays a crucial role in the formation of planets. Early grain growth has been suggested in the HH 212 protostellar disk by previous polarization observations. To confirm it and to determine the grain size, we analyze high-resolution multi-band observations of the disk obtained with Atacama Large Millimeter/submillimeter Array (ALMA) in Bands 9 (0.4 mm), 7 (0.9 mm), 6 (1.3 mm), 3 (3 mm) as well as with Very Large Array (VLA) in Band Ka (9 mm) and present new VLA data in Bands Q (7 mm), K (1.3 cm), and X (3 cm). We adopt a parameterized flared disk model to fit the continuum maps of the disk in these bands and derive the opacities, albedos, and opacity spectral index of the dust in the disk, taking into account the dust scattering ignored in the previous work modeling the multi-band data of this source. For the VLA bands, since the continuum emission of the disk is more contaminated by the free-free emission at longer wavelengths, we only include the Band Q data in our modeling. The obtained opacities, albedos, and opacity spectral index (with a value of 1.2) suggest that the upper limit of maximum grain size in the disk be 130 m, consistent with that implied in the previous polarization observations in Band 7, supporting the grain growth in this disk.
1 Introduction
Accurate dust opacities at (sub)millimeter wavelengths are required to estimate the mass of protostellar disks and thus the mass budgets for planet formation. They are also important probes of dust sizes and thus grain growth. From the previous survey at =1.3mm, the empirical opacity spectral index in T-Tauri disks is estimated to be (Beckwith et al., 1990). A 3mm survey of T-Tauri disks also indicates a similar value of (Ricci et al., 2010). This infers that the values of in the Class II T-Tauri disks at millimeter wavelengths are smaller than those in the diffuse interstellar medium (Draine & Lee, 1984; Li & Draine, 2001), suggesting substantial grain growth in the T-Tauri disks for planet formation.
For more embedded Class 0/I stages, (sub)millimeter observations also suggest grain growth for early planet formation. The ALMA/VLA survey of Class 0/I disks in the Perseus and the Orion star-forming regions show a preference for a low value of and significant grain growth (Tobin et al., 2020; Tychoniec et al., 2020). Some recent studies adapt certain dust models in radiative transfer modeling of multi-wavelength continuum observations of some Class 0/I disks and infer the maximum grain size of these young sources to be mm/cm (Xu, 2022; Han et al., 2023; Zamponi et al., 2024).
| Band | Project Code | Wavelength | Baseline Lengths | Time on source | Synthesized Beam | Rms Noise Level | Peak Intensity | Total Flux |
|---|---|---|---|---|---|---|---|---|
| (mm) | (m) | (minutes) | (; PA) | (mJy ) | (mJy ) | (mJy) | ||
| (1) | (2) | (3) | (4) | (5) | (6) | (7) | (8) | (9) |
| ALMA Band 9 | 2012.1.00122.S | 0.434 | 15-1574.4 | 44.2 | ; | 2.281 | 77.597 | 989.285 |
| 2015.1.00024.S | 15-16196 | 88.2 | ||||||
| ALMA Band 7 | 0.851 | ; | 0.0335 | 4.991 | 132.277 | |||
| 2017.1.00044.S | 92-8547 | 98.3 | ||||||
| ALMA Band 6 | 2017.1.00712.S | 1.33 | 15-14969 | 25.2 | ; | 0.0222 | 2.646 | 71.707 |
| 2017.1.00712.S | 41-14969 | 45.1 | ||||||
| ALMA Band 3 | 2.85 | ; | 0.0121 | 1.034 | 10.274 | |||
| 2019.1.00037.S | 47-16196 | 128.0 | ||||||
| VLA Band Q | 20B-323 | 6.81 | 793-36623 | 126.6 | ; | 0.0136 | 0.276 | 0.772 |
| VLA Band Ka | 16A-197 | 9.10 | 793-34424 | 71.5 | ; | 0.00841 | 0.242 | 0.477 |
| VLA Band K | 20B-323 | 13.6 | 793-36623 | 26.7 | ; | 0.00746 | 0.116 | 0.132 |
| VLA Band X | 20B-323 | 30.0 | 793-36623 | 13.7 | ; | 0.00986 | 0.0503 | 0.0724 |
Polarization observations have also been performed toward several Class 0/I disks in the dust continuum at (sub)millimeter wavelengths (mainly ALMA bands 7 and 6). The polarized dust emission shows orientations mainly parallel to the minor axis of the disks with a polarization fraction of 1% (Sadavoy et al., 2018; Lee et al., 2018, 2021a; Harris et al., 2018; Aso et al., 2021; Liu et al., 2024). These polarization features suggest that the dust grains in these disks have grown to a size of to produce the polarized emission through dust self-scattering (Kataoka et al., 2015, 2016; Yang et al., 2016), similar to some Class II disks (Stephens et al., 2014; Hull et al., 2018; Bacciotti et al., 2018; Yang et al., 2024).
Moreover, recent studies of dust coagulation calculations show that dust grains in the protostellar disk could grow well beyond the fragmentation barrier (in which the growths of dust are suppressed by fragmentation threshold velocity) into the kilogram pebbles at the stage of Class 0/I (Xu & Armitage, 2023), supporting the presence of planet formation in the disks during the Class 0/I phase.
Our target, HH 212, is a well-studied Class 0 protostellar system in Orion (400 pc) with a rotating bipolar jet (Lee et al., 2017a). A nearly edge-on disk with an inclination angle of relative to the line of sight (Lee et al., 2021b) is seen deeply embedded in an infalling-rotating flattened envelope (Lee et al., 2014, 2017b) that has a centrifugal barrier at au (Lee et al., 2017c). This disk is the first vertically resolved disk at ALMA band 7 showing a cooler dark lane along the major axis (“hamburger-like structure”; Lee et al. 2017b). The HH 212 disk was also observed in the continuum by ALMA at band 9, 6, 3, and VLA band Ka at high angular resolutions. The continuum emission in these bands has been modeled to obtain the dust properties, e.g., opacity spectral index, in the disk (Lin et al., 2021, hereafter Paper 1).
=12pt
| Band | Obs. Date | Bandpass | Flux | Phase |
|---|---|---|---|---|
| (UTC) | Calib. | Calib. | Calib. | |
| (1) | (2) | (3) | (4) | (5) |
| ALMA Band 9 | 2015 Jul 26 | J0522-3627 | J0423-013 | J0607-0834 |
| ALMA Band 7 | 2015 Aug 29 | J0607-0834 | J0423-013 | J0552+0313 |
| 2015 Nov 5 | J0423-0120 | J0423-0120 | J0541-0211 | |
| 2015 Dec 3 | J0510+1800 | J0423-0120 | J0541-0211 | |
| 2017 Nov 27 | J5010+1800 | J5010+1800 | J0541-0211 | |
| ALMA Band 6 | 2017 Oct - 2017 Dec | J0423-0120 | J0423-0120 | J0541-0211 |
| ALMA Band 3 | 2017 Oct 5 | J0423-0120 | J0423-0120 | J0541-0211 |
| 2021 Aug - 2021 Sep | J0423-0120 | J0423-0120 | J0532-0307 | |
| VLA band Q | 2020 Dec - 2021 Jan | J0319+4130 | 3C147 | J0552+0313 |
| VLA band Ka | 2016 Oct 22 | J0319+4130 | J0137+3309 | J0552+0313 |
| VLA band K | 2020 Dec - 2021 Jan | J0319+4130 | 3C147 | J0552+0313 |
| VLA band X | 2020 Dec - 2021 Jan | J0319+4130 | 3C147 | J0552+0313 |
Early grain growth in the HH 212 disk has been suggested in previous polarization observation (Lee et al., 2018). Later work with an opacity spectral index (as in the ISM) was able to reproduce the hamburger-like structure of the disk seen at ALMA Band 7, suggesting no grain growth is needed (Galván-Madrid et al., 2018). Paper 1 found that the absorption dust opacity has a spectral index similar to the found in T-Tauri disks (Beckwith et al., 1990), but with a lower limit at lower than that in T-Tauri disks by a factor of 2, potentially suggesting a somewhat smaller degree of grain growth with different grain properties. Recent well-resolved dust polarization observation at ALMA band 7 revealed the importance of dust self-scattering caused by grains, suggesting an early grain growth in the HH 212 disk (Lee et al., 2021a).
In order to better investigate the dust properties and possible grain growth in this early disk, in this paper, we add new VLA observations and extend the wavelength coverage to be 434 m-3 cm. We estimate the free-free emission and remodel the disk emission through radiative transfer calculation including dust self-scattering effect (which was ignored in Paper 1). The calibration and imaging process of ALMA and VLA observations will be summarized in Section 2. The disk model and the dust opacity assumptions in this work will be presented in Section 3. The SED analysis and the best-fit results with different dust opacity assumptions can be found in Section 4. Section 5 discusses the prescription of opacity and albedo in best-fit models. The conclusions and summaries are given in Section 6.
2 Observations
2.1 ALMA Observations
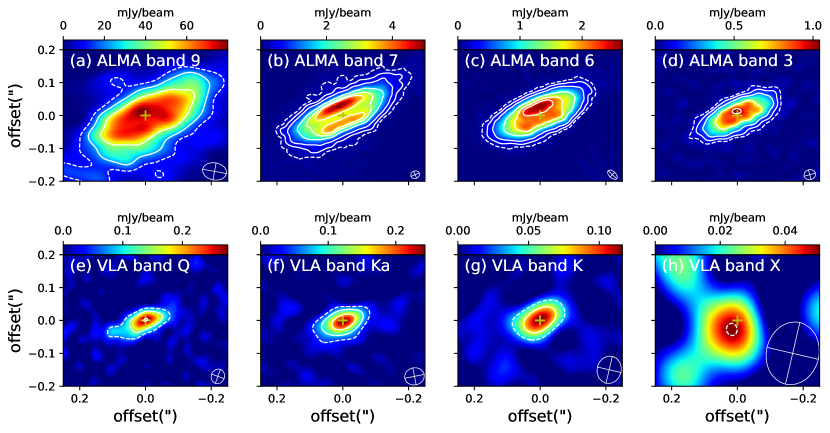
We use the archival data at ALMA bands 9, 7, 6, and 3 to obtain the high-resolution (sub)millimeter-wavelength dust continuum images of the HH 212 disk. The ALMA observations were executed from 2015 to 2021. The summary of the observations is shown in Table 1 and Table 2. The raw data have been calibrated through Common Astronomy Software Applications (CASA; McMullin et al., 2007) by using ALMA-supplied calibration scripts. TCLEAN task in CASA is applied with a range of Briggs robust parameters. We use robust parameters -1.0, 0.0, 0.5, and -1.0 (which have the best balance between resolution and sensitivity) to generate continuum images with synthesized beams of , , , and from the combined line-free channels in ALMA band 9, 7, 6, and 3, respectively. The resulting continuum images center on 691.4, 346.3, 225.8, and 104.8 GHz for ALMA bands 9, 7, 6, and 3 respectively.
The proper motion of this system (0.5 mas , -2.0 mas ; Paper 1) is considered in the imaging process. We utilize the FIXPLANET task in CASA to shift the science target to the same reference time for the visibility data of each ALMA band before performing TCLEAN task.
The resulting continuum images are shown in Figure 1. In ALMA band 7 image, similar to previous studies of HH 212 (Lee et al. 2017b; Paper 1), the hamburger-like structure with two bright lanes above/below the midplane of the disk along the major axis can be identified, which can be explained by the self-obscuration effect in the midplane of a flared disk by an optically thick cooler outer part (Lee et al., 2017b; Li et al., 2017; Galván-Madrid et al., 2018). In addition, ALMA band 9 to band 3 images are obviously asymmetric along the minor axis, where the northern side is brighter than the southern side. This feature has been discussed by Lee et al. (2017b) and it is caused by the disk being optically thick and tilted slightly away from being edge-on. Similar asymmetric features are also detected by other nearly edge-on disks (e.g. L1527 IRS: Ohashi et al. 2022, IRAS 04302+2247: Lin et al. 2023, R CrA IRS7B-a: Takakuwa et al. 2024, GSS30 IRS3: Santamaría-Miranda et al. 2024).
2.2 VLA Observations
The high-resolution dust continuum images from several millimeters to centimeter-wavelength can be derived from the archival VLA observations in the A configuration. The band Q, K, and X observations have been carried out from December 2020 to January 2021 (Project code: 20B-323, PI: Zhe-Yu Daniel Lin). The band Ka observation was performed on 2016 October 22 (Project code: 16A-197, PI: John Tobin) as one of the targets in the VLA/ALMA Nascent Disc and Multiplicity (VANDAM) Orion survey (Tobin et al., 2020). We calibrated the raw data via the VLA calibration pipeline in CASA. The continuum images of each band are made by running the TCLEAN task in CASA with a Briggs robust parameter of 0 to generate continuum images with synthesized beams of , , , and from the combined line-free channels in ALMA band Q, Ka, K, and X. The resulting continuum images center on 44.0, 32.9, 22.0, and 9.9 GHz for VLA bands Q, Ka, K, and X respectively.
From VLA band Q to band K images, the disk is marginally resolved with a Gaussian-like component peaked at the central protostar. For the VLA band X image, the disk is not resolved and the peak intensity has an offset from the central protostar. The contamination from free-free emission would be noticeable at the VLA band (see Section 2.3 for details). Interestingly, aside from the Gaussian-like component, there is an additional elongated structure at the east side of the VLA band Q image. This structure could arise from underlying substructures, such as clumps or spirals, in the disk, but the edge-on view makes it difficult to ascertain immediately (Nakatani et al., 2020; Sheehan et al., 2022). In this study, we focus on the dust properties of the whole disk. Detailed modeling of this possible structure is beyond the scope of this paper.
2.3 Spectral energy distribution
The spectral index is defined as
| (1) |
where , , and stand for the wavelength, flux density, and frequency respectively. For optically thin isothermal dust emission in the Rayleigh-Jeans limit, can be utilized to obtain the opacity spectral index by , where is defined as the power-low index between absorption opacity and frequency (Draine, 2006). For the case , can not be derived from and we will demonstrate this later.
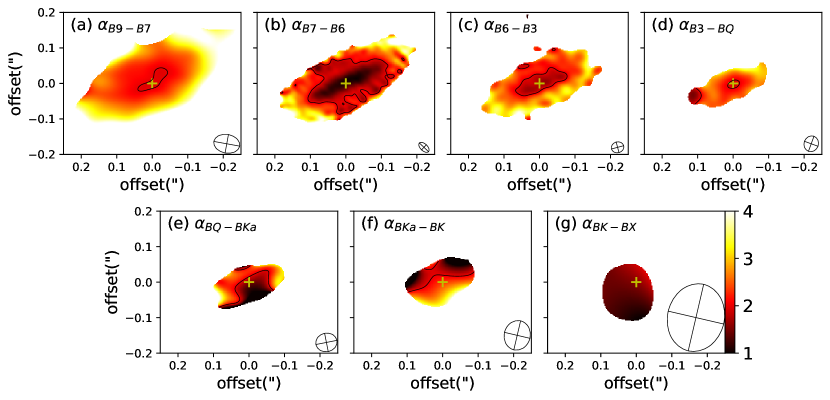
We use the IMSMOOTH task in CASA to convolve the image to the same beam size for generating the spectral index maps of any two adjacent wavelengths in image space (Figure 2). The intensity less than 3 has been masked out to show a reliable distribution of .
The map (Figure 2b) shows a value smaller than 2 within a radius of 60 au in the midplane, which could be due to radial temperature gradient (Galván-Madrid et al., 2018) or scattering (Zhu et al., 2019; Liu, 2019) in the optically thick disk. From ALMA band 7 and VLA band Q, the value of at the center part of the disk tends to gradually increase but is smaller than 2. This suggests that the intensity between ALMA band 7 and VLA band Q is dominated by optically thick thermal emission instead of optically thin emission from large dust grain with small opacity spectral index . From VLA band Q to band X, the low value of suggests a presence of free-free contamination in the central part of the disk.
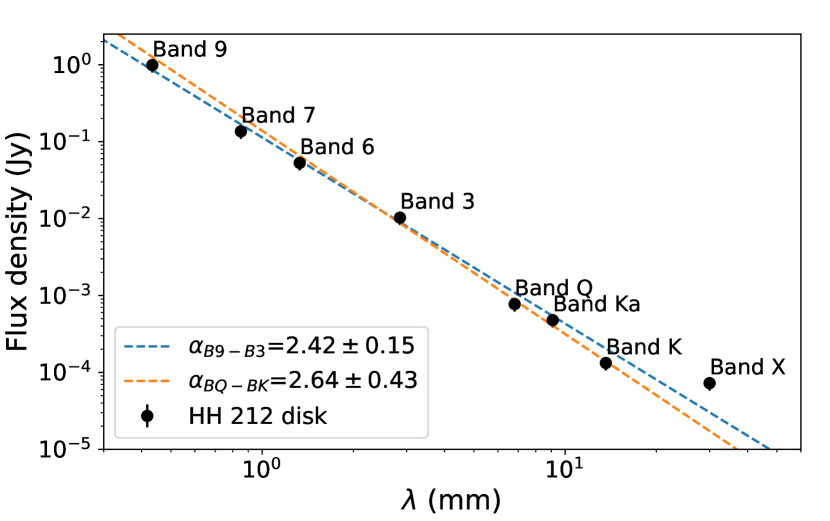
To determine the possible contribution from free-free emission, we plot the spectral energy distribution (SED) of the HH 212 disk (Figure 3), in which the total flux of each band is estimated from the region above 3 . The spectral index derived from the flux densities of ALMA bands shows an optically thick limit in Rayleigh-Jeans tail. For VLA band Q to band K, the is similar to that from ALMA bands due to a combination of both thermal and free-free emission.
The slope between the VLA band K and VLA band X is smaller than that in shorter wavelengths with spectral index , consistent with the optically thick thermal free-free emission obtained from VANDAM Perseus survey with a median value of from 4.1 to 6.4 cm (Tychoniec et al., 2018). Assuming the continuum emission at VLA band X is fully dominated by free-free emission and a constant free-free emission throughout all bands in this work, we could estimate the upper limit of free-free contamination of shorter wavelength. For ALMA bands, the free-free contamination is smaller than 1%. For VLA bands, the free-free contamination is 9.38%, 15.16%, and 54.66% for bands Q, Ka, and K respectively, where the value of band Ka is consistent with that estimated from the VANDAM Perseus survey. Because of its higher resolution and lower free-free contamination, we will limit our modeling of the VLA observations to the Q band below.
3 Method
3.1 Disk model
Flared disk models have been widely applied to Class 0/I disks (e.g. HH 212: Lee et al. 2017c; Galván-Madrid et al. 2018, L1527 IRS: Nakatani et al. 2020; Sheehan et al. 2022; Ohashi et al. 2022, IRAS 04302+2247: Villenave et al. 2023; Lin et al. 2023, L1489 IRS: Yamato et al. 2023, HH 211: Lee et al. 2023, R CrA IRS7B-a: Takakuwa et al. 2024). In this study, we continue to use the similar flared disk model to that in Lee et al. (2017c), and utilize RADMC3D (Dullemond et al., 2012) to calculate the dust emission of the HH 212 disk for comparison with the observations.
We adopt a cylindrical coordinate system for our model, assuming gas and dust are well mixed with a gas-to-dust ratio of 100 in the disk. The density and temperature distributions are modeled with power-law relations, same as Lee et al. (2017c, 2021a), characterized by power-law indices and , respectively:
| (2) |
| (3) |
where is the reference radius, and is the mass density (gas+dust) and temperature at the midplane of the reference radius and is the pressure scale height of the disk.
We assume the pressure scale height is proportional to within the reference radius, where is isothermal sound speed and is Keperian frequency. For the outer part of the disk, we assume an exponentially tapered pressure scale height as described in Lee et al. (2017b), which is an empirical necessity and is consistent with the disk formation simulation (Xu & Kunz, 2021).
| (4) |
where is the pressure scale height at the reference radius and is the disk edge, which are assumed to be 12 au and 68 au as derived in Lee et al. (2021a). The height of the disk surface is assumed to be .
The parameters , and can be correlated with the Toomre parameter at the reference radius (Toomre, 1964), which can be expressed as:
| (5) |
where is the surface density at the reference radius
| (6) |
and , can be given by:
| (7) |
| (8) |
where is the Boltzmann constant, is the mass of hydrogen (proton). The adiabatic index and the mean molecular weight are adopted from molecular hydrogen and helium.
| (9) |
where .
For the HH 212 disk, the estimated Toomre parameter 1 2.5 infers that this system is marginally gravitational unstable (Tobin et al., 2020). As a result, we set to be in this range for finding the best parameter combination in the following section.
| (10) |
3.2 Dust opacities
We use the radiative transfer code RADMC3D to calculate the dust continuum images of the HH 212 disk at ALMA and VLA bands. To fit the disk model and obtain the dust properties of this disk, we consider three possible cases for the dust opacities.
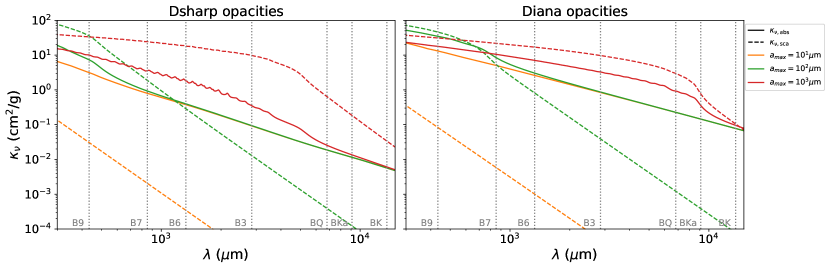
We first consider two dust models: DSHARP (Birnstiel et al., 2018) and DIANA (Woitke et al., 2016). DSHARP dust model is composed of water ice (Warren & Brandt, 2008), astronomical silicates (Draine, 2003), refractory organics, and troilite (Henning & Stognienko, 1996) with the adopted volume fractions of 36.4%, 16.7%, 2.6%, and 44.3%, respectively. DIANA dust
| Dust assumption | Parameter Range | Best-fit parameters | |||
|---|---|---|---|---|---|
| (1) | (2) | (3) | (4) | ||
| DSHARP dust model | 2040 | ||||
| (Birnstiel et al. 2018) | 60120 | ||||
| 1.02.5 | |||||
| DIANA dust model | 2040 | ||||
| (Woitke et al. 2016) | 60120 | ||||
| 1.02.5 | |||||
| Parameterized dust | 2040 | 9.265 | |||
| opacity (PDO) model | 60120 | 6.061 | |||
| (=1) | 4.112 | ||||
| 4.133 | |||||
| 5.858 | |||||
model consists of pyroxene with 70% Magnesium and carbon. Assuming spherical compact dust grains with MRN grain size distribution (Mathis et al., 1977, n(a)) and a maximum grain size , we use OPTOOL (Dominik et al., 2021) to generate the corresponding dust absorption and scattering opacities for radiative transfer (Figure 4). The grain size at different heights of the disk may be different. In this study, we assume a constant throughout the disk for simplicity.
The effective albedo is expressed as:
| (11) |
where , and are absorption opacity, scattering opacity and anisotropic scattering factor (D’Alessio et al., 2001). Due to different compositions, the absorption opacities of the DIANA dust model are about one order larger than those of the DSHARP dust model at (sub)millimeter wavelengths. We set , , , and as free parameters for these two dust models, which correspond to the geometry, temperature profile, opacity, and density profile of the disk respectively. Because of the uncertain dust properties in Class 0/I disks, we also introduce a Parameterized dust opacity (PDO) model that is not constrained by a specific dust composition. In this case, we assume (similar as Paper 1) and set , , , and as free parameters in each band.
The free parameters of each dust opacity assumption are summarized in Table 3. and in each dust opacity assumption are varied linearly in 10 grids from 20 au to 40 au and from 60 K to 120K respectively. For the DSHARP and DIANA dust model, is varied in logarithmic space in 10 grids from to and is varied into 15 grids linearly from 1 to 2.5. For the PDO model, is varied in logarithmic space in 50 grids from to and is varied linearly from 0 to 1 in 10 bins.
3.3 Fitting RADMC3D image to observations
Using the disk model in Section 3.1 and dust opacity in Section 3.2, we conducted the radiative transfer calculations with different combinations of free parameters using RADMC3D. Different from the previous study that fits the disk continuum emission only along the major and minor axis of the disk (Paper 1), we fit our disk model to the observed visibility data directly to obtain the best-fit parameters for each dust opacity assumption. We use the GALARIO package (Tazzari et al., 2018) to Fourier transform the output image from RADMC3D into synthetic visibilities with the same uv coverage as observations in each band. The reduced chi-square between the observed visibilities and synthetic visibilities is defined as:
| (12) |
where is the number of uv data points, is the post-calibration visibility weights for each uv data, and are real and imaginary parts of each uv data. To minimize the influence of the larger scale emission from the envelope during the fitting process, we use the uv data points larger than 500k for ALMA band 9 and 100k for other bands to calculate the reduced chi-square (see more details in Appendix A).
To show the synthetic images of our best-fit model, we input the best-fit RADMC3D images to the SIMOBS task in CASA with the same configuration and spectral window setting as ALMA and VLA observations. For the imaging process, the TCLEAN task in CASA with the same settings in Section 2 is applied to the resulting measurement sets to generate synthetic images.
4 Results
4.1 Model fitting results
We obtain the best-fit parameters for each dust opacity assumption with the smallest reduced chi-square of ALMA and VLA bands. Because of the free-free contamination in centimeter wavelengths (Section 2.3), we only use the ALMA bands 9, 7, 6, 3, and VLA band Q observations to find the best-fit parameters.
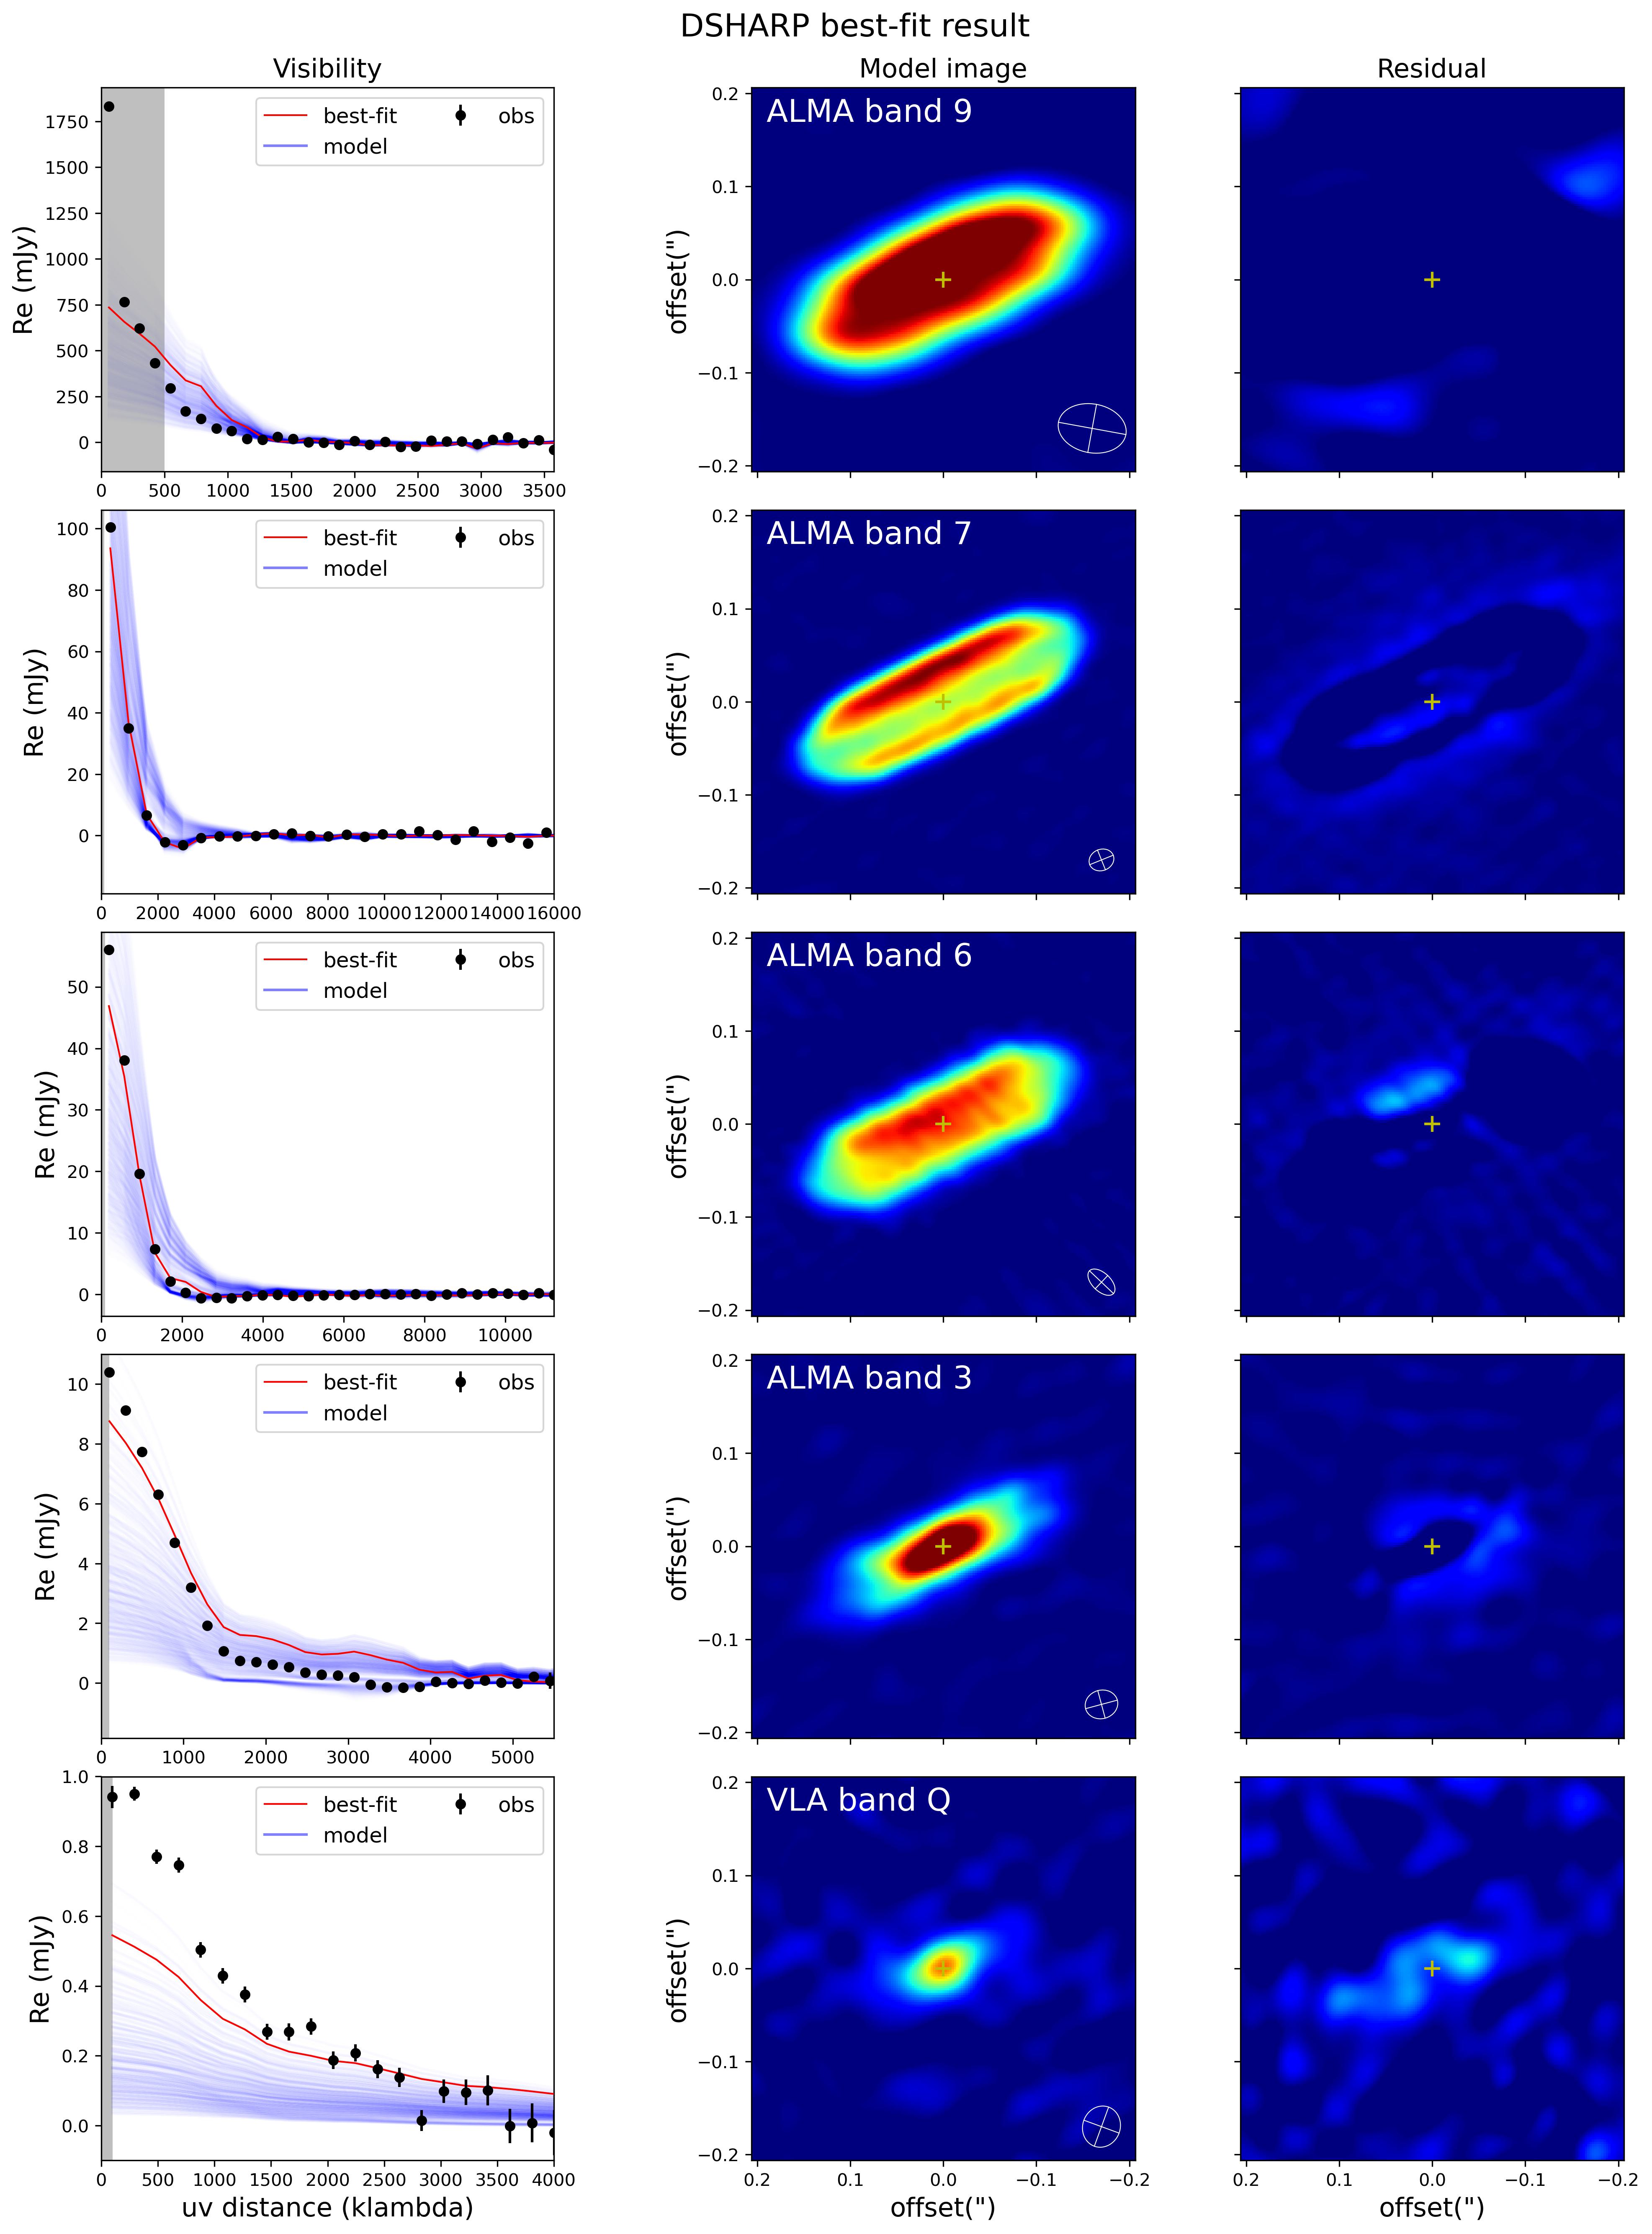
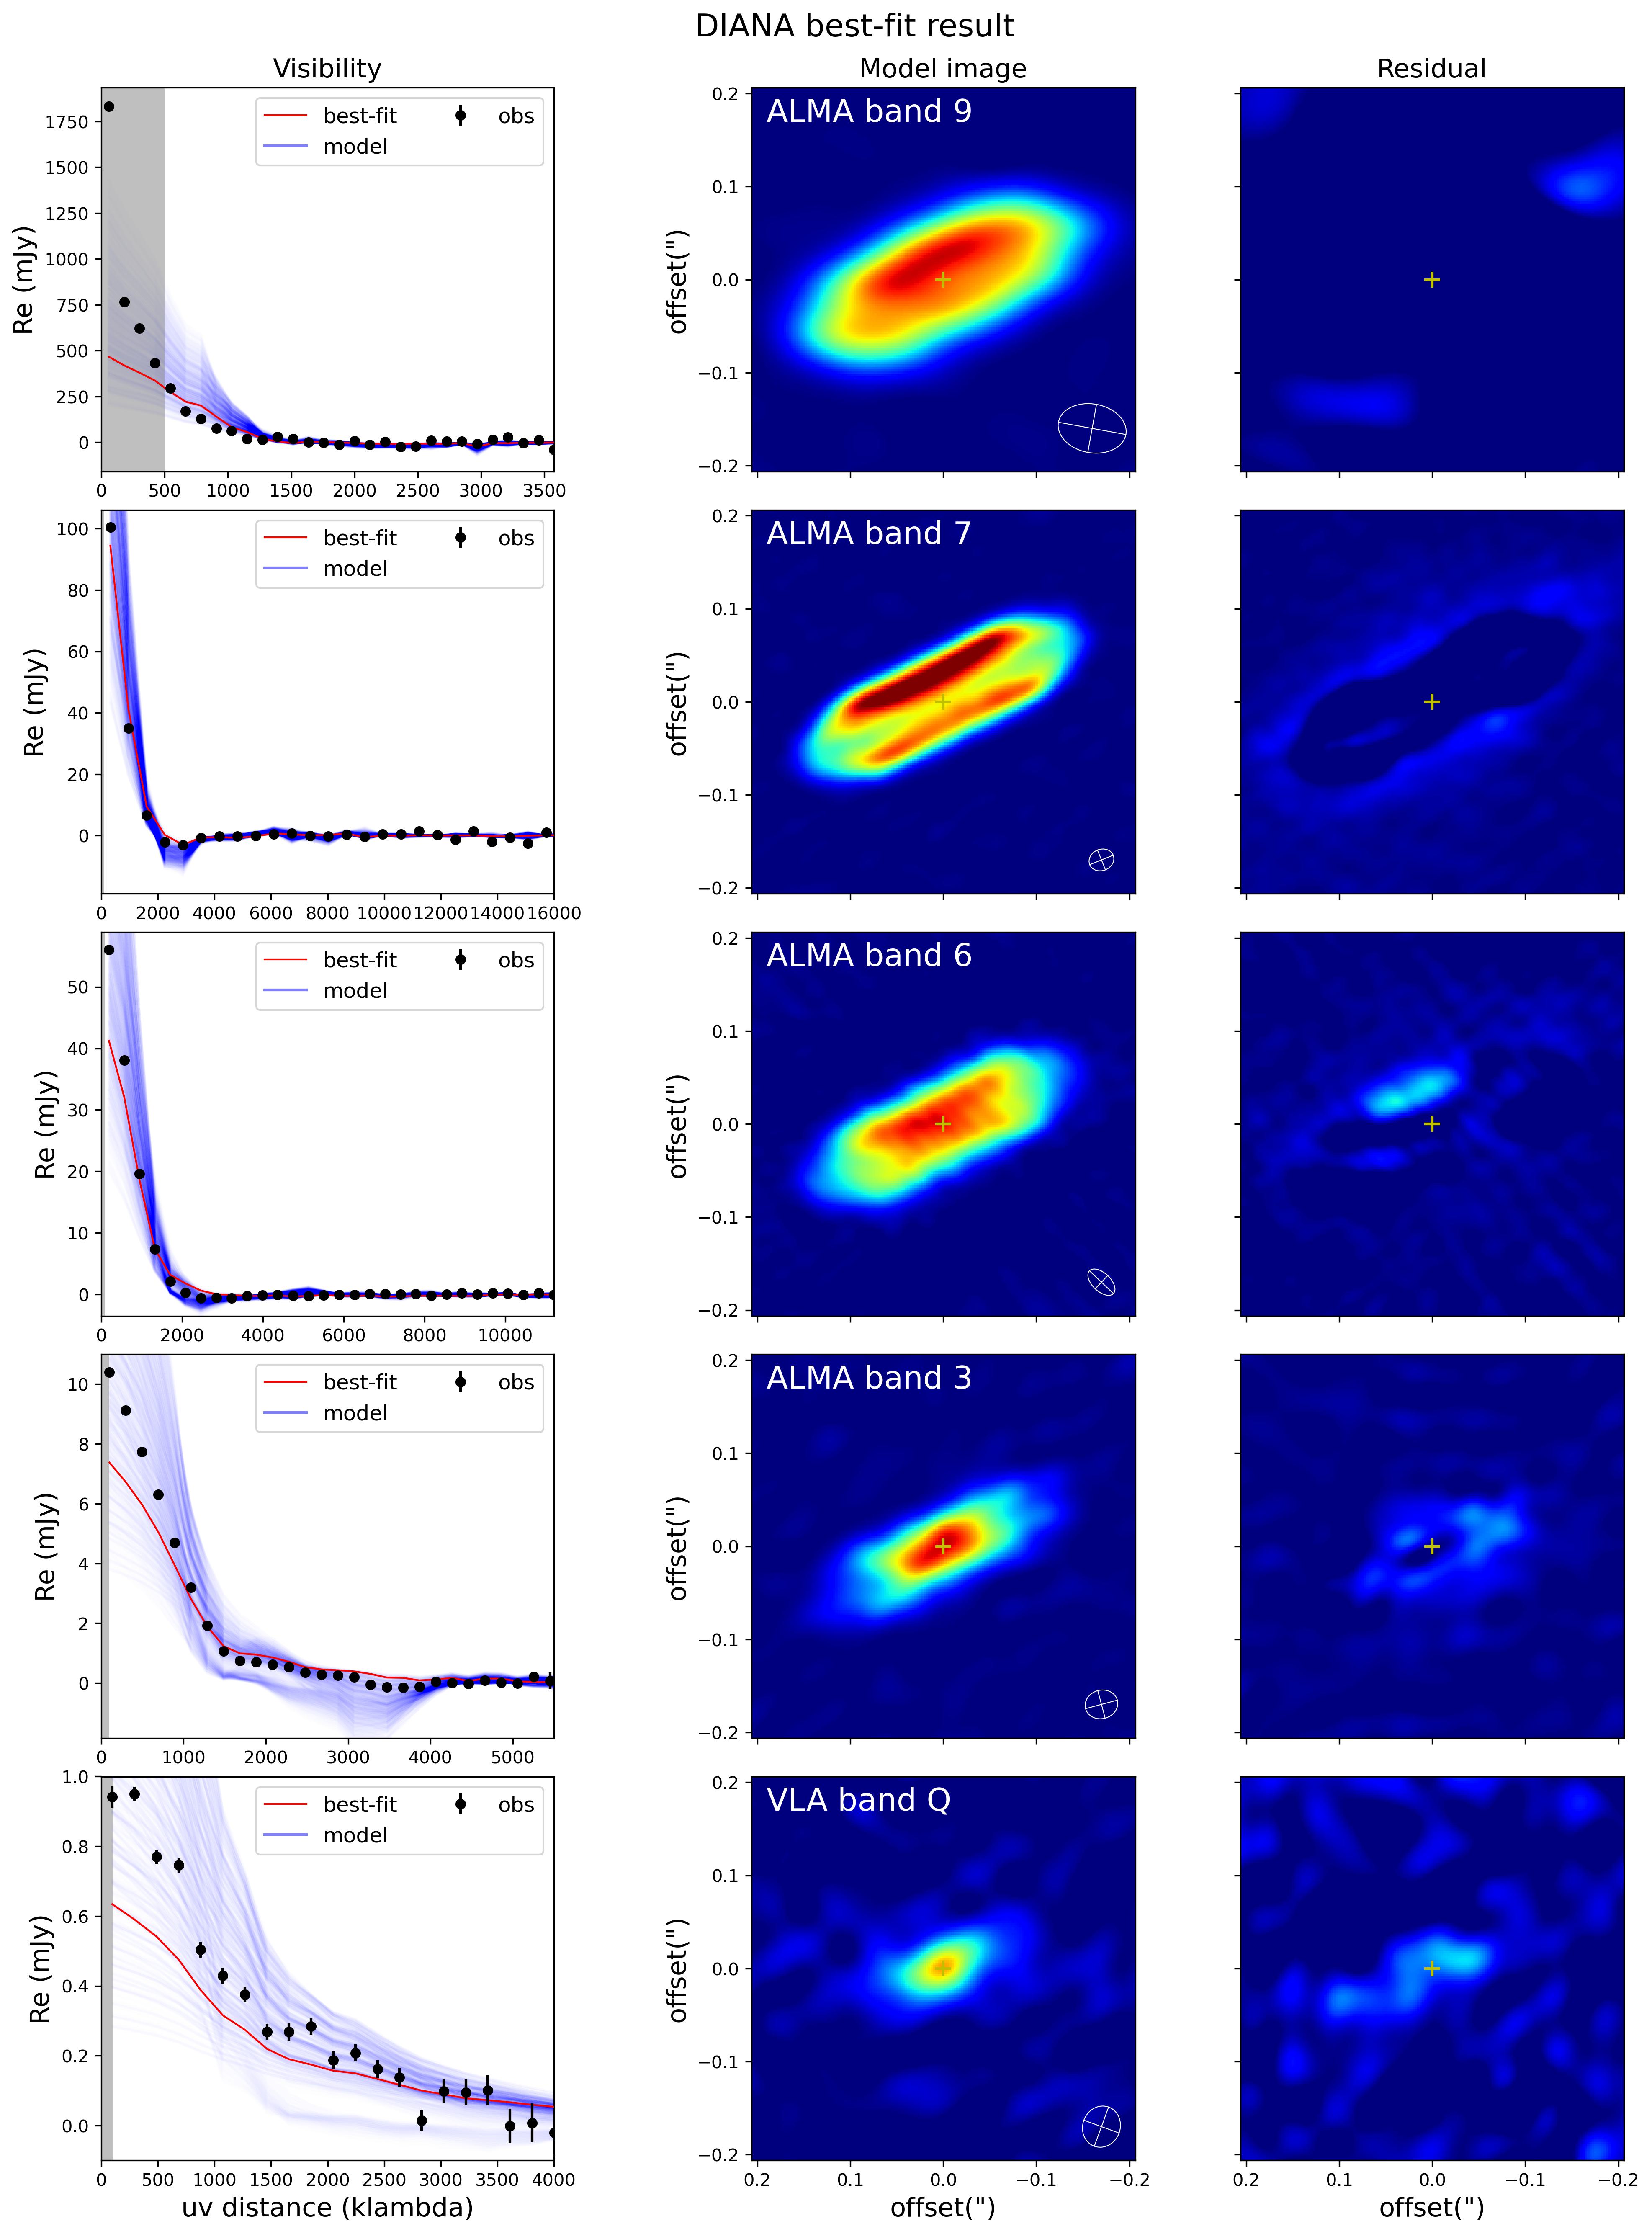
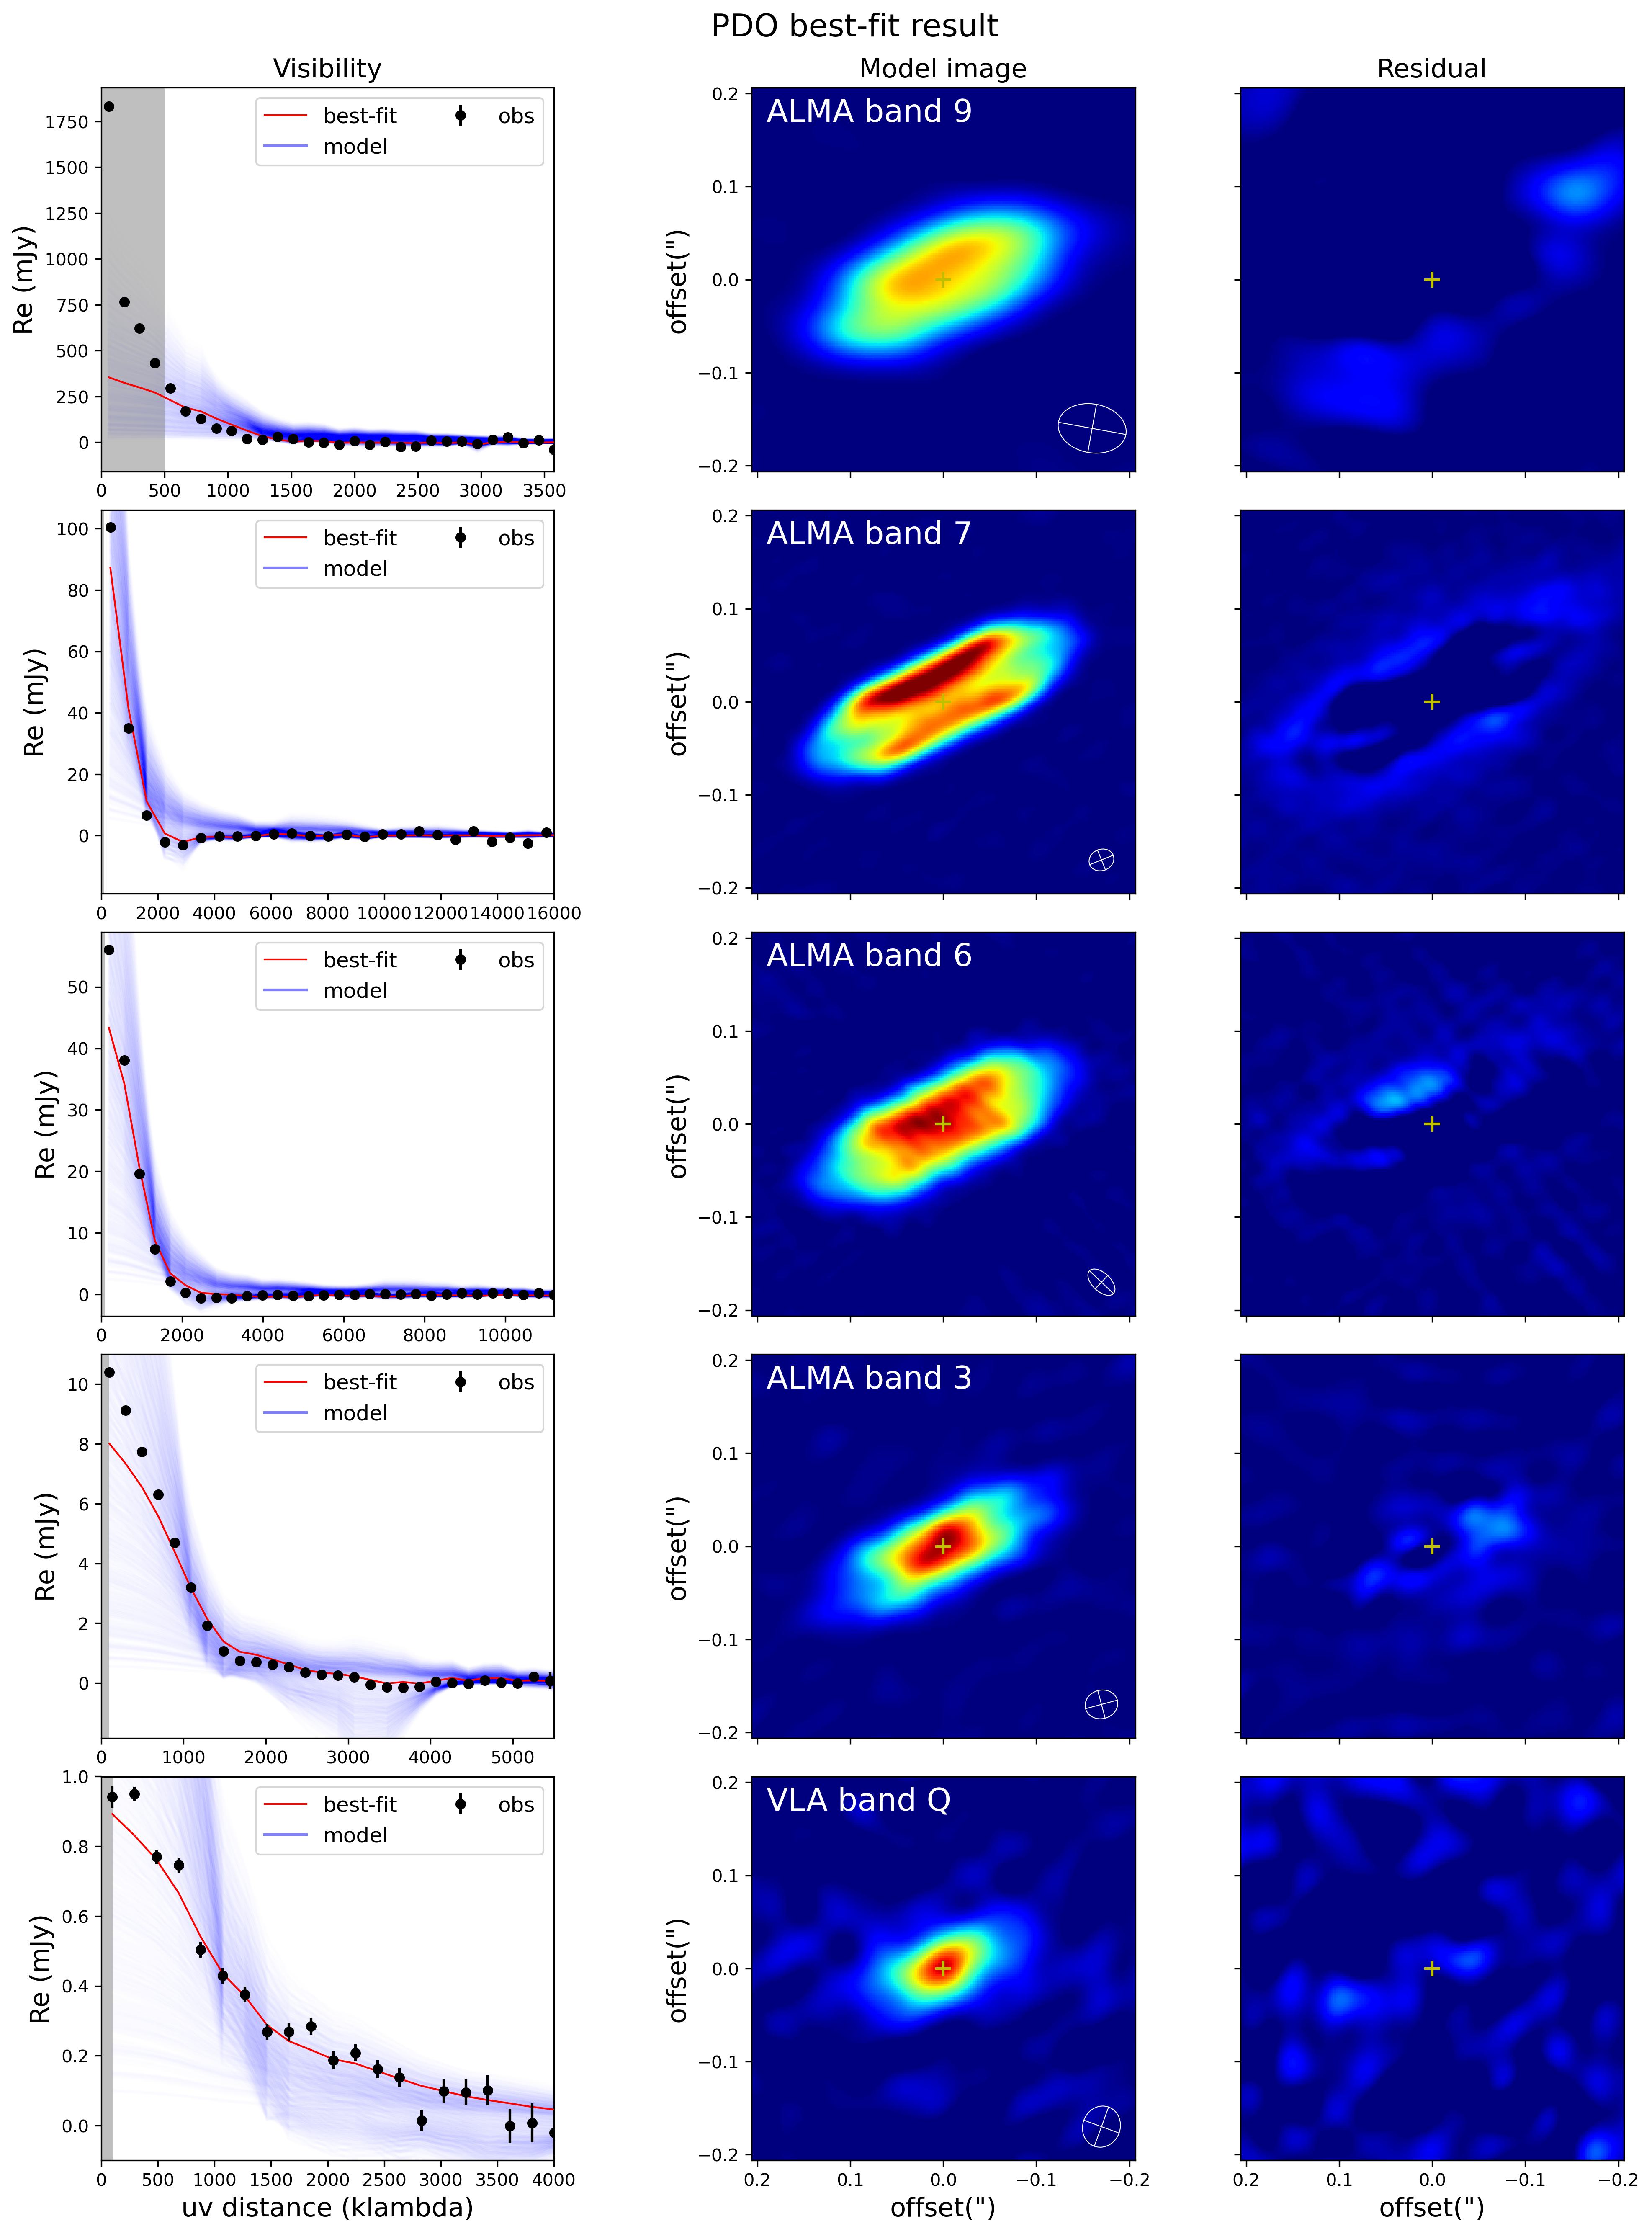
Table 3 shows the best-fit parameters and reduced chi-square of each dust model. The reduced chi-square of ALMA band 9 in each dust model is larger than other bands because of higher contamination from the envelope. The reduced chi-square of the PDO model shows a better fitting result than the other two models. This is because the PDO model directly sets opacity in each wavelength as a free parameter, while other dust models’ opacities are constrained by maximum grain size. Therefore, the PDO model is more flexible and can fit the observations better than the DSHARP and DIANA dust models.
Figure 5, 6, and 7 show the 1-D averaged visibilities, synthetic images of our best-fit models, and the residual maps between observation images and synthetic images for each dust opacity assumption from ALMA band 9 to VLA band Q. The best-fit of each dust model ranges from 30 to 40 au, consistent with au obtained in Lee et al. (2021a). Due to its high intrinsic opacity, the best-fit DIANA dust model requires a larger Toomre parameter =2 (lower density) than the best-fit DSHARP dust model and PDO model to reach a similar optical depth. Because of the high effective albedo , the higher than the other two models is derived from the best-fit DSHARP dust model to match the observed intensity.
For ALMA band 9, the best-fit synthetic images of the three dust models are quite different due to 3-4 times lower resolution and higher contamination from the envelope than other ALMA bands. For ALMA band 7, all three dust models reproduce the hamburger-like structure in the observation. The higher in the DSHARP dust model leads to a wider dark lane and lower peak intensity in its synthetic image than that in DIANA and PDO dust model due to the higher optical depth caused by scattering effects. For ALMA band 6, the synthetic image from the PDO model shows a higher intensity peak that more closely matches the observed image compared to the other two models. This is because the higher scattering in the DSHARP model and a larger absorption opacity in the DIANA dust model increase the optical depth, reducing the intensity in their synthetic images.
For ALMA band 3, the small effective albedo () in all three dust models suggests that the scattering effect is less significant than at shorter wavelengths. The intensity peak in the synthetic image from the PDO model lies between those of the other two models, providing a better match to the observed intensity. The reason is that the PDO model’s absorption opacity and optical depth are higher and lower than those in the DSHARP and DIANA dust models, respectively.
For VLA band Q, the intensity peak of the DSHARP model is lower than the observation due to the optically thin emission resulting from the low absorption opacity. The PDO model, with its smaller absorption opacity and optical depth than those from the DIANA model, produces a higher intensity that more closely matches the observation, outperforming the DIANA model in this regard. Overall, the synthetic images from the PDO model at ALMA band 7, 6, 3, and VLA band Q are more consistent with the observations (Figure 1) than those from the other two dust models.
5 Discussion
5.1 Opacity prescription
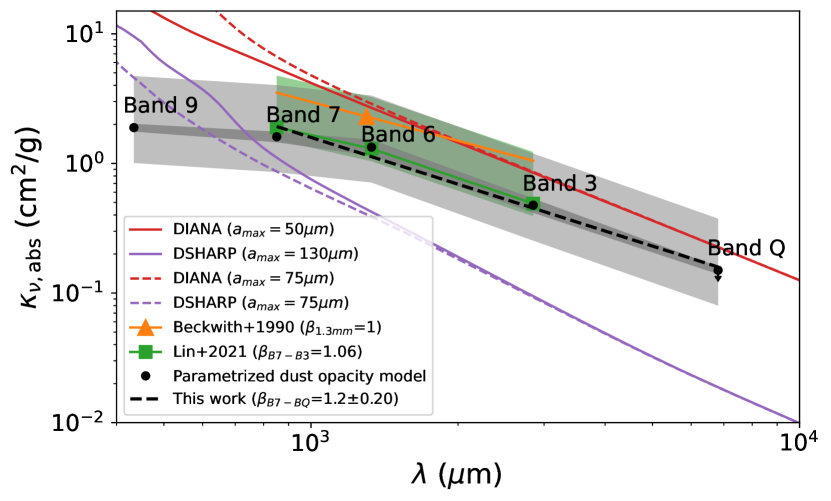
In this work, from ALMA band 7 to VLA band Q, the best-fit of the PDO model lie between those of the DSHARP dust model () and the DIANA dust model () (Figure 8). For at ALMA band 9, as mentioned in Section 4.1, it is hard to properly obtain the value of absorption opacity at this wavelength. Therefore, we do not include the ALMA band 9 in the estimation of the opacity spectral index . Ignoring ALMA band 9, the best-fit of the PDO model are closer to those of DIANA than those of DSHARP model with . Compared to Paper 1, the best-fit at ALMA Band 7 in the PDO model is approximately 20% smaller. Given that the PDO model has density and temperature profiles similar to those in Paper 1, the extinction optical depths for both models should be comparable. Therefore, the larger scattering optical depth in the PDO model at ALMA band 7 leads to smaller absorption optical depths and absorption opacity than those found in Paper 1.
The opacity spectral index of the best-fit PDO model is similar to that found in Paper 1. Paper 1 speculated that the low opacity spectral index could be caused by the fluffiness of the dust grains in this early disk (Wright, 1987). Recent studies of Class II disks also show the preference for dust grains with high porosity (e.g. HL Tau: Zhang et al. 2023, IM Lup: Ueda et al. 2024), suggestive of possible fractal structures of dust grains in Class 0/I disks. In this work, with the additional absorption opacity estimated from VLA band Q, the derived , which is more certain due to less optical depth effect at 6.8mm. We regard this value as the lower limit of opacity spectral index since the derived dust absorption opacity at VLA band Q is affected by up to 10% contamination from free-free emission. With more complete wavelength coverage than Paper 1, the updated opacity spectral index of 1.22 is between 1.7 and 1.0, suggesting a dust grain size between typical ISM (Draine, 2006) and mm-sized grains (Beckwith et al., 1990). Therefore, the dust in the HH 212 disk is likely in the process of grain growth.
The higher opacity spectral index for Class 0/I YSOs inferred by Galván-Madrid et al. (2018) through unresolved (sub)millimeter observations (spatial resolution 200 au at 340 GHz) could be due to high contamination of the inner envelope emission. Several (sub)millimeter studies also found the decreasing opacity spectral index from envelope to disk (Galametz et al., 2019; Cacciapuoti et al., 2023). Therefore, high-resolution multi-wavelength observations are necessary to separate disks and envelopes to investigate the opacity spectral index and dust grain growth in protostellar disks.
5.2 Albedo prescription
The best-fit dust effective albedos of the PDO model from ALMA band 9 to VLA band Q are shown in Figure 9, which gradually decrease from ALMA band 9 to VLA band Q. The peak of may locate at a wavelength equal to or smaller than ALMA band 9. We also plotted the best-fit from the DSHARP dust model and DIANA dust model for comparison.
The value of in DSHARP (best-fit) is 2-4 times higher than those from the best-fit PDO model between ALMA band 9 to band 3, resulting in a wider dark lane in the midplane at the ALMA band 7 synthetic image than other dust models (Figure 5). The value of in the DSHARP peaks between ALMA band 9 and band 7, as expected from the relationship (Kataoka et al., 2015). However, from the PDO model does not show a peak feature yet. Moreover, the decreasing of the PDO model from the wavelengths 434m to 6.8mm infers that the peak is shorter than ALMA band 9 and thus the maximum grain size is smaller than the maximum grain size of the best-fit DSHARP dust model. Therefore, we regard obtained from the best-fit DSHARP dust model as the upper limit of the grain size in the HH 212.
The values in the PDO model are larger than but not far from those of the best-fit DIANA dust model with . The peak of DIANA is expected to be located at and thus is smaller than ALMA band 9. The decreasing trend of from ALMA band 9 to VLA band Q are seen in both the PDO model and DIANA . However, the gradient between ALMA band 9 and 6 is steeper in the PDO model than DIANA , suggesting the PDO model may reach a peak sooner than DIANA model and thus has a maximum grain size larger than . Further observations with higher resolution at ALMA band 9 and even shorter wavelengths are necessary to confirm the peak of and constrain the dust grain size in the HH 212 disk.
In summary, by comparing the distribution of effective albedos, , under different dust assumptions, we can roughly constrain the upper limit of the dust grain size to . Furthermore, the values of the PDO model closely match those of the DSHARP and DIANA dust models, which is consistent with the inferred from the ALMA Band 7 polarization observations (Lee et al., 2021a). However, the values for the DSHARP and DIANA dust models differ significantly from those of the PDO model (Figure 8). This discrepancy suggests that the grain composition and porosity in this disk may differ from those assumed in the DSHARP and DIANA models.
6 Conclusion
We present the new VLA observations of Class 0 HH 212 disk at bands Q, K, and X. Through the RADMC3D radiative transfer calculation, we model the disk observations at ALMA Bands 9, 7, 6, and 3 as well as VLA band Q, and further investigate the dust properties of the HH 212 disk. Our analysis shows the following results:
-
1.
The low spectral index at the central region of the midplane suggests optically thick thermal emission at ALMA bands. The spectral index between VLA bands indicates the optically thick free-free emission dominates at centimeter wavelengths. Assuming a constant free-free emission at (sub)millimeter wavelengths, the upper limit of the free-free contaminations derived from VLA band X are smaller than 1% at ALMA bands but have the value of 9.38%, 15.16% and 54.66% at VLA band Q, Ka, and K, respectively.
-
2.
The best-fit absorption opacities of the PDO model between ALMA band 7 to VLA band Q lie between those from DSHARP and DIANA but are closer to the latter. The opacity spectral index obtained with a value of 1.2 is between 1.7 and 1.0, inferring a dust grain size between typical ISM (Draine, 2006) and mm-sized grains (Beckwith et al., 1990).
-
3.
The best-fit effective albedos between ALMA band 9 to VLA band Q also lie between those from DSHARP and DIANA . The gradually decreasing values with increasing wavelengths indicate that the grain size in this disk is not larger than . This upper limit of grain size is consistent with obtained from ALMA band 7 polarization observation.
This paper makes use of the following ALMA data: ADS/JAO.ALMA# 2012.1.00122.S, 2015.1.00024.S, 2017.1.00044.S, 2017.1.00712.S, and 2019.1.00037.S. ALMA is a partnership of ESO (representing its member states), NSF (USA) and NINS (Japan), together with NRC (Canada), NSTC and ASIAA (Taiwan), and KASI (Republic of Korea), in cooperation with the Republic of Chile. The Joint ALMA Observatory is operated by ESO, AUI/NRAO and NAOJ. The National Radio Astronomy Observatory is a facility of the National Science Foundation operated under cooperative agreement by Associated Universities, Inc. Y.-C.H. and C.-F.L. acknowledge grants from the National Science and Technology Council of Taiwan (110-2112-M-001-021-MY3 and 112-2112-M-001-039-MY3) and the Academia Sinica (Investigator Award AS-IA-108-M01). Z.Y.D.L. acknowledges support from NASA 80NSSCK1095, the Jefferson Scholars Foundation, the NRAO ALMA Student Observing Support (SOS) SOSPA8-003, the Achievements Rewards for College Scientists (ARCS) Foundation Washington Chapter, the Virginia Space Grant Consortium (VSGC), and UVA research computing (RIVANNA). Z.Y.L. is supported in part by NASA 80NSSC20K0533 and NSF AST- 2307199 and AST-1910106. J.J.T. acknowledges support from NASA XRP 80NSSC22K1159.
Appendix A Envelope contamination
To minimize the contamination by thermal emissions from the envelope in the fitting process, we overplot the 1D normalized visibility profiles from 430 m to 6.8 mm to determine the uv distances which are dominated by emissions from the central compact disk (Figure 10).
We fit 1D normalized visibility profiles of each wavelength to two Gaussian components. ALMA band 7, 6, 3 and VLA band Q show a compact disk component with () and an extended envelope component with (; similar to Figure 2 in Lee et al. 2008). Therefore, we regard data with uv distance as dominated by disk emission. The normalized profile of ALMA band 9 is more dominated by the extended envelope component than shorter wavelengths with (0.25”). As a result, we only use data with uv distance from ALMA band 9 in the fitting process in Section 3.3.
References
- Aso et al. (2021) Aso, Y., Kwon, W., Hirano, N., et al. 2021, ApJ, 920, 71, doi: 10.3847/1538-4357/ac15f3
- Bacciotti et al. (2018) Bacciotti, F., Girart, J. M., Padovani, M., et al. 2018, ApJ, 865, L12, doi: 10.3847/2041-8213/aadf87
- Beckwith et al. (1990) Beckwith, S. V. W., Sargent, A. I., Chini, R. S., & Guesten, R. 1990, AJ, 99, 924, doi: 10.1086/115385
- Birnstiel et al. (2018) Birnstiel, T., Dullemond, C. P., Zhu, Z., et al. 2018, ApJ, 869, L45, doi: 10.3847/2041-8213/aaf743
- Cacciapuoti et al. (2023) Cacciapuoti, L., Macias, E., Maury, A. J., et al. 2023, A&A, 676, A4, doi: 10.1051/0004-6361/202346204
- D’Alessio et al. (2001) D’Alessio, P., Calvet, N., & Hartmann, L. 2001, ApJ, 553, 321, doi: 10.1086/320655
- Dominik et al. (2021) Dominik, C., Min, M., & Tazaki, R. 2021, OpTool: Command-line driven tool for creating complex dust opacities, Astrophysics Source Code Library, record ascl:2104.010
- Draine (2003) Draine, B. T. 2003, ARA&A, 41, 241, doi: 10.1146/annurev.astro.41.011802.094840
- Draine (2006) —. 2006, ApJ, 636, 1114, doi: 10.1086/498130
- Draine & Lee (1984) Draine, B. T., & Lee, H. M. 1984, ApJ, 285, 89, doi: 10.1086/162480
- Dullemond et al. (2012) Dullemond, C. P., Juhasz, A., Pohl, A., et al. 2012, RADMC-3D: A multi-purpose radiative transfer tool, Astrophysics Source Code Library, record ascl:1202.015
- Galametz et al. (2019) Galametz, M., Maury, A. J., Valdivia, V., et al. 2019, A&A, 632, A5, doi: 10.1051/0004-6361/201936342
- Galván-Madrid et al. (2018) Galván-Madrid, R., Liu, H. B., Izquierdo, A. F., et al. 2018, ApJ, 868, 39, doi: 10.3847/1538-4357/aae779
- Han et al. (2023) Han, I., Kwon, W., Aso, Y., Bae, J., & Sheehan, P. 2023, ApJ, 956, 9, doi: 10.3847/1538-4357/acf853
- Harris et al. (2018) Harris, R. J., Cox, E. G., Looney, L. W., et al. 2018, ApJ, 861, 91, doi: 10.3847/1538-4357/aac6ec
- Henning & Stognienko (1996) Henning, T., & Stognienko, R. 1996, A&A, 311, 291
- Hull et al. (2018) Hull, C. L. H., Yang, H., Li, Z.-Y., et al. 2018, ApJ, 860, 82, doi: 10.3847/1538-4357/aabfeb
- Kataoka et al. (2016) Kataoka, A., Muto, T., Momose, M., Tsukagoshi, T., & Dullemond, C. P. 2016, ApJ, 820, 54, doi: 10.3847/0004-637X/820/1/54
- Kataoka et al. (2015) Kataoka, A., Muto, T., Momose, M., et al. 2015, ApJ, 809, 78, doi: 10.1088/0004-637X/809/1/78
- Lee et al. (2014) Lee, C.-F., Hirano, N., Zhang, Q., et al. 2014, ApJ, 786, 114, doi: 10.1088/0004-637X/786/2/114
- Lee et al. (2008) Lee, C.-F., Ho, P. T. P., Bourke, T. L., et al. 2008, ApJ, 685, 1026, doi: 10.1086/591177
- Lee et al. (2017a) Lee, C.-F., Ho, P. T. P., Li, Z.-Y., et al. 2017a, Nature Astronomy, 1, 0152, doi: 10.1038/s41550-017-0152
- Lee et al. (2023) Lee, C.-F., Jhan, K.-S., & Moraghan, A. 2023, ApJ, 951, L2, doi: 10.3847/2041-8213/acdbca
- Lee et al. (2018) Lee, C.-F., Li, Z.-Y., Ching, T.-C., Lai, S.-P., & Yang, H. 2018, ApJ, 854, 56, doi: 10.3847/1538-4357/aaa769
- Lee et al. (2017b) Lee, C.-F., Li, Z.-Y., Ho, P. T. P., et al. 2017b, Science Advances, 3, e1602935, doi: 10.1126/sciadv.1602935
- Lee et al. (2017c) —. 2017c, ApJ, 843, 27, doi: 10.3847/1538-4357/aa7757
- Lee et al. (2021a) Lee, C.-F., Li, Z.-Y., Yang, H., et al. 2021a, ApJ, 910, 75, doi: 10.3847/1538-4357/abe53a
- Lee et al. (2021b) Lee, C.-F., Tabone, B., Cabrit, S., et al. 2021b, ApJ, 907, L41, doi: 10.3847/2041-8213/abda38
- Li & Draine (2001) Li, A., & Draine, B. T. 2001, ApJ, 554, 778, doi: 10.1086/323147
- Li et al. (2017) Li, J. I.-H., Liu, H. B., Hasegawa, Y., & Hirano, N. 2017, ApJ, 840, 72, doi: 10.3847/1538-4357/aa6f04
- Lin et al. (2021) Lin, Z.-Y. D., Lee, C.-F., Li, Z.-Y., Tobin, J. J., & Turner, N. J. 2021, MNRAS, 501, 1316, doi: 10.1093/mnras/staa3685
- Lin et al. (2023) Lin, Z.-Y. D., Li, Z.-Y., Tobin, J. J., et al. 2023, ApJ, 951, 9, doi: 10.3847/1538-4357/acd5c9
- Liu (2019) Liu, H. B. 2019, ApJ, 877, L22, doi: 10.3847/2041-8213/ab1f8e
- Liu et al. (2024) Liu, Y., Takahashi, S., Machida, M., et al. 2024, ApJ, 963, 104, doi: 10.3847/1538-4357/ad182d
- Mathis et al. (1977) Mathis, J. S., Rumpl, W., & Nordsieck, K. H. 1977, ApJ, 217, 425, doi: 10.1086/155591
- McMullin et al. (2007) McMullin, J. P., Waters, B., Schiebel, D., Young, W., & Golap, K. 2007, in Astronomical Society of the Pacific Conference Series, Vol. 376, Astronomical Data Analysis Software and Systems XVI, ed. R. A. Shaw, F. Hill, & D. J. Bell, 127
- Nakatani et al. (2020) Nakatani, R., Liu, H. B., Ohashi, S., et al. 2020, ApJ, 895, L2, doi: 10.3847/2041-8213/ab8eaa
- Ohashi et al. (2022) Ohashi, S., Nakatani, R., Liu, H. B., et al. 2022, ApJ, 934, 163, doi: 10.3847/1538-4357/ac794e
- Ricci et al. (2010) Ricci, L., Testi, L., Natta, A., et al. 2010, A&A, 512, A15, doi: 10.1051/0004-6361/200913403
- Sadavoy et al. (2018) Sadavoy, S. I., Myers, P. C., Stephens, I. W., et al. 2018, ApJ, 859, 165, doi: 10.3847/1538-4357/aac21a
- Santamaría-Miranda et al. (2024) Santamaría-Miranda, A., de Gregorio-Monsalvo, I., Ohashi, N., et al. 2024, Astronomy & Astrophysics, 690, A46
- Sheehan et al. (2022) Sheehan, P. D., Tobin, J. J., Li, Z.-Y., et al. 2022, ApJ, 934, 95, doi: 10.3847/1538-4357/ac7a3b
- Stephens et al. (2014) Stephens, I. W., Looney, L. W., Kwon, W., et al. 2014, Nature, 514, 597, doi: 10.1038/nature13850
- Takakuwa et al. (2024) Takakuwa, S., Saigo, K., Kido, M., et al. 2024, ApJ, 964, 24, doi: 10.3847/1538-4357/ad1f57
- Tazzari et al. (2018) Tazzari, M., Beaujean, F., & Testi, L. 2018, MNRAS, 476, 4527, doi: 10.1093/mnras/sty409
- Tobin et al. (2020) Tobin, J. J., Sheehan, P. D., Megeath, S. T., et al. 2020, ApJ, 890, 130, doi: 10.3847/1538-4357/ab6f64
- Toomre (1964) Toomre, A. 1964, ApJ, 139, 1217, doi: 10.1086/147861
- Tychoniec et al. (2018) Tychoniec, Ł., Tobin, J. J., Karska, A., et al. 2018, ApJS, 238, 19, doi: 10.3847/1538-4365/aaceae
- Tychoniec et al. (2020) Tychoniec, Ł., Manara, C. F., Rosotti, G. P., et al. 2020, A&A, 640, A19, doi: 10.1051/0004-6361/202037851
- Ueda et al. (2024) Ueda, T., Tazaki, R., Okuzumi, S., Flock, M., & Sudarshan, P. 2024, Nature Astronomy, 8, 1148, doi: 10.1038/s41550-024-02308-6
- Villenave et al. (2023) Villenave, M., Podio, L., Duchêne, G., et al. 2023, ApJ, 946, 70, doi: 10.3847/1538-4357/acb92e
- Warren & Brandt (2008) Warren, S. G., & Brandt, R. E. 2008, Journal of Geophysical Research (Atmospheres), 113, D14220, doi: 10.1029/2007JD009744
- Woitke et al. (2016) Woitke, P., Min, M., Pinte, C., et al. 2016, A&A, 586, A103, doi: 10.1051/0004-6361/201526538
- Wright (1987) Wright, E. L. 1987, ApJ, 320, 818, doi: 10.1086/165597
- Xu (2022) Xu, W. 2022, ApJ, 934, 156, doi: 10.3847/1538-4357/ac7b94
- Xu & Armitage (2023) Xu, W., & Armitage, P. J. 2023, ApJ, 946, 94, doi: 10.3847/1538-4357/acb7e5
- Xu & Kunz (2021) Xu, W., & Kunz, M. W. 2021, MNRAS, 508, 2142, doi: 10.1093/mnras/stab2715
- Yamato et al. (2023) Yamato, Y., Aikawa, Y., Ohashi, N., et al. 2023, ApJ, 951, 11, doi: 10.3847/1538-4357/accd71
- Yang et al. (2024) Yang, H., Fernández-López, M., Li, Z.-Y., et al. 2024, ApJ, 963, 134, doi: 10.3847/1538-4357/ad2346
- Yang et al. (2016) Yang, H., Li, Z.-Y., Looney, L., & Stephens, I. 2016, MNRAS, 456, 2794, doi: 10.1093/mnras/stv2633
- Zamponi et al. (2024) Zamponi, J., Maureira, M. J., Liu, H. B., et al. 2024, A&A, 682, A56, doi: 10.1051/0004-6361/202244628
- Zhang et al. (2023) Zhang, S., Zhu, Z., Ueda, T., et al. 2023, ApJ, 953, 96, doi: 10.3847/1538-4357/acdb4e
- Zhu et al. (2019) Zhu, Z., Zhang, S., Jiang, Y.-F., et al. 2019, ApJ, 877, L18, doi: 10.3847/2041-8213/ab1f8c