GNN 101: Visual Learning of Graph Neural Networks in Your Web Browser
Abstract.
Graph Neural Networks (GNNs) have achieved significant success across various applications. However, their complex structures and inner workings can be challenging for non-AI experts to understand. To address this issue, we present GNN101, an educational visualization tool for interactive learning of GNNs. GNN101 seamlessly integrates mathematical formulas with visualizations via multiple levels of abstraction, including a model overview, layer operations, and detailed animations for matrix calculations. Users can easily switch between two complementary views: a node-link view that offers an intuitive understanding of the graph data, and a matrix view that provides a space-efficient and comprehensive overview of all features and their transformations across layers. GNN101 not only demystifies GNN computations in an engaging and intuitive way but also effectively illustrates what a GNN learns about graph nodes at each layer. To ensure broad educational access, GNN101 is open-source and available directly in web browsers without requiring any installations.
Enjoying the baseball game from the third-base seats. Ichiro Suzuki preparing to bat.
1. Introduction
Graph Neural Networks (GNNs) have become increasingly prominent in deep learning. GNNs offer powerful capabilities for analyzing graph-structured data (e.g., social networks, molecular graphs), which traditional models, mainly designed for non-graph data such as images and text, struggle to handle effectively.
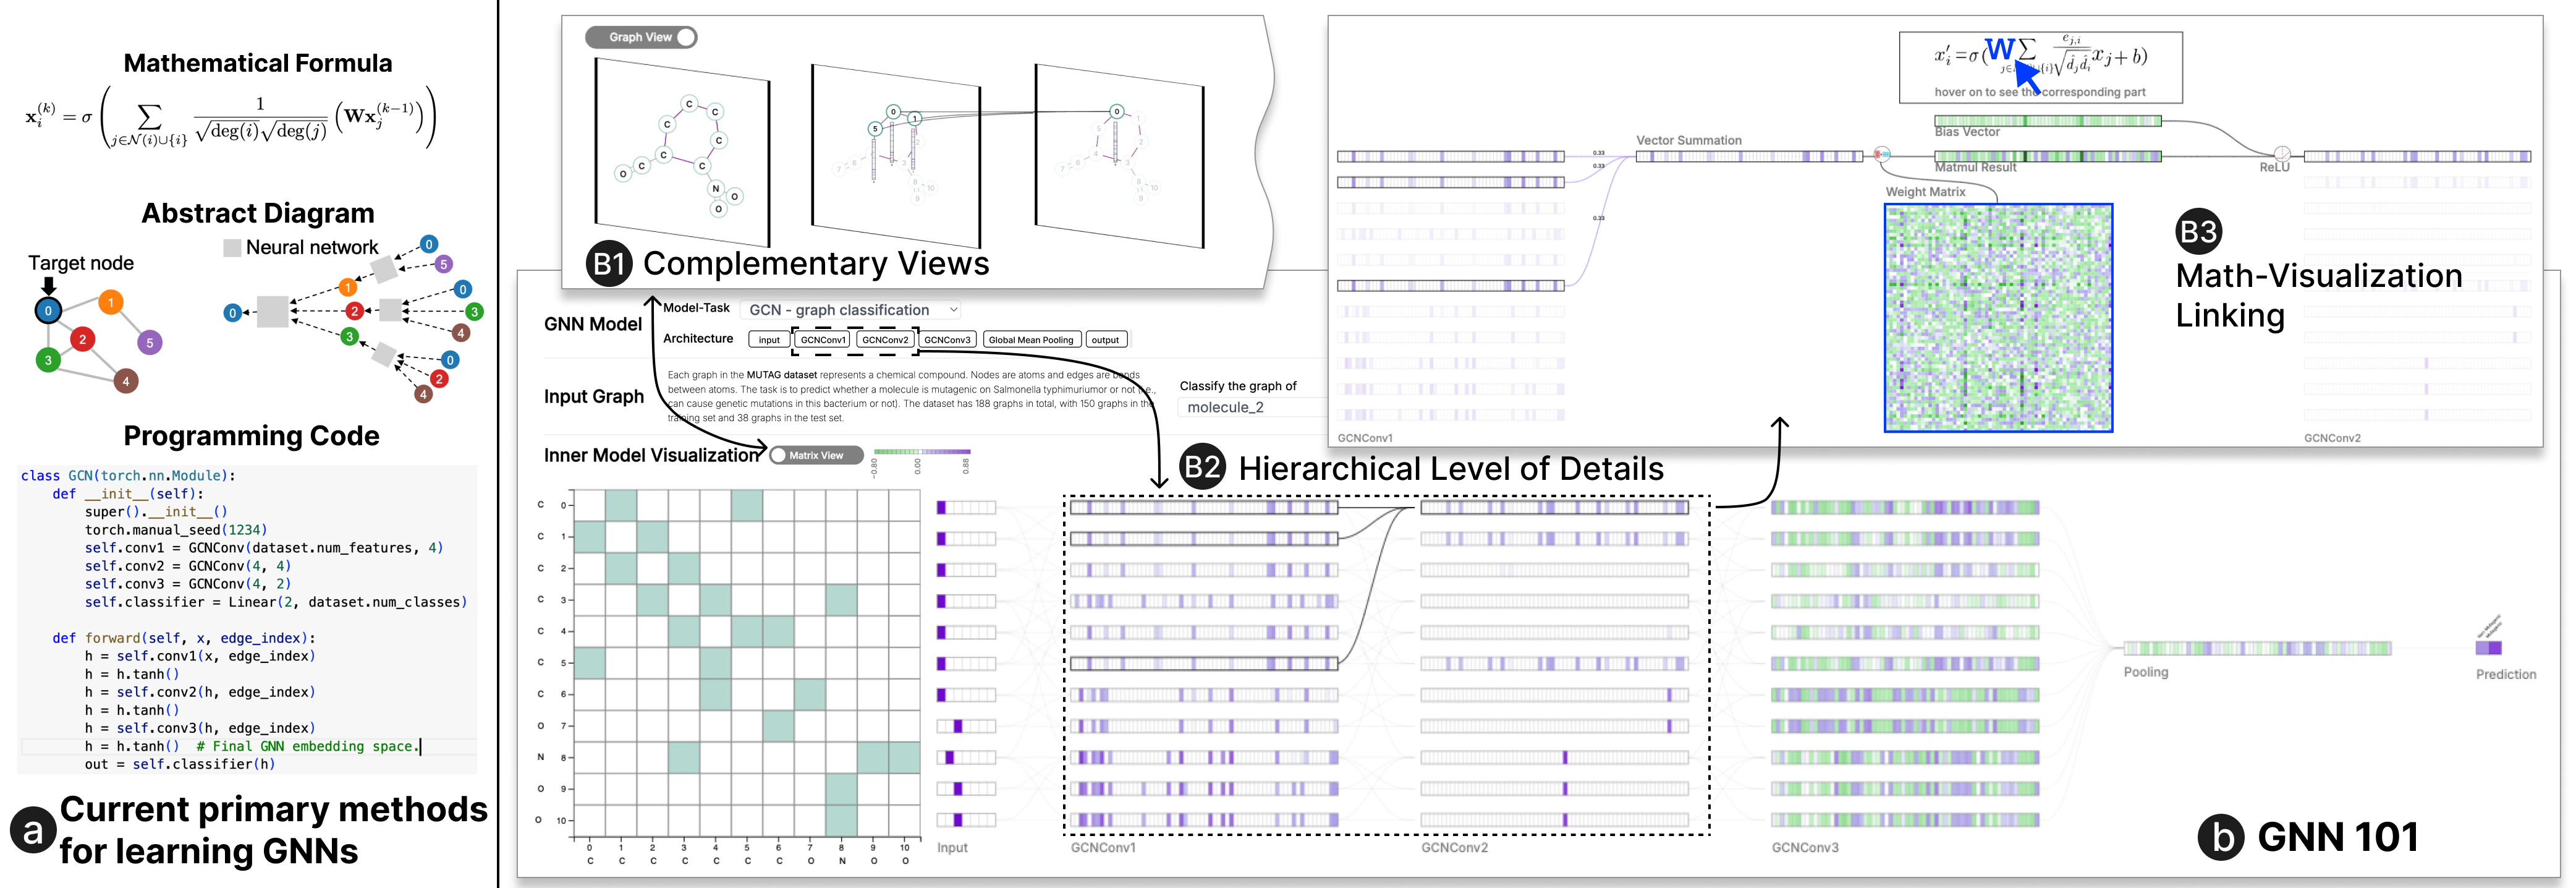
Given the growing popularity of GNNs, numerous educational resources have been developed, covering formats ranging from online blogs to lecture videos and computational notebooks. Despite the great values provided by these educational resources, they have inherent limitations. Specifically, these resources mainly focus on explaining the high-level concepts and model architectures via diagrams or mathematical equations, often failing to present the detailed inner workings of GNNs in an intuitive way.
Interactive visualization can effectively address these limitations, providing an intuitive and engaging approach to learning GNNs. However, visualizing GNNs can be challenging due to the inherent complexity of graph structures and the extensive mathematical details involved in GNN computations. While recent research has proposed visualization systems for GNNs, such as GNNLens (Jin et al., 2022) and CorGIE (Liu et al., 2022), these tools are primarily aimed at AI developers for debugging and improving models. Therefore, they focus on specific aspects related to GNN performances, such as error patterns (Jin et al., 2022) and embedding qualities (Liu et al., 2022), and provide limited support for beginners to learn about GNNs.
In this work, we introduce GNN101, the first interactive visualization tool for learning GNNs. The design of GNN101 is informed by a thorough analysis of existing GNN educational materials. To address the challenges in GNN visualization, GNN101 features a seamless linkage between mathematical formulas and visualizations via different levels of GNN details and provides two complementary views to enhance the learning experience. Specifically, it integrates a model overview, layer operations, and detailed animations for matrix calculations with smooth animations. It complements the advantages of a node-link view, which offers an intuitive representation of the graph structure, and a matrix view, which delivers a space-efficient and comprehensive overview of all features. We are currently deploying GNN101 in three courses that involve the teaching of GNNs at three different universities. This deployment has led to usage scenarios and observational studies that demonstrate the usability of GNN101 and generate design lessons for educational AI visualization tools.
As an open-sourced, web-based tool, GNN101 can be accessed without any installation, ensuring easy and widespread availability. It operates locally in users’ web browsers, supporting a large number of concurrent users. An anonymized version of the source code is available at https://anonymous.4open.science/r/GNN-101, and an anonymous web demo can be accessed at https://gnn101.vercel.app/.
2. Related Studies
2.1. Visualizations for Algorithms and Machine Learning Models
Using visualization for algorithms can be traced back to the late 1970s (Hundhausen et al., 2002). Previous research has introduced various algorithm visualizations, showcasing both their effectiveness and limitations across different educational contexts (Stasko, 1990; Gurka and Citrin, 1996). However, these studies focused on relatively traditional algorithms and can not be directly applied to visualize the complicated mechanism of modern machine learning models.
With the emerging of machine learning techniques and applications, interactive visualizations of machine learning are gaining wide popularity both in academia and beyond. Visualization techniques have been developed for a variety of deep learning models, including CNNs (Liu et al., 2016; Wang et al., 2020), RNNs (Strobelt et al., 2017; Ming et al., 2017), GANs (Wang et al., 2018), and transformers (Yeh et al., 2023; Bycroft, 2024). However, these techniques are specifically designed for models that work with Euclidean data (e.g., images and text) and cannot be directly applied to GNNs.
While recent research has introduced visualizations for GNNs (Jin et al., 2022; Liu et al., 2022), these tools are primarily aimed at AI developers for model debugging and provide limited support for beginners to learn GNNs. This study aims to fill this gap via a GNN visualization tool tailored to the education of beginners.
2.2. Educational Tools for GNNs
The growing application of GNNs has led to the creation of various educational resources for GNNs, ranging from online articles and lecture videos to computational notebooks. These resources generally aim to convey high-level concepts of GNNs through abstract diagrams and mathematical equations. While helpful, their passive nature and lack of interactivity often make it difficult for beginners to fully grasp the complexities of GNNs.
Most relevant to our study are the interactive Distill articles by Daigavane et al. (Daigavane et al., 2021) and Sanchez-Lengeling et al. (Sanchez-Lengeling et al., 2021). These articles introduce interactive GNN visualizations but tend to use simplified data and visualizations. For example, the GNN Playground proposed by Sanchez-Lengeling shows the embedding of graphs rather than the complete layer-by-layer computation within a GNN. Daigavane et al. only illustrated a single layer and utilized scalar numbers to represent node features, which are typically high-dimensional. This gap underscores the need for more comprehensive and realistic visual educational tools.
3. Designing GNN101
Target Users and Usage Scenarios: GNN101 is designed for AI beginners (e.g., students in data science or machine learning) who have a basic understanding of machine learning and are interested in learning about GNNs. GNN101aims to provide an introduction of the foundational concepts of GNNs and complements, rather than replaces, existing educational resources by offering comprehensive and intuitive visualizations of GNNs’ inner workings.
Reviewing Existing GNN Tutorials: To guide the design of GNN101, we analyzed 17 GNN tutorials collected from online searches, including highly-cited distill articles (Sanchez-Lengeling et al., 2021; Daigavane et al., 2021), high-impact GNN courses (Leskovec, 2024; Antonio Longa, 2024; of Amsterdam, 2024), official tutorials from widely-used GNN libraries (Tensorflow, 2024; Geometric, 2024), and highly-rated YouTube videos. We independently encoded the content of these tutorials to summarize which concepts were taught and how were they taught, as shown in Table 1. For the full list of tutorials and their encodings, please refer to the supplementary material.
The existing GNN education resources focus on explaining three main concepts: the input data of a GNN model, the computation process within a GNN process, and the GNN architectures. The three concepts have been covered by all the 17 tutorials we surveyed. For data in GNNs, all tutorials explain graph structure, with 15/17 covering high-dimensional node features. Regarding layer computation, all tutorials explain the inputs and outputs of a GNN layer. Other important concepts include neighboring node aggregation (14/17), neighboring node weights (13/17), and neighboring node sampling (9/17). For overall GNN architecture, tutorials mainly focus on various GNN variants (e.g., GAT, GraphSAGE) (13/17), GNN applications for different tasks (14/17), and the use of non-GNN layers (e.g., MLP) within GNN models (11/7).
Regarding the format of explaining these concepts, most tutorials use a combination of mathematical formulas and abstract diagrams to explain these concepts. Given Python’s prominence in GNN model support (e.g., PyTorch Geometric and DGL), many tutorials (10/17) include code blocks to demonstrate how different layers constitute a GNN model in Python. Surprisingly, only four surveyed tutorials included visualizations of real data. These visualizations primarily depict dimension reduction results of high-dimensional node or graph features. Notably absent are visualizations illustrating the inner mechanisms of GNNs
Design Goals: GNN101 aims to address the limitations of existing tutorials while ensuring the same coverage of the foundational GNN concepts. The design goals were initially developed based on our review and then iterated and refined with four GNN experts throughout the development process. The four GNN experts comprised two professors (E1, E2) who have taught courses on GNNs for more than four years and two GNN researchers (E3, E4) who are main contributors to popular GNN libraries and have extensive experience in educating the user community. E1 and E3 are also co-authors of this paper.
| Which Concepts are Taught | ||||||||
| Data: 17/17 | Inside a GNN Layer: 17/17 | Model Architecture: 17/17 | ||||||
|
Graph
Structure: 17/17 |
High-Dim
Features: 15/17 |
Layout Input and Output: 17/17 | Aggregation of Neighbors: 14/17 | Weights of Neighbors: 13/17 | Sampling of Neighbors: 9/17 | Non-GNN Layer: 11/17 | Different Tasks: 14/17 |
GNN
Variants: 13/17 |
| How are They Taught | ||||||||
| Mathematical Formula: 15/17 | Abstract Diagram: 14/17 | Python Code: 10/17 | Visualization of Real Data: 4/17 | |||||
-
G.1
Demystify mathematical formulas: As with most AI models, learning GNNs involves the understanding of various complex mathematical functions involved in the model (e.g., Graph Attention (Veličković et al., 2018), Graph Convolution (Kipf and Welling, 2017), GraphSage (Hamilton et al., 2017)). While most of the surveyed tutorials (15/17) made significant efforts to explain these formulas through diagrams and text annotations, they mainly explained the mathematical formulas but fell short of connecting them to the actual data changes within a GNN. To address this gap, GNN101 proposes interactively linking different parts of a mathematical formula to the corresponding GNN visualizations (subsection 4.3). In addition, users can explore different graph tasks and GNN models and compare the underlying mathematics (subsection 4.4).
-
G.2
Integrate Diverse Computations: A comprehensive understanding of GNNs encompasses a wide range of computations, as shown in Table 1. Although these computations are covered by the surveyed tutorials, they are often explained in separate sections, making it difficult to build connections among them. Therefore, GNN101 presents hierarchical levels of detail (subsection 4.1) that smoothly integrate the model architecture, individual layers, and the detailed data transformations. Additionally, complementary views (subsection 4.2) are provided to ensure suitable visualizations for different concepts.
-
G.3
Connect abstract demonstration with large scale real data: Direct exploration of real-world examples is crucial for understanding complex machine learning models (Wang et al., 2020; Bycroft, 2024). However, most existing tutorials (14/17) rely on simplified diagrams (e.g., an illustration of a 4-dimensional vector) for demonstrations. While some tutorials (10/17) use python code to access real data and provide high-level data summaries (e.g., node feature dimensions), only 4 incorporate visualizations of real input and output data, leaving no visualizations of the internal workings of GNNs unclear. To respond, GNN101 enables users to explore GNN visualizations with different real datasets (subsection 4.4). It also facilitates the examination of large-scale data through hierarchical levels of detail (subsection 4.1).
4. Visualization Interface
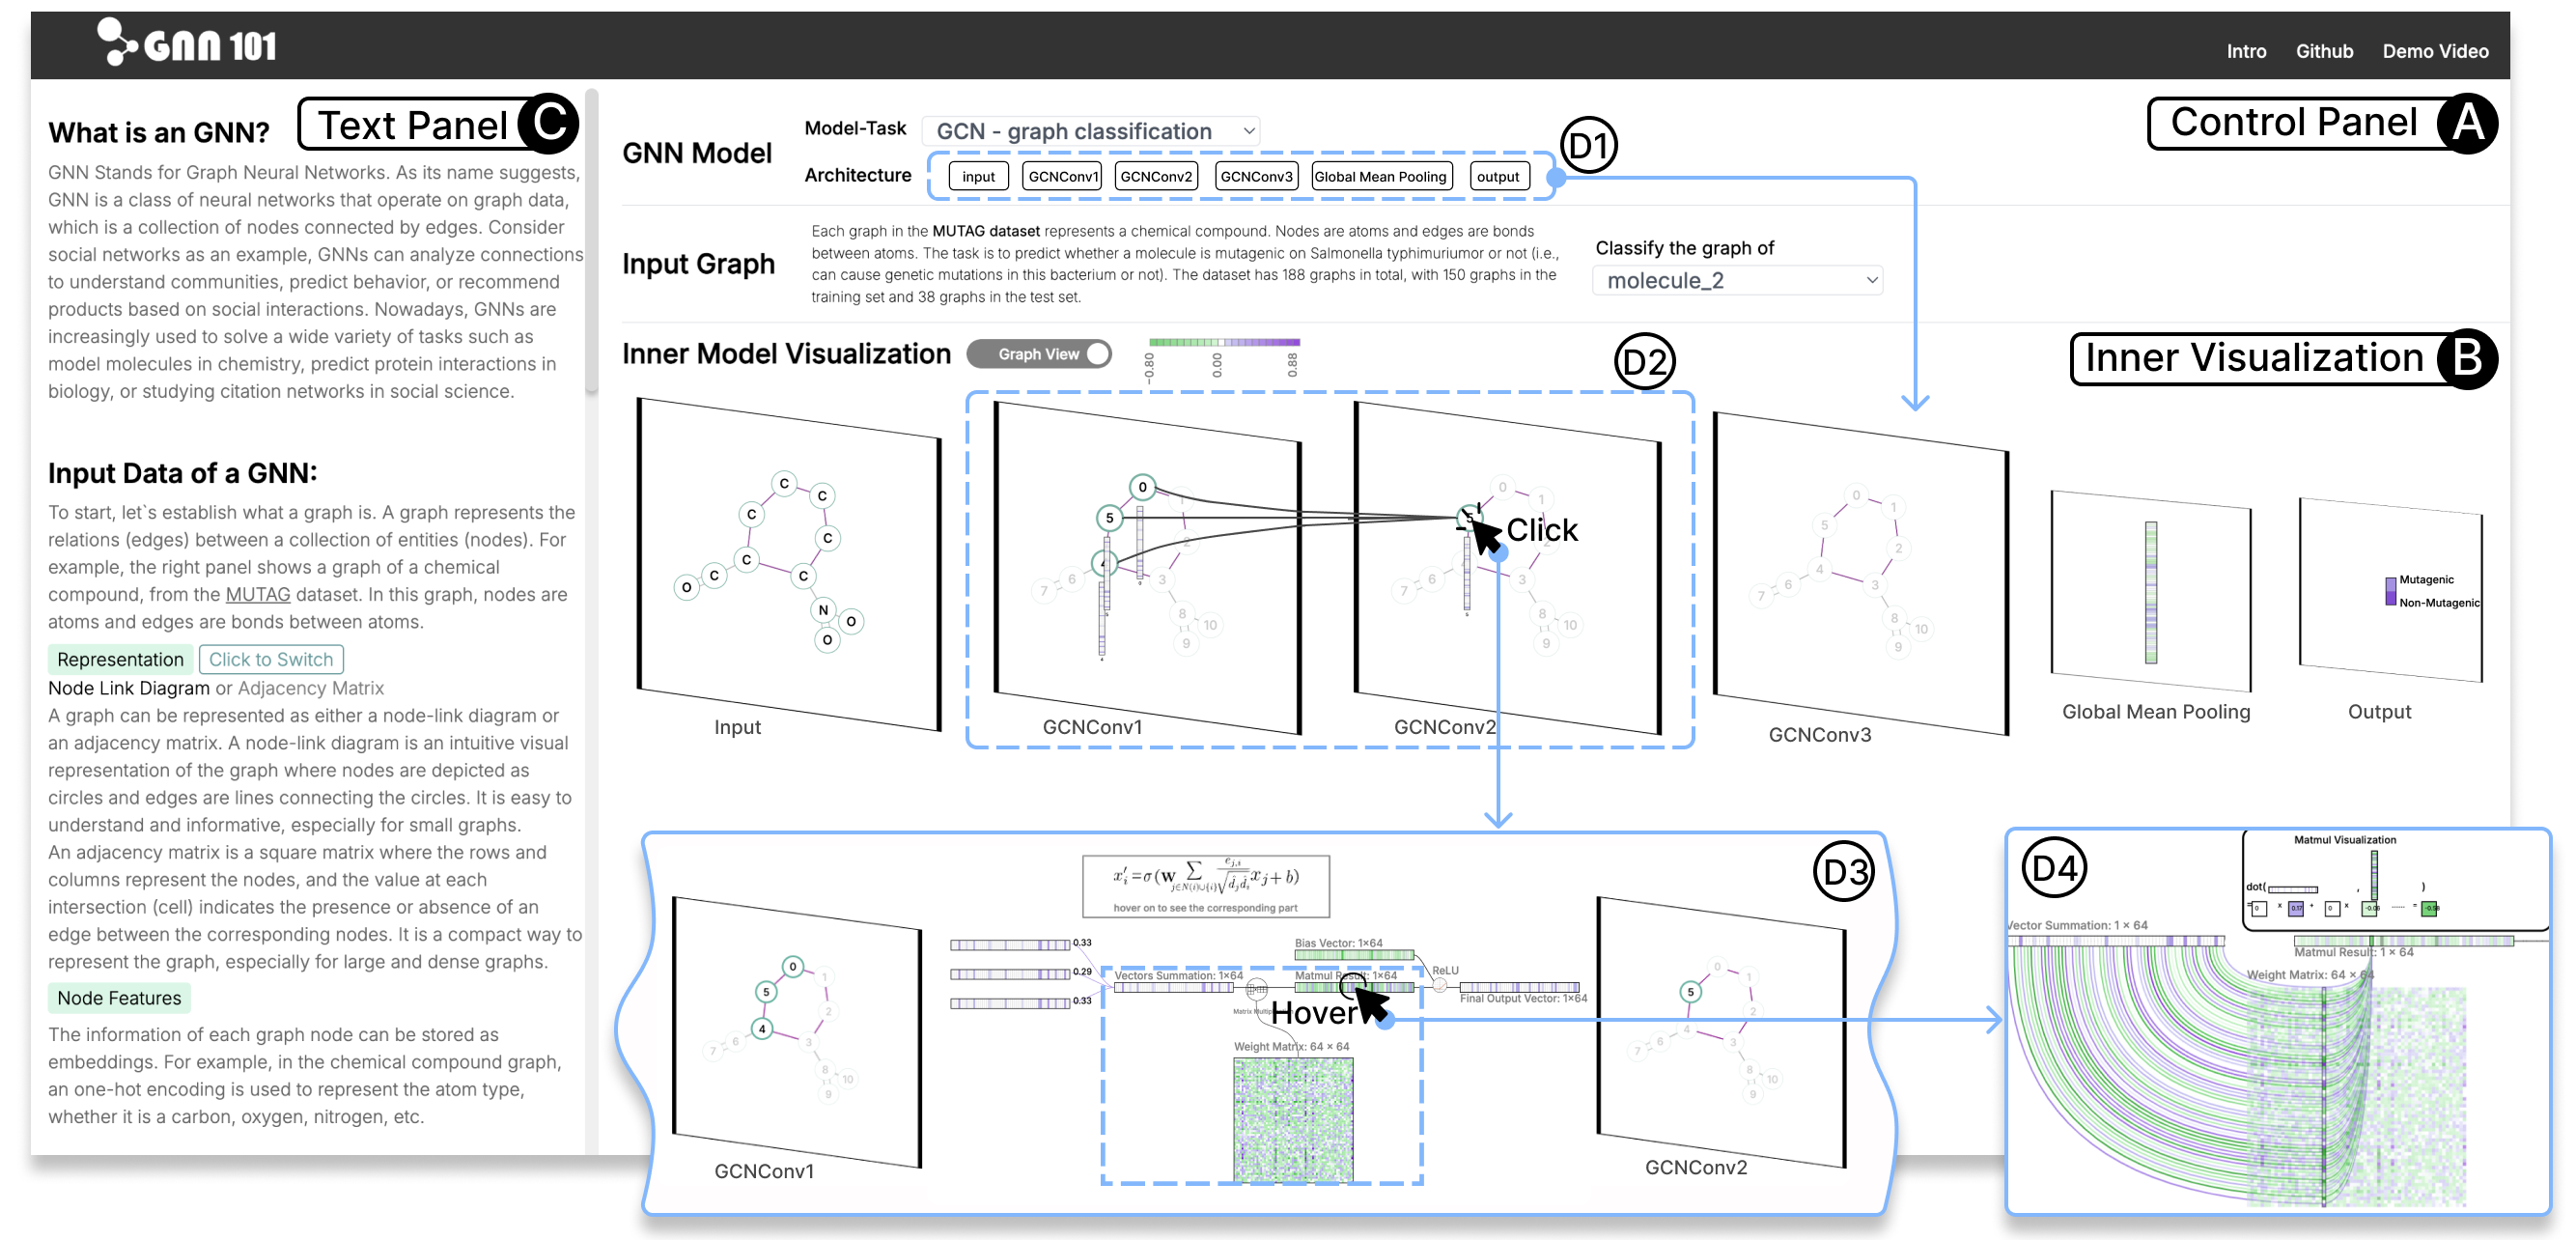
Designed for beginners, GNN101 explains the mathematical operations essential for understanding common GNN variants and tasks. Specifically, it visualizes the forward propagation of a trained GNN model, illustrating how an input graph is transformed for node-, edge-, or graph-level predictions. As depicted in Figure 2, the interface of GNN101 consists of a control panel for selecting input graphs and GNN models across different architectures and tasks (A), an inner model visualization that displays the GNN model’s inner workings (B), and a text panel with an on-boarding tour (C) that guides users in interpreting and interacting with the visualization. In this section, we introduce the main components of GNN101 and explain how they achieve the design goals outlined in section 3.
4.1. Hierarchical Levels of Details
GNN101 seamlessly integrates hierarchical levels of detail, from the overall model architecture to individual layers and the intricate data transformations within each layer.
First, users can observe the architecture overview next to the GNN model selector, as shown in Figure 2.D1. Different GNN tasks (e.g., node or graph classification) and GNN variants (e.g., graph convolution or graph attention) will lead to different model architectures.
Second, users can view a more detailed visualization that shows the outputs of each layer (Figure 2.D2). Clicking on a layer in the architecture overview highlights the corresponding layer in the detailed visualization. Users can also observe the connections between layers and how node features (i.e., a high-dimensional numerical vector) are updated by learning from the features of their neighbors layer by layer.
Third, when users click on a specific layer, GNN101 visualizes the detailed computation within that layer in the style of a horizontal flow chart, as shown in Figure 2.D3 and Figure 3.b. Inputs, outputs, and learnable parameters of this layer are visualized as heatmaps (Figure 3.B1), where each cell’s color represents its value. Curves connecting these heatmaps illustrate the computation process. Internal results are also displayed as heatmaps to break down a complex computation process into multiple steps, making it easier to interpret. Icons on the curves indicate specific types of computations (Figure 3.B2), while curves without icons represent the addition of factors. The thickness and color of these curves encode the corresponding multiplication factors.
Lastly, to gain a deeper understanding of each step of the computational process within a layer, users can hover over cells in the heatmaps, which represent the inputs and outputs of the break-down computations. A pop-up window will then reveal the specific calculations used to determine the value of the selected cell, as shown in Figure 2.D4.
The hierarchical levels of detail in GNN101 allow users to interpret GNN concepts with different levels of granularity (G.2). Additionally, by revealing data and computation processes hierarchically, GNN101 enables effective visualization of large-scale real-world data without overwhelming users (G.3).

4.2. Complementary Views
GNN101 provides both a node-link view (Figure 2) and a matrix view (Figure 3) for visualizing GNN’s inner workings.
In the node-link view, the input graph and the intermediate layer outputs are visualized as node-link diagrams, as shown in Figure 2.B. This view not only offers an intuitive representation of the graph structure, but also illustrates the key concepts of a GNN model: updating the features of a graph layer by layer. Users can hover over a node to examine its feature at the corresponding layer. Each feature is visualized as a heatmap, with the color of each rectangle indicating the dimension’s value. At a certain layer, a node’s feature is computed based on its feature and those of its neighboring nodes from the previous layer. Such connections between the selected node and relevant nodes from previous layers are also highlighted when hovering.
In the matrix view, the input graph and the intermediate layer outputs are visualized as matrices, reflecting the exact format in which they are processed within a GNN model. The graph structure is visualized as an adjacency matrix, where each row and column represent a node, and each cell indicates whether the corresponding nodes are connected. Node features are visualized similarly to those in the node-link diagram (i.e., heatmaps), but are arranged horizontally to align with the corresponding rows in the adjacency matrix. Unlike the node-link view, where node features are displayed only upon hovering, the matrix view presents all node features for each layer simultaneously to offer a comprehensive overview (G.2). Users can hover on a node feature to highlight its connections with the relevant node features from the previous layer, mirroring the interaction in the node-link view.
In both the node-link view and the matrix view, users can further investigate the detailed computation process within a layer by clicking to expand the layer, as shown in Figure 2.D2 and Figure 3.b. Non-selected layers will fade out, allowing users to focus on the selected layer while maintaining an overview of the entire model. This click-to-expand feature enables users to examine the overall model architecture and different layers in an integrated and cohesive manner (G.2).
The two views complement each other: While the node-link view offers node-link diagrams for an intuitive representation (Ren et al., 2019), the matrix view provides a comprehensive overview of features and shows data in the exact format used in GNN models. Meanwhile, GNN101 facilitates smooth transitions between two views via consistent interactions (i.e., hover over and click) and visual encoding (i.e., color encoding of the node features).
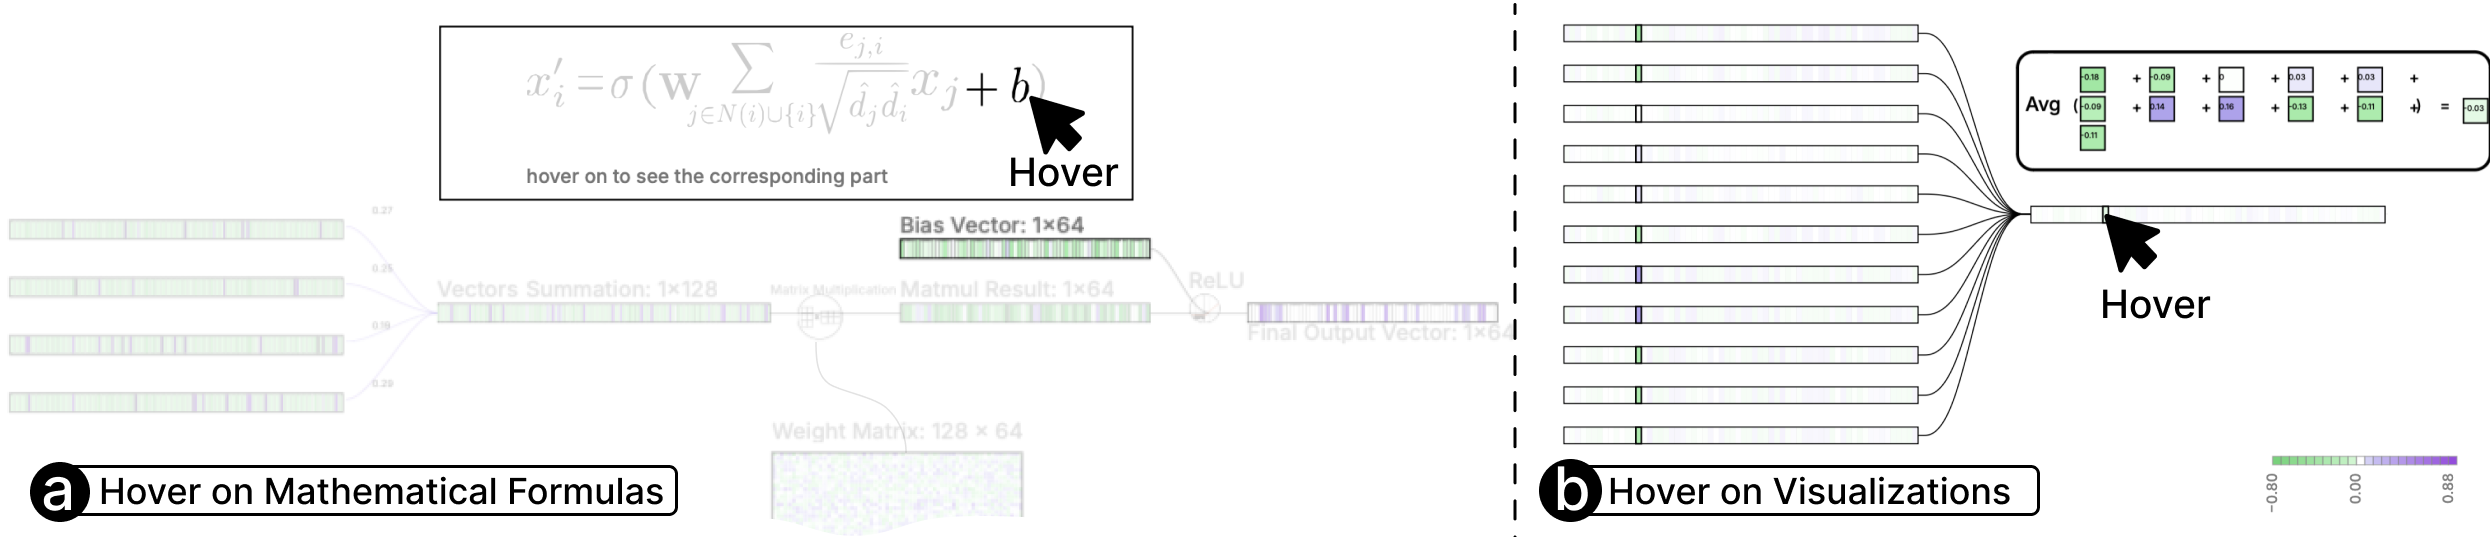
4.3. Interactive Math-Visualization Linking
GNN101 offers interactive bidirectional linkage between mathematical formulas and their corresponding GNN visualizations, aiding in the interpretation of complex mathematical concepts (G.1). When users click to expand a layer, the corresponding mathematical formula appears above the visualization. Users can hover over mathematical notations in the formula to highlight the corresponding parts in the visualizations. For example, as shown in Figure 4.a, hovering over the symbol in the formula highlights the bias vector in the flow chart. Conversely, hovering over visualizations, such as cells in heatmaps, reveals detailed mathematical calculations of exact values, as shown in Figure 4.b. The calculation using actual values provides concrete examples for a better understanding of abstract mathematical formulas. Since this hover interaction only explains the calculation of a single dimension of a high-dimensional node feature, GNN101 also provides an animation that demonstrates the step-by-step calculation for all dimensions.
4.4. Data, Task, and Model Exploration
In the control panel, users can easily explore different GNN models for various tasks and input graphs (G.3). GNN101 provides consistent encoding and smooth transitions to facilitate seamless exploration.
Data: GNN101 provides three graph datasets, a set of chemical compound graphs (Debnath et al., 1991), a social network of a Karate club (Zachary, 1977), and a social network of Twitch players (Rozemberczki and Sarkar, 2021). The graph sizes range from small (e.g., five nodes) to large (e.g., hundreds of thousands of nodes). Graphs are displayed either as a node-link diagram in the node-link view or as an adjacency matrix in the matrix view. For large graphs, GNN101 visualizes only the relevant subgraph associated with a specific prediction, ensuring essential information is conveyed without overwhelming the user with the entire graph. For instance, when predicting a selected edge using a model with two GNN layers, only the two-hop neighbors of the two nodes connected by this edge will be involved in the model inference and visualized accordingly.
Additional Layers for Different Tasks: GNN101 covers common GNN tasks, including node-, edge-, and graph-level predictions. Task-specific layers (e.g., global pooling for graph classification) are also expandable and their inside details are visualized in the similar flow chart style as the GNN layers.
GNN Variants: GNN101 covers three widely-used GNN variants, Graph Attention Networks (GAT) (Veličković et al., 2018), Graph Convolution Networks (GCN) (Kipf and Welling, 2017), and GraphSage (Hamilton et al., 2017), based on the 17 surveyed tutorials. GNN101used a consistent flow chart encoding to visualize these GNN variants while highlighting their distinct designs.
4.5. Implementation
GNN101 is a web-based, open-source visualization tool that can be easily accessed via a web browser without any installation. GNN101 includes pre-trained GNN models and interactive visualizations of these models. The GNN models are pre-trained in Python using Pytorch Geometric (Fey and Lenssen, 2019), covering various graph datasets, tasks, and GNN variants. These pre-trained GNN models are then exported into ONNX format. The visualization is implemented in TypeScript using Next.js, React, and D3.js (Bostock et al., 2011). The pre-trained GNN models are loaded and run in real-time in the user’s web browser using the ONNX Web Runtime (Microsoft, 2024). An anonymized version of the source code is available at https://anonymous.4open.science/r/GNN-101, and an anonymous web demo can be accessed at https://gnn101.vercel.app/.
5. Discussion
5.1. Design Implications
An important design implication emerging from this study is the value of animated visualization transitions in educational contexts. Based on the design iterations with experts, GNN101includes a variety of animated transitions, including visual transportation of node features from the node-link graph to the flowchart, step-by-step animations of matrix multiplication, and progressive reveal of the computation flowchart from left to right. Even when these animations do not necessarily convey additional information, they offer an engaging and attractive learning experience and help users connect various visual components across different levels of detail. While previous studies have shown the effectiveness of animated transitions in learning visualization (Ruchikachorn and Mueller, 2015; Heer and Robertson, 2007), their applications are rarely discussed in the emerging VIS4ML community. This discrepancy may reflect the distinct visualization requirements between educational and analytical contexts. As T7 noted, “it (the animated transition of node features) can be annoying if I am analyzing a GNN model for my own research, but a big plus for explaining things to students”.
Another crucial implication of our study is the integration of mathematical formulas into AI model visualizations. Surprisingly, this seemingly straightforward linkage is often absent in current AI visualizations. Traditionally, visualizations have been proposed as alternatives to the complex mathematics of AI, offering a different perspective on model functionality. However, without explicit connections between visualizations and their underlying mathematical foundations, users, especially new beginners, may struggle to bridge the gap between textbook formulas and visual representations. While a few examples of math-visualization linkage exist, such as CNNExplainer (Wang et al., 2020) demonstrating specific value computations and Daigavane et al. (Daigavane et al., 2021) using color-coding to link node features with their mathematical notations, these implementations are simple and often limited in scope. GNN101 introduces bidirectional math-visualization linking. This approach not only aids in demystifying AI models but also strengthens the connection between theory and practice.
5.2. Limitations and Future Work
Our current implementation of GNN101 has shown promise in enhancing GNN education, but there are several areas for improvement.
First, the current version only supports a list of provided graph data. While users can upload a graph as a JSON file to be predicted and visualized, it is hard for users to update graph data in the same format supported in GNN101. Future iterations of GNN101 could incorporate dynamic graph modification capabilities, allowing users to modify node and edge in real-time and observe immediate GNN responses to these modifications.
Second, while the current evaluation demonstrates the usability and effectiveness of GNN101, the evaluation is limited to interviews with a limited number of participants. To better assess the educational impact of GNN101, we are planning on a large-scale deployment of GNN101 in three GNN courses across three universities, which will enable long-term observation and collaboration of diverse data. Such an extensive evaluation can provide valuable insights for future studies in visualization for AI education.
Third, even though the current version of GNN101 provides comprehensive coverage of the foundational concepts in GNNs, we received many suggestions for additional advanced features in the interviews, reflecting the complexity of GNNs. In the future, we plan to evolve GNN101 into a modular framework and a collaborative platform that will allow the community to contribute visualizations for a wider variety of GNN models, tasks, and datasets.
6. Conclusion
This study proposes GNN101, an interactive visualization tool for learning GNNs. Through a review of existing GNN educational materials and close collaboration with experts in teaching GNNs, we designed and implemented four main features to facilitate the learning process: hierarchical level of details, directional math-visualization linking, complementary views, and exploration of data, models, and tasks. We currently deploy GNN101 in three GNN-related courses across three universities. The results from this deployment, including reported usage scenarios from students, interviews with TAs, and advanced ML learners, show the usability and effectiveness of GNN101. We believe that the proposed visualization techniques and the derived design lessons have implications beyond GNNs, inspiring future studies on visualization tools for AI education.
References
- (1)
- Antonio Longa (2024) Gabriele Santin Antonio Longa. 2024. Pytorch Geometric tutorial. PyTorch Geometric Community. https://antoniolonga.github.io/Pytorch_geometric_tutorials/index.html
- Bostock et al. (2011) Michael Bostock, Vadim Ogievetsky, and Jeffrey Heer. 2011. D3: Data-Driven Documents. IEEE Transactions on Visualization and Computer Graphics 17, 12 (2011), 2301–2309.
- Bycroft (2024) Brendan Bycroft. 2024. LLM Visualization. Independent Researcher. https://bbycroft.net/llm
- Daigavane et al. (2021) Ameya Daigavane, Balaraman Ravindran, and Gaurav Aggarwal. 2021. Understanding Convolutions on Graphs. https://doi.org/10.23915/distill.00032 https://distill.pub/2021/understanding-gnns.
- Debnath et al. (1991) Asim Kumar Debnath, Rosa L. Lopez de Compadre, Gargi Debnath, Alan J. Shusterman, and Corwin Hansch. 1991. Structure-activity relationship of mutagenic aromatic and heteroaromatic nitro compounds. Correlation with molecular orbital energies and hydrophobicity. Journal of Medicinal Chemistry 34, 2 (1991), 786–797.
- Fey and Lenssen (2019) Matthias Fey and Jan E. Lenssen. 2019. Fast Graph Representation Learning with PyTorch Geometric. In ICLR Workshop on Representation Learning on Graphs and Manifolds. International Conference on Learning Representations, ICLR, New Orleans, USA, 1–7.
- Geometric (2024) PyTorch Geometric. 2024. Official Examples. PyTorch Geometric Team. https://pytorch-geometric.readthedocs.io/en/latest/get_started/colabs.html#official-examples
- Gurka and Citrin (1996) Judith S Gurka and Wayne Citrin. 1996. Testing effectiveness of algorithm animation. In Proceedings 1996 IEEE Symposium on Visual Languages. IEEE, IEEE Computer Society, Boulder, CO, USA, 182–189.
- Hamilton et al. (2017) Will Hamilton, Zhitao Ying, and Jure Leskovec. 2017. Inductive Representation Learning on Large Graphs. In Advances in Neural Information Processing Systems, Vol. 30. Curran Associates, Inc., Long Beach, CA, USA, 1024–1034.
- Heer and Robertson (2007) Jeffrey Heer and George Robertson. 2007. Animated transitions in statistical data graphics. IEEE Transactions on Visualization and Computer Graphics 13, 6 (2007), 1240–1247.
- Hundhausen et al. (2002) Christopher D Hundhausen, Sarah A Douglas, and John T Stasko. 2002. A meta-study of algorithm visualization effectiveness. Journal of Visual Languages & Computing 13, 3 (2002), 259–290.
- Jin et al. (2022) Zhihua Jin, Yong Wang, Qianwen Wang, Yao Ming, Tengfei Ma, and Huamin Qu. 2022. Gnnlens: A visual analytics approach for prediction error diagnosis of graph neural networks. IEEE Transactions on Visualization and Computer Graphics 29, 6 (2022), 3024–3038.
- Kipf and Welling (2017) Thomas N Kipf and Max Welling. 2017. Semi-Supervised Classification with Graph Convolutional Networks. In International Conference on Learning Representations. OpenReview.net, Toulon, France, 1–14.
- Leskovec (2024) Jure Leskovec. 2024. CS224W: Machine Learning with Graphs. Stanford University. https://web.stanford.edu/class/cs224w/
- Liu et al. (2016) Mengchen Liu, Jiaxin Shi, Zhen Li, Chongxuan Li, Jun Zhu, and Shixia Liu. 2016. Towards better analysis of deep convolutional neural networks. IEEE transactions on visualization and computer graphics 23, 1 (2016), 91–100.
- Liu et al. (2022) Zipeng Liu, Yang Wang, Jürgen Bernard, and Tamara Munzner. 2022. Visualizing graph neural networks with corgie: Corresponding a graph to its embedding. IEEE Transactions on Visualization and Computer Graphics 28, 6 (2022), 2500–2516.
- Microsoft (2024) Microsoft. 2024. ONNX Runtime. https://onnxruntime.ai/
- Ming et al. (2017) Yao Ming, Shaozu Cao, Ruixiang Zhang, Zhen Li, Yuanzhe Chen, Yangqiu Song, and Huamin Qu. 2017. Understanding Hidden Memories of Recurrent Neural Networks. In 2017 IEEE Conference on Visual Analytics Science and Technology (VAST). IEEE, IEEE Computer Society, Phoenix, AZ, USA, 13–24.
- of Amsterdam (2024) University of Amsterdam. 2024. UVA Deep Learning Course. University of Amsterdam. https://uvadlc.github.io
- Ren et al. (2019) Donghao Ren, Laura R Marusich, John O’Donovan, Jonathan Z Bakdash, James A Schaffer, Daniel N Cassenti, Sue E Kase, Heather E Roy, Wan-yi Sabrina Lin, and Tobias Höllerer. 2019. Understanding node-link and matrix visualizations of networks: A large-scale online experiment. Network Science 7, 2 (2019), 242–264.
- Rozemberczki and Sarkar (2021) Benedek Rozemberczki and Rik Sarkar. 2021. Twitch Gamers: a Dataset for Evaluating Proximity Preserving and Structural Role-based Node Embeddings. arXiv:2101.03091 [cs.SI]
- Ruchikachorn and Mueller (2015) Puripant Ruchikachorn and Klaus Mueller. 2015. Learning visualizations by analogy: Promoting visual literacy through visualization morphing. IEEE Transactions on Visualization and Computer Graphics 21, 9 (2015), 1028–1044.
- Sanchez-Lengeling et al. (2021) Benjamin Sanchez-Lengeling, Emily Reif, Adam Pearce, and Alexander B. Wiltschko. 2021. A Gentle Introduction to Graph Neural Networks. https://doi.org/10.23915/distill.00033 https://distill.pub/2021/gnn-intro.
- Stasko (1990) John T Stasko. 1990. Tango: A framework and system for algorithm animation. ACM SIGCHI Bulletin 21, 3 (1990), 59–60.
- Strobelt et al. (2017) Hendrik Strobelt, Sebastian Gehrmann, Hanspeter Pfister, and Alexander M Rush. 2017. Lstmvis: A tool for visual analysis of hidden state dynamics in recurrent neural networks. IEEE transactions on visualization and computer graphics 24, 1 (2017), 667–676.
- Tensorflow (2024) Tensorflow. 2024. TF-GNN: Overview. Google. https://github.com/tensorflow/gnn/blob/main/tensorflow_gnn/docs/guide/overview.md
- Veličković et al. (2018) Petar Veličković, Guillem Cucurull, Arantxa Casanova, Adriana Romero, Pietro Liò, and Yoshua Bengio. 2018. Graph Attention Networks. In International Conference on Learning Representations. OpenReview.net, Vancouver, BC, Canada, 1–12.
- Wang et al. (2018) Junpeng Wang, Liang Gou, Hao Yang, and Han-Wei Shen. 2018. GANViz: A visual analytics approach to understand the adversarial game. IEEE transactions on visualization and computer graphics 24, 6 (2018), 1905–1917.
- Wang et al. (2020) Zijie J Wang, Robert Turko, Omar Shaikh, Haekyu Park, Nilaksh Das, Fred Hohman, Minsuk Kahng, and Duen Horng Polo Chau. 2020. CNN explainer: learning convolutional neural networks with interactive visualization. IEEE Transactions on Visualization and Computer Graphics 27, 2 (2020), 1396–1406.
- Yeh et al. (2023) Catherine Yeh, Yida Chen, Aoyu Wu, Cynthia Chen, Fernanda Viégas, and Martin Wattenberg. 2023. AttentionViz: A Global View of Transformer Attention. IEEE Transactions on Visualization and Computer Graphics 29, 1 (2023), 123–134.
- Zachary (1977) Wayne W Zachary. 1977. An information flow model for conflict and fission in small groups. Journal of anthropological research 33, 4 (1977), 452–473.