Actuation of Cell Sheets in 3D
Abstract
The alignment of fibers and cells in living tissues affect their mechanical properties and functionality. In this context, one can draw an analogy between living tissues and nematic liquid crystal elastomers. We explore this analogy by growing fibroblasts to high density on 2D patterned substrates and observing the contraction of cell sheets upon detachment from the substrates. When the fibroblast sheets detach, they undergo an anisotropic contraction, with a maximum contraction along the nematic director, like nematic elastomers do during a phase transition. We first quantify this anisotropy using substrates patterned with stripes to induce uniaxial alignment, finding that the cell sheets resemble nematic elastomers with a negative Poisson ratio. Then, we apply design principles used for programming curvature in nematic elastomers to actuate 3D structures in the detached fibroblast layers, demonstrating an application of these principles. This proof of concept shows the ability to control the 3-D shape through 2-D patterning in soft cell layers, leading to promising avenues to program tissues.
The generation of artificial tissues with desired target shapes through the self-assembly and self-organization of cells is an appealing idea for the creation of implants with maximal adaptability to the target organ. This approach is complementary to other approaches, such as the use of programmable and tunable gels or scaffolds [1, 2]. In this context, the alignment of cells is an important factor [3, 4, 5]. For example, cardiac implants or other bioprinted tissues improve if the orientation of the cells matches the orientation of the surrounding tissue [6, 7, 8].
The analogy between spontaneously aligning cells and nematic liquid crystals can provide relevant insights [9]. Cell alignment influences cell-cell communication, cell migration, and even morphological features and differentiation. For example, by analyzing topological defects in the nematic order of cells, it was shown that they impact the rate of cell death [10], the formation of protrusions from a flat cell layer [11, 12, 13, 14, 15, 16] and the potential for tissue regeneration [17].
One interesting aspect of this analogy comes into focus when one considers the effect of the liquid crystal order on the mechanical properties of tissues, in particular by considering tissues as a special type of liquid crystal elastomer. Liquid crystal elastomers are polymer networks with liquid crystal mesogens embedded in the polymer main or side chains [18]. One of the consequences of their mesogenic nature is the ability to change their macroscopic shape in response to a phase transition.
This property, often called actuation, is a consequence of the coupling of the mechanical properties with the order parameter of the material. This is exemplified by the simple observation that the equilibrium shape of a uniformly aligned nematic elastomer changes in the passage from the nematic to the isotropic phase. If the elastomer is crosslinked in the aligned nematic phase, at the phase transition it contracts along the nematic director and expands in the directions perpendicular to it. By imposing initially a non-uniform alignment, this anisotropic expansion/contraction can result in generation of Gaussian curvature [19, 20, 21].
This property is intriguing in the context of cell sheets. In particular, populations of fibroblasts grown in 2D at high density display nematic order [22, 23]. Moreover, as they proliferate they secrete polymers that create an extracellular matrix, an elastic medium in which the cells are embedded [24]. The nematic order of the cells favors a certain degree of alignment of the elastic matrix [25]. We could therefore expect that this composite elastic medium shows an analogy with liquid crystal elastomers. To test this hypothesis, we analyze the behavior of layers of fibroblast cells, whose alignment is controlled by a topographic pattern.
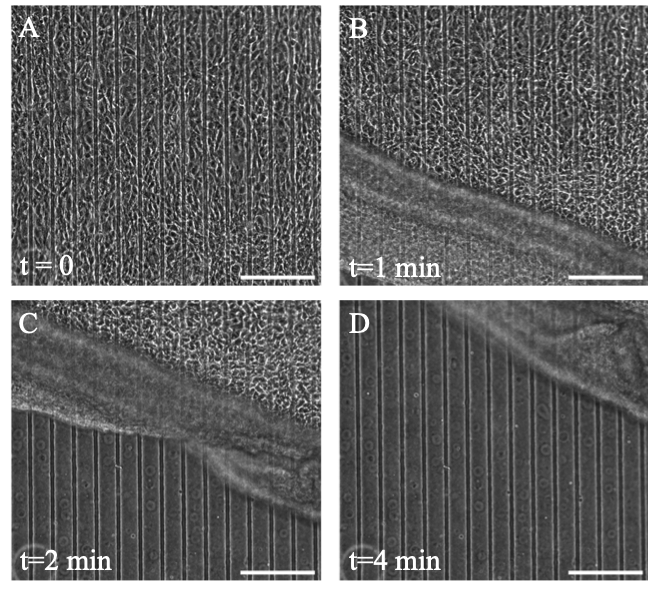
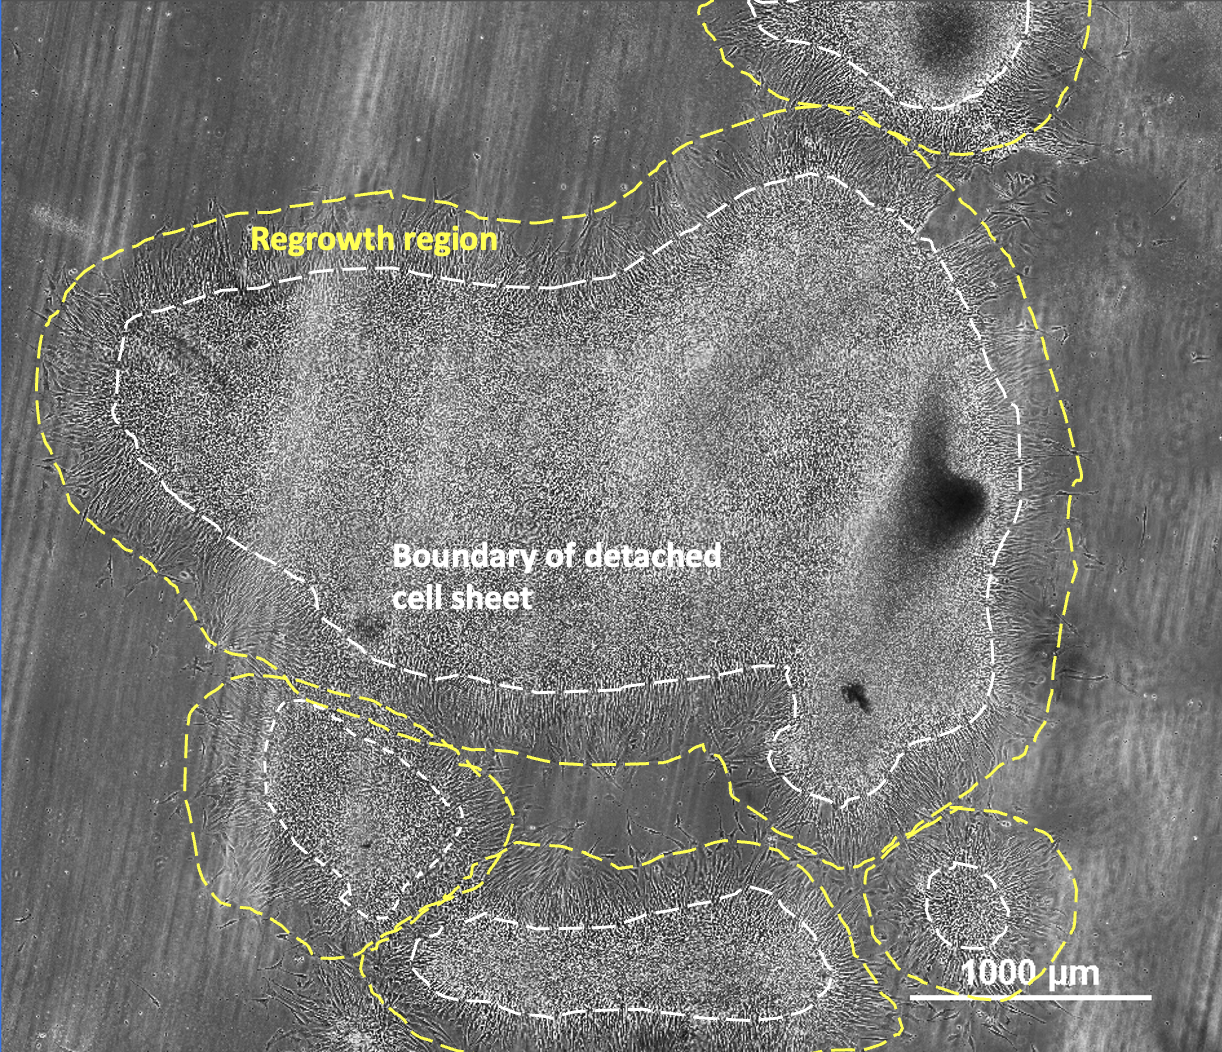
We grow 3T3 mouse fibroblasts to a high density on slabs of polydimethylsiloxane (PDMS), treated with poly-D-lysine, a common polypeptide for cell culture. At very high density, after a few days of growth, a flexible skin made of fibroblasts and extracellular matrix tends to spontaneously detach from the substrate [26, 27], starting from the edges of the sample. Any perturbations to the environment, such as shaking or changing growth media, triggers such detachment. A similar effect can also be induced by degradation of the substrate gel [2]. In our experiments, we drag a scalpel blade along the perimeter of the slab. As soon as the edges of the cell layer are released from the PDMS, the peeling of the whole layer proceeds spontaneously throughout the sample (Fig. 1A and Supplemental Fig. S1). Upon detachment, we notice that most fibroblasts are in the floating sheet and only very few fibroblasts are left on the PDMS substrate. The area of the peeled cell sheet is significantly smaller than the initial area occupied by the cells on the substrate (Fig. 1B), showing contraction along both dimensions in 2D.
Fig. 1A shows a phase contrast image of cells (microscope Nikon Ti-2 Eclipse) during peeling from PDMS substrates patterned with parallel ridges, or stripes, 10m wide and 1.5-2m tall, spaced by 60m. We observe that often the peeling starts from one edge and the cell sheet starts to lift over the course of several minutes (Supplemental Fig. S1). The peeling speed varies between samples and is often stalled by points where cells are pinned to the surface. An example of this is shown in Supplemental Fig. S2. The dynamic of the peeling appears to be highly variable: sometimes the sheet starts peeling from one edge or corner, and the pinning points can alter the course of the peeling front.
Despite the variability in the peeling dynamics, the final peeled sheet demonstrates an elastic characteristic, consistently having a final shape reflective of the substrate from which it detached. In Fig. 1B, shown as a typical example, while the detached cell sheet (outlined in maroon) has a different size and aspect ratio from the substrate (outlined in lavender), it shares the features of being a rectangular shape, albeit with jagged edges, with the corners of the detached sheet and the substrate maintaining substantial alignment.
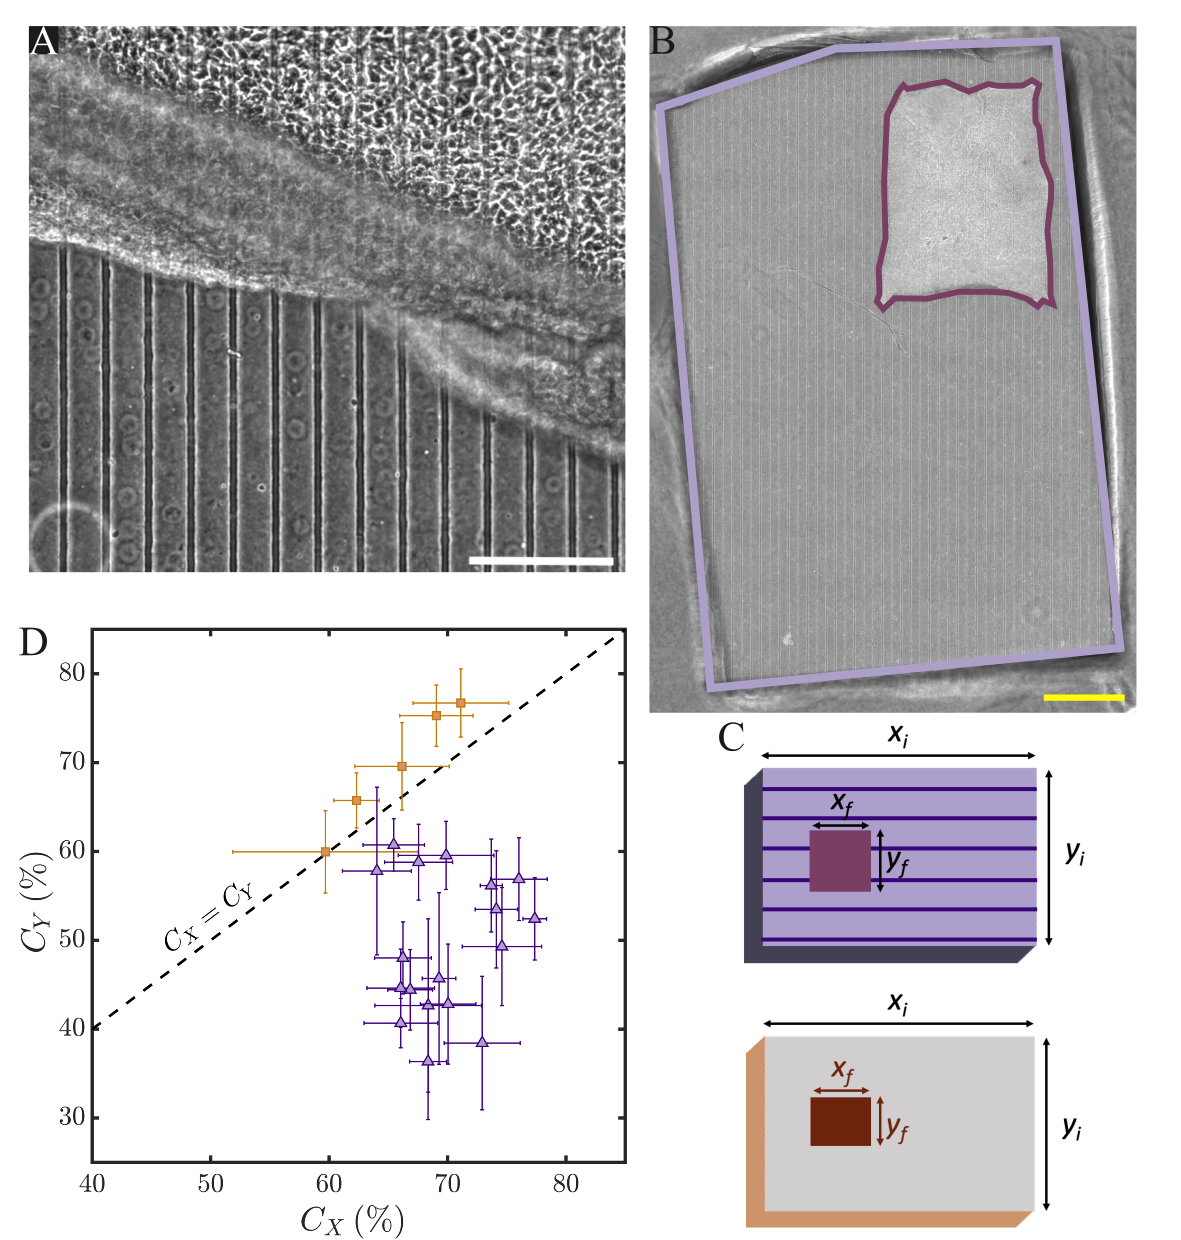
This consistency allows us to compare the degree of contraction obtained from plain substrates and from striped substrates. On the stripes NIH-3T3 cells reach confluency with uniform nematic alignment, with the director oriented along the stripes (also shown in Supplemental Fig. S1A). We can see from microscopy that after peeling, the cell sheet is relatively flat. Although there are some height fluctuations across the sample, there is no apparent 3D structure to the sheet. The flat sheets that roll into tubes or tear are discarded in our analysis.
If the sheet peels without rolling, as in Fig. 1B, we can measure the contraction from 2D phase contrast images, stitched together with ImageJ stitching plugin [28]. We take as reference the dimensions of the PDMS to determine the initial dimensions of the cell sheet ( and ) and measure the final dimensions of the sheet ( and ), as shown in schematics of Fig. 1C.
We compare this contraction ratio to that which is observed for cells grown on plain rectangular blocks of PDMS. We estimate the percentage contraction along the nematic director () and the percentage contraction perpendicular to the director () as and . For isotropic contraction, we expect . If the cell sheet contracts more along the director than perpendicular to it, we expect . The results are shown in Fig. 1D, where each point represents the measured contractions along x and y for one cell sheet. For plain samples, we define as the contraction along the longest edge of the sample. The uncertainty comes from the jagged edges of the samples and the approximation of flat sample (this is explained in detail in Supplemental Materials II-Methods).
The data consistently show that the cell sheets that peel from striped PDMS (purple data points) show a greater contraction along than , indicating that they contract more along their director than perpendicular to it. The average observed among these samples is , whereas the average is . The difference is apparent in the visible change in the aspect ratio of the samples. On the other hand, the cell sheets that peel from plain PDMS samples (orange data points) fall very close to the line. The average among these samples is , whereas the average is .
The data points in Fig. 1D represent points taken by varying parameters such as the initial density of cells (the seeding density), the growth time and the initial area of the cell sheet, the aspect ratio of the PDMS slab on which the cell grow. Based on our data, none of these parameter shows a clear influence on and , at least within our errors. However, we cannot completely exclude for example that the initial aspect ratio of the slab may influence the contraction (this was suggested in [29]). Finally, we can also test the viability of cells after the peeling. As shown in Supplemental Fig. S3, if the peeled cell sheet is deposited upon a petri dish, the cells will start to grow, showing that the cells remain alive during the peeling process.
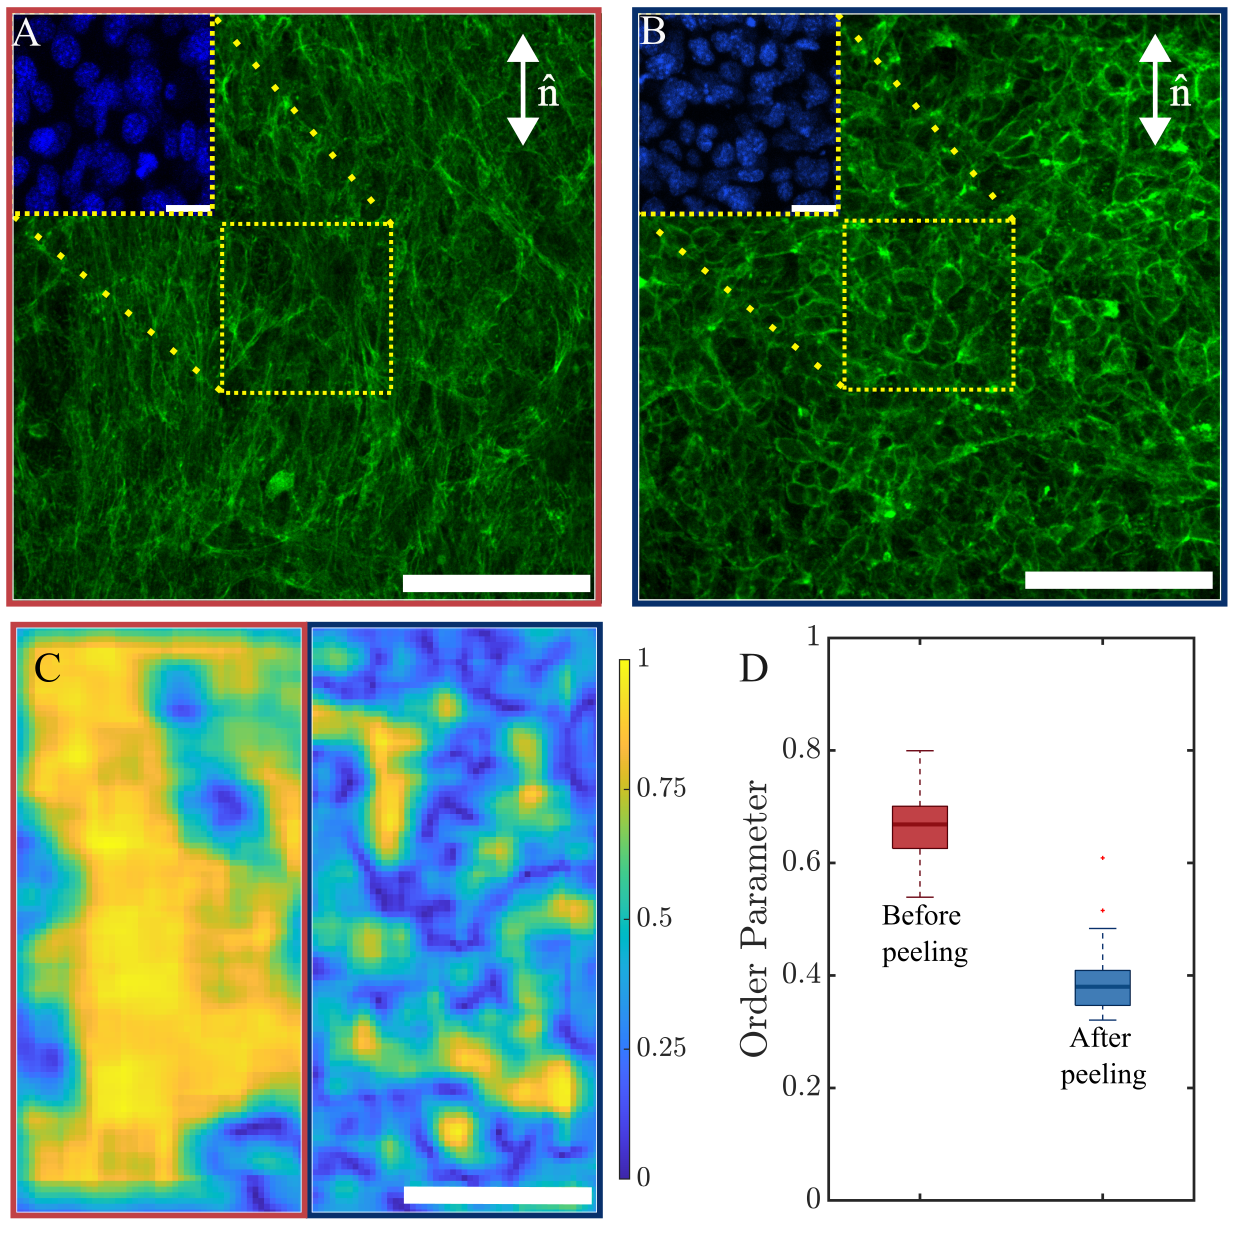
In order to establish an analogy with nematic elastomers, we can verify that the anisotropic contraction also corresponds to a change in the degree of order. We quantify the degree of order of the cell layer on the striped substrate before and after the peeling by looking at the alignment of actin filaments. We image the actin filaments stained with phalloidin rhodamine and analyze the fluorescence microscopy images with OrientationJ [30]. The results are shown in Fig. 2, where we see the fluorescence images of the actin network before (Fig. 2A) and after (Fig. 2B) peeling, alongside the nuclear fluorescence (insets). The actin looks more uniformly aligned in panel A and its alignment direction coincides with the direction of the stripes. We quantify the degree of alignment of the actin with a color map (Fig. 2C) representing an order parameter defined as :
where is the angle between vectors detected by OrientationJ within a square region (following [22]). The of cell layers on the striped substrates reduces after the peeling as shown in Fig 2D. Therefore we can consider the peeling process itself as a way to induce a transition between a higher order and a lower order phase, or to simplify between nematic and isotropic phase.
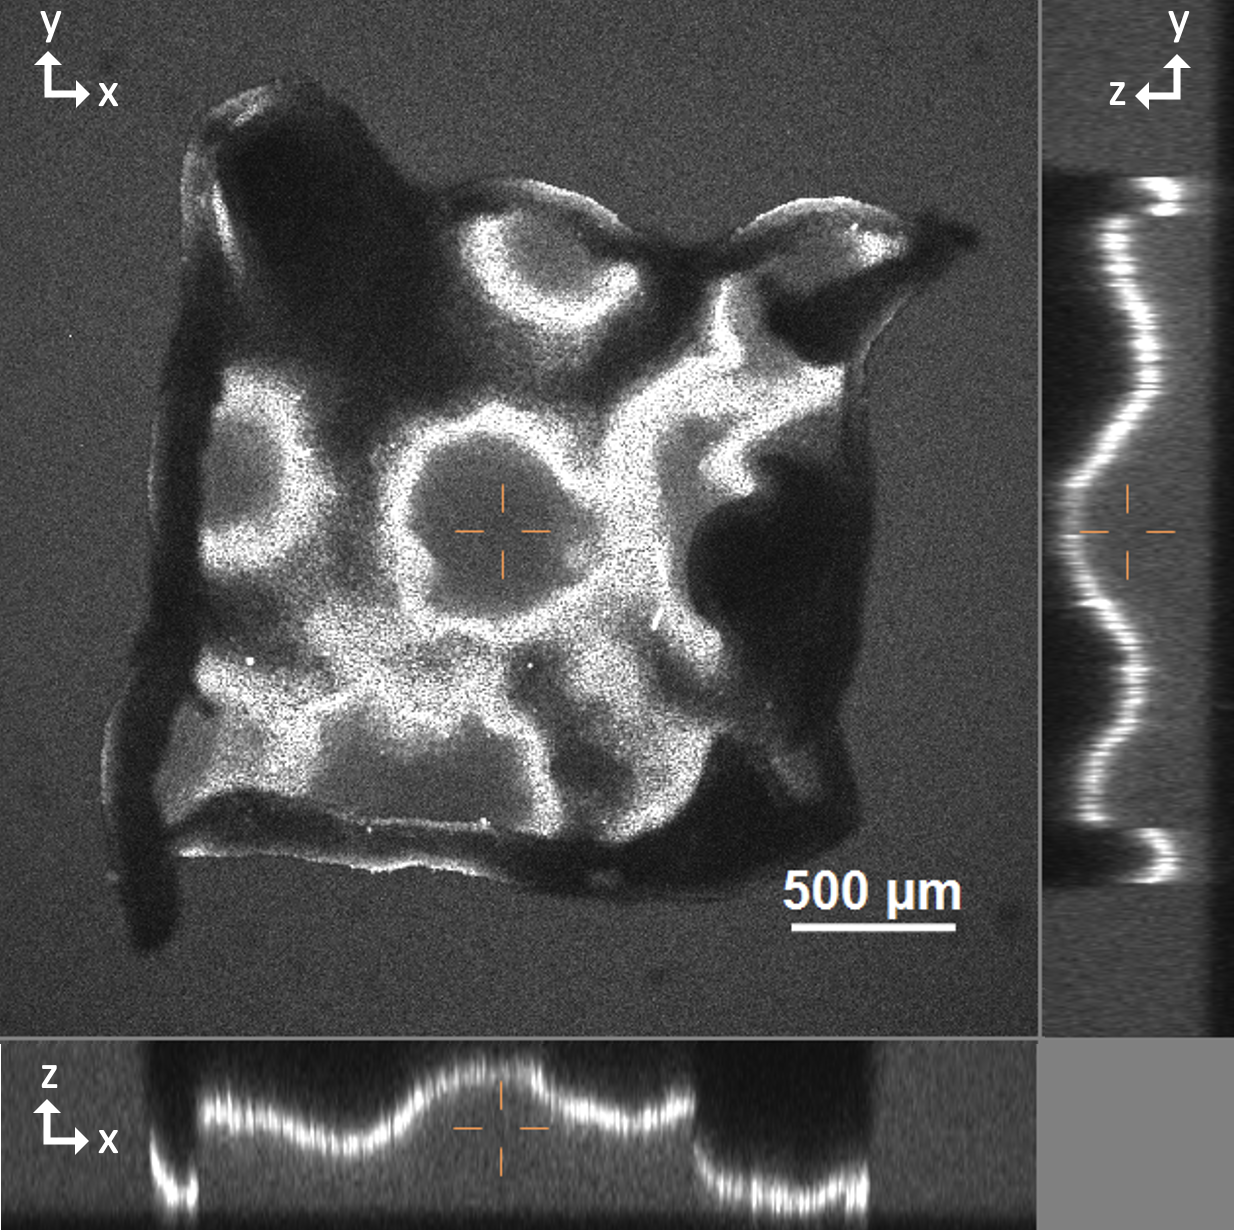
Since the cell sheets from striped substrates exhibit anisotropic contraction, as expected with a change of order parameter, we also test whether spatially varying alignment can generate Gaussian curvature. Instead of growing cells on parallel ridges, we use a pattern with an array of azimuthal +1/-1 defects, arranged in a square lattice (Fig. 3A.i), which we have extensively studied in previous work [31, 32]. PDMS is cut into 33 grids of +1 defects, with four -1 defects in between. The cones are expected to originate from +1 defects and to have positive Gaussian curvature concentrated at the tip of the cone. The same pattern has been tested by others in liquid crystal elastomers, and generated cones when actuated upon phase transition [33]. The curvature is generated because the material contracts in the azimuthal direction and expands in the radial direction, causing it to buckle.
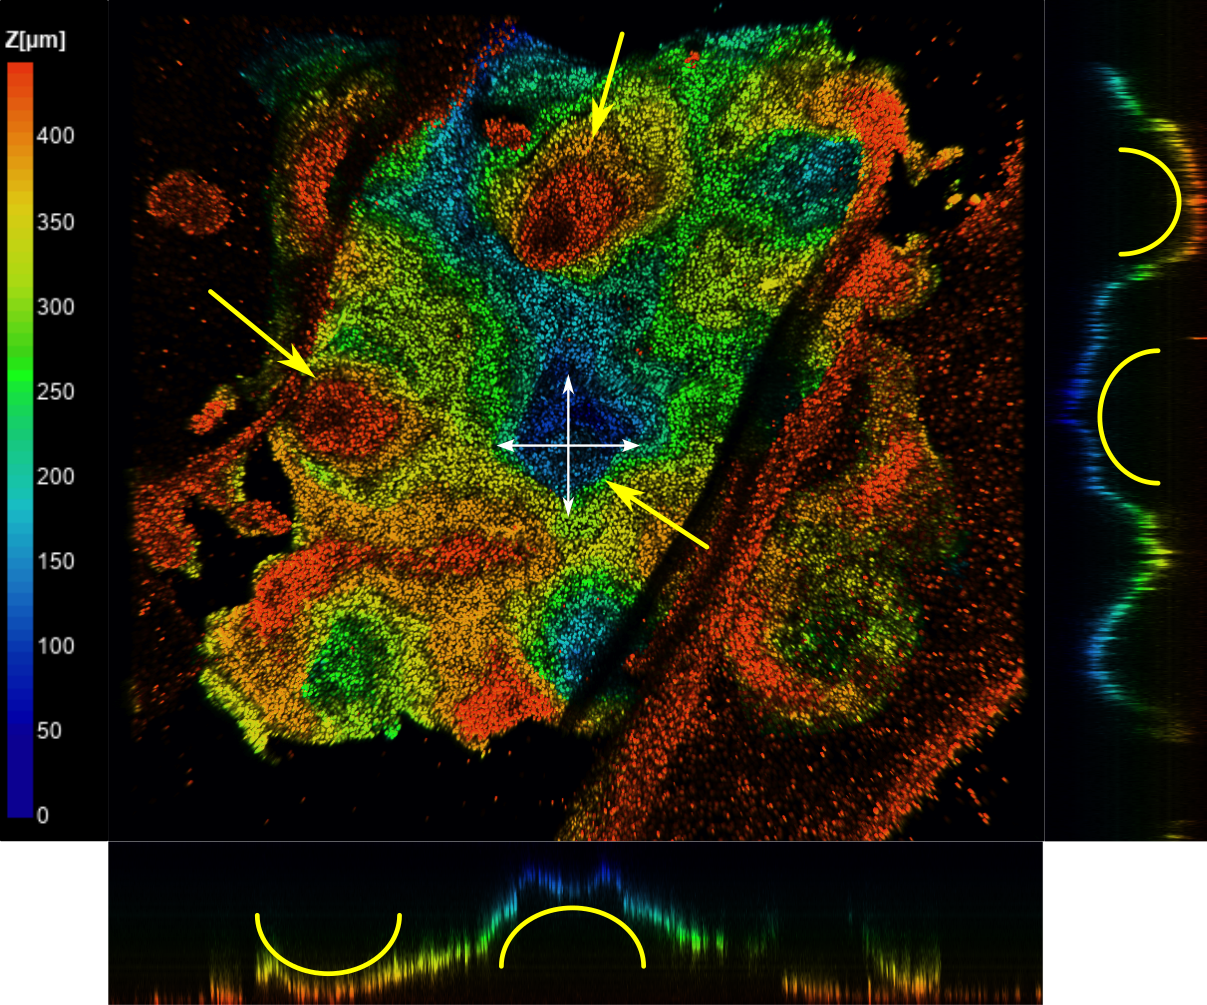
Fig. 3B is a confocal microscopy image showing the structure of a cell sheet peeled from a +1/-1 defect array, in which the cell nuclei were tagged with NucBlueTM Live Cell ReadyProbesTM (Hoescht 33342) stain. This peeled sheet bears striking resemblance to the cones formed by actuated liquid crystal elastomers. Instead of cones, however, the cell sheet has mounds with smoother curvature, as can be seen from the cross-section in Fig. 3B and Supplemental Fig. S4. This is not surprising and is due to two factors: first, the thickness of the cell layer is not completely negligible, which causes the cone tip to be smoother (as shown for example in [34]); moreover the cell layer is soft, making it difficult to sustain the shape of a cone; finally, the size of the defect core in cell monolayers is large compared to the small (ideally null) size of the topological defect core in liquid crystal elastomers. The cross sections confirms, however, that curved cell sheet remains thin, even in the mounds (Fig. 3B and S4).
We can estimate , the half-angle of the cone, by measuring the slope of the mounds(Fig. 3B). This depends on the opto-thermal Poisson ratio of the elastomer [21]. In liquid crystal elastomers, this opto-thermal Poisson ratio () characterizes the spontaneous shape change of the material during phase transitions, and it relates the contraction/expansion along the director () to the expansion/contraction in perpendicular directions () Following the derivation in Modes et al. [21] for infinitely thin sheets, initially flat and folding into cones, we estimate as the ratio between the radius of the largest circular ridge of each pattern and the radius of the 2D projection of the cone after peeling, which we can estimate by taking the average distance between cone tips, divided by 2. Then we estimate using . We compare the values with those of and measured from the flat sheets as and (the contraction along the director and the contraction perpendicular to it), and we verify a good agreement between the values (Fig. 3C). Note that is negative, as expected, reflecting that the actuation occurs by a contraction in both x and y. This is unlike conventional liquid crystal elastomers which typically expand in the directions perpendicular to the director. Moreover, at the location of topological defects, the flat sheet can adopt either a cusp (reverse mound) or a bowl(mound) configuration, as shown in Fig. S5, both with positive Gaussian curvature. In liquid crystal elastomers the direction of bending is typically determined by the position of the heating source or a tilted angle of molecular alignment on the surface [20]. Here, we can often observe both types.
While all the results shown so far are consistent with a liquid crystal elastomer-like description, the higher density of cells at +1 topological defects [14, 31, 32, 35] may also play a role in generating the curvature [36]. Since the cells in the core of the +1 defects are packed to a higher density and already have a smaller size compared to cells in the surrounding sheet, it is possible that they cannot contract as much as the cells further away from the defect core. More experiments are needed to elucidate the role of density variation.
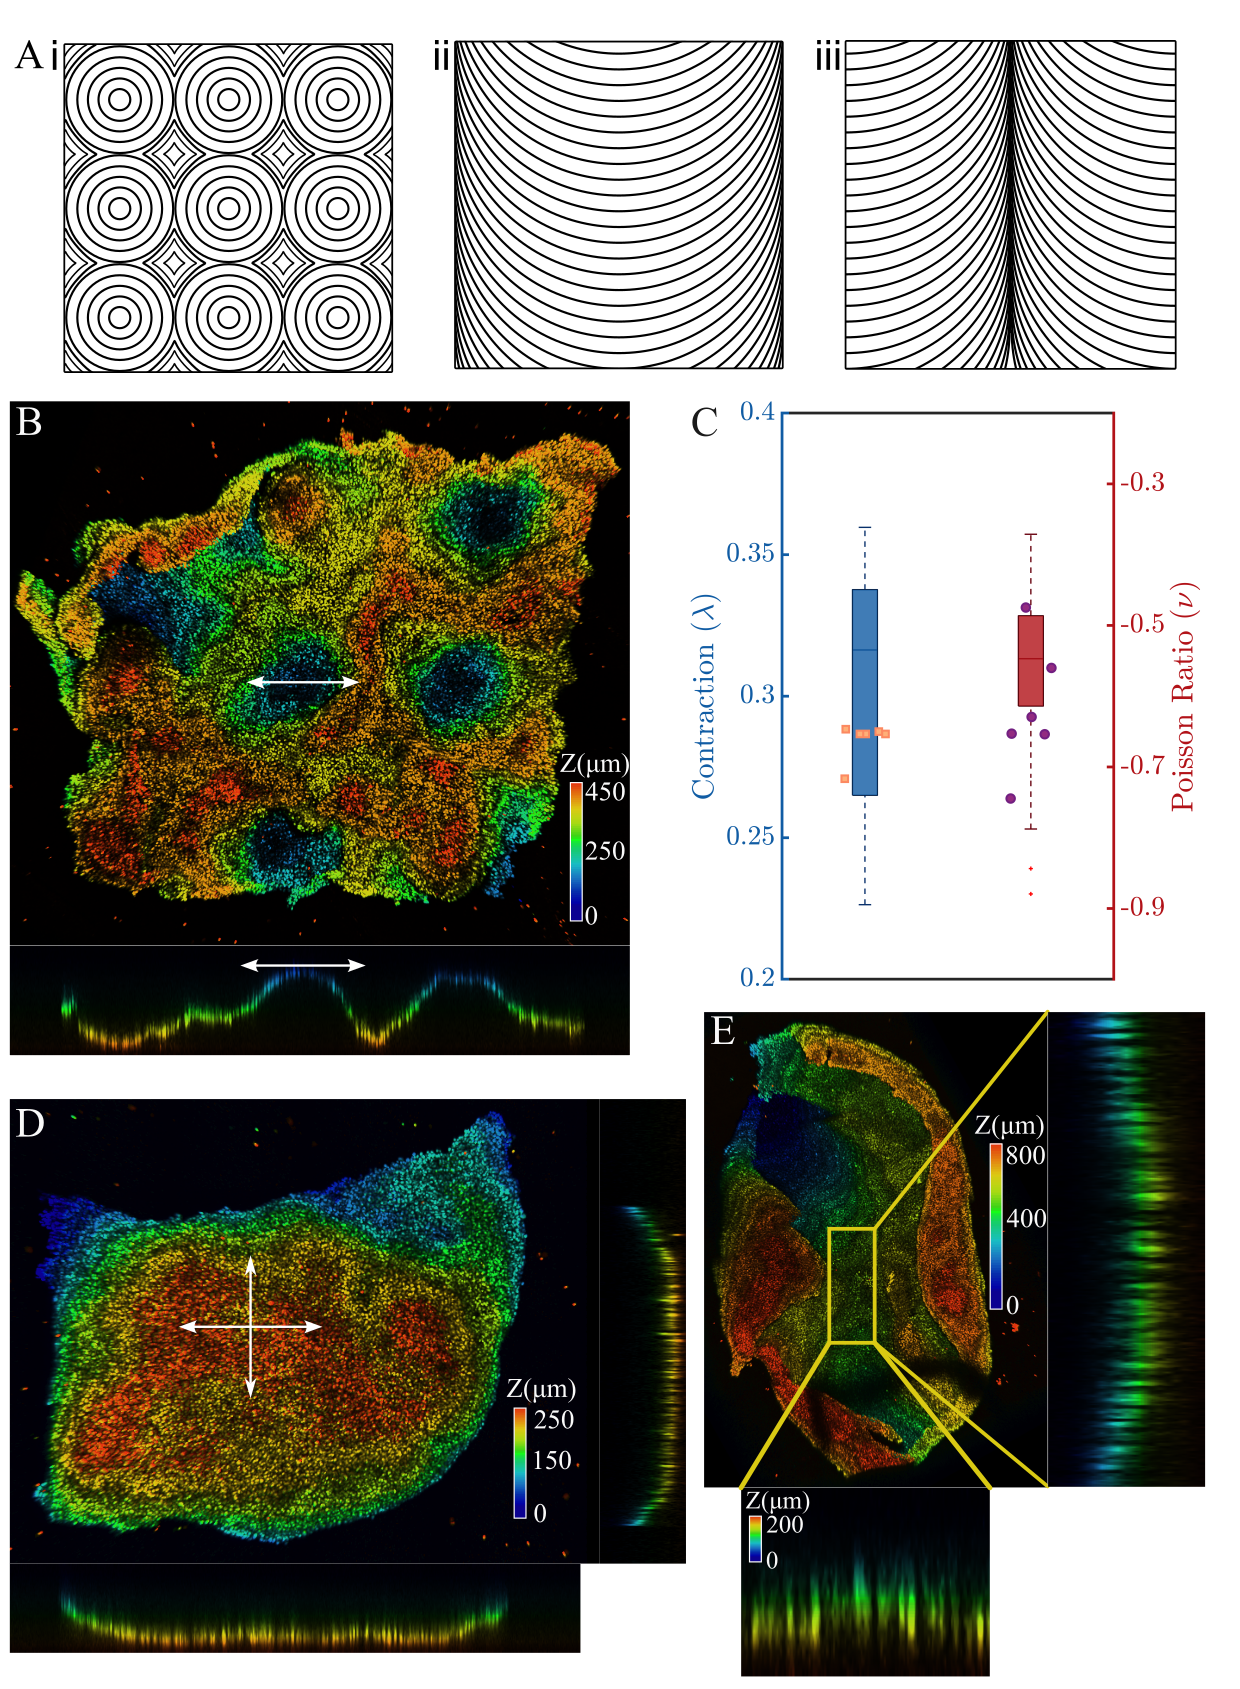
To circumvent this effect entirely, we test two non-singular patterns that are able to generate Gaussian curvature (Fig. 3A.ii-iii), as shown in [19]. The patterns are predicted to generate constant Gaussian curvature in the sample. We verify that indeed we can generate positive or negative Gaussian curvature in the center of the samples (Fig. 3D-E), as expected, even though the edges of the samples tend to roll randomly, most likely to the very soft and floppy nature of the elastic material. This shows that even without the density variation effect associated to topological defects, the actuation happens and generate Gaussian curvature.
In summary, we demostrate that during peeling, aligned sheets made of NIH-3T3 fibroblasts contract anisotropically. Their contraction is greater along their nematic director than perpendicular to it, with a ratio of approximately 0.3. Because of this anisotropic contraction, we can generate 3D structure by spatially patterning the alignment of the cells in 2D. This is demonstrated in cell sheets patterned both with +1/-1 defect arrays and with nonsingular patterns (Fig. 3). Finally, the peeled cell sheet is viable immediately after peeling and can be transferred to a new dish for regrowth.
These results show that, like for liquid crystal elastomers, it is the in-plane alignment that determines the structure of the peeled cell sheet. Further study is needed to clarify the role of cell density and extracellular matrix development, but our work identifies a promising direction both for fundamental studies of tissues as liquid crystal actuators and the importance of nematic order in the generation of shapes, and for tissue engineering as a route to programmable tissues.
Author contribution
K.E. designed the research and performed experiments and data analysis. A.M. performed experiments and data analysis. F.S. supervised the project and acquired funding. All authors wrote the paper.
Acknowledgements.
We are grateful for the use of resources of the Danish Microscopy BioImaging Center (DaMBIC) in Odense. We thank Prasoon Awasthi, Maria Bloksgaard, Frederik Wendelboe Lund and Hillel Aharoni for useful discussions. This work is supported by Novo Nordisk Foundation Recruit grant NNF21OC0065453 to F.S. K.E acknowledges the support of the National Science Foundation Graduate Research Fellowship under Grant No. DGE-1746891.References
- Tomba et al. [2022] C. Tomba, V. Luchnikov, L. Barberi, C. Blanch-Mercader, and A. Roux, Developmental Cell 57, 1257 (2022).
- Elvitigala et al. [2023] K. C. M. L. Elvitigala, W. Mubarok, and S. Sakai, Soft Matter 19, 5880 (2023).
- Gao et al. [2020] L. Gao, L. Ma, X.-h. Yin, Y.-c. Luo, H.-y. Yang, and B. Zhang, Small Methods 4, 1900669 (2020).
- Balasubramaniam et al. [2022] L. Balasubramaniam, R.-M. Mège, and B. Ladoux, Current Opinion in Genetics & Development 73, 101897 (2022).
- Li et al. [2014] Y. Li, G. Huang, X. Zhang, L. Wang, Y. Du, T. J. Lu, and F. Xu, Biotechnology Advances 32, 347 (2014).
- Xu et al. [2024] F. Xu, H. Jin, L. Liu, Y. Yang, J. Cen, Y. Wu, S. Chen, and D. Sun, Microsystems & Nanoengineering 2024 10:1 10, 1 (2024).
- Zhu et al. [2017] W. Zhu, X. Qu, J. Zhu, X. Ma, S. Patel, J. Liu, P. Wang, C. S. E. Lai, M. Gou, Y. Xu, K. Zhang, and S. Chen, Biomaterials 124, 106 (2017).
- Kim et al. [2012] H. N. Kim, Y. Hong, M. S. Kim, S. M. Kim, and K.-Y. Suh, Biomaterials 33, 8782 (2012).
- Saw et al. [2018] T. B. Saw, W. Xi, B. Ladoux, and C. T. Lim, Advanced Materials 30, 1802579 (2018).
- Saw et al. [2017] T. B. Saw, A. Doostmohammadi, V. Nier, L. Kocgozlu, S. Thampi, Y. Toyama, P. Marcq, C. T. Lim, J. M. Yeomans, and B. Ladoux, Nature 544, 212 (2017).
- Harding et al. [2014] M. J. Harding, H. F. McGraw, and A. Nechiporuk, Development 141, 2549 (2014).
- Sanchez-Corrales et al. [2018] Y. E. Sanchez-Corrales, G. B. Blanchard, and K. Roeper, eLife , 10.7554/eLife.35717 (2018).
- Guillamat et al. [2020] P. Guillamat, C. Blanch-Mercader, K. Kruse, and A. Roux, Bioarxiv , 10.1101/2020.06.02.129262 (2020).
- Kawaguchi et al. [2017] K. Kawaguchi, R. Kageyama, and M. Sano, Nature 545, 327 (2017).
- Ho et al. [2024] R. D. J. G. Ho, S. O. Bøe, D. K. Dysthe, and L. Angheluta, Phys. Rev. Res. 6, 023315 (2024).
- Wang et al. [2023] Z. Wang, M. C. Marchetti, and F. Brauns, Proceedings of the National Academy of Sciences 120, e2220167120 (2023).
- Makhija et al. [2024] E. Makhija, Y. Zheng, J. Wang, H. R. Leong, R. B. Othman, E. X. Ng, E. H. Lee, L. Tucker-Kellogg, Y. H. Lee, H. Yu, Z. Poon, and K. J. Van Vliet, PLOS One 19, e0297769 (2024).
- Warner and Terentjev [2007] M. Warner and E. Terentjev, Liquid Crystal Elastomers, International Series of Monographs on Physics (OUP Oxford, 2007).
- Mostajeran et al. [2016] C. Mostajeran, M. Warner, T. H. Ware, and T. J. White, Proceedings of the Royal Society A: Mathematical, Physical and Engineering Sciences 472, 20160112 (2016).
- Aharoni et al. [2018] H. Aharoni, Y. Xia, X. Zhang, R. D. Kamien, and S. Yang, Proceedings of the National Academy of Sciences 115, 7206 (2018).
- Modes et al. [2011] C. D. Modes, K. Bhattacharya, and M. Warner, Proceedings of the Royal Society A: Mathematical, Physical and Engineering Sciences 467, 1121 (2011).
- Duclos et al. [2017] G. Duclos, C. Erlenkämper, J.-F. Joanny, and P. Silberzan, Nature Physics 13, 58 (2017).
- Duclos et al. [2014] G. Duclos, S. Garcia, H. Yevick, and P. Silberzan, Soft Matter 10, 2346 (2014).
- DeLeon-Pennell et al. [2020] K. Y. DeLeon-Pennell, T. H. Barker, and M. L. Lindsey, Matrix Biology 91-92, 1 (2020), fibroblasts: The arbiters of matrix remodeling.
- Li et al. [2017] X. Li, R. Balagam, T.-F. He, P. P. Lee, O. A. Igoshin, and H. Levine, Proceedings of the National Academy of Sciences 114, 8974 (2017).
- Bose et al. [2019] P. Bose, J. Eyckmans, T. D. Nguyen, C. S. Chen, and D. H. Reich, ACS Biomaterials Science & Engineering 5, 3843 (2019), pMID: 33438424.
- Bischofs et al. [2008] I. B. Bischofs, F. Klein, D. Lehnert, M. Bastmeyer, and U. S. Schwarz, Biophysical Journal 95, 3488 (2008).
- Preibisch et al. [2009] S. Preibisch, S. Saalfeld, and P. Tomancak, Bioinformatics 25, 1463 (2009).
- Serbo et al. [2016] J. V. Serbo, S. Kuo, S. Lewis, M. Lehmann, J. Li, D. H. Gracias, and L. H. Romer, Advanced Healthcare Materials 5, 146 (2016).
- Püspöki et al. [2016] Z. Püspöki, M. Storath, D. Sage, and M. Unser, Advances in Anatomy Embryology and Cell Biology 219, 69 (2016).
- Endresen et al. [2021] K. D. Endresen, M. Kim, M. Pittman, Y. Chen, and F. Serra, Soft Matter 17, 5878 (2021).
- Kaiyrbekov et al. [2023] K. Kaiyrbekov, K. Endresen, K. Sullivan, Y. Chen, Z. Zheng, F. Serra, and B. A. Camley, Proceedings of the National Academy of Sciences (In Press) (2023).
- Ware et al. [2015] T. H. Ware, M. E. McConney, J. J. Wie, V. P. Tondiglia, and T. J. White, Science 347, 982 (2015).
- Guin et al. [2018] T. Guin, M. J. Settle, B. A. Kowalski, A. D. Auguste, R. V. Beblo, G. W. Reich, and T. J. White, Nature Communications 9, 2531 (2018).
- Zhao et al. [2024] Z. Zhao, H. Li, Y. Yao, Y. Zhao, F. Serra, K. Kawaguchi, H. Zhang, H. Chaté, and M. Sano, bioRxiv (2024), 10.1101/2024.08.28.610106.
- Pfeifer et al. [2024] C. R. Pfeifer, A. E. Shyer, and A. R. Rodrigues, Current Opinion in Cell Biology 86, 102305 (2024).
I - Supplemental Figures

II - Methods and Materials
.0.1 Cell culture
NIH 3T3 mouse fibroblast cells (ATCC) are used in all experiments. The cells are cultured on Thermo Fisher Scientific NunclonTM Delta surface-coated dishes in 89% Dulbecco’s Modified Eagle’s Medium (DMEM) - high glucose formulation (containing 4.5 g/L glucose, L-glutamine, sodium pyruvate, and sodium bicarbonate; Sigma Aldrich), supplemented with 10% fetal bovine serum (FBS; Sigma Aldrich) and 1% penicillin-streptomycin. Cells used in experiments are between passages G9 and G15.
.0.2 Substrate manufacturing
Substrates are manufactured in a clean room using standard photolithography techniques on 10 cm silicon wafer chips. SU-8 2 negative photoresist is used to reach the desired height of 1.5 m to 2 m for the designs and measured using a profilometer.
.0.3 Substrate preparation
Polydimethylsiloxane (PDMS; Sylgard 184, Dow Corning), mixed with 10% curing agent, is used as a substrate for cell experiments. An SU-8-coated silicon wafer is placed in a petri dish and coated with a thin layer (3–5 mm) of desiccated PDMS mixture (1:10 ratio). The petri dish is then desiccated again to remove any bubbles formed during pouring. After desiccation, the sample is cured on a hot plate at 90∘C for 3–4 hours. Once cured, the PDMS substrate is carefully removed.
This PDMS mold is then used to create negative molds with Norland Optical Adhesive 81 (NOA-81), a UV-curable glue. A flat-bottomed glass petri dish containing 3–4 drops of NOA-81 is prepared, and the PDMS mold was inverted onto it to ensure complete coverage of the patterned substrate with NOA-81. The sample is degassed to ensure accurate replication of the pattern by the UV glue. The petri dish is exposed to UV light at 302 nm (8 W; Ultra Violet Products-3UV) for 20 minutes. The petri dish is then flipped, and an additional 20 minutes of UV exposure is done to ensure complete polymerization of the UV glue. Finally, the dish is heated at 60∘C for 30 minutes. Once completed, the original PDMS mold is removed, leaving behind a negatively patterned substrate made of UV glue, which is then used to produce PDMS copies for experiments.
The patterned PDMS copies (parallel ridges, or integer defects) are cut into required sizes and cleaned using scotch tape. A thin layer (2 mm) of PDMS (1:10) is poured onto a plastic petri dish and cured overnight at 37∘C. The petri dish along with the pattered PDMS substrate is treated with oxygen plasma (Harrick Plasma Cleaner) with RF power 30W for 3 minutes with a pressure of 300mtorr. Once plasma-cleaned, the PDMS substrate is attached to the plastic petri dish with the patterned side facing up and then heated for 1 min at 60∘C.
The sample is then sterilized with ethanol and prepared for substrate treatment with Poly-D-Lysine hydrobromide (Sigma-Aldrich). The substrate is coated with 0.1 mg/ml concentration of Poly-D-Lysine in Milli-Q Water. After 30 mins the dish is cleaned with sterile Milli-Q Water and allowed to dry for 90 mins. Once dried the cells are planted on the substrate. The cell concentration of the suspension is determined using a hemocytometer with 10 l demarcation. The concentration of cells used for plating the dish varies between 500-1000 cells/mm2.
.0.4 Peeling method
Cells are allowed to grow undisturbed for 2-4 days inside an incubator at 37∘C with 5% CO2. Once the cells are over-confluent, the samples are carefully carried to the microscope so as not to induce spontaneous peeling. Once at the microscope, we use a scalpel sliding it along with the sharp side of the blade touching the edge of the slab, ensuring that the PDMS slab is not cut. With this, we scratch each edge of the PDMS slab. This is carried out for all edges, from one vertex to another ensuring the bonds of the cells from the edge of PDMS are carefully severed, while also not cutting into the PDMS. Once cut, the cells either spontaneously peel completely from the surface or get pinned at times as shown in Fig. S2. In this case, a sharp-end tweezer is used to cut the anchored cell, while observing through the microscope. To aid in peeling the same tweezers are also used to brush the cell sheet which is already peeling, while ensuring not to puncture the cell sheet. This results in a completely detached cell sheet from the substrate. The cells are slightly denser than water, so the cell sheet tends to settle on top of the substrate. For staining the cell sheet for actin, the cell sheets are pinned close to a corner of the cell sheet through to the substrate while peeling with a 50 m needle, while being observed under the microscope. This helps prevent any movement of cell sheet while the staining protocol is carried out.
.0.5 Fixing and staining
To observe the cell nuclei, NucBlueTM Live Cell ReadyProbesTM (Hoescht 33342) stain is added to the dish at a concentration of 1 drop/ml of cell media and followed by 30 mins of incubation.
Cells are also fixed and observed before and after peeling. For post-peeling samples, as described in Sec..0.4, a 50 m needle is used to secure the unattached cell sheet to the substrate. All samples undergo the same fixation protocol, using 4% Paraformaldehyde (PFA) in PBS Ready-to-Use Fixative (Biotium) to fix the cells sheet. Around 100 l of PFA is applied over a 4 mm2 cell sheet and incubated for 20 mins. The sample is then washed twice with 1x stock solution Phosphate-buffered saline (PBS), leaving the PBS in the sample for 5 mins during each wash.
For actin staining, cells are permablilized by adding 50-100l of 0.1% (V/V) Triton X-100 (Merck) in 1x PBS for 10 mins, follwed by two 5-minute washes with 1x PBS. To block non-specific binding 50-100l of 1%(W/V) Bovine serum albumin (BSA, VWR) in 1x PBS is added and incubated for 1 hour, after which the samples are washed twice more with 1x PBS. Actin is tagged using 0.2% (V/V) Rhodamine Phallodin (invitrogen) diluted in 1x PBS. 50-100 of this solution is used for coating and is incubated for 1 hour before washing the substrate again with 1x PBS. Following this, the cell sheet is stained using NucBlueTM Fixed Cell ReadyProbesTM, adding 2 drop/ml to 1x PBS in the petri dish, incubated for 20 mins and washed again with 1x PBS.
.0.6 Microscopy
Nikon Tl-Eclipse Widefield microscope and Kinetix Scientific CMOS camera (Teledyne Photometrics) are used to image cell sample, using phase contrast and fluorescent imaging in 2D. Large multi-point image is used to capture the complete cell sheet and patterned substrate by translating the stage along a grid with 15% overlap between the frames.
Confocal imaging is done using the Nikon A1R confocal unit with Ti-2 LFOV microscope body, and with A1-DUG hybrid 4-channel multi detector. LU-NV laser unit is used to excite the sample at 407nm and 514nm for nuclei and actin respectively.
.0.7 Distance and error estimation
Images obtained from both the microscope are processed by using ImageJ Stitching plugin by passing them through an ImageJ Stitching plugin [28]. For Z-Stack large image stitching, an ImageJ macro was written and used in conjuction with ImageJ Stitching Plugin to get final image. ImageJ was later used to the measure the various length of the cell sheet and the ridges.
To account for the irregular shape of the cell sheets before and after peeling, we take 5 measurements per side of the samples before and after peeling, evenly distributed across the sample. In some cases, samples have a partially rolled side, or an “ear” near a corner. These are clearly visible from the phase contrast images. In this case, we measure the local thickness of the rolled side and add it to the measured length.
The percentage contraction in x and y directions are calculated using
| (1) |
where are the average initial (substrate or before peeling dimensions) and final (post peeling dimensions) of the cell sheet. Errors in estimation denoted by are given by standard deviation of measured . With this the error in is given by
| (2) |
.0.8 Order parameter
In order to get a projection of a confocal image, ImageJ is used to get a Maximum intensity projection of actin images. The maximum intensity image is passed through OrientationJ (ImageJ plugin) with a local window size ( = ) to get the orientation of actin fibers, both before and after the peeling. The orientation is then used to calculate the local order parameter [22]
| (3) |
where is the local nematic director. varied from 0 to 1 as the nematic director goes from lack of order to complete order. The local order parameter is taken over a m window.