Explainable AI for Classifying UTI Risk Groups Using a Real-World Linked EHR and Pathology Lab Dataset
Abstract
The use of machine learning and AI on electronic health records (EHRs) holds substantial potential for clinical insight. However, this approach faces significant challenges due to data heterogeneity, sparsity, temporal misalignment, and limited labeled outcomes. In this context, we leverage a linked EHR dataset of approximately one million de-identified individuals from Bristol, North Somerset, and South Gloucestershire, UK, to characterize urinary tract infections (UTIs) and develop predictive models focused on data quality, fairness and transparency. A comprehensive data pre-processing and curation pipeline transforms the raw EHR data into a structured format suitable for AI modeling. Given the limited availability and biases of ground truth UTI outcomes, we introduce a UTI risk estimation framework informed by clinical expertise to estimate UTI risk across individual patient timelines. Using this framework, we built pairwise XGBoost models to differentiate UTI risk categories with explainable AI techniques to identify key predictors while ensuring interpretability. Our findings reveal differences in clinical and demographic factors across risk groups, offering insights into UTI risk stratification and progression. This study demonstrates the added value of AI-driven insights into UTI clinical decision-making while prioritizing interpretability, transparency, and fairness, underscoring the importance of sound data practices in advancing health outcomes.
1 Introduction
The integration of electronic health records (EHRs) into health research offers immense potential for generating insights that improve patient care and health outcomes (King et al. 2014; Menachemi and Collum 2011). As large-scale health data becomes more accessible, machine learning and AI can reveal patterns and relationships that traditional statistical methods might overlook (Richter and Khoshgoftaar 2018). However, the use of machine learning and AI with EHR data presents notable challenges, as EHRs are observational datasets that are often heterogeneous, sparse, and temporally misaligned (Ghassemi et al. 2020; Xie et al. 2022). These challenges are due to variations in clinical outcomes, diverse disease stages or conditions, irregular visit intervals, and inconsistent data recording practices over time that were not designed with machine learning in mind. Moreover, the lack of labeled outcomes, e.g. definitive diagnoses, complicates the development of robust predictive models, particularly in supervised learning. To address these challenges, rigorous data curation and pre-processing methods are essential.
Several publicly available datasets, such as the MIMIC-IV (Johnson et al. 2023) and eICU (Pollard et al. 2018), are frequently used in healthcare predictive modeling. While these datasets contain detailed patient information - such as demographics, lab results, and clinical notes - they primarily focus on intensive care settings, limiting their applicability to conditions managed predominantly in primary care, such as urinary tract infections (UTIs) (Lecky et al. 2020). UTIs are one of the most common classes of infectious disease encountered in clinical practice (Stamm and Norrby 2001). A number of studies have applied machine learning techniques to predict UTI risk using EHR data. Classification algorithms like logistic regression and decision trees have been employed to predict UTI presence based on structured data fields such as patient demographics and medical history (Møller, Sørensen, and Hardahl 2021; Jeng et al. 2022a). Other studies use clustering techniques to segment patients into UTI risk subgroups, revealing patterns that may guide targeted interventions (Barchitta et al. 2021). Additionally, (Iscoe et al. 2024) incorporated unstructured data via natural language processing to extract symptoms from clinical notes, such as Urinary frequency, to enhance UTI prediction. Reported UTI risk factors include gender (with females at higher risk), advanced age, comorbidities such as diabetes and neurological disorders, and prior history of UTIs which predispose individuals to recurrence(Jakobsen et al. 2023; Jeng et al. 2022b; Møller, Sørensen, and Hardahl 2021).
However, data used in these studies often lacks the breadth of linked primary care, secondary care and laboratory records, potentially limiting the predictive models’ depth and accuracy, as many studies rely solely on either primary or secondary care data alone. This can lead to inequities, as risk factors may vary across different population subgroups, with hospitalized patients tend to be more vulnerable. Furthermore, few studies have examined the discrepancies between clinician-based and AI-driven risk assessments for UTIs, a critical consideration for aligning model outputs with clinical perspectives. While interpretability and fairness are essential for building trust in healthcare AI (Tjoa and Guan 2021; Pessach and Shmueli 2022), existing studies that address these in UTI prediction predominantly utilize data from hospital or emergency department settings, limiting their generalizability to broader patient populations (Khan 2022; Jakobsen et al. 2023). Our work aims to address these open questions by utilizing a linked EHR dataset that includes data from primary care, secondary care, and pathology data, allowing for a more comprehensive analysis of UTI risk. This dataset encompasses data from approximately one million individuals in the Bristol, North Somerset, and South Gloucestershire regions of the UK. Using this extensive dataset, we aim to better characterize UTIs and identify associated risk factors across various subgroups.
Considering the limited availability of labeled UTI data, we propose a UTI risk estimation framework informed by clinical expertise. This framework enables automatic annotation of patient records and UTI risk estimation across individual patient timelines. We examine UTI risk predictors over a one-year observation period, highlighting how these predictors differ across UTI risk groups and contribute to increased risk while ensuring interpretability and transparency.
This paper begins by detailing the unique dataset we have acquired and the associated challenges in Section 2. In Section 3, we present the data pre-processing and curation strategies that transform raw EHR data into structured representations suitable for further statistical analysis and AI modeling. Section 4 introduces our clinician-based risk and outcome estimation framework. The methods for constructing a baseline model to identify initial predictive factors across different UTI groups are presented in Section 5, while Section 6 presents the results derived from machine learning models and explainable AI techniques. Finally we discuss limitations in our study and outline future research directions continuing from this work in Section 7.
2 Dataset
The Bristol, North Somerset, and South Gloucestershire (BNSSG) ’SystemWide’ dataset consists of routinely recorded healthcare data (BusinessInformationBNSSG 2022), with patient-level linked records primarily covering the period from October 2019 to July 2022. This dataset includes data on 962,237 adult patients whose Primary Care practices opted into data sharing within the BNSSG Integrated Care Board (ICB) area. Included in the dataset are records from primary care, secondary care, and notably pathology lab results for antibiotic susceptibility tests, with our specific extraction focused on UTI risk factor analysis and prediction modelling. The dataset was linked at the ICB and disseminated to the University via patient pseudo-anonymized identifiers and a strict governance regime to ensure the protection of patient privacy.
The primary care data in the extraction include patient demographics, living circumstances, and comorbidity histories (e.g., diabetes, dementia), as well as records of prescriptions dispensed for antibiotics, steroids, hormone replacement therapy, and catheter supplies. Secondary care data include information on hospital admissions and discharges, categorized by ICD-10 (DiSantostefano 2010) codes for bacterial infections, and OPCS codes (NHS 2006) for procedures related to chemotherapy, and urinary and gastrointestinal health. Pathology data include laboratory test results, including viral identification, blood, and urine culture tests. Further details on the information included and the demographic characteristics of the population in the dataset can be found in sections A1 and A2 in the Appendix.
Like most EHR data, this real-world dataset presents several challenges that affect statistical analysis and machine learning modelling:
-
•
Heterogeneity: The BNSSG dataset includes both structured data (e.g., demographic information) and semi-structured data (e.g., open-ended categories for medicine and catheter information), reflecting the diversity of real-world EHR data. This variety complicates further analysis, as these data require distinct pre-processing techniques, and integrating these data types can introduce inconsistencies that affect the robustness of model training and interpretability.
-
•
Temporal Misalignment: Data points are recorded at differing intervals, leading to time gaps and inconsistencies, as some events are recorded only when they occur (e.g., primary care medicine dispensations) while others are recorded at regular intervals (e.g., monthly records on co-morbidity status). This misalignment challenges the construction of time-dependent models and accurate analysis. Moreover, different patients contract UTIs at different times, which can be influenced by extrinsic factors (e.g. seasonality).
-
•
Sparsity: Since certain data points are recorded only when healthcare contact events occur, there are often large temporal gaps, limiting the detail available to build complete patient profiles. Sparse data complicates statistical analysis and reduces the reliability of machine learning models, particularly for time-series analysis or cases requiring a consistent record of patient health.
-
•
Missingness: Missing values in EHR - such as incomplete prescription data or catheter details in the BNSSG dataset - create challenges. Common approaches like imputation may add noise or bias if the causal context is not considered precisely, affecting the reliability of both the analysis and model predictions. This is notably a key concern when the data is not missing at random, such as when clinical tests are only conducted when disease is suspected, and then only if there is a substantive possibility that the result might trigger a change treatment.
-
•
Lack of an Explicit UTI Diagnosis Label: Although the extracted data focus on UTIs, the SNOMED code (NHS England 2024) diagnoses from primary care GPs were not available due to data governance limitations in our data transfer, making supervised learning difficult. Nevertheless, most UTI diagnoses in primary care are merely suspected rather than confirmed, which certainty typically only available for the most serious hospital admissions. This lack of labeling requires us to rely on indirect indicators or semi-supervised approaches, which may be less accurate and increase the need for expert validation.
To address these challenges, we have collaborated closely with clinical partners to enhance data quality and transform the raw data into a consistent and suitable structure for machine learning, as detailed in the following sections.
3 Data Pre-processing
Our data pre-processing pipeline prepares the large-scale EHR dataset for effective analysis by systematically cleaning, standardizing, and transforming data relevant to UTI prediction. Key steps include targeted cleaning of different data to ensure consistency across critical variables. We then discretise the data into days, transforming it into a sparse 3D matrix of subject by variable by day to support comprehensive but computationally efficient temporal analysis.
3.1 Data Cleaning
Since our study focuses on UTIs, we implemented targeted data cleaning procedures on specific data subsets, including primary care dispensation records, secondary care hospital admissions, and pathology lab results for blood and urine bacterial cultures. Each data source has unique characteristics that required consultation with clinical experts to inform tailored cleaning approaches.
Dispensed Dispensation Data
Relevant attributes were extracted from clinical prescription dispensation notes, including drug name, dosage, type (antibiotics, steroids, hormones), and administration route (e.g., oral and topical). For catheter-related dispensations, data includes manufacturer, catheter type, insertion method, size, and several material and coating categories (e.g., silicone and latex).
Hospital Admission Data
Admission data were cleaned to extract associated ICD-10 and OPCS codes recorded at each patient visit, alongside entry and discharge dates. This ensured we captured all relevant diagnostic and procedural information per admission period.
Pathology Data
Blood and urinary bacterial culture results contained both culture tests (e.g. species detected) and a mix of antibiotic susceptibility tests (ASTs) and other pathology results (114 unique test types). We categorized urinary bacterial culture results into “no significant growth”, “no growth”, “mixed growth”, “invalid”, “other” (non-AST), and “refer to AST test”. The reason for adding the “refer to AST test” category is because the urinary bacteria test data have AST results but coded in a non-accessible format that is more easily accessed in the AST data. AST results were denoted to “susceptible”, “intermediate”, and “resistant” responses. We grouped intermediate results under the resistant category to streamline analysis based on clinician guidance and used (s) and (r) represent susceptible and resistance respectively. Additionally, in non-AST cases, results were labeled as “positive” or “negative” (denoted as (p) and (n) respectively). Both urinary culture and AST data include specimen source information, which we mapped to standardized categories such as catheter stream urine, mid-stream, and some other categories.
Demographics Data
All patients have monthly recorded demographic information including age, gender, sex, date of death, living circumstances, a set of comorbidities, and geographic location. Geographic data is recorded using the 2011 Lower Layer Super Output Areas (LSOAs) (UK ONS 2011). The demographic data is structured and was minimally processed for our analysis.
3.2 Data Transformation
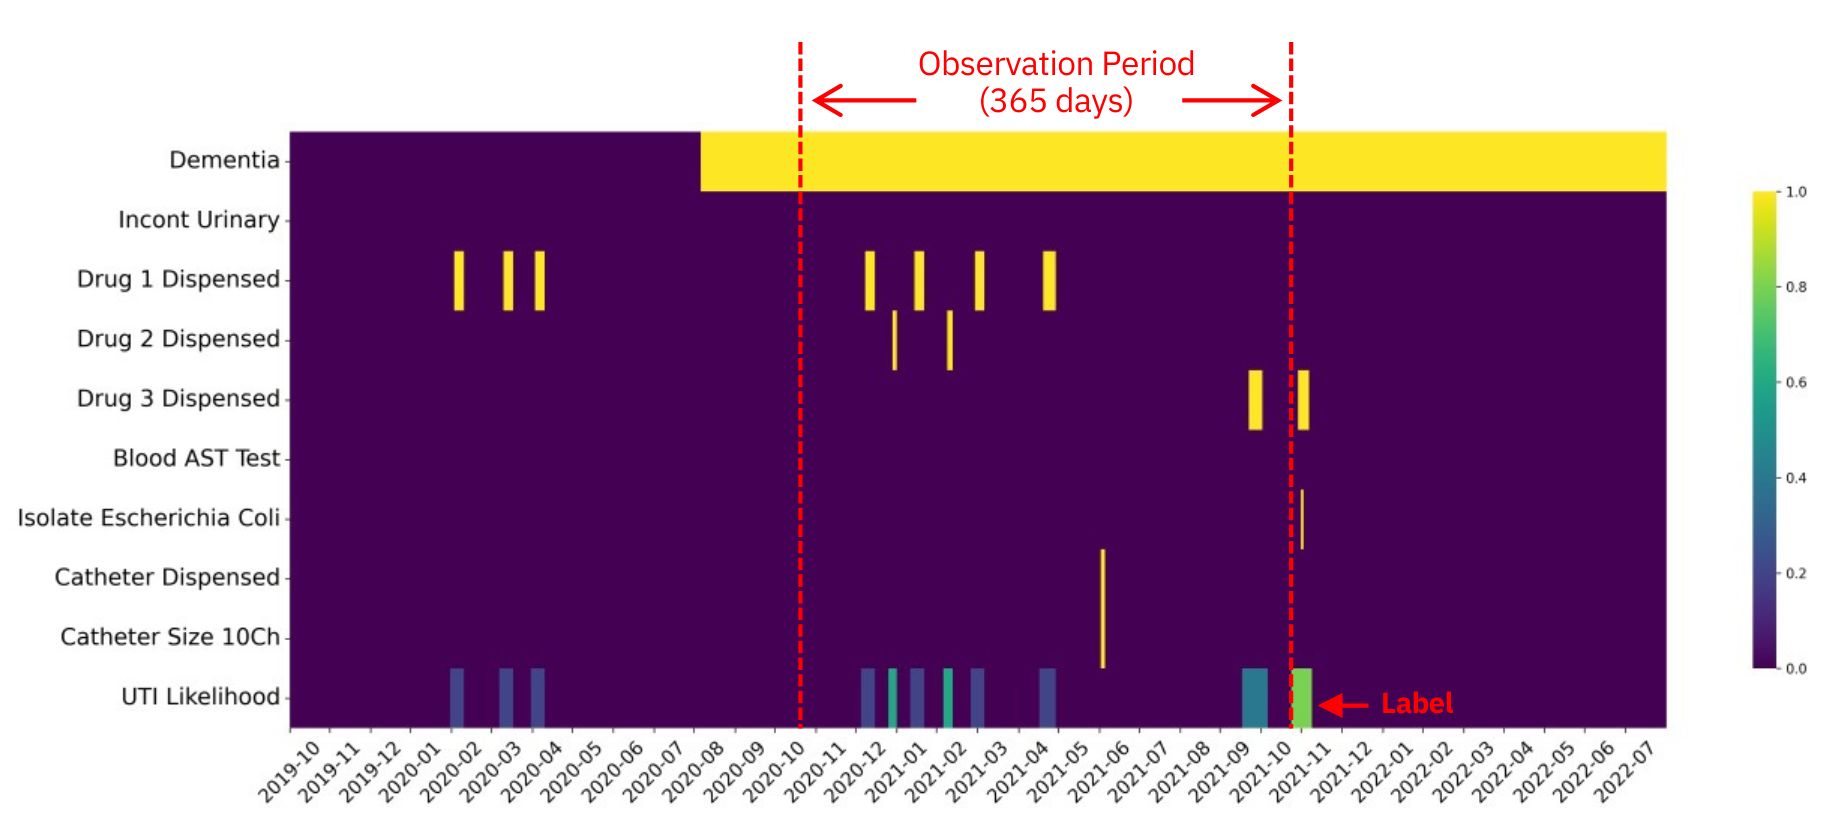
Following initial cleaning, we discretized the data into day resolution. The data is structured into a 3-dimensional matrix , where represents the time dimension, represents features, and denotes patients. This transformation is computationally intensive, as each patient’s timeline generates approximately 1,005 rows (one row per day over 33 months) and over 25,000 variables (e.g. a row for each unique ICD-10 code and every antibiotic and bacteria AST combination dedicating presence or absence). Figure 1 provides an artificial example of a patient’s clinical timeline after data processing, displayed as a heatmap.
4 UTI Risk Estimation Framework
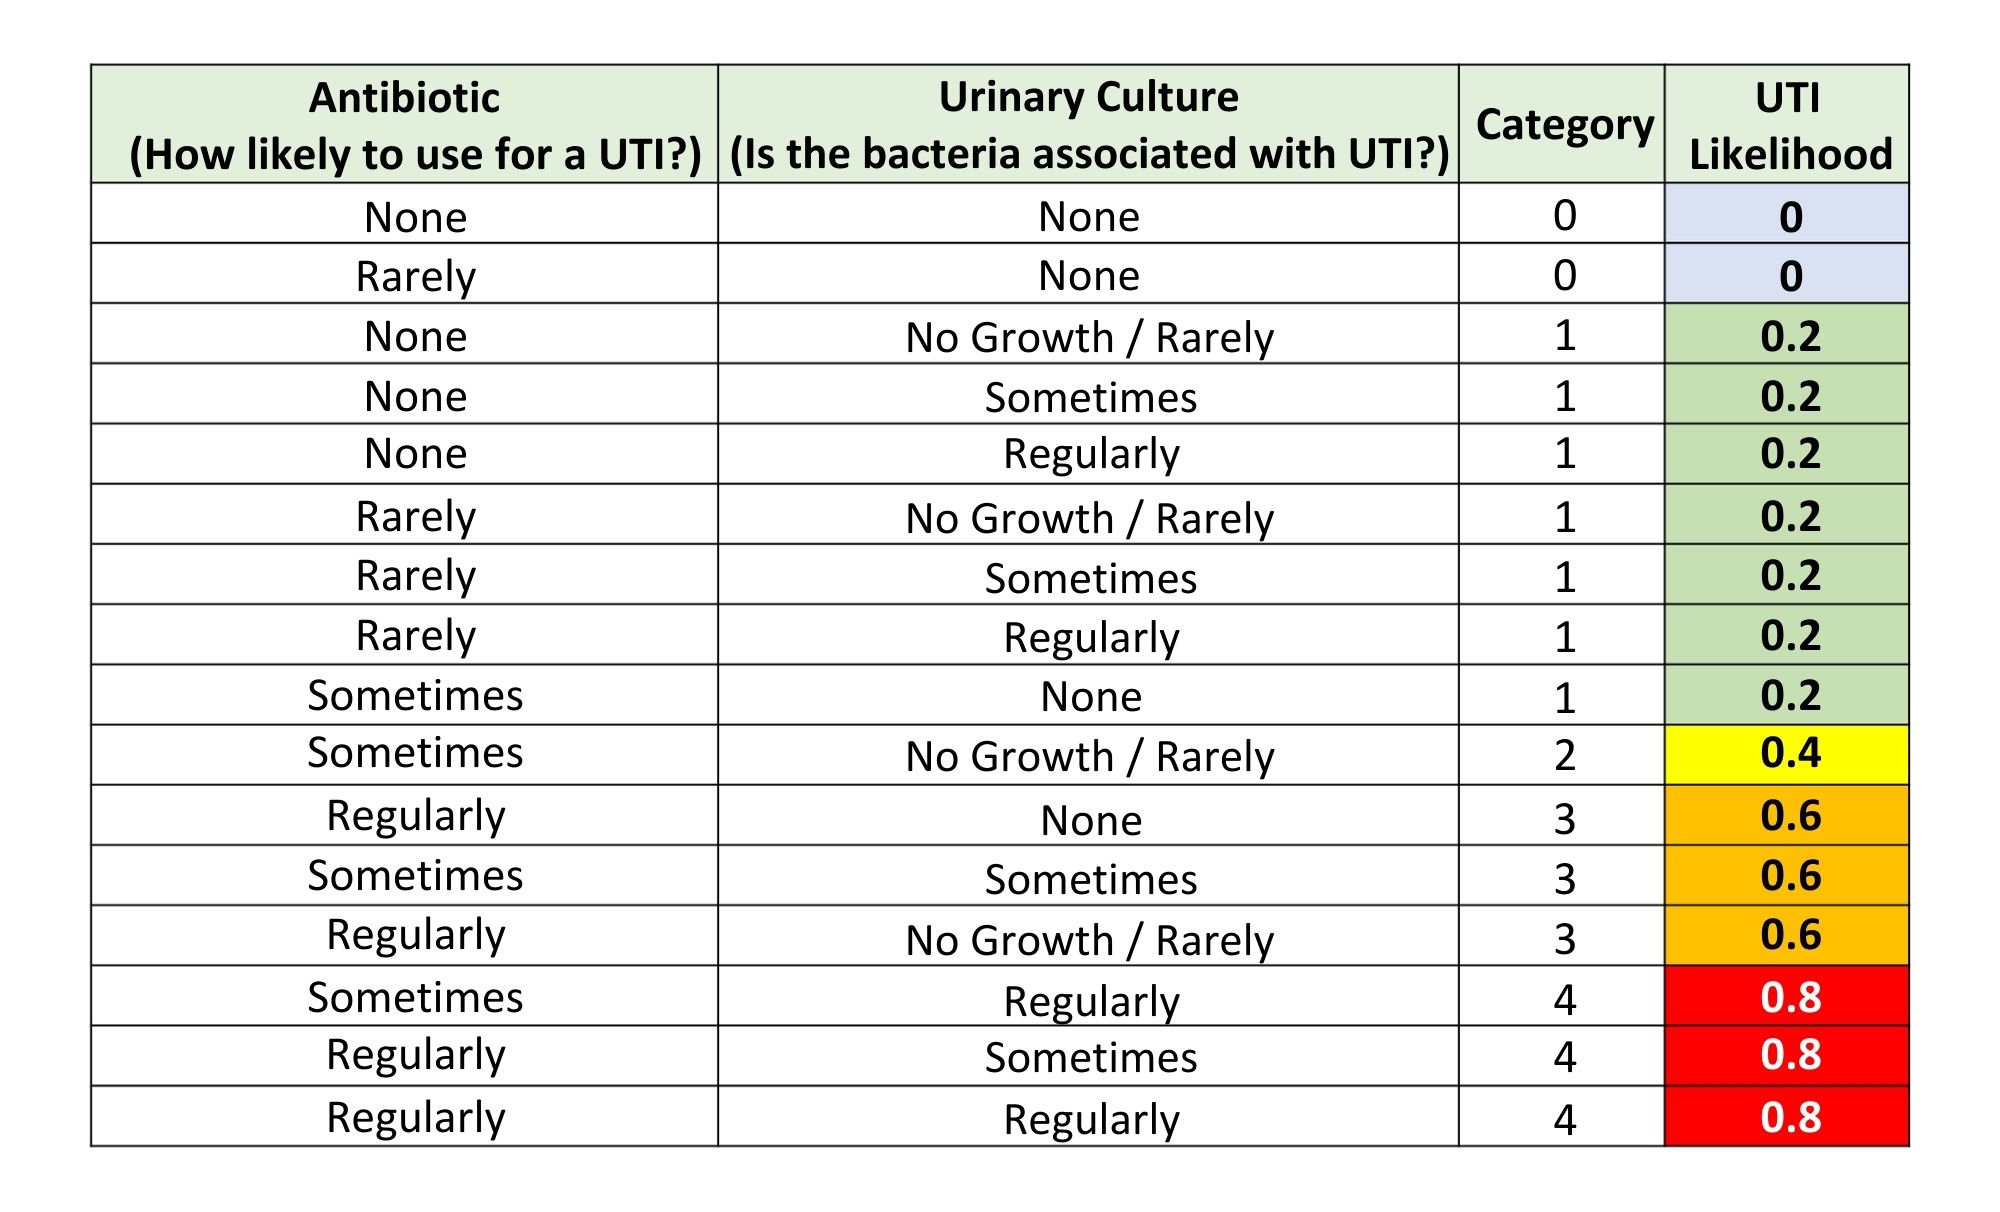
Urinary tract infections can be challenging to diagnose due to the variety of symptoms that overlap with other conditions and the lack of a definitive diagnostic test. Given the absence of a direct UTI label in our dataset, we developed a UTI risk estimation framework in collaboration with clinical experts. This framsework aims to provide a probabilistic estimate of UTI risk for individual patients, ranging from 0 (no UTI) to 1 (definite UTI). It is based on three key variables: (1) the presence of UTI-related antibiotic dispensations, (2) the identification of UTI-related bacteria in urine culture tests, and (3) relevant hospital diagnosis codes. By integrating these sources of information, our framework allows us to assess UTI risk across a patient’s entire clinical timeline, providing day-specific risk estimates. The details of the framework can be found in Figure 2.
Antibiotic Dispensation
Antibiotics dispensed to a patient are categorized into four groups based on their relevance to UTI treatment: ”None”, ”Rarely Used”, ”Sometimes Used”, and ”Regularly Used” for UTI. The classification reflects the inferred levels that the prescribed antibiotic was used to treat or prevent a UTI.
Urine Pathology Results
Urine culture results are categorized into four levels: ”None”, ”No Growth / Bacteria Rarely Associated with UTI”, ”Bacteria Sometimes Associated with UTI”, and ”Bacteria Regularly Associated with UTI”. We treat both ”No Growth” and ”Bacteria Rarely Associated with UTI” as equivalent, since having a urine specimen taken indicates that the patient likely had some UTI symptoms, but both indicate a low (but non-zero) likelihood of UTI presence.
Hospital Diagnosis Codes
Secondary care ICD-10 diagnosis code N39.0, which specifically corresponds to UTI, is a definitive source of UTI diagnosis. Although patients who are hospitalized are assigned this ICD-10 code, the occurrence of such cases is relatively rare in our dataset, with approximately 1,000 instances recorded during the study period. This is likely due to many UTI cases being managed in primary care or outpatient settings, rather than requiring hospitalization.
These three variables are combined to generate a composite ”UTI Likelihood”, see Figure 2, which provides a discrete likelihood score with values of 0, 0.2, 0.4, 0.6, 0.8, or 1, representing varying degrees of UTI risk, from none to confirmed.
One of the primary challenges in applying this framework is the misalignment of EHR data. The key variables - antibiotic dispensation and pathology results - are event-based records, meaning they are recorded at specific points in time (e.g., the day an antibiotic was dispensed, or a urine sample was processed). These events are not always aligned with each other, even when they may be causally related to an underlying UTI. To address this, we extend the data temporally to capture the ongoing effects of medications and the progression of infection, thereby enabling the application of our clinician-based risk framework. Figure 3 illustrates an example of data extensions to achieve temporal alignment of events.
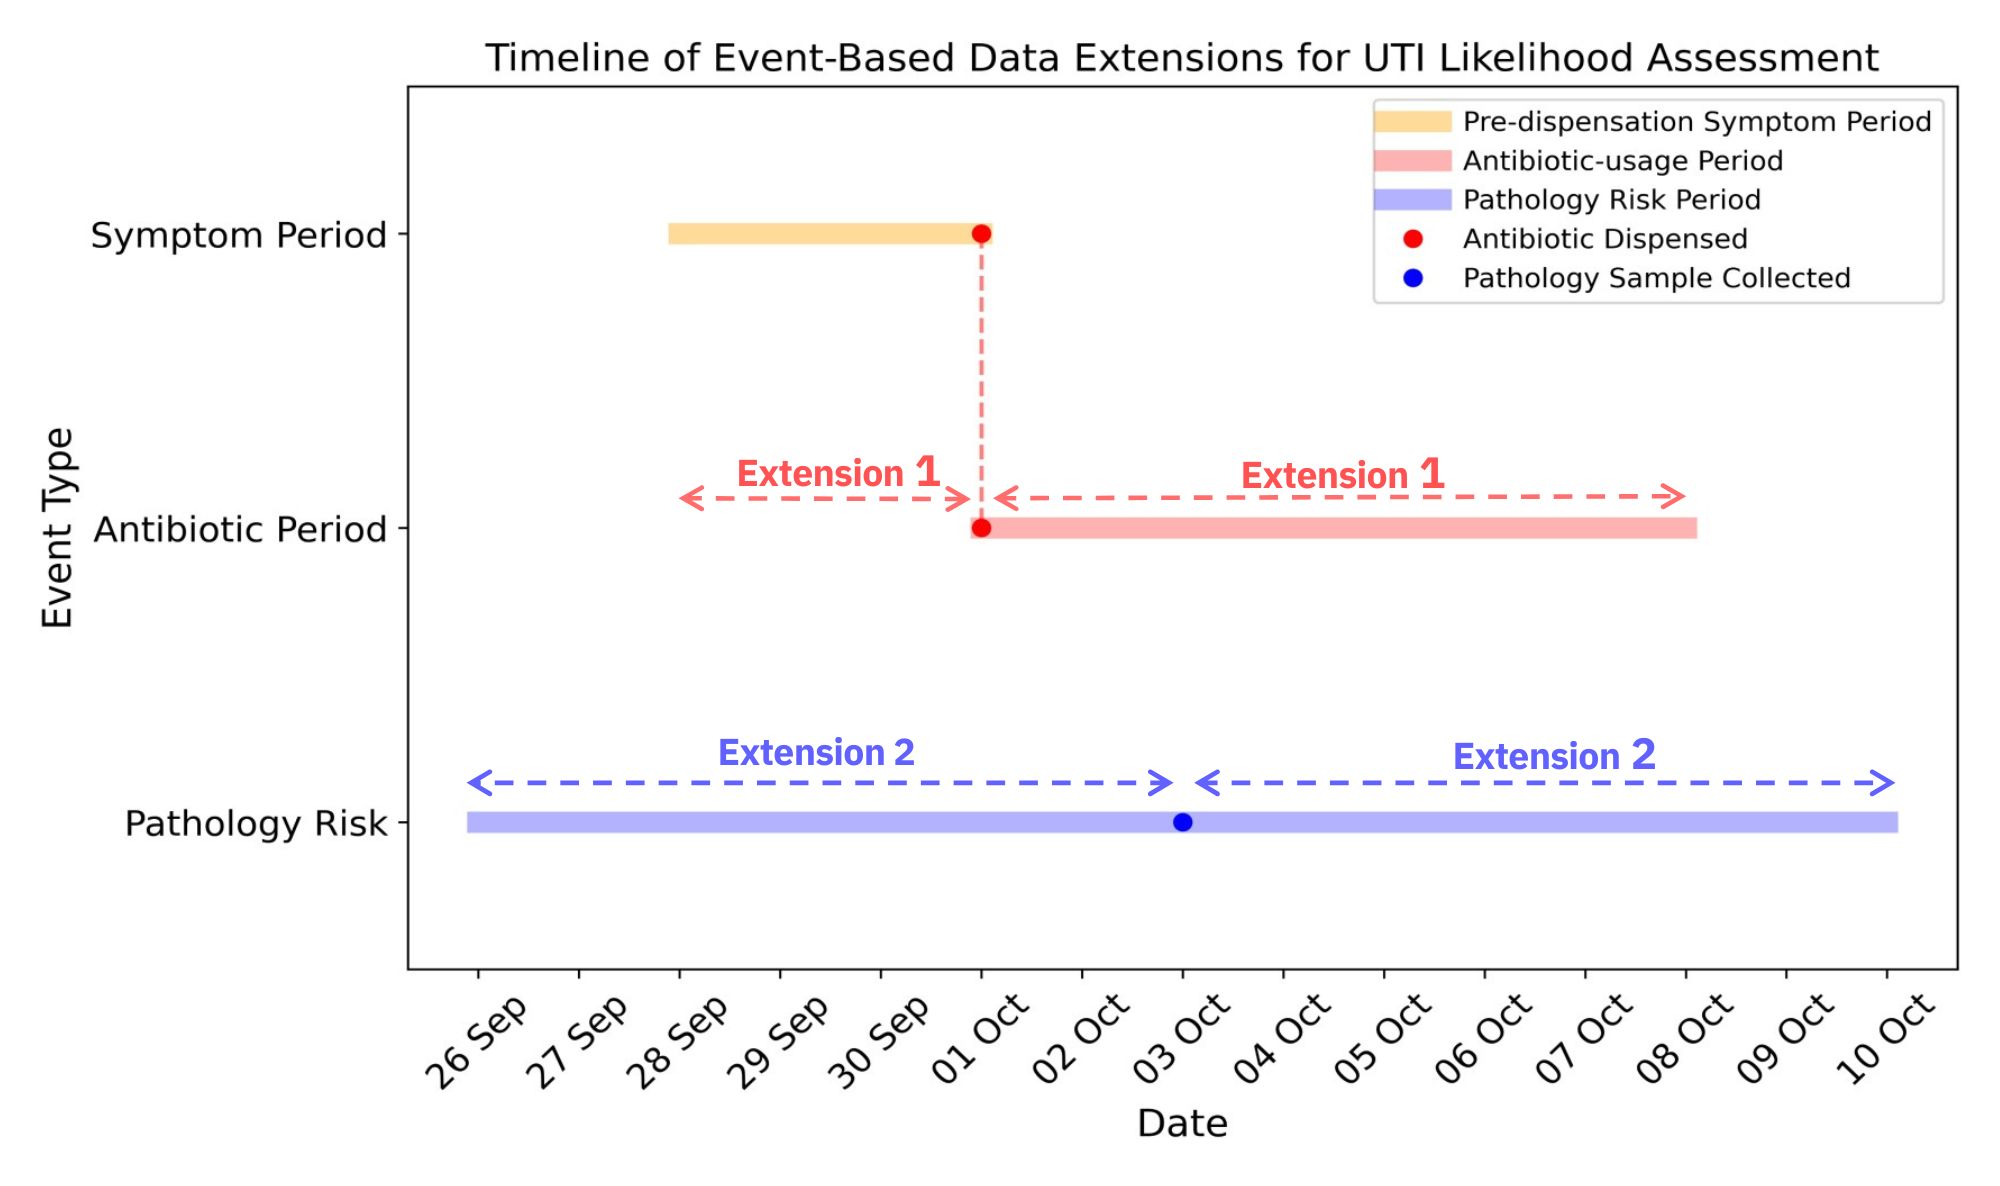
Data Extension 1
Given that a patient may have been symptomatic for days before receiving an antibiotic dispensation, we extend the data by marking a 3-day window prior to dispensation with the same antibiotic category based on clinical expertise. This accounts for the possibility that patients were already experiencing UTI symptoms before visiting a healthcare provider. Additionally, we estimate the duration of medication-usage based on prescribed dosage guidelines. For instance, if a patient is dispensed 28 tablets of Trimethoprim (500mg), we can infer the likely duration of treatment using local clinician guidelines or the World Health Organization’s defined daily dosage (DDD) guidelines for antibiotics (WHO 2024). This enables us to extend the presence of the antibiotic over a period of days, reflecting the ongoing impact of the medication on future UTI risk.
Data Extension 2
For pathology records indicating that a urine specimen was collected, we extend the potential UTI risk to cover a 7-day window before and after the specimen collection date according to clinical advice. This extension accounts for the time required for pathogens to grow, be detected, and treated in the culture.
Secondary care records, including hospital admissions and discharges, are marked with specific entry and exit dates. These dates are used to denote the period during which a UTI diagnosis is most likely to have occurred. However, since these records do not provide detailed temporal alignment for antibiotic treatment or pathology results, we do not extend these records in time.
The extended data generated through these strategies allows us to apply the UTI risk estimation framework more effectively, capturing a full picture of each patient’s clinical journey and providing a more robust risk assessment. Several examples using the framework with data extensions applied to infer the UTI likelihood are illustrated in A3 in Appendix.
5 Methodology
5.1 Data Preparation
During the 33-month data collection period (from October 1, 2019, to July 1, 2022), multiple potential occurrences of UTIs are identified for some patients, each assigned a likelihood score using the clinician-informed UTI risk estimation framework. As higher likelihood scores reflect greater confidence in the label, to boost the relatively small class sizes for the higher likelihoods, we selected the UTI occurrence with the highest likelihood within each patient’s observation window, favoring the most recent and confident estimate. For each patient, we extracted features from the 12-month period preceding this highest likelihood UTI event, as shown in Figure 1. This standardized observation window across all patients, enabling consistent identification of predictive risk factors influencing the likelihood of UTI occurrence within the next year. Features included in this study are listed in section A5 in Appendix.
For the control group, consisting of individuals with a UTI likelihood of 0, we sampled individuals in a manner that aligned with the temporal distribution of the UTI group (likelihood 0) across the years. This ensures that both the UTI and control groups had similar distribution of observation time-frames, facilitating a fair comparison between the two groups with respect to the distribution of timelines across the years and seasons.
To maintain uniformity in temporal analysis, patients with observation windows shorter than 12 months were excluded. Additionally, patients under the age of 18 and those with unknown or unspecified sex were removed to establish a more homogeneous cohort for analysis. The study workflow is described in section A4 in Appendix.
5.2 Modeling UTI Risk Categories
The clinician-informed UTI risk estimation framework categorizes patients into six distinct likelihood groups. To analyze predictive differences between adjacent risk groups and identify key features predicting transitions between categories, we developed a classification model using XGBoost (Chen and Guestrin 2016) and SHAP (SHapley Additive exPlanations) (Lundberg and Lee 2017) for enhancing explainability.
Pairwise models were constructed to differentiate each set of neighboring risk groups (e.g., 0 vs. 0.2, 0.2 vs. 0.4), with the higher-risk group within each pair considered the positive class. Data for each model was divided into training, validation, and testing sets with the ratio of (3:1:1). The modeling workflow and hyperparameter details for each pairwise model are provided in Appendix A4. These models aimed to identify the most important features distinguishing patients between adjacent UTI risk categories, providing insights about factors associated with an elevated risk of UTI. By leveraging SHAP explainable models, we assessed the impact of individual features on model predictions, aligning machine learning outputs with clinical understanding to ensure interpretability and transparency.
6 Results
6.1 Descriptive Analysis
The study population consisted of individuals categorized into UTI and control groups, with key demographic characteristics summarized in Table 1. Patients in the UTI group tend to be older on average than those in the control group, and a higher proportion of females are observed in the UTI group, reflecting the known epidemiology of UTIs. Additionally, the UTI group had a greater prevalence of comorbidities, such as dementia. In terms of living conditions, a higher proportion of patients in the UTI group were reported as housebound or residing in a nursing or caring Home, while these proportions were much lower in the control group.
| Demographic Information | Group | |
|---|---|---|
| UTI Group111Individuals with a UTI likelihood 0 | Control Group222Individuals with a UTI likelihood 0 | |
| N=147518 | N=610602 | |
| Age (years) | ||
| 18-24 | 9445 (6.4%) | 73137 (12.0%) |
| 25-44 | 49822 (33.8%) | 259189 (42.4%) |
| 45-64 | 37688 (25.5%) | 179170 (29.3%) |
| 65-84 | 39151 (26.5%) | 87452 (14.3%) |
| 85+ | 11412 (7.7%) | 11654 (1.9%) |
| Gender | ||
| Male | 45082 (30.6%) | 340534 (55.8%) |
| Female | 102436 (69.4%) | 270068 (44.2%) |
| Comorbidities | ||
| Incontinent Urinary | 538 (0.4%) | 405 (0.1%) |
| Dementia | 4693 (3.2%) | 3951 (0.6%) |
| Covid High Risk | 22433 (15.2%) | 23130 (3.8%) |
| Covid Increased Risk | 84644 (57.4%) | 185056 (30.3%) |
| Organ Transplant | 172 (0.1%) | 222 (0.0%) |
| Living Conditions | ||
| Housebound | 6750 (4.6%) | 4031 (0.7%) |
| Nursing/Caring Home | 3304 (2.2%) | 2651 (0.4%) |
| Homeless | 159 (0.1%) | 502 (0.1%) |
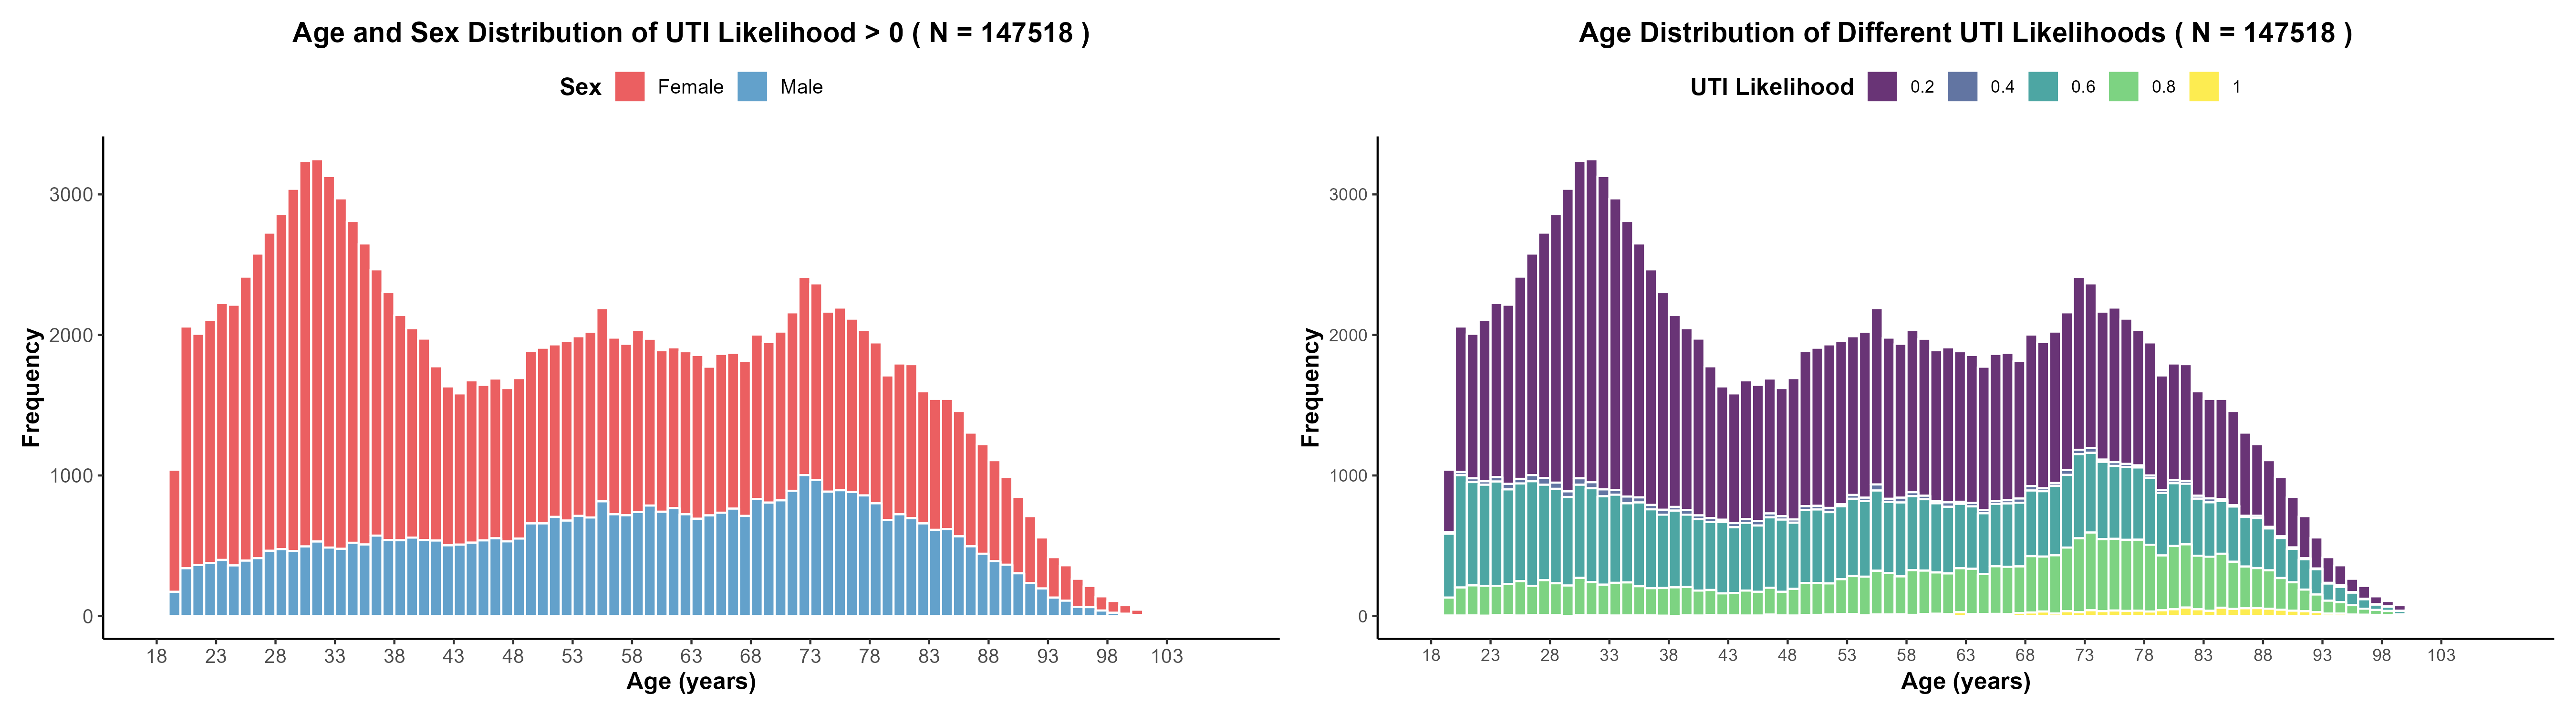
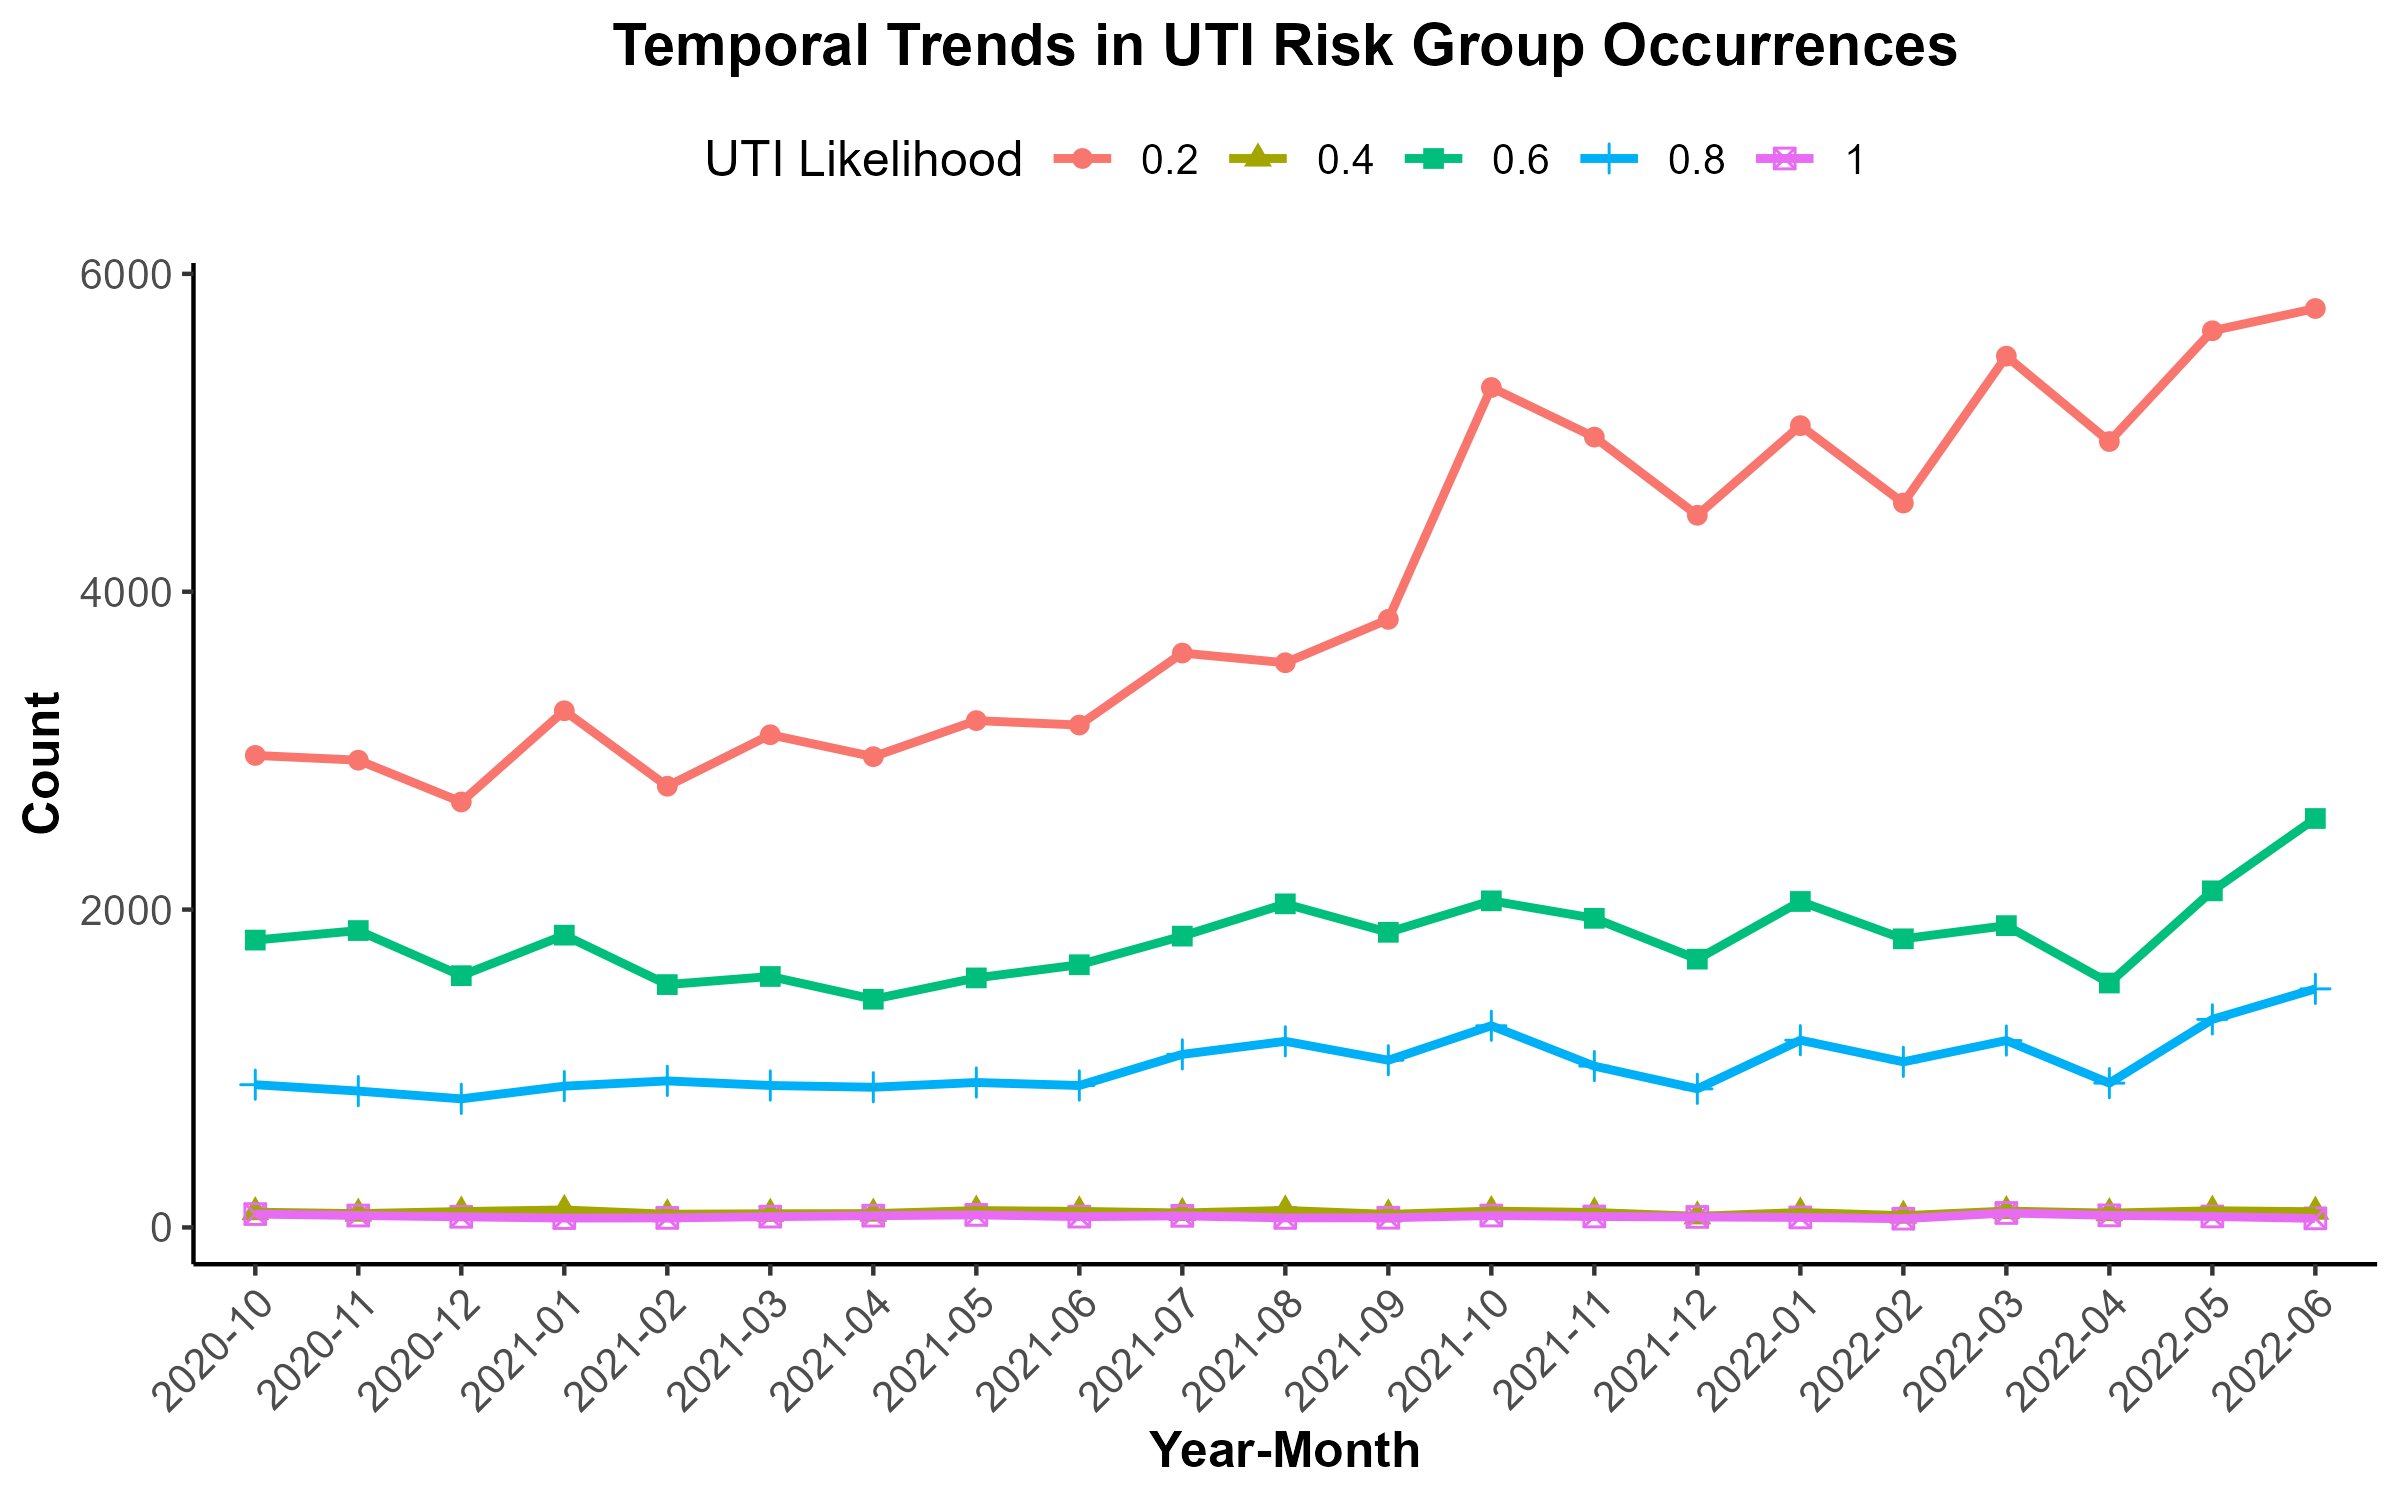
Figure 4 provides an overview of UTI distribution across age and gender, while the temporal distribution of patients across the five UTI likelihood categories (0.2 to 1.0) is shown in Figure 5.
An analysis of age and gender distributions reveals a distinct peak among females around the age o 30 within the 0.2 risk group, a pattern not observed in males. This observation may reflect demographic influences on clinical practices. The 0.2 risk group presents a significant proportion, while the 0.4 risk group is small, comprising patients who are dispensed antibiotics sometimes used for UTIs and with negative pathology results or findings involving bacteria rarely associated with UTIs. These risk groups capture cases where clinical suspicion of UTI exists, but uncertainty remains, resulting in a low likelihood risk score. The likelihood of 1.0 group, which corresponds to the highest certainty of UTI diagnosis (e.g., hospitalized patients who had ICD-10 codes confirming UTI), was limited by the relatively small number of severely ill patients in the dataset. From the temporal trend perspective, the 0.2 group shows an obvious increase after mid 2021. This may be attributed to challenges in accessing healthcare during the pandemic and a subsequent rise in clinical activities as restrictions were eased. Interestingly, a slight upward trend in the 0.6 and 0.8 groups after April 2022 is discovered, possibly reflecting the impact of policy changes or adjustments in clinical practices.
6.2 Model Performance and Feature Importance
To differentiate patients between neighbouring UTI likelihood categories, pairwise models were constructed for adjacent groups (e.g., 0 vs. 0.2, 0.2 vs. 0.4). Table 2 summarizes the performance metrics of these models over the testing set, including accuracy, precision, recall, F1-score, and AUC-ROC. Figure 6 displays the ROC curves for all the pairwise models, providing a visual comparison of their discriminative ability across the adjacent UTI risk categories.
| Model | Accuracy | Precision | Recall | F1-score | AUC-ROC |
|---|---|---|---|---|---|
| 0.0 vs 0.2 | 0.90 | 0.77 | 0.28 | 0.41 | 0.80 |
| 0.2 vs 0.4 | 0.98 | 0.01 | 0.01 | 0.01 | 0.62 |
| 0.4 vs 0.6 | 0.95 | 0.95 | 1.00 | 0.98 | 0.78 |
| 0.6 vs 0.8 | 0.74 | 0.74 | 0.40 | 0.52 | 0.73 |
| 0.8 vs 1.0 | 0.96 | 0.73 | 0.46 | 0.56 | 0.98 |
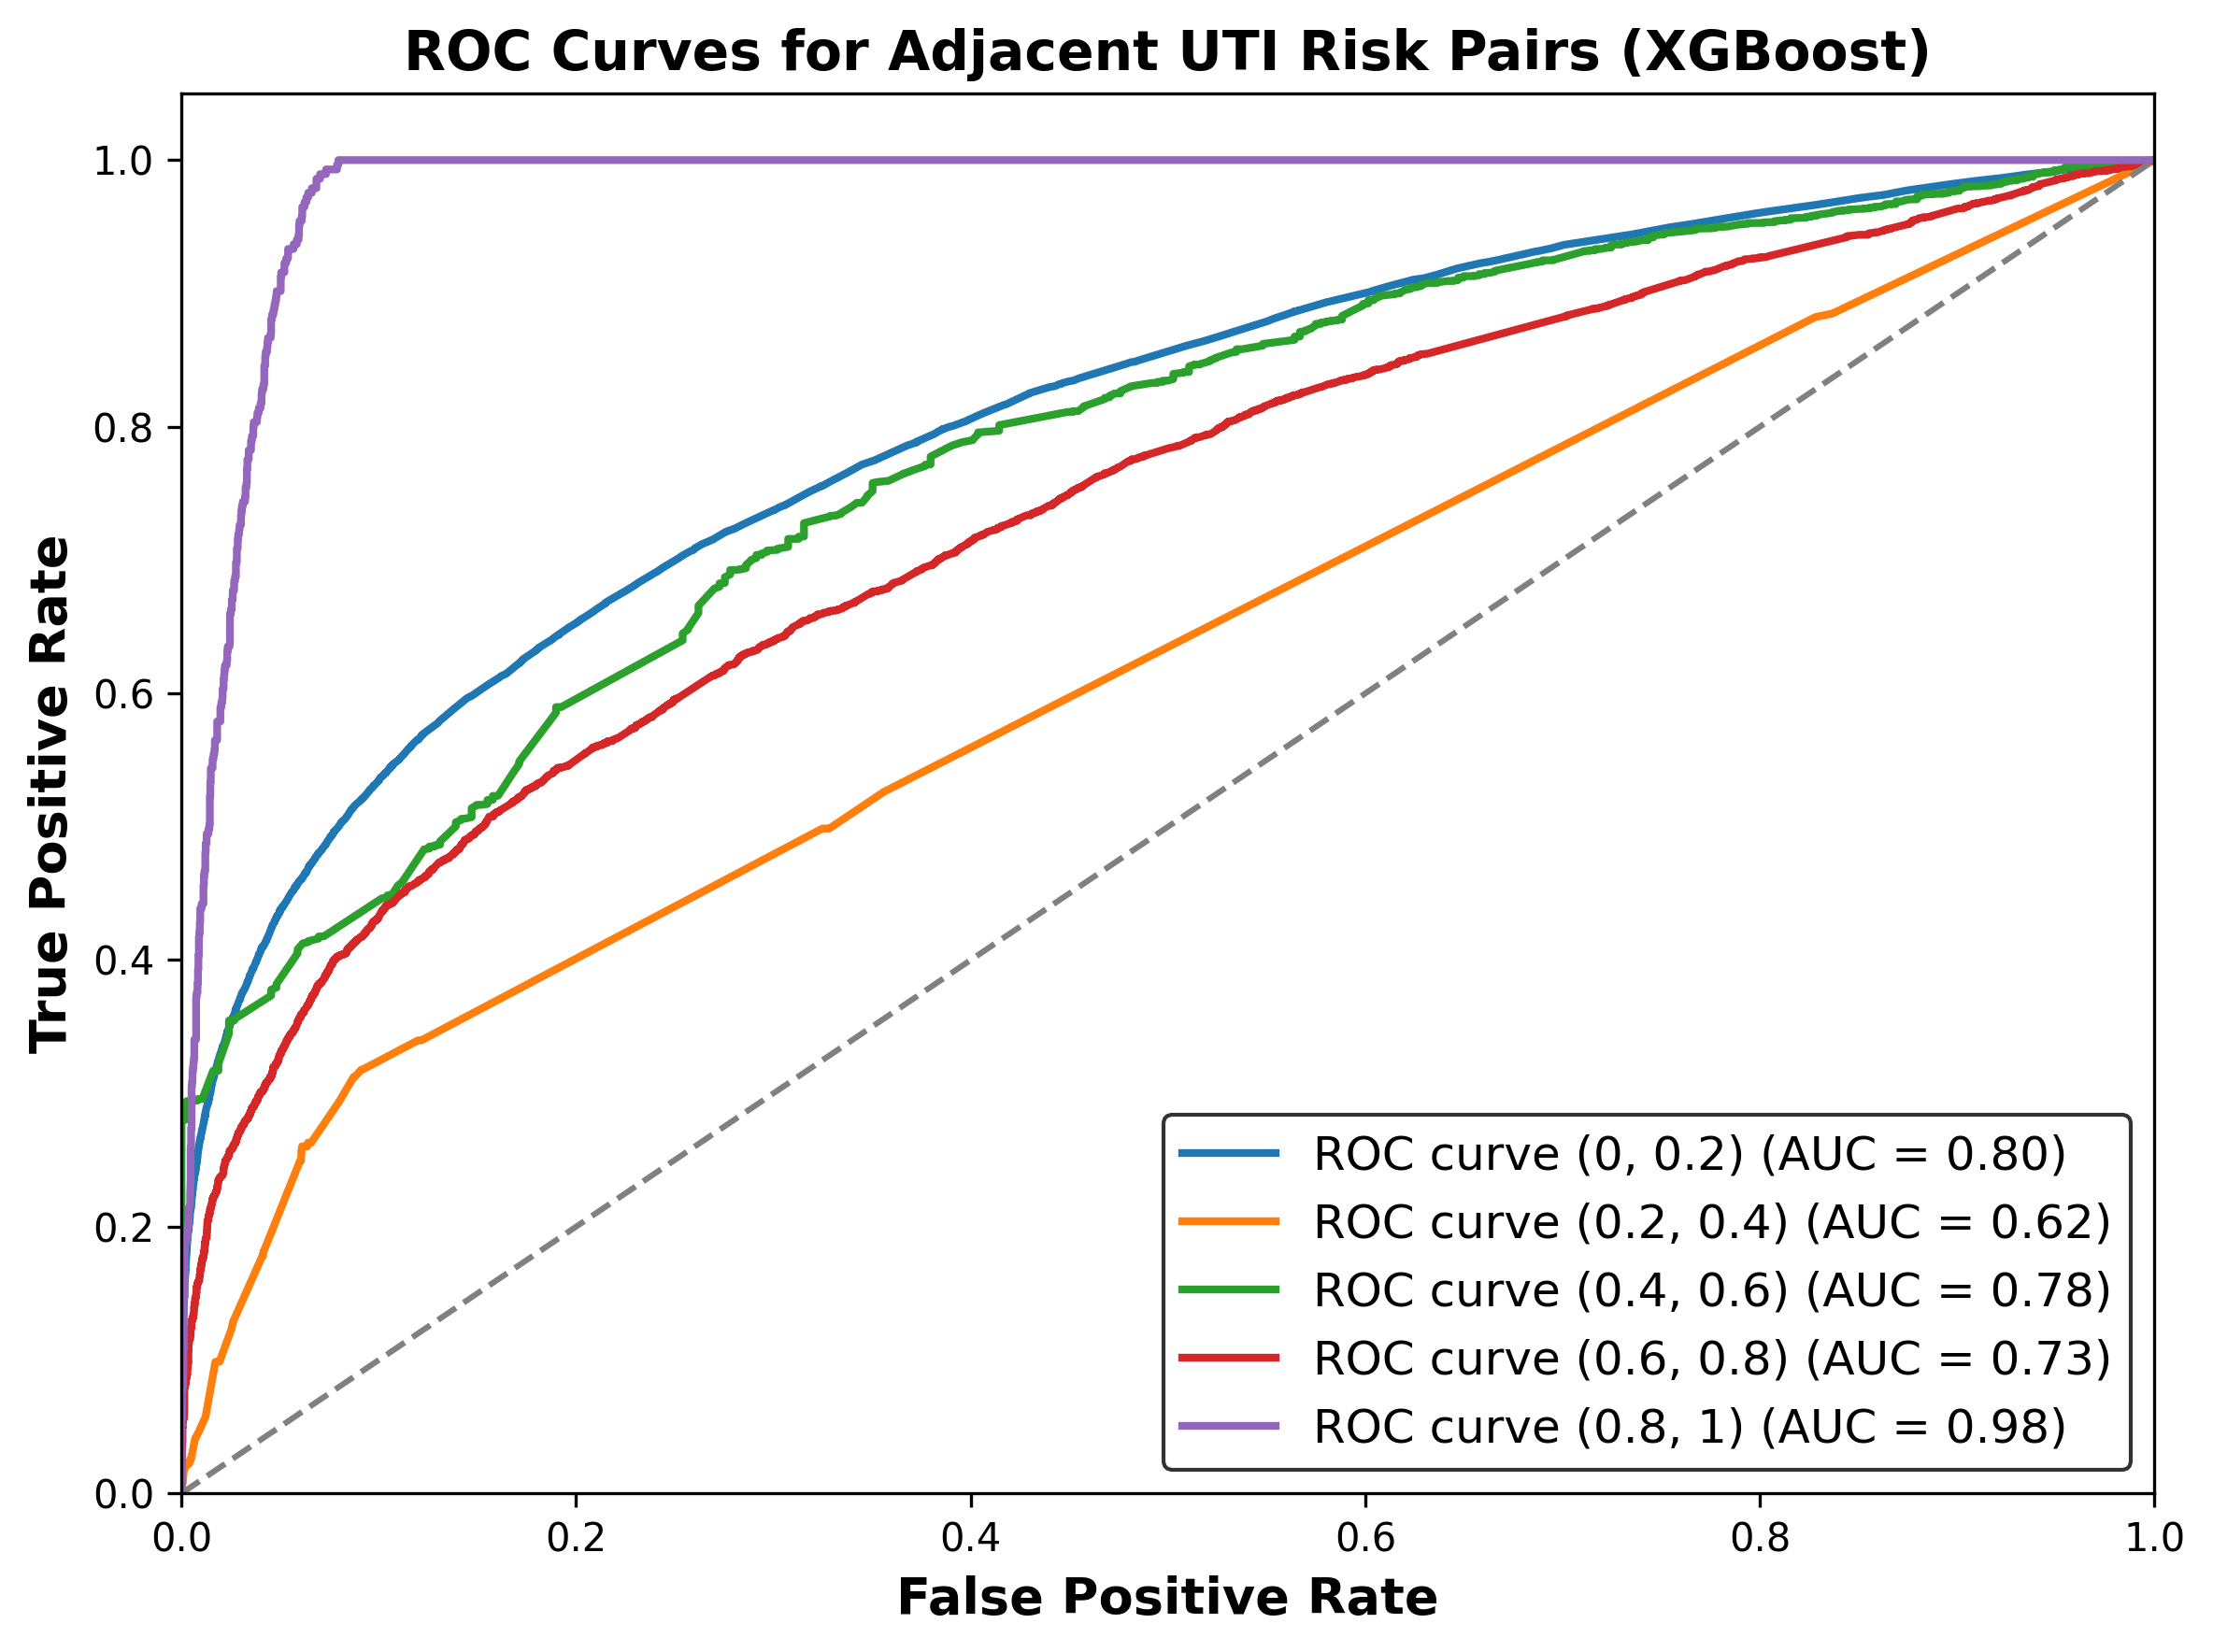
The models demonstrate varying effectiveness in distinguishing between adjacent UTI risk groups. The 0.0 vs 0.2 model achieves high accuracy (0.90) and an AUC-ROC of 0.80, but its low recall suggests difficulty in identifying true positives with subtle feature differences. The 0.2 vs 0.4 model has high accuracy but performs poorly in other metrics, likely due to extreme class imbalance. In contrast, the 0.4 vs 0.6 model performs relatively well in distinguishing each other across all metrics. This result aligns with human expectations of risk categorization, as the natural threshold at 0.5 intuitively separates patients with higher likelihood scores above 0.5 from those below 0.5. However, the AUC-ROC of 0.78 still indicates some challenges in distinguishing between these adjacent risk groups. The 0.6 vs 0.8 model shows moderate performance (AUC-ROC 0.73) but the recall (0.40) and F1-score (0.52) suggest that the model has limitations in detecting instances of the higher-risk group. Finally, the 0.8 vs 1.0 model achieves excellent discrimination with an AUC-ROC of 0.98, though its lower recall and precision reflects some misclassification, likely due to class imbalance of the positive class in this model.
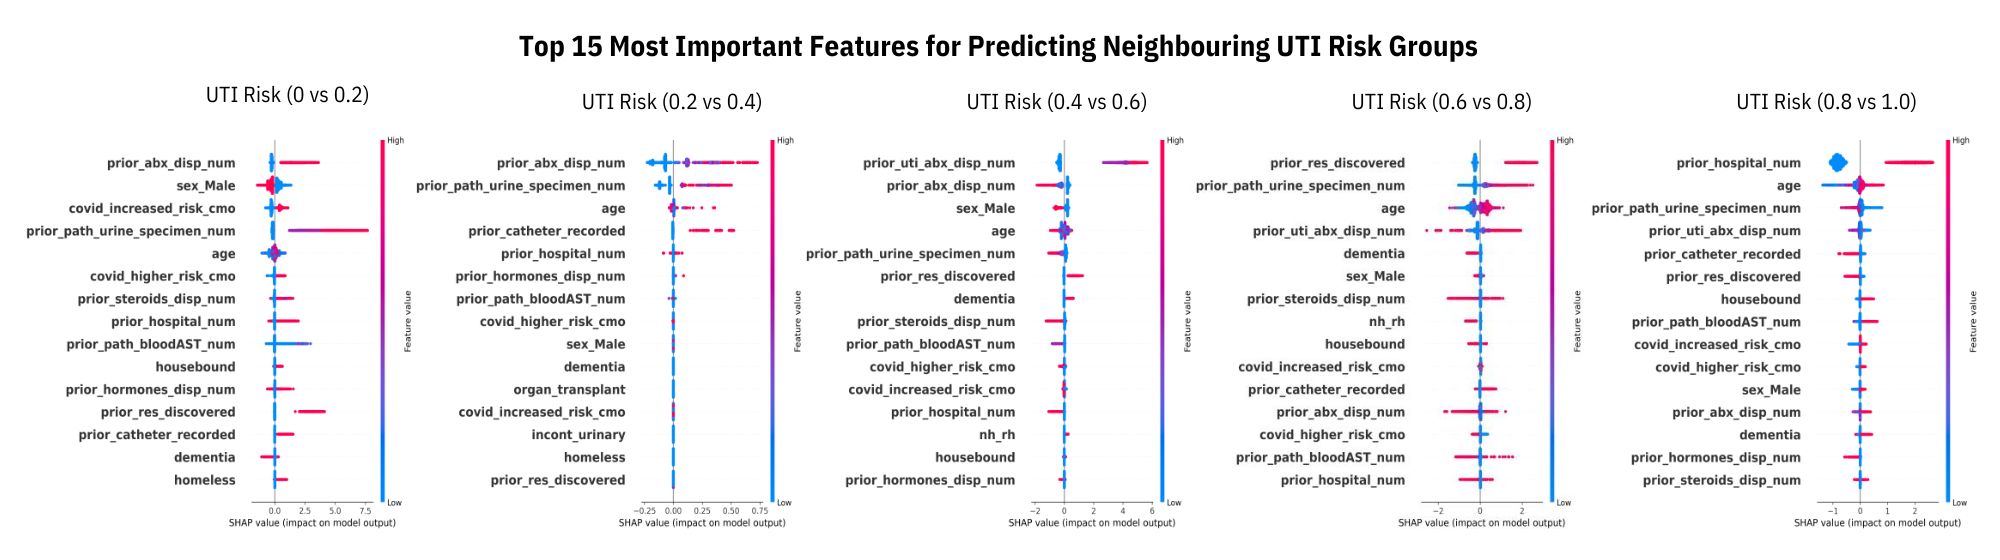
The SHAP summary plots (Figure 7) provide insights for each pairwise comparison of adjacent UTI risk categories. Key patterns and trends were observed, reflecting the evolving importance of clinical and demographic features across the UTI likelihood groups. Features such as the number of previous antibiotics dispensed and the number of urine specimens processed are critical in distinguishing low-likelihood risk groups, highlighting the relevance of prior clinical interventions in shaping risk predictions for less certain UTI cases. In the 0.4 vs 0.6 model, the focus shifted towards more specific clinical features, such as the number of UTI-specific antibiotics dispensed. This model also highlighted the growing importance of comorbidities, including dementia and prior resistance discoveries, which became more significant in distinguishing the intermediate risk groups. For the 0.6 vs 0.8 and 0.8 vs 1.0 models, age displayed a clearer trend, with older patients more likely to be classified in the higher-risk groups. Features such as prior resistance discoveries and the number of urine specimens processed were dominant in the model of the 0.6 vs 0.8. The model that differentiates patients with hospital-confirmed UTI diagnoses, further highlighted severe case predictors such as the number of blood specimens processed, COVID-19 risk histories, housebound status, dementia.
These findings demonstrate the progressive shift in feature importance, from general clinical and demographic variables in lower-risk comparisons to more specific and severe clinical factors in higher-risk groups. The clearer trend for age in higher-risk categories aligns with clinical expectations, reinforcing the interpretability of the models and their alignment with the clinical expectations.
7 Discussion
In this paper, we introduced a unique linked EHR dataset and detailed our pre-processing and curation methods tailored for UTI prediction. This enriched dataset integrates information from multiple healthcare settings, offering potential for advancing AI-driven healthcare solutions. However, it also presents several limitations. For instance, the dispensation data we acquired differs from the prescribing records commonly used in similar studies. Dispensation data records medications dispensed to patients rather than prescribed, providing a more accurate representation of actual medication usage. Nevertheless, it does not confirm whether patients completed the course or initialized it at all. Additionally, while urine sample processing data is included in the dataset, discrepancies may arise because the processing date may not align with the date the sample was collected, introducing potential temporal inconsistencies. Our initial clinician-guided framework for data annotation facilitates supervised learning and reflects how clinicians assess UTI risk based on three primary variables. However, this framework is based on current clinical practice and depends on a restricted set of clinical indicators, potentially overlooking subtle or unrecognized factors influencing UTI risk. Moreover, the 0.4 risk group contains relatively few cases, which may affect the robustness of the analysis. To address this, merging it with other groups, guided by AI to explore possible combinations, could potentially enhance reliability. Addressing the challenges posed by incomplete data and the lack of explicit UTI labels remains critical. These limitations introduce uncertainty into the analysis, emphasizing the importance of robust estimation methods to enhance the reliability of risk assessment. Future work will aim to refine this approach by transitioning to explainable AI-based predictive models capable of uncovering latest risk groups as well as broader patterns, providing greater insights into predictive factors and modifiable risk factors.
Our study highlights the critical role of integrating data curation, risk estimation frameworks, and interpretable AI techniques to improve the real-world applicability of predictive models in healthcare. By leveraging a diverse and enriched dataset, we aim to advance not only the accuracy of predictive analytics but also their equity and effectiveness, ultimately contributing to better healthcare solutions.
Appendix A Appendices
For additional details and information, please refer to the appendix file available at the following link: Appendix
Acknowledgements
This project is supported by funding from Engineering and Physical Sciences Research Council (EPSRC). The authors thank Debbie Campbell and Elizabeth Jonas for their time and effort in reviewing.
References
- Barchitta et al. (2021) Barchitta, M.; Maugeri, A.; Favara, G.; Mura, I.; and Agodi, A. 2021. Cluster analysis identifies patients at risk of catheter-associated urinary tract infections in intensive care units: findings from the SPIN-UTI Network. Journal of Hospital Infection, 107: 57–63.
- BusinessInformationBNSSG (2022) BusinessInformationBNSSG. 2022. SWD. Github Repository https://github.com/BusinessInformationBNSSG/SWD. Accessed: 2024-11-16.
- Chen and Guestrin (2016) Chen, T.; and Guestrin, C. 2016. XGBoost: A Scalable Tree Boosting System. In Proceedings of the 22nd ACM SIGKDD, KDD ’16, 785–794. New York, NY, USA: Association for Computing Machinery. ISBN 9781450342322.
- DiSantostefano (2010) DiSantostefano, J. 2010. Getting to Know the ICD-10-CM. The Journal for Nurse Practitioners, 6(2): 149–150.
- Ghassemi et al. (2020) Ghassemi, M.; Naumann, T.; Schulam, P.; and Ranganath, R. 2020. A review of challenges and opportunities in machine learning for health. AMIA Summits on Translational Science Proceedings, 2020: 191.
- Iscoe et al. (2024) Iscoe, M.; Socrates, V.; Gilson, A.; and Taylor, R. A. 2024. Identifying signs and symptoms of urinary tract infection from emergency department clinical notes using large language models. Academic Emergency Medicine, 31(6): 599–610.
- Jakobsen et al. (2023) Jakobsen, R.; Nielsen, T.; Leutscher, P.; and Koch, K. 2023. Clinically explainable machine learning models for early identification of patients at risk of hospital-acquired urinary tract infection. Journal of Hospital Infection.
- Jeng et al. (2022a) Jeng, S.-L.; Huang, Z.-J.; Yang, D.-C.; Teng, C.-H.; and Wang, M.-C. 2022a. Machine learning to predict the development of recurrent urinary tract infection related to single uropathogen, Escherichia coli. Scientific Reports, 12.
- Jeng et al. (2022b) Jeng, S.-L.; Huang, Z.-J.; Yang, D.-C.; Teng, C.-H.; and Wang, M.-C. 2022b. Machine learning to predict the development of recurrent urinary tract infection related to single uropathogen, Escherichia coli. Scientific Reports, 12.
- Johnson et al. (2023) Johnson, A.; Bulgarelli, L.; Shen, L.; Celi, L.; and Mark, R. 2023. MIMIC-IV, a freely accessible electronic health record dataset. Scientific Data, 10: 1.
- Khan (2022) Khan, I. 2022. XAI Model for the Diagnosis of Urinary Tract Infections in Emergency Care Patients. Mathematical Modelling of Engineering Problems, 9: 971–978.
- King et al. (2014) King, J.; Patel, V.; Jamoom, E. W.; and Furukawa, M. F. 2014. Clinical Benefits of Electronic Health Record Use: National Findings. Health Services Research, 49(1pt2): 392–404.
- Lecky et al. (2020) Lecky, D. M.; Howdle, J.; Butler, C. C.; and McNulty, C. A. 2020. Optimising management of UTIs in primary care: a qualitative study of patient and GP perspectives to inform the development of an evidence-based, shared decision-making resource. British Journal of General Practice, 70(694): e330–e338.
- Lundberg and Lee (2017) Lundberg, S. M.; and Lee, S.-I. 2017. A unified approach to interpreting model predictions. In Proceedings of the 31st NeurIPS, NIPS’17, 4768–4777. Red Hook, NY, USA: Curran Associates Inc. ISBN 9781510860964.
- Menachemi and Collum (2011) Menachemi, N.; and Collum, T. H. 2011. Benefits and drawbacks of electronic health record systems. Risk Management and Healthcare Policy, 4: 47–55. PMID: 22312227.
- Møller, Sørensen, and Hardahl (2021) Møller, J.; Sørensen, M.; and Hardahl, C. 2021. Prediction of risk of acquiring urinary tract infection during hospital stay based on machine-learning: A retrospective cohort study. PLOS ONE, 16: e0248636.
- NHS (2006) NHS, ed. 2006. OPCS Classification of Interventions and Procedures Version 4.3. London: Connecting for Health The Stationery Office. ISBN 0 11 322732 9.
- NHS England (2024) NHS England. 2024. SNOMED CT. https://digital.nhs.uk/services/terminology-and-classifications/snomed-ct. Accessed: 2024-11-21.
- Pessach and Shmueli (2022) Pessach, D.; and Shmueli, E. 2022. A Review on Fairness in Machine Learning. ACM Comput. Surv., 55(3).
- Pollard et al. (2018) Pollard, T.; Johnson, A.; Raffa, J.; Celi, L.; Mark, R.; and Badawi, O. 2018. The eICU Collaborative Research Database, a freely available multi-center database for critical care research. Scientific Data, 5: 180178.
- Richter and Khoshgoftaar (2018) Richter, A. N.; and Khoshgoftaar, T. M. 2018. A review of statistical and machine learning methods for modeling cancer risk using structured clinical data. Artificial Intelligence in Medicine, 90: 1–14.
- Stamm and Norrby (2001) Stamm, W. E.; and Norrby, S. R. 2001. Urinary Tract Infections: Disease Panorama and Challenges. The Journal of Infectious Diseases, 183(Supplement-1): S1–S4.
- Tjoa and Guan (2021) Tjoa, E.; and Guan, C. 2021. A Survey on Explainable Artificial Intelligence (XAI): Toward Medical XAI. IEEE TNNLS, 32(11): 4793–4813.
- UK ONS (2011) UK ONS. 2011. Office for National Statistics - Census geographies. https://www.ons.gov.uk/methodology/geography/ukgeographies/censusgeographies/2011censusgeographies. Accessed: 2024-11-21.
- WHO (2024) WHO. 2024. ATC/DDD Index 2024. https://atcddd.fhi.no/atc˙ddd˙index/. Accessed: 2024-11-21.
- Xie et al. (2022) Xie, F.; Yuan, H.; Ning, Y.; and Liu, N. 2022. Deep learning for temporal data representation in electronic health records: A systematic review of challenges and methodologies. Journal of Biomedical Informatics, 126: 103980.