[2]\fnmLun \surYu
1]\orgdivDepartment of Biomedical Informatics, \orgnameNational University of Singapore, \orgaddress\postcode119077, \countrySingpaore
[2]\orgnameMetanovas Biotech, \orgaddress\street905 W Middlefield Rd, \cityMountain View, \postcode94043, \stateCA, \countryUSA
3]\orgnameMetaNovas BioTechnology, \orgaddress\cityShanghai, \postcode201203, \countryChina
4]\orgdivDepartment, \orgnameSoutheast University, \orgaddress\cityNanjing, \postcode210018, \stateJiangsu, \countryChina
Can artificial intelligence predict clinical trial outcomes?
Abstract
The increasing complexity and cost of clinical trials, particularly in the context of oncology and advanced therapies, pose significant challenges for drug development. This study evaluates the predictive capabilities of large language models (LLMs) such as GPT-3.5, GPT-4, and HINT in determining clinical trial outcomes. By leveraging a curated dataset of trials from ClinicalTrials.gov, we compare the models’ performance using metrics including balanced accuracy, specificity, recall, and Matthews Correlation Coefficient (MCC). Results indicate that GPT-4o demonstrates robust performance in early trial phases, achieving high recall but facing limitations in specificity. Conversely, the HINT model excels in recognizing negative outcomes, particularly in later trial phases, offering a balanced approach across diverse endpoints. Oncology trials, characterized by high complexity, remain challenging for all models. Additionally, trial duration and disease categories influence predictive performance, with longer durations and complex diseases such as neoplasms reducing accuracy. This study highlights the complementary strengths of LLMs and HINT, providing insights into optimizing predictive tools for clinical trial design and risk management. Future advancements in LLMs are essential to address current gaps in handling negative outcomes and complex domains.
keywords:
Clinical Trial, Large Language Models (LLMs), Artificial Intelligence1 Introduction
The global clinical trial market has shown continuous growth in recent years. By 2030, the global clinical trial market size is expected to reach 78.3 billion USD[1], with a compound annual growth rate (CAGR) of 5.8% during the forecast period[2]. However, the complexity and cost of clinical trials present significant challenges for companies and research institutions. Advances in drug development, particularly the rise of gene therapies and biologics, have heightened the complexity of clinical trials, leading to greater difficulties in trial design, patient recruitment, and data management[3]. In addition, the requirement for large patient populations, especially in Phase III clinical trials, coupled with extended trial durations and escalating costs, exacerbates these challenges[4]. Studies have shown that the median cost of Phase I clinical trials is $3.4 million, Phase II trials cost $8.6 million, and Phase III trials escalate to $21.4 million[5]. Furthermore, the median duration of non-oncology clinical trials ranges from 5.9 to 7.2 years, while oncology trials have a significantly longer median duration of 13.1 years[6]. To address these issues, an increasing number of research institutions and companies have begun exploring the potential of artificial intelligence in accelerating drug development, optimizing trial design, and reducing costs.
Artificial Intelligence in healthcare is rapidly expanding, and one emerging area where AI is making an impact is in predicting clinical trial outcome prediction tasks. In recent years, many researchers have employed deep learning methods to predict clinical trial outcomes. For example, Schperberg et al. used a random forest model to predict oncology outcomes in randomized clinical trials[7]. Similarly, Qaiser et al. employed a weakly supervised survival convolutional neural network (WSS-CNN) with a visual attention mechanism to predict overall survival rates[8]. These studies highlight the potential of artificial intelligence in forecasting clinical trial results. Notably, Fu et al. developed the HINT model, a hierarchical interaction network model that leverages multimodal data such as drug properties, disease information, and trial eligibility criteria to generate embedding vectors[9]. This model employs a dynamic attention-based graph neural network to capture the interactive effects among various trial elements, aiming to predict trial success.
However, these models still have certain limitations. Most are tailored to specific disease categories or clinical trial endpoints, which restricts their applicability and limits their ability to handle diverse and complex data types. Additionally, previous studies often require standardized data inputs and cannot automatically predict clinical trial outcomes directly from protocol documents. Large language models, with their advanced natural language processing capabilities, may address these challenges by processing unstructured text and providing more generalized predictive capabilities.
Large language models (LLMs), with their advanced natural language understanding capabilities, offer flexibility and generalizability in various applications [10]. By training on extensive clinical data and literature, LLMs can uncover latent patterns and complex relationships, demonstrating unique advantages in the decision-making process of drug development. Previous studies have applied large language models to clinical trial prediction tasks with promising results. For instance, Reinisch et al. used LLMs to predict clinical trial phase transitions[11]. Lai et al. evaluated the risk of bias in randomized clinical trials using LLMs[12]. Jin et al. employed LLMs to match patients to appropriate clinical trials[13], and Markey et al. utilized LLMs to assist in writing clinical trial documents[14]. These examples illustrate that LLMs exhibit a high degree of adaptability in handling diverse trial data and flexible data formats, showing promising potential, particularly in the complex field of trial outcome prediction. Therefore, we considered whether LLMs could be used to predict the likelihood of clinical trial success, enabling us to anticipate trial outcomes and address potential issues that may lead to trial failure [15].
In this work, we evaluated the capabilities of mainstream LLMs and the HINT model in predicting clinical trial outcomes. We curated and annotated a dataset of clinical trial information based on the Clinical Trials Database[16] and employed these models to perform the predictive task. Subsequently, we assessed the model performance using various metrics to demonstrate the application potential of LLMs in this context. Our analysis aims to offer new insights for risk prediction and trial design in future drug development.
2 Results
2.1 Prediction on the Entire Clinical Trial Dataset
The test results across all models on the complete dataset are shown in the table below. We observed that the GPT-4o model performed the best in terms of balanced accuracy and MCC, reaching a balanced accuracy of 0.573 and an MCC of 0.212(Table 1). Although its recall was high at 0.931, its specificity remained relatively low at 0.214, suggesting a tendency to over-classify trials as successful while overlooking some potential failed trials.
GPT-4mini and GPT-4, while achieving perfect recall (1), exhibited extremely low specificity (0 and 0.083, respectively), indicating a strong bias toward predicting all cases as positive, resulting in balanced accuracies of 0.500 and 0.542. GPT-3.5 also demonstrated this trend with a recall of 0.997 and a specificity of 0.011, leading to a balanced accuracy of 0.504.
The llama3 Llama3 model achieved moderate recall (0.949) but low specificity (0.085), resulting in a balanced accuracy of 0.517 and a low MCC of 0.058, indicating limited effectiveness in correctly identifying negative samples.
Among all models, the HINT model achieved the highest specificity at 0.541, which contributed to its relatively strong balanced accuracy of 0.563 and an MCC of 0.111. Despite having lower recall and balanced accuracy compared to other models, HINT’s ability to identify negative cases suggests a more balanced performance across positive and negative samples.
| Model | Balanced_acc | MCC | Recall | Specificity |
|---|---|---|---|---|
| gpt4mini | 0.500 | 0.000 | 1.000 | 0.000 |
| gpt4o | 0.573 | 0.212 | 0.931 | 0.214 |
| gpt4 | 0.542 | 0.234 | 1.000 | 0.083 |
| gpt3.5 | 0.504 | 0.049 | 0.997 | 0.011 |
| HINT | 0.563 | 0.111 | 0.586 | 0.541 |
| llama3 | 0.517 | 0.058 | 0.949 | 0.085 |
2.2 Prediction of Different Clinical Trial Phases
As clinical trials progress from Phase I to Phase III, different models exhibit varying trends in metrics such as balanced accuracy, Matthews correlation coefficient (MCC), and specificity. GPT-4o demonstrates relatively stable balanced accuracy across all phases, while the HINT model shows a gradual improvement in specificity.
In Phase I (Table 2), GPT-4o and GPT-4 achieve relatively high balanced accuracies of 0.557 and 0.600, respectively, but their specificities are low, at 0.40 and 0.20. This indicates certain limitations in identifying negative samples. GPT-3.5 and llama3 also have low specificities, and GPT-4mini has a specificity of 0, showing a complete lack of ability to recognize negative samples. In contrast, the HINT model attains a balanced accuracy of 0.562 and a specificity of 0.50, demonstrating certain advantages in balancing the detection of positive and negative samples.
In Phase II, GPT-4o maintains its balanced accuracy at 0.556, exhibiting stability, and its MCC increases to 0.277, although its specificity only slightly rises to 0.111. GPT-4’s balanced accuracy slightly improves to 0.571, with an MCC of 0.319 and a marginal increase in specificity to 0.143. The HINT model’s balanced accuracy slightly decreases to 0.516, but its specificity further increases to 0.532, indicating continuous improvement in identifying negative samples. GPT-3.5 and llama3 show minimal gains in specificity, and their ability to recognize negative samples remains limited.
By Phase III, GPT-4o achieves its best performance, with balanced accuracy increasing to 0.667 and MCC reaching 0.509. Its specificity also improves to 0.333, continuing to display relatively stable performance. The HINT model further enhances its performance in this phase, achieving a balanced accuracy of 0.699 and a significant increase in specificity to 0.696. This demonstrates a balanced capability in recognizing both positive and negative samples. GPT-3.5 and llama3 still exhibit low specificities and weak abilities in identifying negative samples, while GPT-4mini’s specificity remains at 0 across all phases.
| Phase | Model | Balanced_acc | MCC | Recall | Specificity |
|---|---|---|---|---|---|
| Phase 1 Results | |||||
| 1 | gpt4mini | 0.500 | 0.000 | 1.000 | 0.000 |
| 2 | gpt4o | 0.557 | 0.120 | 0.714 | 0.400 |
| 3 | gpt4 | 0.600 | 0.333 | 1.000 | 0.200 |
| 4 | gpt3.5 | 0.498 | -0.034 | 0.997 | 0.000 |
| 5 | HINT | 0.562 | 0.126 | 0.625 | 0.500 |
| 6 | llama3 | 0.538 | 0.121 | 0.927 | 0.150 |
| Phase 2 Results | |||||
| 1 | gpt4mini | 0.500 | 0.000 | 1.000 | 0.000 |
| 2 | gpt4o | 0.556 | 0.277 | 1.000 | 0.111 |
| 3 | gpt4 | 0.571 | 0.319 | 1.000 | 0.143 |
| 4 | gpt3.5 | 0.505 | 0.060 | 0.997 | 0.013 |
| 5 | HINT | 0.516 | 0.030 | 0.500 | 0.532 |
| 6 | llama3 | 0.526 | 0.086 | 0.943 | 0.109 |
| Phase 3 Results | |||||
| 1 | gpt4mini | 0.500 | 0.000 | 1.000 | 0.000 |
| 2 | gpt4o | 0.667 | 0.509 | 1.000 | 0.333 |
| 3 | gpt4 | 0.622 | 0.394 | 0.995 | 0.250 |
| 4 | gpt3.5 | 0.502 | 0.023 | 0.995 | 0.009 |
| 5 | HINT | 0.699 | 0.312 | 0.703 | 0.696 |
| 6 | llama3 | 0.512 | 0.048 | 0.966 | 0.059 |
Overall, GPT-4o shows relatively stable balanced accuracy throughout the phases, whereas the HINT model exhibits a progressively increasing trend in specificity. The applicability of different models varies at each phase; the HINT model performs more balancedly in the later stages, while GPT-4o is suitable for scenarios where high specificity is not a primary requirement due to its stable balanced accuracy.
2.3 Prediction on Clinical Trials Across Different Disease Categories
The distribution of diseases across different model datasets is shown in the figure. (Fig.1 A) Neoplasms consistently make up the largest portion of the dataset(30%-37%), while respiratory diseases have the smallest representation(5%-9%). Other categories, such as digestive system diseases, nervous system diseases, and endocrine/metabolic diseases, are also present in notable proportions across all models. Additionally, the ”Other” category (for example: Diseases of the eye and adnexa, Diseases of the ear and mastoid process, Diseases of the skin and subcutaneous tissue) appears prominently in the overall distribution. The models exhibit distinct strengths and limitations when predicting clinical trials across different disease categories (Table 3).For example, the HINT model achieved high average accuracy in ”Diseases of the respiratory system” and ”Diseases of the digestive system,” reaching about 0.75, while the large language models showed lower accuracy for these two categories, around 0.5.
The HINT model, while not leading in any specific category, showed stable performance, achieving a balanced accuracy of 0.704 and an MCC of 0.276 in digestive system diseases. A notable observation is the significant representation of oncology trials in the dataset, where none of the models performed well; all scored below their overall averages in both balanced accuracy and MCC. The HINT model, in particular, struggled in oncology trials with a low balanced accuracy (0.326) and MCC (0.141), suggesting that the high complexity and challenging nature of these trials negatively impacted model performance.
Regarding trial complexity, the clinical trial complexity score developed by Markey et al. ranks oncology trials as the most complex across all categories[14]. Additionally, the Tufts Center for the Study of Drug Development (CSDD) reports that oncology trials surpass other fields in both complexity and duration[17]. In our study, statistical analysis revealed that oncology trials have an average duration approximately 1,000 days longer than other trials. Even trials classified as short-term within oncology would still be considered relatively long compared to trials in other categories (Fig.1 B).
In terms of recall, large language models consistently achieved high rates, indicating strong capability in identifying positive cases across various disease categories. However, the HINT model showed a low recall rate of 0.227 in oncology-related diseases, reflecting its limited ability to recognize positive cases in this challenging category. Conversely, for diseases such as endocrine, nutritional, and metabolic disorders, the HINT model achieved a higher recall rate of 0.875, indicating a stronger capacity for identifying positive cases within these categories.
Despite the limited number of experiments, GPT-4o displayed strong recognition of negative samples, especially in respiratory and digestive diseases, where it identified all negative cases. Other models, like Llama, performed considerably worse, showing almost no detection of negative samples. Although the HINT model’s specificity was not as high as GPT-4o’s, it remained stable in respiratory and non-pathological diseases.
Overall, the HINT model showed consistent performance across various datasets. GPT-4mini and GPT-3.5, however, performed poorly across all disease categories, suggesting a lack of discriminatory ability. Similarly, while llama demonstrated some classification ability, it was limited and only evident in a few categories. The large proportion of oncology trials, coupled with the models’ limited performance in this category, likely contributed to their overall performance limitations. This analysis highlights that each model has particular strengths in specific disease categories, but the challenges posed by oncology trials significantly impact their overall effectiveness.
| Model | Disease Category | Trails Count | Balanced_acc | MCC | Recall | Specificity |
| Model: gpt4mini | ||||||
| Diseases of the respiratory system | 3 | 0.500 | 0.0 | 1.000 | 0.0 | |
| Endocrine, nutritional and metabolic diseases | 6 | 1.000 | 0.0 | 1.000 | 0.0 | |
| Neoplasms | 18 | 0.500 | 0.0 | 1.000 | 0.0 | |
| Diseases of the digestive system | 3 | 0.000 | 0.0 | 0.000 | 0.0 | |
| Diseases of the nervous system | 5 | 0.500 | 0.0 | 1.000 | 0.0 | |
| Non-pathological diseases | 6 | 0.500 | 0.0 | 1.000 | 0.0 | |
| Other | 2 | 0.500 | 0.0 | 1.000 | 0.0 | |
| Model: gpt4o | ||||||
| Diseases of the respiratory system | 3 | 1.000 | 1.000 | 1.000 | 1.000 | |
| Endocrine, nutritional and metabolic diseases | 6 | 0.833 | 0.000 | 0.833 | 0.000 | |
| Neoplasms | 18 | 0.526 | 0.081 | 0.909 | 0.143 | |
| Diseases of the digestive system | 3 | 0.333 | 0.000 | 0.000 | 0.333 | |
| Diseases of the nervous system | 5 | 0.667 | 0.408 | 1.000 | 0.333 | |
| Non-pathological diseases | 6 | 1.000 | 1.000 | 1.000 | 1.000 | |
| Other | 2 | 0.750 | 0.638 | 1.000 | 0.500 | |
| Model: gpt4 | ||||||
| Diseases of the respiratory system | 3 | 1.000 | 1.000 | 1.000 | 1.000 | |
| Endocrine, nutritional and metabolic diseases | 5 | 1.000 | 0.00 | 1.000 | 0.000 | |
| Neoplasms | 15 | 0.500 | 0.00 | 1.000 | 0.000 | |
| Diseases of the digestive system | 3 | 0.333 | 0.000 | 0.000 | 0.333 | |
| Diseases of the nervous system | 5 | 0.667 | 0.408 | 1.000 | 0.333 | |
| Non-pathological diseases | 5 | 0.500 | 0.000 | 1.000 | 0.000 | |
| Other | 2 | 0.786 | 0.670 | 1.000 | 0.571 | |
| Model: gpt3.5 | ||||||
| Diseases of the respiratory system | 148 | 0.491 | -0.060 | 0.983 | 0.000 | |
| Endocrine, nutritional and metabolic diseases | 173 | 0.500 | 0.000 | 1.000 | 0.000 | |
| Neoplasms | 712 | 0.501 | 0.012 | 0.996 | 0.005 | |
| Diseases of the digestive system | 192 | 0.525 | 0.155 | 0.994 | 0.056 | |
| Diseases of the nervous system | 241 | 0.497 | -0.040 | 0.994 | 0.000 | |
| Non-pathological diseases | 410 | 0.497 | -0.038 | 0.992 | 0.001 | |
| Other | 287 | 0.506 | 0.057 | 0.996 | 0.015 | |
| Model: HINT | ||||||
| Diseases of the respiratory system | 15 | 0.808 | 0.419 | 0.615 | 1.000 | |
| Endocrine, nutritional and metabolic diseases | 27 | 0.438 | -0.125 | 0.875 | 0.000 | |
| Neoplasms | 132 | 0.375 | -0.255 | 0.227 | 0.523 | |
| Diseases of the digestive system | 27 | 0.741 | 0.381 | 0.682 | 0.800 | |
| Diseases of the nervous system | 38 | 0.681 | 0.356 | 0.696 | 0.667 | |
| Non-pathological diseases | 74 | 0.576 | 0.130 | 0.595 | 0.556 | |
| Other | 70 | 0.575 | 0.117 | 0.718 | 0.431 | |
| Model: Llama | ||||||
| Diseases of the respiratory system | 23 | 0.562 | 0.181 | 0.923 | 0.200 | |
| Endocrine, nutritional and metabolic diseases | 35 | 0.484 | -0.053 | 0.969 | 0.000 | |
| Neoplasms | 124 | 0.531 | 0.116 | 0.954 | 0.108 | |
| Diseases of the digestive system | 27 | 0.496 | -0.009 | 0.850 | 0.143 | |
| Diseases of the nervous system | 39 | 0.492 | -0.024 | 0.893 | 0.091 | |
| Non-pathological diseases | 46 | 0.562 | 0.302 | 1.000 | 0.125 | |
| Other | 324 | 0.533 | 0.108 | 0.947 | 0.119 | |
2.4 Prediction for Different Clinical Endpoints Trials
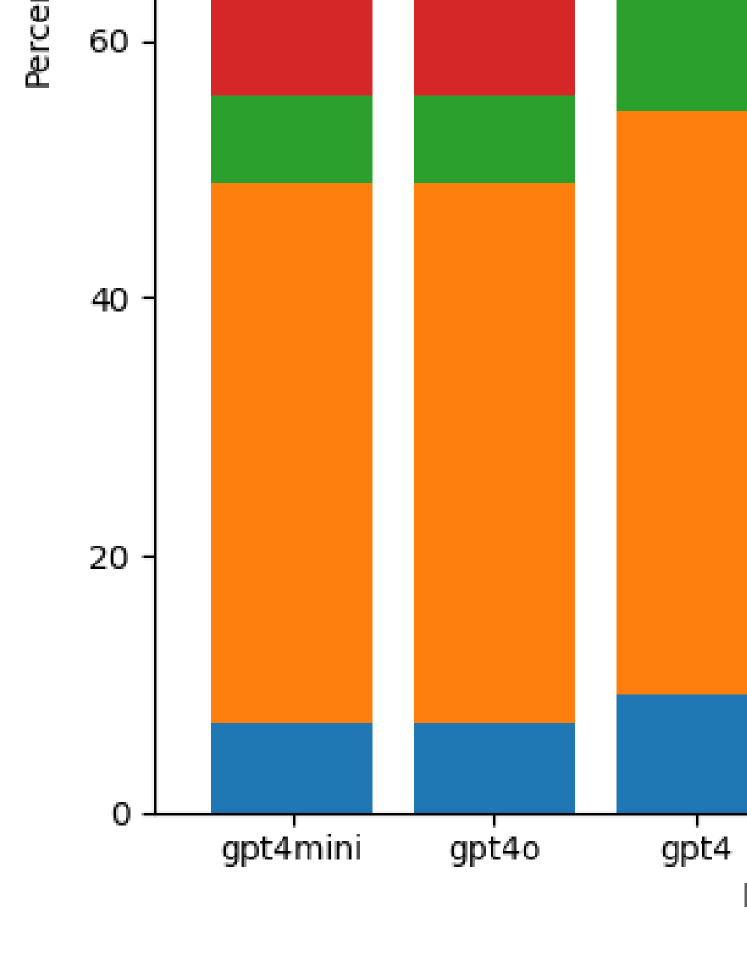
The figure (Fig.1 C) illustrates the distribution of clinical trial outcomes across different model datasets(Table 4). Overall Survival (OS) dominates the outcome categories for all models, consistently representing around 64-70% of the data. Objective Response Rate (ORR) follows as the second most represented category, ranging from 6% to 11%. Progression-Free Survival (PFS) is included in a smaller proportion, around 3-4% across models. Safety indicators (AE and SAE) occupy a small portion, varying between 1.6% and 4.9%. Lastly, the ”Other” category (for example: Relapse-Free Survival, Pharmacokinetic Parameters, Patient-Reported Outcomes) accounts for around 14-19% of the outcomes across the datasets. Most clinical trials prioritize Overall Survival (OS) as the primary endpoint, and model performance on OS closely mirrors their balanced accuracy and MCC values.
Despite the small number of classifications for each clinical trial endpoint, GPT-4mini did not demonstrate the ability to predict clinical trial outcomes in any category. The same results were observed in GPT-3.5. Both models showed balanced accuracy around 0.5 and MCC values all below 0.1. Furthermore, the recall for these two models across all categories was close to 1, with specificity near 0, indicating that they tended to classify all clinical trial outcomes as ”success” across all clinical trial endpoint categories.
For other models, performance across different clinical trial endpoint categories showed similar trends. For instance, among all models that exhibited some recognition capability, the ability to identify clinical trials with Overall Survival (OS) as the endpoint was the strongest. For GPT-4o and GPT-4, balanced accuracy in this category was significantly above the average (0.614 and 0.562). This phenomenon was also observed in HINT and Llama3.
Safety indicators (AE and SAE) also demonstrated some recognition capabilities in these models. Although performance in this category was not as strong as in the OS category, metrics for GPT-4, GPT-4o, HINT, and Llama3 were all above random classification. In particular, GPT-4o’s specificity in this category reached 0.5, marking the highest level achieved by large language models in this experiment.
For other clinical trial classifications, such as Objective Response Rate (ORR), Progression-Free Survival (PFS), and other uncategorized endpoints, most of these models did not exhibit classification capabilities. Metrics for these models remained at random classification levels. Notably, for GPT-4o, which typically performed well, the MCC for ORR was -0.167, even below 0. Similarly, the usually stable HINT model showed MCC values of -0.022 and -0.12 in these two categories.
Nonetheless, the specificity of the HINT model remained much higher than that of the large language models. This suggests that HINT still maintained a relatively strong ability to recognize negative cases in these categories.
| Model | Endpoint | Trials Number | Balanced_acc | MCC | Recall | Specificity |
|---|---|---|---|---|---|---|
| Model: gpt4mini | ||||||
| Overall Survival (OS) | 28 | 0.500 | 0.0 | 1.000 | 0.0 | |
| Objective Response Rate (ORR) | 10 | 0.500 | 0.0 | 1.000 | 0.0 | |
| Progression-Free Survival (PFS) | 5 | 0.500 | 0.0 | 1.000 | 0.0 | |
| Safety Indicators (AE and SAE) | 12 | 0.500 | 0.0 | 1.000 | 0.0 | |
| Others | 13 | 0.000 | 0.0 | 1.000 | 0.0 | |
| Model: gpt4o | ||||||
| Overall Survival (OS) | 28 | 0.614 | 0.278 | 1.000 | 0.333 | |
| Objective Response Rate (ORR) | 10 | 0.438 | -0.167 | 0.968 | 0.438 | |
| Progression-Free Survival (PFS) | 5 | 0.500 | 0.000 | 0.946 | 0.0 | |
| Safety Indicators (AE and SAE) | 12 | 0.583 | 0.169 | 0.962 | 0.500 | |
| Others | 13 | 0.517 | 0.000 | 0.962 | 0.158 | |
| Model: gpt4 | ||||||
| Overall Survival (OS) | 20 | 0.562 | 0.281 | 1.000 | 0.125 | |
| Objective Response Rate (ORR) | 9 | 0.500 | 0.000 | 1.000 | 0.000 | |
| Progression-Free Survival (PFS) | 5 | 0.500 | 0.000 | 1.000 | 0.0 | |
| Safety Indicators (AE and SAE) | 9 | 0.600 | 0.316 | 1.000 | 0.200 | |
| Others | 7 | 1.000 | 0.000 | 1.000 | 0.062 | |
| Model: gpt3.5 | ||||||
| Overall Survival (OS) | 1423 | 0.504 | 0.044 | 1.000 | 0.013 | |
| Objective Response Rate (ORR) | 409 | 0.499 | -0.023 | 0.998 | 0.000 | |
| Progression-Free Survival (PFS) | 163 | 0.506 | 0.040 | 0.998 | 0.029 | |
| Safety Indicators (AE and SAE) | 614 | 0.500 | -0.007 | 0.998 | 0.004 | |
| Others | 463 | 0.504 | 0.000 | 0.998 | 0.012 | |
| Model: HINT | ||||||
| Overall Survival (OS) | 252 | 0.548 | 0.085 | 0.596 | 0.515 | |
| Objective Response Rate (ORR) | 74 | 0.488 | -0.022 | 0.616 | 0.565 | |
| Progression-Free Survival (PFS) | 38 | 0.446 | -0.120 | 0.619 | 0.692 | |
| Safety Indicators (AE and SAE) | 89 | 0.516 | 0.034 | 0.605 | 0.366 | |
| Others | 67 | 0.511 | 0.000 | 0.605 | 0.566 | |
| Model: llama | ||||||
| Overall Survival (OS) | 205 | 0.545 | 0.152 | 0.935 | 0.133 | |
| Objective Response Rate (ORR) | 61 | 0.507 | 0.018 | 0.952 | 0.111 | |
| Progression-Free Survival (PFS) | 26 | 0.476 | -0.098 | 0.951 | 0.000 | |
| Safety Indicators (AE and SAE) | 88 | 0.528 | 0.081 | 0.954 | 0.161 | |
| Others | 45 | 0.507 | 0.000 | 0.954 | 0.062 | |
2.5 Prediction on different clinical trial period
We observe that for all models, balanced accuracy declines as clinical trial duration increases. Even GPT-4o, which generally performs best among the large language models, sees its balanced accuracy drop from 0.875 for shorter trials to 0.588 for longer trials, a performance barely above random chance. The typically stable HINT model experiences a more drastic decline, with balanced accuracy falling from 0.705 to 0.300, indicating poor prediction capability on extended-duration trials. Its performance on medium-length trials also only marginally exceeds random prediction levels(Table 5).
When examining specificity, the HINT model again shows a declining trend over time, indicating decreased ability to recognize negative cases in longer trials. In contrast, GPT-4, GPT-4o, and other large language models either improve or remain consistent in specificity, demonstrating better or stable performance in recognizing negative samples over longer trials.
This trend suggests that while all models face challenges in predicting outcomes for trials with extended durations, the HINT model struggles particularly in adapting to long-term trials. For these cases, GPT-4 and GPT-4o may offer better positive class identification and more reliable negative class identification in shorter trials, showing relatively higher balanced accuracy and MCC.
| Model | Trial Period | Balanced Accuracy | MCC | Recall | Specificity |
| Model: gpt4mini | |||||
| short-term trials | 1.000 | 0.000 | 1.000 | 0.000 | |
| medium-length trials | 0.500 | 0.000 | 1.000 | 0.000 | |
| long-term trials | 0.500 | 0.000 | 1.000 | 0.000 | |
| Model: gpt4o | |||||
| short-term trials | 0.875 | 0.000 | 0.875 | 0.000 | |
| medium-length trials | 0.625 | 0.316 | 0.917 | 0.333 | |
| long-term trials | 0.562 | 0.265 | 1.000 | 0.125 | |
| Model: gpt4 | |||||
| short-term trials | 1.000 | 0.000 | 1.000 | 0.000 | |
| medium-length trials | 0.500 | 0.000 | 1.000 | 0.000 | |
| long-term trials | 0.583 | 0.320 | 1.000 | 0.167 | |
| Model: gpt3.5 | |||||
| short-term trials | 0.509 | 0.087 | 0.997 | 0.020 | |
| medium-length trials | 0.502 | 0.029 | 0.996 | 0.008 | |
| long-term trials | 0.500 | 0.000 | 1.000 | 0.000 | |
| Model: HINT | |||||
| short-term trials | 0.675 | 0.285 | 0.721 | 0.630 | |
| medium-length trials | 0.519 | 0.034 | 0.521 | 0.517 | |
| long-term trials | 0.333 | -0.342 | 0.211 | 0.455 | |
| Model: llama | |||||
| short-term trials | 0.566 | 0.215 | 0.966 | 0.167 | |
| medium-length trials | 0.483 | -0.065 | 0.942 | 0.024 | |
| long-term trials | 0.548 | 0.145 | 0.929 | 0.167 | |
2.6 Terminated trials and prediction of termination
Large language models (such as the GPT series and Llama) performed poorly in predicting outcomes for these trials, with accuracy around 0.1 or lower, indicating their difficulty in handling the complex external factors causing trial termination(Table 6). Consequently, we excluded “terminated” trials from further analyses to avoid biasing the experimental results. While large language models could not identify trial termination, the HINT model demonstrated this ability, with stable accuracy across all clinical trial statuses, similar to its performance on the entire dataset, showcasing its effectiveness in distinguishing terminated trials.
| Model | HINT | GPT3.5 | GPT4o | GPT4mini | GPT4 | Llama3 |
| Accuracy | 0.614 | 0.032 | 0.110 | 0.021 | 0.040 | 0.067 |
3 Methods
3.1 Clinical Trials Data Curation and Processing
The clinical trial data used in this study were sourced from the ClinicalTrials.gov database[16]. We selected trials based on the following criteria[17]:
-
•
Population: all genders and all age groups.
-
•
Study Phase: limited to Phase 1, Phase 2, and Phase 3 trials.
-
•
Study Type: interventional studies only.
-
•
Availability of results: trials with available results data.
Additionally, we restricted the primary completion date of the trials according to the cut-off dates corresponding to the training periods of different models:
-
•
GPT-3.5 [18]: trained till October 2021; we acquired 3,811 valid clinical trial records.
-
•
HINT [9]: training checkpoint as of April 2022; we obtained a total of 2,304 records.
-
•
Llama3 [19]: trained till March 2023; we collected 725 records.
- •
Regarding trial status, we excluded categories with a very low number of records, such as ”RECRUITING” (only two records) and ”SUSPENDED” (only three records). The final retained trial statuses included ”COMPLETED,” ”TERMINATED,” and ”ACTIVE_NOT_RECRUITING.” The distribution of trial statuses indicated that the ”COMPLETED” trials constituted the largest portion, dominating the dataset used (Fig2B).
Through this filtering process, we extracted key information for each trial, including the title, brief summary, primary outcome measures, and study status for subsequent analysis. These data covered several critical aspects, including baseline characteristics, adverse events, participant flow, outcome measures, and supplementary information such as protocols and contact details.
For most of our analyses, we retained clinical trial data with the status
3.2 Model Selection
In this study, we have chosen to analyze several popular LLMs, both open-source and closed-source, alongside the deep learning model HINT. The LLMs we selected include OpenAI’s closed-source models GPT-3.5, GPT-4, GPT-4o, and GPT-4mini, as well as the open-source model Llama 3 (Llama 8B-Instruct). Following (Table 7) provides specific parameters and configurations for each model.
3.3 Clinical Trials’ Label
To label the outcomes of clinical trials, we employed the GPT-4 model to analyze and annotate the trial outcome data[23]. GPT-4 was tasked with classifying each trial as either ”Success” or ”Failure” based on the provided primary and secondary outcome information. Subsequently, human experts reviewed these labels by cross-referencing them with the actual trial outcomes to ensure accuracy. In subsequent analyses, we excluded data with a ” terminated ” status because we found that the LLMs lacked the ability to accurately recognize trial termination. Figure(Fig2 C) illustrates the proportion of different labels across various trial statuses within the entire dataset.
3.4 Clinical Trials’ Prediction
During the prediction phase of the experiment, we applied several language models, including the GPT family, including GPT-3.5, GPT-4, GPT-4o, GPT-4mini and Llama3, to predict the outcomes of clinical trials. The GPT models are accessed via the OpenAI API, while the Llama 3 model was deployed locally. The input context provided to the models included the trial title, summary, conditions, interventions, primary outcome measures, and trial type. We prompted the models with the following instruction:
Use the following information to predict whether the outcome of the clinical trial will be a success or a failure. And only reply one word of the following: success or failure.
We then parsed the response returned by the models to obtain the final prediction results.(Fig.2 D)
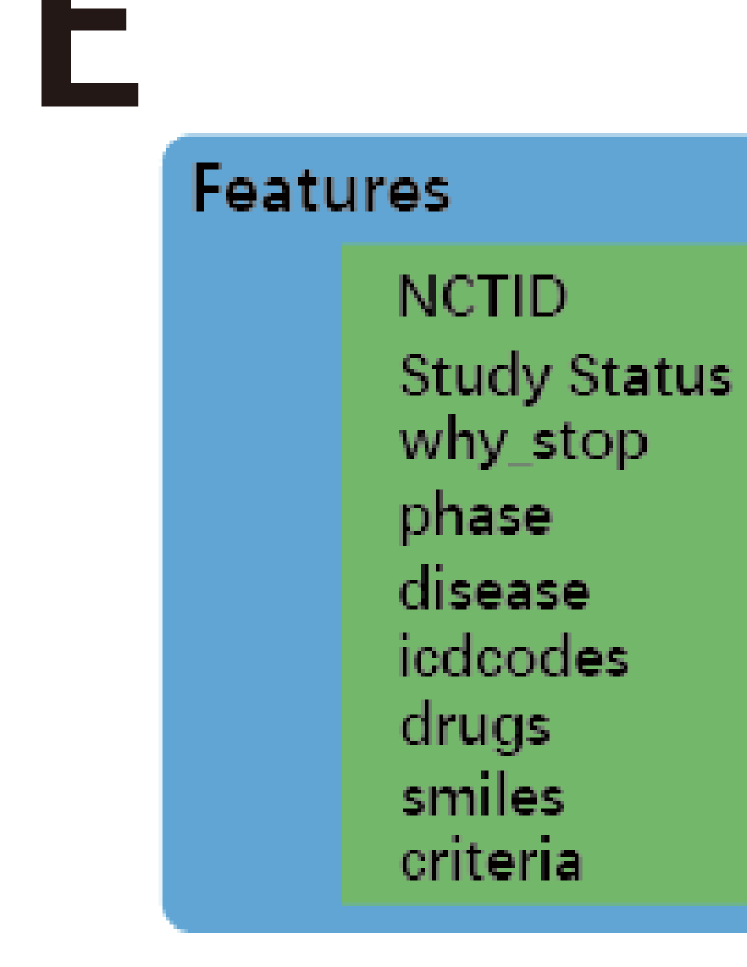
For the HINT model, we input data in the required format [9], including the SMILES[24] sequence information of the drug and the ICD-10 code of the studied disease(Fig.2 E). Following the preprocessing steps outlined by Fu et al.[bib29], we categorized the data based on the trial phase before feeding it into the HINT model for prediction. The model output is a probability of trial success; results with a success probability greater than 0.5 were labeled as “Success,” while those with a probability less than or equal to 0.5 were labeled as “Failure”.
3.5 Keywords Extraction
We conducted a keyword extraction analysis on the reasons for clinical trial termination and their primary endpoints. We utilized a network tool called Keyword Extractor[25], which is built on a language model and has demonstrated strong performance in keyword extraction tasks. By extracting keywords from these fields and calculating their frequencies, we aimed to identify common termination reasons and the primary focuses of the trials[26]. This process helped us better understand the factors contributing to trial terminations and the main objectives of the studies.
3.6 Metrics Selected
We employed multiple evaluation metrics to analyze the performance of the models, including Balanced Accuracy,Matthews Correlation Coefficient, Recall, and Specificity:
-
•
Balanced Accuracy: The average of sensitivity and specificity, useful for class-imbalanced data. It reflects the model’s performance across both classes, offering a balanced view compared to traditional accuracy.
-
•
Matthews Correlation Coefficient (MCC): A correlation measure using all categories in the confusion matrix. Ranging from -1 to +1, it’s ideal for imbalanced datasets, where +1 indicates perfect classification, 0 is random, and -1 is complete misclassification.
-
•
Recall (Sensitivity): The proportion of true positives correctly identified among all actual positives. This metric measures the model’s ability to capture relevant instances and avoid false negatives.
-
•
Specificity: The proportion of true negatives correctly identified among all actual negatives. It indicates how well the model avoids false positives by correctly identifying negative cases.
These metrics allow for a comprehensive evaluation of the models’ predictive capabilities.
| Name | Version | Training Cut-off Date |
|---|---|---|
| GPT 3.5 | gpt-3.5-turbo-0125 | Sep 2021 |
| GPT 4 | gpt-4-turbo-2024-04-09 | Dec 2023 |
| GPT 4o | chatgpt-4o-latest | Oct 2023 |
| GPT 4mini | gpt-4o-mini-2024-07-18 | Oct 2023 |
| Llama3.1-8B | Llama-3-8B-Instruct | March 2023 |
| HINT | HINT phase_I/II/III.ckpt | Apr 2022 |
| \botrule |
3.7 Disease Classification
For disease classification, we used ICD-10[27] as the standard classification system, which is consistent with the method used during the training of the HINT model.
We categorized these diseases into several groups using ICD-10 codes. These seven groups account for all trials in the baseline TOP and include:
-
•
Respiratory Diseases: Tuberculosis, sinusitis, tonsillitis.
-
•
Tumors/Cancers: Cerebellar tumors, neuroectodermal tumors, breast cancer, gastric tumors.
-
•
Digestive System Diseases: Dysentery, esophageal disorders, gastritis, duodenitis.
-
•
Nervous System Diseases: Meningitis, Parkinson’s disease, brain tumors.
-
•
Endocrine, Nutritional, and Metabolic Diseases: Diabetes, hyperthyroidism, hyperlipidemia.
-
•
Non-pathological disease combinations: Injuries, poisoning, and other external causes. External causes of morbidity and mortality. Factors influencing health status and healthcare utilization.
-
•
Other Uncategorized Conditions.
3.8 Clinical Trial Endpoint Grouping
We also analyzed the predictive performance of trial outcome prediction across different endpoint subgroups. These four groups represent key areas in the overall trial analysis, with their respective accuracies:
-
•
Overall Survival (OS): Including survival rate, time to death, and mortality.
-
•
Objective Response Rate (ORR): Such as response rate, tumor response rate, and overall response.
-
•
Progression-Free Survival (PFS): Including progression-free time and time to disease progression.
-
•
Safety Indicators (AE and SAE): Covering adverse events, serious adverse events, and toxic reactions.
-
•
Other uncategorized endpoints.
3.9 Clinical Trial Period Classification
We also analyzed the impact of clinical trial duration on model performance by calculating the number of trial days based on the start and end dates, excluding any missing or outlier values. Due to limitations in the available dataset for the GPT-4 family models, we divided the clinical trial duration into three duration-based segments to examine whether varying lengths affect model predictive performance. This classification allows us to assess how different trial durations might influence the models’ predictive capabilities. Data statistics are shown in the following(Table 8).
-
•
0-1000 days: Some trials fall within this range, which we consider “short-term trials.” (39.8%)
-
•
1001-2000 days: Most trials are within this range, which we classify as “medium-length trials.” (50.4%)
-
•
2001+ days: A small portion of trials exceeds this duration, categorized as “long-term trials.” (9.6%)
| Category | Total | Completed | ACTIVE | Success | Failure |
|---|---|---|---|---|---|
| All Data | 2163 | 1802 | 358 | 1709 | 452 |
| 0-1000 | 861 | 859 | 2 | 714 | 147 |
| 1001-3000 | 1091 | 842 | 248 | 846 | 243 |
| 3000+ | 207 | 101 | 104 | 145 | 62 |
| PHASE1 | 221 | 195 | 26 | 148 | 73 |
| PHASE2 | 1000 | 805 | 194 | 803 | 196 |
| PHASE3 | 636 | 537 | 98 | 555 | 81 |
| Diseases of the respiratory system | 148 | 125 | 23 | 116 | 32 |
| Neoplasms | 712 | 457 | 253 | 530 | 181 |
| Diseases of the digestive system | 192 | 167 | 25 | 156 | 35 |
| Diseases of the nervous system | 241 | 207 | 33 | 175 | 65 |
| Endocrine, nutritional and metabolic diseases | 173 | 162 | 11 | 147 | 26 |
| Non-pathological Diseases | 410 | 363 | 47 | 316 | 94 |
| Overall Survival (OS) | 1423 | 1201 | 220 | 1113 | 308 |
| Objective Response Rate (ORR) | 409 | 308 | 100 | 338 | 70 |
| Progression-Free Survival (PFS) | 163 | 91 | 72 | 128 | 35 |
| Safety Indicators (AE and SAE) | 614 | 550 | 63 | 380 | 233 |
4 Conclusion
This study focuses on evaluating the performance of large language models (LLMs) in predicting clinical trial outcomes, with particular attention to Balanced Accuracy, Matthews Correlation Coefficient (MCC), Recall, and Specificity. Among all models, GPT-4o demonstrated the best overall performance, showing high balanced accuracy and MCC, especially in the early trial phases. However, similar to other LLMs, GPT-4o faced limitations in recognizing negative samples, a common challenge across these models.
In terms of negative sample recognition, GPT-3.5 and GPT-4mini exhibited almost no ability, severely limiting their utility in predicting failed trials. Llama3 showed some ability in this area, although it remained weak.
One significant finding was that all LLMs struggled to predict outcomes for oncology trials, which made up the majority of the dataset. The complexity of cancer-related trials likely contributed to the models’ limited performance in this area. Although LLMs showed strengths in predicting certain outcomes, their limitations in handling complex domains such as oncology constrained their overall predictive capability.
In contrast, the HINT model displayed relatively stable performance across trial phases and showed notable strength in negative sample recognition. Its effectiveness improved with later phases, with Phase 3 showing especially high specificity and strong ability to recognize failed trials. Additionally, HINT demonstrated resilience to external factors, such as recruitment and funding issues. Consequently, HINT proves to be a reliable tool for identifying trial failures, particularly in later phases. Conversely, GPT-4o excelled in the early phases (such as Phase 1 and Phase 2), where it exhibited strong predictive capability and robustness, complementing the HINT model’s limitations in these stages.
Large language models show distinct differences in predicting specific clinical trial endpoints. For example, they perform well on Overall Survival (OS) but struggle with endpoints like Objective Response Rate (ORR) and Progression-Free Survival (PFS). GPT-4o and GPT-4 demonstrate high accuracy in OS predictions; however, their performance on ORR and PFS often falls below random chance levels, indicating that these models are better suited for simpler survival endpoints. In contrast, the HINT model maintains more stable performance across various endpoints, with particular strength in recognizing negative samples.
The study also found that as trial duration increased, the predictive performance of the models generally declined. For extended trials, the HINT model’s predictive ability was especially limited. However, while GPT-4o and GPT-4 showed some performance decline, they managed to remain relatively stable.
In conclusion, GPT-4o stands out as the best large language model for clinical trial prediction, but all LLMs face challenges in recognizing negative outcomes, particularly in complex areas like oncology. Nonetheless, these models are better suited for long-duration clinical trials. The HINT model’s high specificity in identifying negative outcomes highlights the need for further advancements in large language models to enhance their capability in negative predictions and in addressing external trial complexities.
5 Authors’ Contribution
Conceptualization: Lun Yu, Meijie Wang; Methodology: Shuyi Jin, Lun Yu; Data Curation and Labeling: Shuyi Jin, Lu Chen, Hongru Ding; Writing - original draft preparation: Shuyi Jin; Writing - review and editing: Lun Yu, Meijie Wang
6 Declaration of Interests
Lun Yu and Meijie Wang are shareholders of Shanghai MetaNovas BioTechnology. Authors declare that they have no conflict of interest.
7 Ethics Statement
This study does not contain any studies with human participants or animals performed by any of the authors.
8 Data and Code Availability Statement
The dataset and code used in this study are available from the corresponding author upon reasonable request.
References
- \bibcommenthead
- Market [2021] Market, N.: Global industry analysis, size, share. Growth, Trends, and Forecast 2015 (2021)
- Pfeifer and Verma [2001] Pfeifer, A., Verma, I.M.: Gene therapy: promises and problems. Annual review of genomics and human genetics 2(1), 177–211 (2001)
- Carvalho et al. [2021] Carvalho, M., Sepodes, B., Martins, A.P.: Patient access to gene therapy medicinal products: a comprehensive review. BMJ Innovations 7(1) (2021)
- Ramsey et al. [2015] Ramsey, S.D., Willke, R.J., Glick, H., Reed, S.D., Augustovski, F., Jonsson, B., Briggs, A., Sullivan, S.D.: Cost-effectiveness analysis alongside clinical trials ii—an ispor good research practices task force report. Value in health 18(2), 161–172 (2015)
- Martin et al. [2017] Martin, L., Hutchens, M., Hawkins, C., Radnov, A.: How much do clinical trials cost. Nat Rev Drug Discov 16(6), 381–382 (2017)
- Wong et al. [2019] Wong, C.H., Siah, K.W., Lo, A.W.: Estimation of clinical trial success rates and related parameters. Biostatistics 20(2), 273–286 (2019)
- Schperberg et al. [2020] Schperberg, A.V., Boichard, A., Tsigelny, I.F., Richard, S.B., Kurzrock, R.: Machine learning model to predict oncologic outcomes for drugs in randomized clinical trials. International journal of cancer 147(9), 2537–2549 (2020)
- Qaiser et al. [2022] Qaiser, T., Lee, C.-Y., Vandenberghe, M., Yeh, J., Gavrielides, M.A., Hipp, J., Scott, M., Reischl, J.: Usability of deep learning and h&e images predict disease outcome-emerging tool to optimize clinical trials. NPJ precision oncology 6(1), 37 (2022)
- Fu et al. [2022] Fu, T., Huang, K., Xiao, C., Glass, L.M., Sun, J.: Hint: Hierarchical interaction network for clinical-trial-outcome predictions. Patterns 3(4) (2022)
- Gao et al. [2018] Gao, C., Fu, T., Sun, J.: Lint: Llm interaction network for clinical trial outcome prediction. In: Artificial Intelligence and Data Science for Healthcare: Bridging Data-Centric AI and People-Centric Healthcare (2018)
- Reinisch et al. [2024] Reinisch, M., He, J., Liao, C., Siddiqui, S.A., Xiao, B.: Ctp-llm: Clinical trial phase transition prediction using large language models. arXiv preprint arXiv:2408.10995 (2024)
- Lai et al. [2024] Lai, H., Ge, L., Sun, M., Pan, B., Huang, J., Hou, L., Yang, Q., Liu, J., Liu, J., Ye, Z., et al.: Assessing the risk of bias in randomized clinical trials with large language models. JAMA Network Open 7(5), 2412687–2412687 (2024)
- Jin et al. [2023] Jin, Q., Wang, Z., Floudas, C.S., Chen, F., Gong, C., Bracken-Clarke, D., Xue, E., Yang, Y., Sun, J., Lu, Z.: Matching patients to clinical trials with large language models. ArXiv (2023)
- Markey et al. [2024] Markey, N., El-Mansouri, I., Rensonnet, G., Langen, C., Meier, C.: From rags to riches: Using large language models to write documents for clinical trials. arXiv preprint arXiv:2402.16406 (2024)
- Xu et al. [2019] Xu, J., Yang, P., Xue, S., Sharma, B., Sanchez-Martin, M., Wang, F., Beaty, K.A., Dehan, E., Parikh, B.: Translating cancer genomics into precision medicine with artificial intelligence: applications, challenges and future perspectives. Human genetics 138(2), 109–124 (2019)
- of Health [n.d.] Health, N.I.: ClinicalTrials.gov. https://clinicaltrials.gov/. Accessed: 2024-09-22 (n.d.)
- Getz et al. [2023] Getz, K., Smith, Z., Kravet, M.: Protocol design and performance benchmarks by phase and by oncology and rare disease subgroups. Therapeutic Innovation & Regulatory Science 57(1), 49–56 (2023)
- [18] OpenAI: GPT-3.5. https://chatgpt.com/g/g-F00faAwkE-open-a-i-gpt-3-5. Accessed: 2024-10-26
- Dubey et al. [2024] Dubey, A., Jauhri, A., Pandey, A., Kadian, A., Al-Dahle, A., Letman, A., Mathur, A., Schelten, A., Yang, A., Fan, A., et al.: The llama 3 herd of models. arXiv preprint arXiv:2407.21783 (2024)
- Achiam et al. [2023] Achiam, J., Adler, S., Agarwal, S., Ahmad, L., Akkaya, I., Aleman, F.L., Almeida, D., Altenschmidt, J., Altman, S., Anadkat, S., et al.: Gpt-4 technical report. arXiv preprint arXiv:2303.08774 (2023)
- [21] OpenAI: GPT-4o Mini: Advancing Cost-Efficient Intelligence. https://openai.com/index/gpt-4o-mini-advancing-cost-efficient-intelligence/. Accessed: 2024-10-26
- [22] OpenAI: Hello GPT-4. https://openai.com/index/hello-gpt-4o/. Accessed: 2024-10-26
- Fabre et al. [2024] Fabre, B.L., Magalhaes Filho, M.A.F., Aguiar, P.N., da Costa, F.M., Gutierres, B., William, W.N., Del Giglio, A.: Evaluating gpt-4 as an academic support tool for clinicians: a comparative analysis of case records from the literature. ESMO Real World Data and Digital Oncology 4, 100042 (2024) https://doi.org/10.1016/j.esmorw.2024.100042
- Weininger [1988] Weininger, D.: Smiles, a chemical language and information system. 1. introduction to methodology and encoding rules. Journal of chemical information and computer sciences 28(1), 31–36 (1988)
- Wordcount [n.d.] Wordcount: Keyword Extractor. https://wordcount.com/keyword-extractor. Accessed: 2024-10-15 (n.d.)
- [26] Chik, R.W., Sentosa, I., Shahruddin, S.: Strategic management comparison analysis of webometric top universities in world, asia and malaysia on the web visibility
- for Disease Control and Prevention [n.d.] Disease Control, C., Prevention: ICD-10-CM Official Coding Guidelines. https://www.cdc.gov/nchs/icd/icd-10-cm/index.html. Accessed: 2024-09-22 (n.d.)