figurec
Brain-like emergent properties in deep networks: impact of network architecture, datasets and training
Abstract
Despite the rapid pace at which deep networks are improving on standardized vision benchmarks, they are still outperformed by humans on real-world vision tasks. This paradoxical lack of generalization could be addressed by making deep networks more brain-like. Although several benchmarks have compared the ability of deep networks to predict brain responses to natural images, they do not capture subtle but important brain-like emergent properties.
To resolve this issue, we report several well-known perceptual and neural emergent properties that can be tested on deep networks. To evaluate how various design factors impact brain-like properties, we systematically evaluated over 30 state-of-the-art networks with varying network architectures, training datasets and training regimes.
Our main findings are as follows. First, network architecture had the strongest impact on brain-like properties compared to dataset and training regime variations. Second, networks varied widely in their alignment to the brain with no single network outperforming all others. Taken together, our results complement existing benchmarks by revealing brain-like properties that are either emergent or lacking in state-of-the-art deep networks.
1 Introduction
Every week or so, the vision community finds itself with a new deep neural network (DNNs) with improved task performance. These improvements are attributed to changes in one or more of three key components of the deep learning paradigm: network architecture, training data or the training regime [1, 2, 3, 4, 5, 6, 7, 8]. At the same time, it has been challenging to translate improvements on standard benchmarks to tangible improvements on real-world vision tasks [9, 10]. This paradoxical lack of generalization to the real-world might be resolved by evaluating new networks not only for their task performance, but on how closely they mimic the human visual system [11, 12, 13, 14, 15].
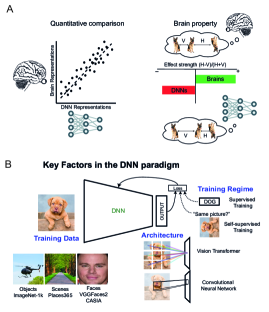
There are at least two fundamental issues with making a vision system similar to the brain. First, we need to have effective measures of similarity which can be optimized to create better visual systems. Second, changes must be targeted where they will have the greatest impact. It is unclear a priori which factors in the deep learning paradigm (network architecture, datasets, training) will have the greatest impact on making them closer to the brain. We address both these issues in this study.
Evaluating brain-similarity. Most previous studies have evaluated deep networks on their ability to predict neural responses or representational distances [16, 17]. However, these comparisons have often been made on natural images, which have a mix of both low-level and high-level features that can drive benchmark scores [18, 19, 20, 21].
While it is important to evaluate vision systems for their ability to predict brain data, we argue that it is equally or perhaps even more important to evaluate them for the presence or absence of qualitative perceptual or neural properties. For instance, it is widely known that humans are more sensitive to global compared to local shape changes [22, 23]. A vision system or network that is also sensitive to global shape would be qualitatively similar to humans, and we argue that this sensitivity could be made to match the human sensitivity to global shape through incremental changes to its architecture, dataset or training. By contrast, a vision system that is more sensitive to local shape (i.e. with the opposite pattern of sensitivity to humans), and would likely need more substantial changes to attain human-like performance. In other words, both the sign and magnitude of such a qualitative similarity score matter: if the empirically observed score from humans is 0.1 on such a qualitative measure, a network with a score of 0.3 should be considered quite differently from a network that scored -0.1, even though both networks are equally distant in terms of absolute distance from the human score. Here, we evaluate deep networks on a number of perceptual and neural properties to arrive at a composite assessment of their brain similarity.
Evaluating design factors in DNNs. In previous work, when task performance was the sole criterion to evaluate models, novel network architectures [24, 1, 2, 3, 4], novel image datasets [5, 25, 26] as well as novel training regimes have all resulted in noteworthy improvements[27]. Thus it is a priori not clear which of these factors should lead to substantial improvements. Moreover, it is possible in principle that a large change in task-optimized performance may not be accompanied by a large increase in brain alignment [28, 29, 30, 31]. Therefore it is important to evaluate the impact of network architecture, image dataset and training regime on the overall qualitative similarity to the brain.
1.1 Overview and contributions
Our goal is two fold. First, we describe a set of perceptual and neural properties whose presence can be tested in deep networks. Second, we investigate how network architecture, image dataset and training regime impact each of these tested properties. Our key contributions are:
-
•
We propose a suite of brain-like properties that can be evaluated on any deep network and compared with empirically observed values from brains.
-
•
We systematically varied architecture, training dataset and training regime across 30+ state-of-the-art DNNs and identify the factors that have the greatest impact.
-
•
We propose a composite metric, the Brain Property Match (BPM) for any vision system which accounts for the presence and magnitude of brain-alignment according to these properties.
2 Related Work
Whether a given vision system or deep network is similar to the brain has been assessed at multiple levels: performance, representations or neural responses. However, most previous comparisons have been made on natural images, which have a mix of both low-level and high-level features that can affect measures of similarity.
Many studies have compared deep networks and brains on object recognition tasks. While DNNs show human-level performance on many vision tasks [16, 32, 17] with representations that align well with the brain [33, 34], they also show a number of important differences. These differences include vulnerabilities to adversarial attacks [35, 36, 37, 38], biases toward texture over shape [28, 39], preference for specific object sizes [40, 41], heightened sensitivity to contextual cues [42], unique error patterns [43], systematic bias in object representations[44] and limited generalization to out-of-distribution data [45]. Recently, platforms have been developed to identify models that quantitatively align with neural activity[18, 19, 20, 21]. However, these approaches might carry biases from the optimization or regression algorithms that could render them less brain-like overall [46] and they do not give us a deeper understanding what about these networks make them brain-like or not. A recent study has addressed this issue by comparing a number of brain-like properties in deep networks [47]. We extend this approach in our study.
3 Methods
To systematically test for neural and perceptual brain-similarity in DNNs, we selected 15 well-known properties from visual psychology and neuroscience [47]. We then gathered a collection of pre-trained, state-of-the-art models that systematically captures variations in network architecture, training dataset, and training regime. We make our code available at our OSF Repository.
3.1 Brain-like properties
For each model, we tested a total of 15 brain-like properties, as summarized below and detailed in Supplementary Section S1.
-
•
Object Normalization-pairs: The neural response to two objects is the average of the response to the individual objects.
-
•
Object Normalization-triplets: The neural response to three objects is the average of the response to the individual objects.
-
•
Scene Incongruence: Object categorization is more accurate when objects are presented in congruent compared to incongruent scenes.
-
•
Mirror Confusion: Images reflected about the vertical axis are more similar than when reflected about the horizontal axis.
-
•
Correlated Sparseness-morphlines: Selective neurons are selective for both distinct objects as well as along arbitrary morphlines.
-
•
Correlated Sparseness-shape/texture: Selective neurons are selective for shape and texture.
-
•
Weber’s Law: Perceptual distances are proportional to relative rather than absolute changes in magnitude.
-
•
Basic Occlusions: Likely completions of an occluded display are more similar than mosaic completions.
-
•
Depth Occlusions: Depth ordering changes are more similar than equivalent feature changes.
-
•
Relative Size: A minority of neurons are sensitive to relative size of features.
-
•
Surface Invariance: A minority of neurons decouple pattern changes from surface changes.
-
•
3D Processing-1: Changes in 3D shape are more noticeable than equivalent 2D changes.
-
•
3D Processing-2: Changes in 3D shape are more noticeable than equivalent 2D changes even after controlling for feature clutter.
-
•
Global Advantage: Perceptual distances are more sensitive to global compared to local shape.
-
•
Thatcher Effect: Perceptual distances are more sensitive for upright compared to inverted faces.
Each property test returns an effect strength calculated such that it can have a maximum value of 1, and a minimum value of -1 for more details). Positive scores indicate a presence of the property, making the network brain-like. Negative scores indicate that the network/model has an opposite property i.e. is anti-brain like. We also report an empirically observed score for each of these property from human behavior or monkey high-level visual areas to facilitate a direct comparison to the brain.
3.2 Network Variations
We systematically evaluated a variety of pre-trained deep networks to explore how network architecture, image dataset, and training regime impact the emergence of perceptual effects in DNNs. For each experiment, we captured unit activations from the penultimate layer (or final classification probabilities in the case of scene incongruence) for the stimulus set and computed the effect strength as described in Supplementary Section S1.
Architecture selection. We selected models from the CNN and ViT families, trained on a supervised object recognition task using the ImageNet dataset, to evaluate the impact of architecture. These model families employ fundamentally different operations for processing data: CNNs use convolutional operations [2], while ViTs utilize self-attention mechanisms to extract visual features for object recognition [48, 4]. We tested two networks of each state-of-the-art models in both families: VGGs [2], ResNets [3], Inception Nets [49, 24], ConvNeXts [50], SWIN [51], and DeiT [52]. This wide range of architectures, trained on the same dataset, provides a large degree of variation, allowing us to ask: How do architectural inductive biases give rise to brain-like properties?
Training datasets selection. We selected two CNNs and a ViT, each trained on ImageNet [53], Places365 [26], and face datasets (CASIA and VGGFaces2) [54, 55, 56, 57]. Training the same architecture on datasets with three distinct feature and statistical properties enables us to ask: How does the visual experiences of networks during training give rise to brain-like properties?.
Training Regime selection. To benchmark the difference across training regime, we compared DNNs trained using supervised and self-supeervised methods. To compare supervised and self-supervised we utilize a ResNet-50 and a standard ViT base architecture, each trained with MOCOv3 [58] and DINO [59]. Additionally, to examine the impact of adversarial training within supervised learning frameworks, we benchmark adversarially trained versions of both ResNet and ViT [60, 61]. Through these variations, we explore the question: How do different training regimes give rise to brain-like properties?
3.3 Brain Property Match Score
We devised a novel Brain Property Match (BPM) score for each network, which takes into account the sign of the effect strength (which captures the presence/absence of the property) as well as the distance of the effect strength in the network from the brain, and combines this score across all tested properties to arrive at a final composite score. Specifically, the BPM score for model is a function of its multidimensional distance across all properties relative to the brain:
Thus, the DNN is penalized by a factor of if its score is negative and anti-brain like. When , the BPM is identical to the norm. We selected = 2 for our evaluations, which means that any negative effect strength is penalized by a factor of 2 for deviating away from the brain. We obtained similar rankings of networks on varying this value. The resulting BPM scores for all tested networks are shown in Table 1.
4 Results
We tested a total of 32 vision DNNs across architectural, training dataset and regime variations in order to investigate the emergence of brain-like perceptual and neural properties. In each case, we evaluated deep networks varying in a given factor while holding others constant to study the impact of that factor on all the brain-like properties tested.
4.1 Architecture variations
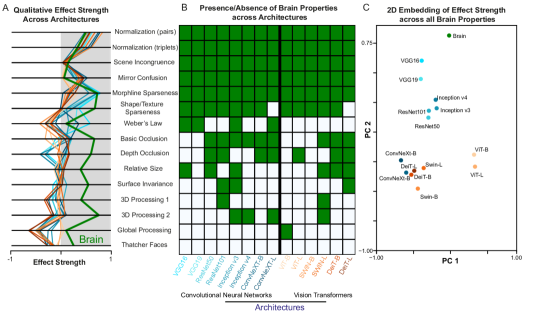
We evaluated 14 DNN architectures trained on the same dataset and training regime for a total of 15 brain-like properties (see Section 3 and Supplementary Section S1). Figure 2A shows the effect strength for each brain-like property for each network, along with the empirically observed effect strength in brains. Note that positive values are brain-like, and negative values are anti-brain-like. To more clearly depict the presence or absence of each brain-like property, we binarized the effect strength (Figure 2B). We report our observations below.
Brain-like properties present in all architectures. Both CNN and ViT families consistently display some brain-like properties like Object Normalization, Scene Incongruence, Mirror Confusion and Correlated Sparseness across shapes/textures and morph-lines. These phenomena seem to be emergent in networks optimized for object recognition regardless of architecture. Despite the presence of these effects, architectures did vary in how close they are to the empirically observed values from the brain. For example, in both sparseness experiments, all CNN families have a closer effect to the brain when compared to the ViTs. On the other hand, in Mirror confusion, the closest effect to what is found in the brain is observed in the vanilla Vision Transformer architectures.
Brain-like properties unique to specific architectures. Moving on to effects exhibited by CNNs, we note that Weber’s law is not present in any of the Vision Transformers, yet commonly found in CNNs. In fact, some of the CNNs like the Inceptionv3 network come extremely close to the effect strength in humans. Occlusion effects are slightly more common in CNNs, despite neither architectures getting close to the human level. In the global processing effect, however, the only networks to come close to exhibiting a human-like global advantage is the vanilla ViT networks.
Brain-like properties absent in all architectures. Effects like relative size encoding, surface invariance and 3D processing are almost equally absent, and far away from the brain, in both families with some networks going below the brain-like perceptual zone.
Embedding of effect strength across all properties. In order to visualize the performance patterns of all networks across all 14 experiments, we performed PCA on the 14-element effect strength vectors for each network as well as for the brain, and obtained a 2D embedding using the first two principal components (Figure 2C). This plot reveals a strong clustering effect based on architectural family with the notable outliers of the vanilla ViT and the ConvNeXt architectures. The vanilla ViT did perform remarkably better than its family members in experiments like Mirror Confusion and Global Processing while achieving similar scores in other experiments. This result indicate a contrast in inductive biases and internal processing within the ViT family. ConvNeXts on the other hand were designed to ‘modernize’ the CNN training process by mimicking the design principles of ViTs. This could explain the inherent similarity of qualitative representations of ConvNeXts and ViTs. Finally, we note that none of the architectures consistently exhibit all brain-like properties nor do they do so to the same extent. Furthermore, the Swin and DeiT architectures are also more fundamentally similar in nature to CNNs than the vanilla ViT as they reintroduce the notion of hierarchical information processing with a sliding window approach [51] and are distilled on (trained to predict) CNN representations [52] respectively. This could explain the overlapping qualitative similarities in modern CNNs and ViTs in Figure 2C.
Brain-like properties most and least affected by network architecture variation. The most distinct brain property effect changes caused by architecture were on Weber’s Law, Correlated sparseness (morphlines and shape/texture) and Global Processing. We speculate that these effect variations can be mostly explained by the bias towards global information encoded in the Vision Transformer families, a direct contrast with CNNs [62]. Convolutional processing of image information leads CNNs to synthesize its representations of a full image incrementally, unlike in ViTs, which could also make it more sensitive to relative differences in feature sizes. The same explanation may hold for the absence of global processing in CNNs whereas the vanilla ViTs come close to the brain effect level. Since Vision Transformers pool and process global information, they tend to also maintain distributed feature representations – meaning that single units do not necessarily become highly selective for singular features which could explain why there is less correlation in selectivity as observed in the sparseness experiments [62].
4.2 Training Dataset Variation
Next we investigated how varying the training dataset could affect the brain-like properties of networks. To this end, we tested two CNNs and a ViT network architecture. Each network was pre-trained on objects, scenes or faces, which represent widely different visual experiences. We evaluated these nine chosen networks for the same brain-like properties as before, with the exception of the scene incongruence property which is applicable only to object-trained networks. The results are summarized in Figure 3 and we summarize our observations below.
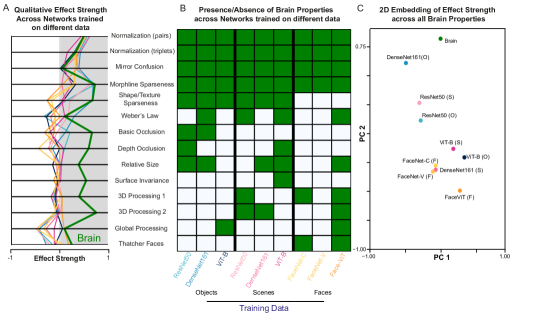
Brain-like properties present across all dataset variations. Networks trained on all datasets exhibit object normalization, mirror confusion and morph-line correlated sparseness (Figure 3A&B). Interestingly, none of the face-trained networks exhibit correlated selectivity to shapes and textures. This could simply be a result of significantly less feature variation in face datasets or alternatively because face units need not be selective to multiple features unlike object or scene-trained models.
Brain-like properties unique to specific datasets. When varying network architectures, we noted that none of the Vision Transformers exhibited Weber’s law Figure 2B. However, we now note that training on scenes and faces causes the emergence of Weber’s law in ViTs (Figure 3B). In fact, the scene-trained ViT is closest to the true brain-score for Weber’s Law. On the other hand, face and scene-trained CNNs lost the ability to process occlusion when compared to object training. These interesting reversals suggest that architectural and training data may have complementary effects in the emergence of certain brain properties. 3D processing is seen to only show up in scene and face-trained networks in this comparison. We find again that global processing was present at human-like levels in Vision Transformers but not in other architectures. Finally, we note that the Thatcher effect is present in face-trained networks, confirming that exposure to objects or scenes alone does not suffice for this effect to emerge.
Brain-like properties absent in all datasets. Relative size encoding and surface invariance seem to be largely unaffected by the training dataset.
Embedding of effect strength across all dataset variations. The low-dimensional embedding in Figure 3C indicates a lack of clustering based on training dataset. However, we observe that CNNs and ViTs tend to cluster together with the exception of faces. Thus, object- and scene experience appears qualitatively different from face experience.
4.3 Training Regime Variation
Finally, we investigated networks varying in their training regime. We chose a ResNet50 and a vanilla ViT-base network across different training regimes on the same dataset - ImageNet1k. In the supervised category, we test the standard trained networks and their adversarially trained counterparts. Adversarial training involves injecting adversarial noise during training to prevent learning of non-robust features [63]. In the self-supervised category, we tested two popular contrastive-learning based algorithms: MOCOv3 and DINO. We evaluated these 8 networks for the same 14 brain-like properties as used for dataset variations.
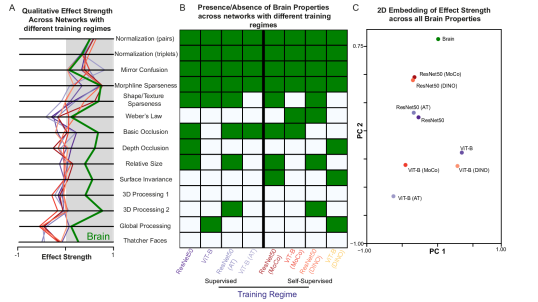
Brain-like properties present across all training regime variations. We again note the consistent presence of object normalization, mirror confusion and morph-line sparseness across architectures and training regime (Figure 4A,B).
Brain-like properties unique to specific training regimes. Correlated sparseness for shapes and textures are typically present in Vision Transformers but are lost in vanilla ViTs trained adversarially or in a self-supervised manner. It is interesting to note that despite potential differences due to the regime, ResNets maintain the correlated unit selectivity for shapes and textures, and in fact, gets closer to the true brain-score Figure 4A.
Embedding of effect strength across all training regime variations. Overall, we saw fewer variations in qualitative effects on varying the training regime. This is further illustrated by the embedding plot in Figure 4C where the models cluster based on architecture rather than training regime. In the case of ResNets, we do see the MoCo and DINO variants closer together and the same for their supervised counterparts but this is absent for the Vision Transformers. This could also suggest a complementary qualitative effect of architectures and regimes.
4.4 Comparison of all tested networks
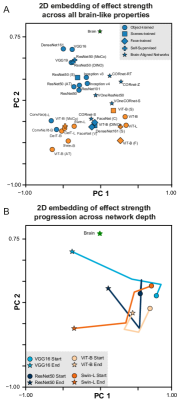
The above results are based on a fine-grained comparison of the impact of each factor on the presence of brain-like properties while holding other factors constant. To obtain a more holistic picture of all networks, we embedded all networks on a single plot. We also included popular brain-aligned networks like the CORNet [19] and the VOneNet [20] families. This allows us to additionally compare whether optimizing on quantitative brain-similarity has any effect on the brain-like properties tested here. See Supplementary Section S2 for the binarized property visualisation across all networks.
We observed strong clustering based on architecture compared to the other design factors 5A, especially all the ResNets. The brain-aligned networks also seem to be qualitatively similar to their standard counterparts: CORnet-RT (with residual connections) and VOneResNet50 position themselves close to the ResNet family. This further confirms that network architecture is the strongest influence on whether a network shows brain-like properties. To verify this effect in the full 14-dimensional space of all brain-like property effect strengths, we performed a clustering strength analysis and confirmed this to be the case see Supplementary Section S3.
4.5 Layer-wise progression of brain-like properties
Having visualized the embedding of the penultimate layer of each network relative to the brain in 5A, we were inspired to visualize how brain-like properties evolve across the layers of a given network. To explore this possibility, we calculated the effect strength vectors across all 14 brain-like properties for four key networks (for different percentiles of their overall depth), and plotted their coordinates in the same PC space as before. In this resulting plot (5B), interestingly, we observed no continuous progression towards brain-like properties at least in this 2D embedding. Nonetheless, this visualization shows that although increasing depth typically leads to improved classification scores, these networks may even become less-brain like, presumably due to over-optimization (see Supplementary Section S4 for individual effect progression across model depth).
4.6 Brain Property Match (BPM) score
Can we devise a composite metric to benchmark a network’s similarity to the brain in terms of brain-like emergent properties? We propose a Brain Property Match (BPM) score (see 3.3). This score is sensitive to two components: the absolute difference of the DNN’s effect strengths from the measured strength in brains and whether the effect is simply present/absent in the network. Table 1 shows the ranking of all tested networks according to the BPM metric, as well as their ranks according to the number of brain-like properties present in each network, and their ranks according to L1-norm similarity to the empirically effect strength observed in brains. We find that networks ranked highly by BPM do not belong to the same network architecture, training dataset or training regime - suggesting that varying each of these factors is causing some properties to become brain-like at the expense of others. This is also evident from the L1-norm similarity rankings, because all networks seem equidistant from the brain. We note that this does not match with the 2-dimensional embedding seen in the 5A, presumably because the 2 principal components explain only 65% of the variance. We urge caution in using the BPM score directly as a metric to be optimized, for several reasons. First, the BPM score for brains is unequal in magnitude across the brain-like properties tested. It could be that a brain-like property with an effect strength of 0.1 in the brain could be more important for real-world generalization than some other property that has a larger effect strength. Second, we have used an ad-hoc linear penalty for negative effect strength values, which may or may not reflect the degree to which anti-brain-like scores should be penalized.
| Rank | Model Name | BPM | Agreement | L1 Similarity |
|---|---|---|---|---|
| 1 | VOneCORnet-S | 0.1390 | 19 (7) | 4 (0.1549) |
| 2 | Inception v3 | 0.1389 | 2 (10) | (2 (0.1564) |
| 3 | ViT-B (Places365) | 0.1382 | 5 (9) | 7 (0.1517) |
| 4 | ViT-B (DINO) | 0.1363 | 21 (7) | 11 (0.1491) |
| 5 | DenseNet161 | 0.1351 | 7 (8) | 3 (0.1563) |
| 6 | ResNet101 | 0.1348 | 4 (9) | 1 (0.1576) |
| 7 | FaceViT (VGGFaces2) | 0.1333 | 1 (10) | 14 (0.1473) |
| 8 | ResNet50 (DINO) | 0.1320 | 12 (8) | 6 (0.1524) |
| 9 | ViT-B | 0.1309 | 25 (6) | 12 (0.1483) |
| 10 | ViT-L | 0.1303 | 24 (6) | 15 (0.1462) |
| 11 | ResNet50 (Places365) | 0.1282 | 8 (8) | 13 (0.1482) |
| 12 | ResNet50 | 0.1270 | 15 (8) | 8 (0.1504) |
| 13 | ResNet50 (MoCo) | 0.1267 | 11 (8) | 5 (0.1525) |
| 14 | CORnet-Z | 0.1263 | 14 (8) | 10 (0.1493) |
| 15 | Inception v4 | 0.1235 | 17 (7) | 9 (0.1497) |
| 16 | Densenet161 (Places365) | 0.1221 | 20 (7) | 17 (0.1380) |
| 17 | CORnet-S | 0.1194 | 13 (8) | 19 (0.1369) |
| 18 | Swin-L | 0.1187 | 3 (9) | 24 (0.1334) |
| 19 | CORnet-RT | 0.1182 | 22 (7) | 16 (0.1437) |
| 20 | ConvNeXt-L | 0.1144 | 9 (8) | 26 (0.1271) |
| 21 | VGG19 | 0.1135 | 28 (6) | 18 (0.1374) |
| 22 | FaceNet (CASIA) | 0.1132 | 26 (6) | 23 (0.1337) |
| 23 | ResNet50 (AT) | 0.1131 | 10 (8) | 20 (0.1365) |
| 24 | VGG16 | 0.1119 | 23 (7) | 22 (0.1340) |
| 25 | VOneResNet50 | 0.1104 | 29 (5) | 21 (0.1365) |
| 26 | ViT-B (MoCo) | 0.1072 | 27 (6) | 28 (0.1269) |
| 27 | FaceNet (VGGFaces2) | 0.1066 | 32 (4) | 25 (0.1278) |
| 28 | DeiT-B | 0.1056 | 6 (8) | 27 (0.1270) |
| 29 | ConvNeXt-B | 0.1048 | 18 (7) | 30 (0.1229) |
| 30 | DeiT-L | 0.1041 | 16 (8) | 29 (0.1268) |
| 31 | Swin-B | 0.1008 | 30 (5) | 31 (0.1174) |
| 32 | ViT-B (AT) | 0.0917 | 31 (5) | 32 (0.1128) |
5 Discussion
In this work, we describe a set of brain-like emergent properties that can be evaluated on any deep network, or for that matter, any visual system with an accessible internal representation. We systematically tested these properties on 32 state-of-the-art DNNs that varied in their architecture, training dataset and training regime. Our main findings are as follows. First, network architecture had the strongest impact on the presence or absence of brain-like properties compared to dataset and training regime variations. Second, networks varied widely in their alignment to the brain with no single network achieving a very close match.
Our study offers interesting insights into the design choices under which the brain-like properties arise. Properties like object normalization and mirror confusion are present in all networks, suggesting that they emerge with the demand of image recognition. Some properties such as relative size, surface invariance and 3D processing are almost always absent, suggesting that they may emerge only with specialized training. Some properties like Weber’s law are present only in convolutional networks, whereas global advantage is present in vanilla ViTs, suggesting that these effects arise largely due to network architecture. Finally, training dataset also matters, since face-trained CNNs lose occlusion processing and shape-texture sparseness while gaining the Thatcher effect.
Taken together, our results offer insights into the presence of brain-like emergent properties in deep networks. They raise the intriguing possibility that training deep network to acquire these properties could lead to more generalizable and robust brain-like deep networks.
References
- [1] Alex Krizhevsky, Ilya Sutskever, and Geoffrey E. Hinton. ImageNet classification with deep convolutional neural networks. Communications of the ACM, 60(6):84–90, May 2017.
- [2] Karen Simonyan and Andrew Zisserman. Very Deep Convolutional Networks for Large-Scale Image Recognition, April 2015. arXiv:1409.1556.
- [3] Kaiming He, Xiangyu Zhang, Shaoqing Ren, and Jian Sun. Deep Residual Learning for Image Recognition. In 2016 IEEE Conference on Computer Vision and Pattern Recognition (CVPR), pages 770–778, Las Vegas, NV, USA, June 2016. IEEE.
- [4] Alexey Dosovitskiy, Lucas Beyer, Alexander Kolesnikov, Dirk Weissenborn, Xiaohua Zhai, Thomas Unterthiner, Mostafa Dehghani, Matthias Minderer, Georg Heigold, Sylvain Gelly, Jakob Uszkoreit, and Neil Houlsby. An Image is Worth 16x16 Words: Transformers for Image Recognition at Scale, June 2021. arXiv:2010.11929.
- [5] Jia Deng, Wei Dong, Richard Socher, Li-Jia Li, Kai Li, and Li Fei-Fei. ImageNet: A large-scale hierarchical image database. In 2009 IEEE Conference on Computer Vision and Pattern Recognition, pages 248–255, Miami, FL, June 2009. IEEE.
- [6] Chen Sun, Abhinav Shrivastava, Saurabh Singh, and Abhinav Gupta. Revisiting Unreasonable Effectiveness of Data in Deep Learning Era, August 2017. arXiv:1707.02968 [cs].
- [7] Kai Han, Yunhe Wang, Hanting Chen, Xinghao Chen, Jianyuan Guo, Zhenhua Liu, Yehui Tang, An Xiao, Chunjing Xu, Yixing Xu, Zhaohui Yang, Yiman Zhang, and Dacheng Tao. A Survey on Vision Transformer. IEEE Transactions on Pattern Analysis and Machine Intelligence, 45(1):87–110, January 2023.
- [8] Xia Zhao, Limin Wang, Yufei Zhang, Xuming Han, Muhammet Deveci, and Milan Parmar. A review of convolutional neural networks in computer vision. Artificial Intelligence Review, 57(4):99, March 2024.
- [9] Gary Marcus. Deep Learning: A Critical Appraisal, January 2018. arXiv:1801.00631 [cs].
- [10] Felix A. Wichmann and Robert Geirhos. Are Deep Neural Networks Adequate Behavioral Models of Human Visual Perception? Annual Review of Vision Science, March 2023.
- [11] Brenden M. Lake, Tomer D. Ullman, Joshua B. Tenenbaum, and Samuel J. Gershman. Building Machines That Learn and Think Like People, November 2016. arXiv:1604.00289 [cs].
- [12] Daniel L K Yamins and James J DiCarlo. Using goal-driven deep learning models to understand sensory cortex. Nature Neuroscience, 19(3):356–365, March 2016.
- [13] Uri Hasson, Samuel A. Nastase, and Ariel Goldstein. Direct Fit to Nature: An Evolutionary Perspective on Biological and Artificial Neural Networks. Neuron, 105(3):416–434, February 2020.
- [14] Raghavendraro Taranath Pramod and S.P. Arun. Improving Machine Vision using Human Perceptual Representations: The Case of Planar Reflection Symmetry for Object Classification. IEEE Transactions on Pattern Analysis and Machine Intelligence, in press, 2020. Publisher: IEEE Trans Pattern Anal Mach Intell.
- [15] R.T. Pramod, Harish Katti, and S.P. Arun. Human peripheral blur is optimal for object recognition. Vision Research, 200:108083, November 2022.
- [16] Nikolaus Kriegeskorte and Pamela K. Douglas. Cognitive computational neuroscience. Nature Neuroscience, 21(9):1148–1160, September 2018.
- [17] Thomas Serre. Deep Learning: The Good, the Bad, and the Ugly. Annual review of vision science, 5(1):399–426, September 2019.
- [18] Martin Schrimpf, Jonas Kubilius, Ha Hong, Najib J. Majaj, Rishi Rajalingham, Elias B. Issa, Kohitij Kar, Pouya Bashivan, Jonathan Prescott-Roy, Franziska Geiger, Kailyn Schmidt, Daniel L. K. Yamins, and James J. DiCarlo. Brain-Score: Which Artificial Neural Network for Object Recognition is most Brain-Like?, January 2020. Pages: 407007 Section: New Results.
- [19] Jonas Kubilius, Martin Schrimpf, Kohitij Kar, Rishi Rajalingham, Ha Hong, Najib Majaj, Elias Issa, Pouya Bashivan, Jonathan Prescott-Roy, Kailyn Schmidt, Aran Nayebi, Daniel Bear, Daniel L Yamins, and James J DiCarlo. Brain-Like Object Recognition with High-Performing Shallow Recurrent ANNs. In Advances in Neural Information Processing Systems, volume 32. Curran Associates, Inc., 2019.
- [20] Joel Dapello, Tiago Marques, Martin Schrimpf, Franziska Geiger, David Cox, and James J DiCarlo. Simulating a Primary Visual Cortex at the Front of CNNs Improves Robustness to Image Perturbations. In Advances in Neural Information Processing Systems, volume 33, pages 13073–13087. Curran Associates, Inc., 2020.
- [21] A. T. Gifford, B. Lahner, S. Saba-Sadiya, M. G. Vilas, A. Lascelles, A. Oliva, K. Kay, G. Roig, and R. M. Cichy. The Algonauts Project 2023 Challenge: How the Human Brain Makes Sense of Natural Scenes, July 2023. arXiv:2301.03198.
- [22] David Navon. Forest before trees: The precedence of global features in visual perception. Cognitive Psychology, 9(3):353–383, July 1977.
- [23] Georgin Jacob and S. P. Arun. How the forest interacts with the trees: Multiscale shape integration explains global and local processing. Journal of Vision, 20(10):20, October 2020.
- [24] Christian Szegedy, Sergey Ioffe, Vincent Vanhoucke, and Alex Alemi. Inception-v4, Inception-ResNet and the Impact of Residual Connections on Learning, August 2016. arXiv:1602.07261.
- [25] Tsung-Yi Lin, Michael Maire, Serge Belongie, James Hays, Pietro Perona, Deva Ramanan, Piotr Dollár, and C. Lawrence Zitnick. Microsoft COCO: Common Objects in Context. In David Fleet, Tomas Pajdla, Bernt Schiele, and Tinne Tuytelaars, editors, Computer Vision – ECCV 2014, volume 8693, pages 740–755. Springer International Publishing, Cham, 2014. Series Title: Lecture Notes in Computer Science.
- [26] Bolei Zhou, Agata Lapedriza, Aditya Khosla, Aude Oliva, and Antonio Torralba. Places: A 10 Million Image Database for Scene Recognition. IEEE Transactions on Pattern Analysis and Machine Intelligence, 40(6):1452–1464, June 2018.
- [27] Ting Chen, Simon Kornblith, Mohammad Norouzi, and Geoffrey Hinton. A Simple Framework for Contrastive Learning of Visual Representations, July 2020. arXiv:2002.05709 [cs].
- [28] Robert Geirhos, Heiko H. Schütt, Carlos R. Medina Temme, Matthias Bethge, Jonas Rauber, and Felix A. Wichmann. Generalisation in humans and deep neural networks. Advances in Neural Information Processing Systems, 2018-Decem(NeurIPS 2018):7538–7550, 2018.
- [29] Robert Geirhos, Jörn-Henrik Jacobsen, Claudio Michaelis, Richard Zemel, Wieland Brendel, Matthias Bethge, and Felix A. Wichmann. Shortcut Learning in Deep Neural Networks. Nature Machine Intelligence, 2(11):665–673, November 2020. arXiv:2004.07780 [cs].
- [30] Grace W. Lindsay. Convolutional Neural Networks as a Model of the Visual System: Past, Present, and Future. Journal of Cognitive Neuroscience, 33(10):2017–2031, September 2021.
- [31] Colin Conwell, Jacob S. Prince, Kendrick N. Kay, George A. Alvarez, and Talia Konkle. A large-scale examination of inductive biases shaping high-level visual representation in brains and machines. Nature Communications, 15(1):9383, October 2024.
- [32] Rishi Rajalingham, Elias B Issa, Pouya Bashivan, Kohitij Kar, Kailyn Schmidt, and James J DiCarlo. Large-Scale, High-Resolution Comparison of the Core Visual Object Recognition Behavior of Humans, Monkeys, and State-of-the-Art Deep Artificial Neural Networks. The Journal of neuroscience : the official journal of the Society for Neuroscience, 38(33):7255–7269, July 2018.
- [33] Nikolaus Kriegeskorte. Representational similarity analysis – connecting the branches of systems neuroscience. Frontiers in Systems Neuroscience, 2008.
- [34] Tim C. Kietzmann, Courtney J. Spoerer, Lynn K. A. Sörensen, Radoslaw M. Cichy, Olaf Hauk, and Nikolaus Kriegeskorte. Recurrence is required to capture the representational dynamics of the human visual system. Proceedings of the National Academy of Sciences, 116(43):21854–21863, October 2019.
- [35] Christian Szegedy, Wojciech Zaremba, Ilya Sutskever, Joan Bruna, Dumitru Erhan, Ian Goodfellow, and Rob Fergus. Intriguing properties of neural networks, February 2014. arXiv:1312.6199.
- [36] Joana C. Costa, Tiago Roxo, Hugo Proença, and Pedro R. M. Inácio. How Deep Learning Sees the World: A Survey on Adversarial Attacks & Defenses, May 2023. arXiv:2305.10862.
- [37] Ian J. Goodfellow, Jonathon Shlens, and Christian Szegedy. Explaining and Harnessing Adversarial Examples, March 2015. arXiv:1412.6572 [stat].
- [38] Anish Athalye, Nicholas Carlini, and David Wagner. Obfuscated Gradients Give a False Sense of Security: Circumventing Defenses to Adversarial Examples, July 2018. arXiv:1802.00420 [cs].
- [39] Nicholas Baker, Hongjing Lu, Gennady Erlikhman, and Philip J. Kellman. Deep convolutional networks do not classify based on global object shape. PLOS Computational Biology, 14(12):e1006613, December 2018.
- [40] Miguel P. Eckstein, Kathryn Koehler, Lauren E. Welbourne, and Emre Akbas. Humans, but Not Deep Neural Networks, Often Miss Giant Targets in Scenes. Current biology : CB, 27(18):2827–2832.e3, September 2017. Publisher: Elsevier Ltd.
- [41] Bharat Singh and Larry S. Davis. An analysis of scale invariance in object detection - snip. In 2018 IEEE/CVF Conference on Computer Vision and Pattern Recognition, pages 3578–3587, Salt Lake City, UT, June 2018. IEEE.
- [42] Kai Xiao, Logan Engstrom, Andrew Ilyas, and Aleksander Madry. Noise or Signal: The Role of Image Backgrounds in Object Recognition, 2020. Version Number: 1.
- [43] Harish Katti, Marius V Peelen, and S. P. Arun. How do targets, nontargets, and scene context influence real-world object detection? Attention, perception & psychophysics, 79(7):2021–2036, October 2017.
- [44] R. T. Pramod and S. P. Arun. Do Computational Models Differ Systematically from Human Object Perception? In 2016 IEEE Conference on Computer Vision and Pattern Recognition (CVPR), pages 1601–1609, June 2016. ISSN: 1063-6919.
- [45] Benjamin Recht, Rebecca Roelofs, Ludwig Schmidt, and Vaishaal Shankar. Do ImageNet Classifiers Generalize to ImageNet?, June 2019. arXiv:1902.10811 [cs].
- [46] Rylan Schaeffer, Mikail Khona, Sarthak Chandra, Mitchell Ostrow, Brando Miranda, and Sanmi Koyejo. Position: Maximizing Neural Regression Scores May Not Identify Good Models of the Brain. October 2024.
- [47] Georgin Jacob, R. T. Pramod, Harish Katti, and S. P. Arun. Qualitative similarities and differences in visual object representations between brains and deep networks. Nature Communications, 12(1):1872, March 2021. Publisher: Nature Publishing Group.
- [48] Ashish Vaswani, Noam Shazeer, Niki Parmar, Jakob Uszkoreit, Llion Jones, Aidan N. Gomez, Lukasz Kaiser, and Illia Polosukhin. Attention Is All You Need, August 2023. arXiv:1706.03762.
- [49] Christian Szegedy, Vincent Vanhoucke, Sergey Ioffe, Jonathon Shlens, and Zbigniew Wojna. Rethinking the Inception Architecture for Computer Vision, December 2015. arXiv:1512.00567.
- [50] Zhuang Liu, Hanzi Mao, Chao-Yuan Wu, Christoph Feichtenhofer, Trevor Darrell, and Saining Xie. A ConvNet for the 2020s, March 2022. arXiv:2201.03545.
- [51] Ze Liu, Yutong Lin, Yue Cao, Han Hu, Yixuan Wei, Zheng Zhang, Stephen Lin, and Baining Guo. Swin Transformer: Hierarchical Vision Transformer using Shifted Windows, August 2021. arXiv:2103.14030.
- [52] Hugo Touvron, Matthieu Cord, Matthijs Douze, Francisco Massa, Alexandre Sablayrolles, and Hervé Jégou. Training data-efficient image transformers & distillation through attention, January 2021. arXiv:2012.12877.
- [53] Olga Russakovsky, Jia Deng, Hao Su, Jonathan Krause, Sanjeev Satheesh, Sean Ma, Zhiheng Huang, Andrej Karpathy, Aditya Khosla, Michael Bernstein, Alexander C. Berg, and Li Fei-Fei. ImageNet Large Scale Visual Recognition Challenge, January 2015. arXiv:1409.0575.
- [54] Jawad Muhammad, Yunlong Wang, Caiyong Wang, Kunbo Zhang, and Zhenan Sun. CASIA-Face-Africa: A Large-scale African Face Image Database, May 2021. arXiv:2105.03632.
- [55] Qiong Cao, Li Shen, Weidi Xie, Omkar M. Parkhi, and Andrew Zisserman. VGGFace2: A Dataset for Recognising Faces across Pose and Age. In 2018 13th IEEE International Conference on Automatic Face & Gesture Recognition (FG 2018), pages 67–74, May 2018.
- [56] Yaoyao Zhong and Weihong Deng. Face Transformer for Recognition, April 2021. arXiv:2103.14803 version: 2.
- [57] Florian Schroff, Dmitry Kalenichenko, and James Philbin. FaceNet: A Unified Embedding for Face Recognition and Clustering, June 2015. arXiv:1503.03832.
- [58] Mathilde Caron, Hugo Touvron, Ishan Misra, Hervé Jégou, Julien Mairal, Piotr Bojanowski, and Armand Joulin. Emerging Properties in Self-Supervised Vision Transformers, May 2021. arXiv:2104.14294.
- [59] Xinlei Chen, Saining Xie, and Kaiming He. An Empirical Study of Training Self-Supervised Vision Transformers, August 2021. arXiv:2104.02057.
- [60] Aleksander Madry, Aleksandar Makelov, Ludwig Schmidt, Dimitris Tsipras, and Adrian Vladu. Towards Deep Learning Models Resistant to Adversarial Attacks. February 2018.
- [61] Chang Liu, Yinpeng Dong, Wenzhao Xiang, Xiao Yang, Hang Su, Jun Zhu, Yuefeng Chen, Yuan He, Hui Xue, and Shibao Zheng. A Comprehensive Study on Robustness of Image Classification Models: Benchmarking and Rethinking, February 2023. arXiv:2302.14301.
- [62] Maithra Raghu, Thomas Unterthiner, Simon Kornblith, Chiyuan Zhang, and Alexey Dosovitskiy. Do Vision Transformers See Like Convolutional Neural Networks? 2021.
- [63] Andrew Ilyas. [1905.02175] Adversarial Examples Are Not Bugs, They Are Features, 2019.
- [64] Davide Zoccolan, David D. Cox, and James J. DiCarlo. Multiple object response normalization in monkey inferotemporal cortex. The Journal of Neuroscience: The Official Journal of the Society for Neuroscience, 25(36):8150–8164, September 2005.
- [65] Jaap Munneke, Valentina Brentari, and Marius Peelen. The influence of scene context on object recognition is independent of attentional focus. Frontiers in Psychology, 4, August 2013. Publisher: Frontiers.
- [66] Jodi L. Davenport and Mary C. Potter. Scene Consistency in Object and Background Perception. Psychological Science, 15(8):559–564, 2004. Place: United Kingdom Publisher: Blackwell Publishing.
- [67] J. E. Rollenhagen and C. R. Olson. Mirror-image confusion in single neurons of the macaque inferotemporal cortex. Science (New York, N.Y.), 287(5457):1506–1508, February 2000.
- [68] Kalathupiriyan A. Zhivago and S. P. Arun. Selective IT neurons are selective along many dimensions. Journal of Neurophysiology, 115(3):1512, January 2016.
- [69] R. T. Pramod and S. P. Arun. Features in visual search combine linearly. Journal of Vision, 14(4):6, April 2014.
- [70] Ronald A. Rensink and James T. Enns. Early completion of occluded objects. Vision Research, 38(15):2489–2505, August 1998.
- [71] Vigneshvel T and Arun Sripati P. Coding of relative size in monkey inferotemporal cortex, 2015.
- [72] N. Apurva Ratan Murty and S. P. Arun. Seeing a straight line on a curved surface: decoupling of patterns from surfaces by single IT neurons. Journal of Neurophysiology, 117(1):104–116, January 2017. Publisher: American Physiological Society.
- [73] James T. Enns. Sensitivity to Three-Dimensional Orientation in Visual Search - James T. Enns, Ronald A. Rensink,, 1990.
- [74] James T. Enns and Ronald A. Rensink. Preattentive recovery of three-dimensional orientation from line drawings. Psychological Review, 98(3):335–351, 1991. Place: US Publisher: American Psychological Association.
- [75] J.C. Bartlett and J. Searcy. Inversion and Configuration of Faces. Cognitive Psychology, 25(3):281–316, July 1993.
Supplementary S1 Brain Property Experiments
In this section, we detail each of the 14 experiments used to assess the presence and magnitude of visual, brain-like qualitative effects in DNNs. These experiments were adopted from the work of Jacob et al [47]; we point the reader to their work for more detailed accounts of each experiment.
1&2 Multiple Object Normalization
In this experiment, we verify whether the neural response for a group of objects is an average of the individual object responses – an effect observed in high-level monkey visual regions [64]. In order to measure this effect, we identify visually active neural units for all possible positions within the image where an object may appear and record the individual object responses and the responses when all objects are shown together in the same image. We then compute the average slope of the multiple object response plotted as a function of the sum of individual object responses. If the network exhibits multiple object normalization, we should observe an average slope of 0.5 for pairs of objects (Effect 1) and 0.33 for object triplets (Effect 2).
3 Scene Incongruence
A famous observation is the effect context plays in visual categorization tasks in humans. When the background of an image is incongruent, in the semantic sense, to the object in the foreground, humans see a fall in their categorization performance [65, 66]. We test the same effect here and compute a scene incongruence index with being the average accuracy of the network on congruent object-scene images and being the incongruent counterpart and taking the ratio of their differences:
4 Mirror Confusion
In this simple experiment we verify whether the neural representations of a DNN for a vertically flipped image is closer to the original image than a horizontally flipped image. This effect is commonly observed in human behavior and monkey neural data and is termed the mirror confusion effect [67]. We compute a mirror confusion index as the following modulation index where and are the distances between the horizontally flipped image from the original image and the vertically flipped image from the original respectively.
5 Correlated Sparseness of Morphlines
In this experiment, visually active units for certain shapes are identified and are shown parametric variations of the same shape (morphlines). To show the brain-like effect of correlated morphline sparseness, these units that are selective for (or exhibit sparse responses) for only a few shapes should be highly responsive to parametric changes of that shape [68]. In our experiment, we show images from a reference set to the DNN and a parametric morphline of the same images. Neural unit sparseness on the reference set is computed and correlated with the sparseness on the parametrically varying set to arrive at a correlated sparseness strength.
6 Correlated Sparseness of Shapes and Textures
This has the same experimental setup as Effect 3 but we vary the stimulus set. Units in the brain that are shown to respond sparsely to shapes (selective to shapes) are also sparsely responsive to textures [68]. The sparseness values for visually active units for shapes and stimuli are computed and correlated to get the correlated sparseness effect strength.
7 Weber’s Law
To measure the effect strength of this fundamental property in human behavior, we show images of varying stimuli length to the network and correlate the representational difference between the stimuli and the corresponding absolute and relative length changes [69]. By taking the difference between the relative correlation and absolute correlation, we verify if the network is sensitive to relative length differences (positive strength) or absolute length differences (negative strength).
8 & 9 Occlusion effects
In human perception, images of objects and the same objects occluding each other are closer together than the equivalent 2D feature distances without occlusion between the two images [70]. To verify if this effect exists in DNNs, we compute a modulation index below where the Occlusion Index () using the neural activation differences between the objects with and without occlusion () and the same objects without occlusion and the equivalent 2D feature distances from the occluded image ():
The same experiment with a different stimuli set of depth-based occlusions are tested for effect 8.
10 Relative Size Encoding
Neurons from monkey visual areas have been shown to encode relative size [71]. For example, two parts of an object proportionally varying in size leads to a different magnitude of neural activation changes as compared to disproportional changes in size. To compute the strength of this effect we take to be the neural distance between objects with disproportional change in part sizes and to be the neural distance between objects with proportional changes in part size and take the ratio of differences:
11 Surface Invariance
Similarly, neurons also show that consistent changes between an object and the surface it rests on is closer in the neural space than inconsistent changes between the two [72]. We compute the SI modulation index by taking as the neural activation distance between stimuli with inconsistent or incongruent changes in surface and object shape and to be the distance between stimuli with the same surface and shape change:
12&13 3D Processing
3D objects are observed to be more distinct in human perception compared to similar corresponding 2D objects [73, 74]. We test this effect in DNNs by computing the modulation index for 3D processing, as a ratio of differences - the neural activation distance between 3D objects and , the distance between 2D objects of equivalent pixel or feature differences:
We use two distinct 2D feature difference stimuli to verify the effect (12 and 13).
14 Global Shape Processing
Humans are more sensitive to the global shape of objects than local shapes that make up the same global shape [23]. In perceptual space, the distance between two configurations with global changes is greater than two configurations with a local change. We compute a global advantage index by taking the neural activation differences between stimuli with global and local changes:
15 Thatcher Face Effect
Another popular qualitative effect in human visual processing is that we are more sensitive to facial feature changes on an upright face than an inverted face [75]. We measure this effect in DNNs by computing a Thatcher Effect, , by considering the difference between an upright face and the same face with flipped features as and the difference between an inverted face and the inverted face with flipped features, :
Supplementary S2: Presence of brain properties across all networks
![[Uncaptioned image]](/html/2411.16326/assets/x6.png)
Figure S2 Visualizing the presence or absence of each tested brain property effect on all 32 networks. Each shaded cell indicates an effect strength with a positive magnitude. Colors: blue - supervised CNNs, orange - supervised ViTs, violet - adversarially trained networks, red/pink - scene-trained networks, yellow- face-trained networks, green - self-supervised networks
Supplementary S3: Quantification of grouping effect of categories
![[Uncaptioned image]](/html/2411.16326/assets/x7.png)
Figure S3 Clustering Strength quantification for all three possible variational groupings. Clustering Strength was taken as 1/1+ where is the Davies-Bouldin clustering strength index for grouping i. The index is the ratio of within-cluster variance and between-cluster variance.
Supplementary S4: Layerwise evolution of brain property scores for VGG16 and ViT-B
![[Uncaptioned image]](/html/2411.16326/assets/x8.png)
Figure S4 Layerwise evolution of each measured brain property in VGG16 and ViT-B networks. The effect strength for each experiment is on the Y axes and normalized model depth is on the X axes.