Medillustrator: Improving Retrospective Learning in Physicians’ Continuous Medical Education via Multimodal Diagnostic Data Alignment and Representation
Abstract.
Continuous Medical Education (CME) plays a vital role in physicians’ ongoing professional development. Beyond immediate diagnoses, physicians utilize multimodal diagnostic data for retrospective learning, engaging in self-directed analysis and collaborative discussions with peers. However, learning from such data effectively poses challenges for novice physicians, including screening and identifying valuable research cases, achieving fine-grained alignment and representation of multimodal data at the semantic level, and conducting comprehensive contextual analysis aided by reference data. To tackle these challenges, we introduce Medillustrator, a visual analytics system crafted to facilitate novice physicians’ retrospective learning. Our structured approach enables novice physicians to explore and review research cases at an overview level and analyze specific cases with consistent alignment of multimodal and reference data. Furthermore, physicians can record and review analyzed results to facilitate further retrospection. The efficacy of Medillustrator in enhancing physicians’ retrospective learning processes is demonstrated through a comprehensive case study and a controlled in-lab between-subject user study.
1. Introduction
Physicians utilize diagnostic records for continuous self-learning and skill enhancement beyond immediate patient care (Pattni et al., 2023). This ongoing engagement is crucial for refining diagnostic practices and improving skills (Shimizu, 2023). Continuous Medical Education (CME) (Marinopoulos et al., 2007; Bordage et al., 2009) complements this effort, encouraging physicians to engage in self-directed learning through meticulous case studies and collaborative discussions with experienced peers. To support physicians’ CME, especially novices, existing literature explores pedagogical theories like Self-Directed Learning (SDL) (Knowles, 1975; Liu and Sullivan, 2021; Tagawa, 2008) and Case-Based Learning (CBL) (McLean, 2016). These theories stress self-motivated improvement and the integration of practical, case-based learning in medicine. Guided by these theories, technical solutions, including learning platforms and interactive systems (Raidou et al., 2018; Mörth et al., 2020; Yang et al., 2023), have been developed to enhance novice physicians’ learning experiences. While many platforms use clinical resources like online materials (DynaMed, 2024), slides, and videos (Medscape, 2024; VisualDx, 2024), interactive systems excel by incorporating diverse multimodal diagnostic data (Raidou et al., 2018; Mörth et al., 2020). This data encompasses radiology images (e.g., X-rays, CT scans, MRI), clinical texts (e.g., diagnostic reports), and laboratory indicators, significantly improving physicians’ retrospective learning (Cheng et al., 2021; Yang et al., 2023).
While employing multimodal diagnostic data to enhance the retrospective learning experience of physicians has demonstrated effectiveness, several challenges persist. First, a significant challenge is the lack of efficient methods for screening and identifying high-value research cases. Novice physicians, despite theoretical trained, face difficulties in matching symptom descriptions with real patient cases (Rosendal et al., 2013). Clinical practice reveals complex and variable patient conditions, where reliance on “textbook-style” identification is inadequate (Donner-Banzhoff, 2018; Worum et al., 2019). Patients with similar images and lab results may receive different diagnoses due to subtle disparities in other diagnostic data (Ahn et al., 2021). These cases, requiring thorough analysis, are valuable for retrospective learning. However, effectively screening and discovering them is challenging, akin to finding a needle in a haystack for novice physicians. Senior physicians rely on experience but face constraints due to limited exposure to valuable cases. Thus, there’s a need to identify high-value cases strategically, enabling efficient learning and continuous improvement in medical practice. Second, retrospective learning requires precise alignment and effective representation of data at the semantic level. Novice physicians, particularly those early in their careers, struggle with interpreting image data due to its complexity compared to text descriptions and indicators (Atsina et al., 2020). For instance, identifying subtle lines or changes indicating fractures on CT images can be challenging, leading to potential confusion with other bone lesions despite explicit mentions in diagnostic reports. This underscores the need for enhanced presentation of image data to facilitate comprehensive analysis, possibly by integrating other modal data for reference. However, existing research on multimodal data analysis primarily focuses on prediction and decision-making (Tang et al., 2021; Wu et al., 2023; Zeng et al., 2022), or exploring joint effects between modalities (Liang et al., 2022; Wang et al., 2021a), with alignment often limited to specific dimensions like time or individuals for particular segments. While tools for cross-modal medical data analysis exist, such as automated image segmentation (Wang et al., 2022, 2020) and medical phrase grounding (Chen et al., 2023; Li et al., 2023), they typically analyze images only at the object detection level, lacking finer semantic alignment. Additionally, current commercial tools often present different data modalities separately, requiring physicians to switch between sources like images, diagnostic reports, and indicators during case study discussions. This inconvenience not only complicates the learning process for presenters but also imposes cognitive load on listeners. Therefore, there’s an urgent need to integrate relevant multimodal data into a unified and coherent representation format. Third, ensuring the establishment of contextual references becomes imperative for interpretation and communication during the learning process, even when data is appropriately aligned and represented. Experienced physicians possess an innate ability to incorporate comparisons and references into their subjective analysis of diagnostic data. Drawing on their extensive clinical experience, they instinctively identify abnormalities by contrasting them with normal data (Qiao et al., 2014). This experiential knowledge, although subtle and implicit, significantly contributes to their diagnostic prowess. However, current research often focuses on analyzing specific diagnostic data without incorporating the normal range as a context for comparison (Silberberg et al., 2021). This presents a significant challenge for novice physicians who lack sufficient experience to discern abnormalities effectively. Cheng et al. (Cheng et al., 2021) further underscored the importance of reference values, highlighting that “the reference values are vital in facilitating prediction interpretations for clinicians” in both static and dynamic contexts.
In this study, we focus on enhancing physicians’ retrospective learning through integrating multimodal diagnostic data, targeting continuous medical education. Through a formative study involving six physicians, we identified current patterns and concerns in retrospective analysis and derived design requirements to address them. Following Bruner’s discovery learning theory (Bruner, 1960), we structured these requirements into three levels: (1) leveraging prior knowledge for broad concept understanding (overview), (2) promoting active engagement and inquiry-based learning (detail), and (3) providing scaffolding for comprehension through various representations (retrospection). Our solution, Medillustrator, is a visual analytics system tailored to aid novice physicians in retrospectively analyzing multimodal diagnostic data. It offers a structured approach, allowing users to begin with an overview for screening research cases, delve into specific cases with multimodal data and references, and record analyzed results for review and retrospection. To validate its effectiveness and usability, we conducted a comprehensive case study with a controlled user study. In summary, the main contributions of this study are as follows:
-
•
We identify current patterns and challenges in physicians’ retrospective analysis through the formative study.
-
•
We develop a visual analytics system with a structured data processing and modeling pipeline to present consistent multimodal diagnostic data alignment and visualization to facilitate the learning experiences of novice physicians.
-
•
We demonstrate the effectiveness and usability of our approach through a case study and a controlled user study.
2. Related Work
2.1. Continuous Medical Education
Beyond traditional medical education, continuous medical education (CME) (Marinopoulos et al., 2007; Bordage et al., 2009) is crucial in the lifelong learning of physicians. This ongoing educational process is essential for health professionals to consistently uphold, update, and refine their knowledge, skills, and attitudes, thereby ensuring proficient practice. CME can be categorized into three distinct types based on learning formats: active learning, passive learning, and unstructured learning (317, 2020; Stephenson et al., 2020). Active learning includes structured training activities like seminars, workshops, and conferences, where participants actively engage in the learning process (Nguyen et al., 2021). Passive learning emphasizes the acquisition of knowledge from external sources such as medical journals, online resources, and other self-study materials. Meanwhile, unstructured learning focuses on self-directed exploration within practical work settings, such as clinical practice, case studies, and collaborative discussions (Donkin et al., 2023).
This study concentrates on enhancing the retrospective learning experience of novice physicians by examining clinical diagnostic data. This involves engaging in various learning formats, such as participating in workshop discussions for active learning, analyzing existing materials for passive learning, and independently exploring data from diverse sources in unstructured learning.
2.2. Diagnostic Multimodal Data Analysis
Analyzing clinical diagnostic data from a single patient often yields information in multiple modalities, such as radiology images, medical texts, and laboratory test results. However, conducting a comprehensive analysis during the data analysis and learning process poses a significant challenge (Cui et al., 2022). To address this challenge, deep learning-based methods have been developed for multimodal data analysis, employing multimodal fusion to extract and model complex relationships across different modalities (Wang et al., 2021c; Holste et al., 2021; Lu et al., 2020; Duanmu et al., 2020).
Existing work in this domain can be categorized based on two fusion strategies: decision-level fusion and feature-level fusion (Huang et al., 2020). Decision-level fusion involves independently obtaining prediction results for each modality and subsequently fusing these predictions. This approach allows for fusing different modalities without retraining the unimodal models, offering flexibility and simplicity. Fusion strategies employed in existing work include majority vote, weighted sum, and averaging (Rokach, 2010; Zhu et al., 2022; Shehanaz et al., 2021). Specifically, Wang et al. (Wang et al., 2021c) proposed a joint multimodal fusion algorithm that considers model uncertainty when estimating correlations among predictions from different modalities. Holste et al. (Holste et al., 2021) utilized the output probabilities of unimodal predictions to fuse image-derived features with tabular non-image features, while Huang et al. (Huang et al., 2020) introduced a meta-neural network classifier trained with predicted probabilities from both medical images and electronic medical records (EMR). However, decision-level fusion integrates information only at the prediction stage, overlooking interactions between underlying features. This approach limits information integration for the relationships across multiple modalities.
On the other hand, feature-level fusion involves combining original data and extracted features from different modalities into multimodal hidden representations for final decision-making, offering advantages in capturing intricate relationships between modalities (Cui et al., 2022). For example, Lu et al. (Lu et al., 2020) concatenated clinical features with learned pathology image features for classifying primary or metastatic tumors and determining origin sites. Duanm et al. (Duanmu et al., 2020) utilized the learned feature vector of non-image modality along with image features at multiple layers to predict responses to chemotherapy in breast cancer. The literature also explored connections and joint effects among different modalities. In a study by Chen et al. (Chen et al., 2023), the focus lies on the medical phrase grounding (MPG) task, presenting strategies for contextually aligning text descriptions with corresponding regions of interest (ROIs) in medical images. Another study by Qin et al. (Qin et al., 2022) employed vision-language models, focusing on formulating effective prompts for object detection in medical imagery. Additionally, Chen et al. (Cheng et al., 2021) proposed a visual analytics system designed for analyzing features in electronic health records (EHR) through contribution-based post hoc explanations. While these studies present effectiveness, they primarily targeted diagnostic prediction and decision-making. Besides, the multimodal alignments predominantly concentrated on the object detection level with limited fine-guaranteed analysis.
Our work distinguishes itself from prior research in facilitating novice physicians’ retrospective learning, with concerns about multimodal data alignment through feature-level fusion at the semantic level. We also incorporate contextual information for explicit interpretation and reference, aiming to reveal the implicit diagnostic experience of senior physicians based on a comparison of reference values.
2.3. Multimodal Medical Data Visualization
Medical data not only holds critical information for treatment decisions but also plays a pivotal role in retrospective learning through data analysis. While analyzing heterogeneous medical data from various sources poses challenges, visual analytics systems, integrating interactive visualization methods with statistical inference and correlation models, have demonstrated the potential to aid users in effective analysis, thereby concealing the underlying complexity of the data (Caban and Gotz, 2015).
Besides the works that concentrate on individual data modalities (Wang et al., 2021b; Shahar et al., 2006; Sultanum et al., 2022), existing studies have introduced multimodal data visualization tools to facilitate comprehensive analysis. For example, Raidou et al. (Raidou et al., 2018) presented tools that enable detailed visual exploration and analysis of how variations in bladder shape impact the accuracy of dose delivery. Bannach et al. (Bannach et al., 2017) combined medical image analysis with visual analytics of patient data to analyze patient cohorts.
While multimodal data visualizations have demonstrated effectiveness, they often align various data modalities based on specific dimensions such as patient or timestamp (Cheng et al., 2021; Yang et al., 2023), resulting in separate presentations for each data modality. This segmented presentation limits the coherent analysis of patient cases, hindering a comprehensive understanding across different modalities. To enhance the coherence and unity of presentation in physicians’ multimodal medical data analysis, our approach centers on image modality, complementing it with overlays of additional modalities (e.g., diagnosis text). This method emphasizes the pivotal role of image data in diagnostic analysis, facilitating a deeper and more intuitive understanding by merging visual and textual data into a unified, cohesive representation. Additionally, we integrate indicators and supplementary data, even when not directly tied to the primary information, to serve as reference points for diagnostic analysis.
3. Formative Study
To address physicians’ challenges in retrospective learning, we conducted a formative study to pinpoint their specific difficulties in this phase. Analyzing the study results yielded valuable insights, informing the formulation of design requirements for our approach.
3.1. Participants and Procedure
We engaged with a team of six domain experts (E1-E6) (Table 1) from a local hospital, consisting of four novice physicians (E1: male, E2: male, E4: male, E6: male) and two experienced physicians (E3: female, E5: male). While E1 and E3 are in the same department, the others are from different departments. Each physician brings clinical experience and actively engages in medical education activities. With approval from the Institutional Review Board (IRB), we conducted semi-structured interviews to glean insights and ideas from the physicians. Throughout these interviews, participants addressed open-ended questions about their typical practices and approaches in retrospective learning, also sharing the challenges they face in their practices.
| ID | Gender/Age | Exp | Position | Specialty |
|---|---|---|---|---|
| E1 | F/32 | 1/5 | Resident | Cardiology |
| E2 | M/36 | 2/9 | Attending Physician | Endocrinology |
| E3 | F/51 | 15/23 | Chief Physician | Orthopedics |
| E4 | M/32 | 0/4 | Resident | General Practice |
| E5 | M/47 | 10/18 | Associate Chief Physician | Cardiology |
| E6 | M/28 | 0/1 | Intern | Orthopedics |
3.2. Analysis and Results
The interviews were recorded with participants’ consent and transcribed into text. Thematic analysis (Boyatzis, 1998a) was used to analyze the data and derive qualitative findings, due to its ability to reveal patterns and themes in qualitative data, offering insights into participants’ experiences, perspectives, and behaviors (Clarke and Braun, 2017). The challenges identified during physicians’ retrospective learning are summarized below:
C1. Sifting through patient data to find valuable learning cases is inefficient and time-intensive. Novice physicians often find themselves tasked with patient diagnoses and retrospective studies under the guidance of senior physicians. Given the inherent value of physicians’ time, the crucial aspect of ensuring the quality of learning lies in the analysis of high-value case data. However, sifting through tons of patient cases to identify valuable learning cases proves to be a challenging and time-consuming process. E2 shared their experience, stating, “I tried going through clinic cases during my internship, thinking I’d dig up some valuable insights. But, turns out, sifting [through them] manually was a real-time sink – inefficient and didn’t give much insight for all the time I put in.” The current approach relies on senior physicians to select and summarize typical cases presented in seminars for clinical case teaching and discussion. However, this method, relying on accumulated years of experience, is equally inefficient. According to E5, a senior physician, “Even with all my experience, picking cases to teach new physicians is tricky. It’s not just about going for the complicated ones; it’s about finding the ones that pack the most educational punch. Depending too much on personal judgment and experience might unintentionally miss out on less obvious but just instructive cases, which ends up narrowing the learning scope for [new] physicians.”
C2. Identifying areas of abnormality and pathology is challenging. Among the various modalities of diagnostic data, physicians generally acknowledged the crucial impact of image data during diagnostic analysis. As mentioned by E3, “In real-world practice, images like X-rays or MRIs give us a clear, intuitive understanding of a patient’s condition. These visuals can uncover issues that are hard to spot using other methods and play a crucial role in supporting further diagnosis.” When physicians review medical images, the primary goal is to identify areas of interest for further analysis. These areas could include lesions or lumps in the case of detecting lung cancer, a task that remains challenging for novice physicians during the comprehensive analysis of data from other modalities. As highlighted by E6, “We often find it challenging to interpret [medical] images, especially when it comes to spotting subtle issues like small lesions in lung cancer. Combining these findings with other [clinical] data adds another layer of complexity to our diagnostic process.”
C3. Providing comprehensive diagnostic results with contextual referencing and comparison is time-consuming. To deliver well-informed and unbiased diagnostic results, physicians must conduct thorough analyses across various data modalities. This involves using laboratory test results, such as red blood cells, white blood cells, and platelet count, as filters for judgment, and exploring other modalities like image data for further decision-making. However, this cross-modal analysis is time-consuming and adds an extra layer of complexity to the analytical process. As E2 mentioned, “We have to dive into the nitty-gritty details of diagnostic data, and things get more complicated when we need to combine and analyze [information] from multiple sources.” Experienced physicians also acknowledged their reliance on subjective experience for comparison given data with references mentally during diagnosis. However, almost all participants agreed that this comparison, without a clear view, poses challenges, especially for novice physicians’ analysis. E4 emphasized, “As a novice physician, the limited experience makes comparative diagnostic analysis quite a challenge. It’s tough to make those subtle comparisons in diagnosis, which comes more naturally to experienced physicians.”
C4. Reviewing analyzed data with integrated results and insights leads to additional burdens. Participants also highlighted the importance of a retrospective view for their learning and analysis during CME. E5, who combines practical teaching with instructing experiences for novice physicians, emphasized, “Recalling previous cases helps and draws insights from teaching improves how I diagnose and makes me better overall.” However, their current recording methods often separate diagnostic data from corresponding insights and findings, adding extra burdens to their review process. E6 further explained, “Sorting through scattered information when revisiting cases can be a bit tricky. Extracting meaningful patterns and insights from the collected data becomes a real challenge.”
3.3. Design Requirements
Based on insights from the interview analysis, we formulated design requirements tailored to address the identified challenges in analyzing multimodal medical data for physicians. These requirements are structured to align with active, discovery-driven learning processes, guided by the principles of the discovery learning theory (Bruner, 1960). The structured design requirements are as follows: 1) Initiate an overview level analysis of patient data to foster a broad understanding of concepts built upon prior knowledge (R.1-R.2). 2) Enable users to actively engage in exploration at the detail level for specified cases (R.3-R.5). 3) Facilitate the recording of findings for subsequent review and retrospection, providing scaffolding to consolidate understanding (R.6).
[Overview]R1. Present patient characteristics overview. Physicians expressed challenges in efficiently filtering and identifying valuable patient cases for retrospective learning. They emphasized the importance of analyzing cohorts with similar conditions or symptoms, crucial for diagnostic decision-making and CME practice enhancement. Furthermore, physicians stressed the significance of studying cohorts with specific demographic characteristics like age and occupation. As articulated by E3, “When you’re looking at osteoporosis, you’ll find that [different] age groups usually have specific common conditions. It helps us understand how factors such as age play a role in the development and progression of diseases like osteoporosis. Besides, the same goes for occupational health. If we check for joint degradation in people with extensive hours of physical labor, it reveals risk factors and ways to prevent issues for certain job-related groups.”. To mitigate C1, it is imperative to provide an overview to enable physicians to seamlessly view and filter patient cases based on relevant characteristics.
[Overview]R2. Facilitate comparison of multimodal data across patient cases. Physicians emphasized the importance of being able to compare multimodal data across patient cases. Such comparisons often unveil distinctive insights when different modalities are considered. Specifically, two patient cases might share similarities in indicator data but show significant differences when involving consideration of image data. As shared by E5, “For example, we had two patients with blood tests showing a marker called carcinoembryonic antigen (CEA), which can hint at possible cancer risk. But when we dug deeper with MRI scans, we saw some big differences between them. One patient’s MRI showed everything [looking] normal - consistent signal intensities and no signs of abnormalities, indicating healthy tissue. But in the other patient’s [scan], things were different. We saw irregular signal levels and masses, which could mean there’s some abnormal, maybe cancerous tissue there.” The multimodal comparison brings out variations, highlighting unique patterns and correlations among different patient cases, thus offering valuable clinical insights.
[Detail]R3. Uncover connections between image and other modalities. Recognizing the challenges in interpreting image data mentioned in C2, physicians considered it highly beneficial to correlate image-related information with corresponding diagnostic data. For instance, linking relevant areas in an image with corresponding text descriptions could provide valuable insights for novice physicians during the interpretation process. As explained by E4, “When we’re looking at a spinal MRI, if we can match up the interesting parts in the images with notes that describe specific spinal issues, like disc herniation or spinal stenosis, it really helps us get a much better understanding.”
[Detail]R4. Provide coherent representation of aligned image data with corresponding information. Physicians emphasized the need for structured presentation of image-enhanced data, recognizing the benefits of aligning multimodal data for analysis. E5 noted, “Combining textbook-style explanations with illustrative diagrams provides a clearer picture for analyzing multimodal data in patient cases, especially for guiding new physicians.”
[Detail]R5. Display relevant contextual information for diagnostic analysis. Patient cases contain diverse data types beyond images, including structured data and blood test indicators. While displaying essential context is crucial, analyzing these varied datasets comprehensively can be complex and time-consuming. To address C3, different information types should be represented based on their characteristics. This may involve presenting demographic details and patient distribution, visualizing changes in time-series data like medication records, and comparing laboratory results with reference ranges. Though these data may not directly influence diagnostic decisions, presenting them alongside analysis serves as valuable screening references, enhancing efficiency and accuracy.
[Retrospection]R6. Enable recording and reviewing of analysis results. In response to C4, physicians expressed the need for a more efficient method to document and revisit analyzed insights. For instance, E1 highlighted the importance of documenting specific features observed in joint X-rays, like joint space narrowing in osteoarthritis cases, correlating these findings with patient symptoms. This record of insights enhances retrospective learning, crucial in discovery learning for consolidating valuable knowledge. Thus, the ability to record and revisit insightful reflections is essential for improving both the diagnostic process and the physician’s knowledge base.
4. Medillustrator

After gathering discussions and design requirements from the formative study, we developed Medillustrator, an interactive visualization system tailored to assist physicians in efficient and effective learning and retrospection using diagnostic data. The system’s approach and methods include three core components: (a) a data processing module, (b) a modeling engine, and (c) a visualization interface.
4.1. Data Processing
To illustrate our approach, we curated a dataset containing diagnosis and treatment records for cervical spine diseases obtained from a reputable local hospital. This dataset consists of data from patients treated between 2021 and 2022, including MRI images, diagnostic texts, patient demographics, structured data, and more. The data is categorized into three modalities: image, text, and indicator. To protect privacy, we anonymized the data irreversibly. We detailed the processing steps for each modality as follows.
Image Data Processing: To model and align the relationship between image data and other modalities, particularly text, a training dataset is essential. We collaborated with physicians to manually annotate MRI images using the labelme annotation tool (Russell et al., 2008). Senior physicians identified regions of interest on MRI images during diagnosis, marking them with bounding boxes. They then annotated textual information associated with these areas, specifying the name of the region in the diagnostic text (e.g., specific cervical vertebrae regions and areas of cerebrospinal fluid). This process documented regions of interest alongside corresponding diagnostic text in a json format file, facilitating the establishment of connections.
Text Data Processing: Each MRI image is paired with a diagnostic text description, including both the ”medical description” and ”medical diagnosis” sections. In the preprocessing phase, we combined the imaging description and diagnosis, followed by manual cleaning of the text to ensure consistent formatting, aiding alignment modeling.
Indicator Data Processing: We began by filtering and categorizing the indicator data into two groups: imaging indicators and laboratory indicators, based on their characteristics and role in the diagnostic analysis. Imaging indicators comprise data from MRI imaging, representing areas like cerebrospinal fluid (CSF) and specific cervical intervertebral disc regions (e.g., C1-C2), with metrics such as maximum, minimum, and average signal intensity values. After consultations with experts, we calculated signal intensity divisions for cervical intervertebral disc regions and the mean of CSF to assess MRI signal intensity. Laboratory indicators serve as diagnostic reference points, including measurements related to metabolic processes, organ function (e.g., blood glucose, proteins, enzymes), and immune and health evaluations (e.g., platelets, red blood cells, white blood cell types). These indicators are categorized accordingly. Imaging indicators are aligned with other modalities for representation and interactive analysis, while laboratory indicators are presented independently for reference.
4.2. Modeling Engine
4.2.1. Multimodal Data Alignment
Effectively aligning diagnostic text descriptions with regions of medical images is crucial for conveying information, especially to novice physicians. To accomplish this, we refined the grounding dino model (Liu et al., 2023) within the robust training framework of mmdetection. Chosen for its capability as an open-set object detector, the grounding dino model excels at recognizing diverse objects based on human inputs like category names or descriptive expressions. Capitalizing on its adaptability, we customized the model to our requirements, enhancing its ability to precisely identify and correlate textual descriptions with corresponding regions in medical images. During training, we curated pairs of image-text data, effectively matching diagnostic descriptions with corresponding image regions. By exposing the model to this annotated dataset, the intricate relationships between textual descriptions and visual features in medical images were learned. The dataset was divided into a training set and a test set with an 8:2 split ratio, resulting in approximately 600 pairs for training and 150 for testing. The training lasted for 50 epochs, achieving a Mean Average Precision (MAP) of 0.53. After training, the model accurately generates bounding box predictions for categorized regions, outlining the areas of interest in the images.
To enhance alignment precision and achieve pixel-level correspondence between text and image, we utilized the segment anything model (Kirillov et al., 2023). Using the bounding boxes from the grounding dino model as inputs, the model performs semantic analysis, generating pixel-level segmentation predictions for relevant regions in the images. This pixel-level alignment improves the visual representation of diagnostic information and aids clearer interpretation, empowering physicians, especially those with less experience, to effectively understand and analyze complex medical data.
4.2.2. Modality Embedding and Discrepancy Assessment
To provide physicians with a comprehensive overview of patient condition distributions, we integrated information from various modalities, including images, diagnosis text, and imaging indicators. For the imaging modality, we utilized the resnet50 architecture to extract image features, generating 2048-dimensional embeddings. For diagnostic text, we used the bert-base-uncased model to obtain 768-dimensional embeddings that capture semantic nuances. For the indicators, we conducted direct dimensionality reduction to synthesize essential quantitative data. These modalities—image, text, and indicators—were then fused by concatenation to form a unified representation, combining rich information from diverse sources. We used UMAP (McInnes et al., 2018) to reduce each individual modality and the fused embeddings to two-dimensional coordinates, which equips physicians with enhanced diagnostic capabilities and facilitates informed decision-making.
To gain a comprehensive understanding of patient conditions, we explored the interaction between different modalities. Calculating the k nearest neighbors (knn) within each patient’s modality data coordinates allowed us to understand their profile within each modality’s scope. By identifying the intersection of nearest neighbors across modalities, we uncovered areas of agreement and disagreement in patient-level distributions (see subsubsection 4.3.2). This detailed analysis helped identify subtle variations and inconsistencies across modalities, offering valuable insights for clinical decision-making and treatment planning.
4.3. Visualization Interface
Following the visualization mantra of “overview first, zoom and filter, then details on demand” (Shneiderman, 1996), we prioritized usability and effectiveness in our design process. Collaborating with physicians, we refined the Medillustrator interface based on formative study findings. The interface comprises five interconnected views: Mentions View, Embedding View, Information Exploration View, Detail View, and Record View. Aligned with the discovery learning theory (Bruner, 1960), the interaction workflow is structured into three levels: users begin with a general overview to identify high-value research cases at the Mentions View and Embedding View (R1-R2). They then delve into comprehensive information exploration about specific patient case patterns at the Information Exploration View and Detail View (R3-R5). Finally, users record and review analyzed insights for organization and retrospection at the Record View (R6).
4.3.1. Mentions View
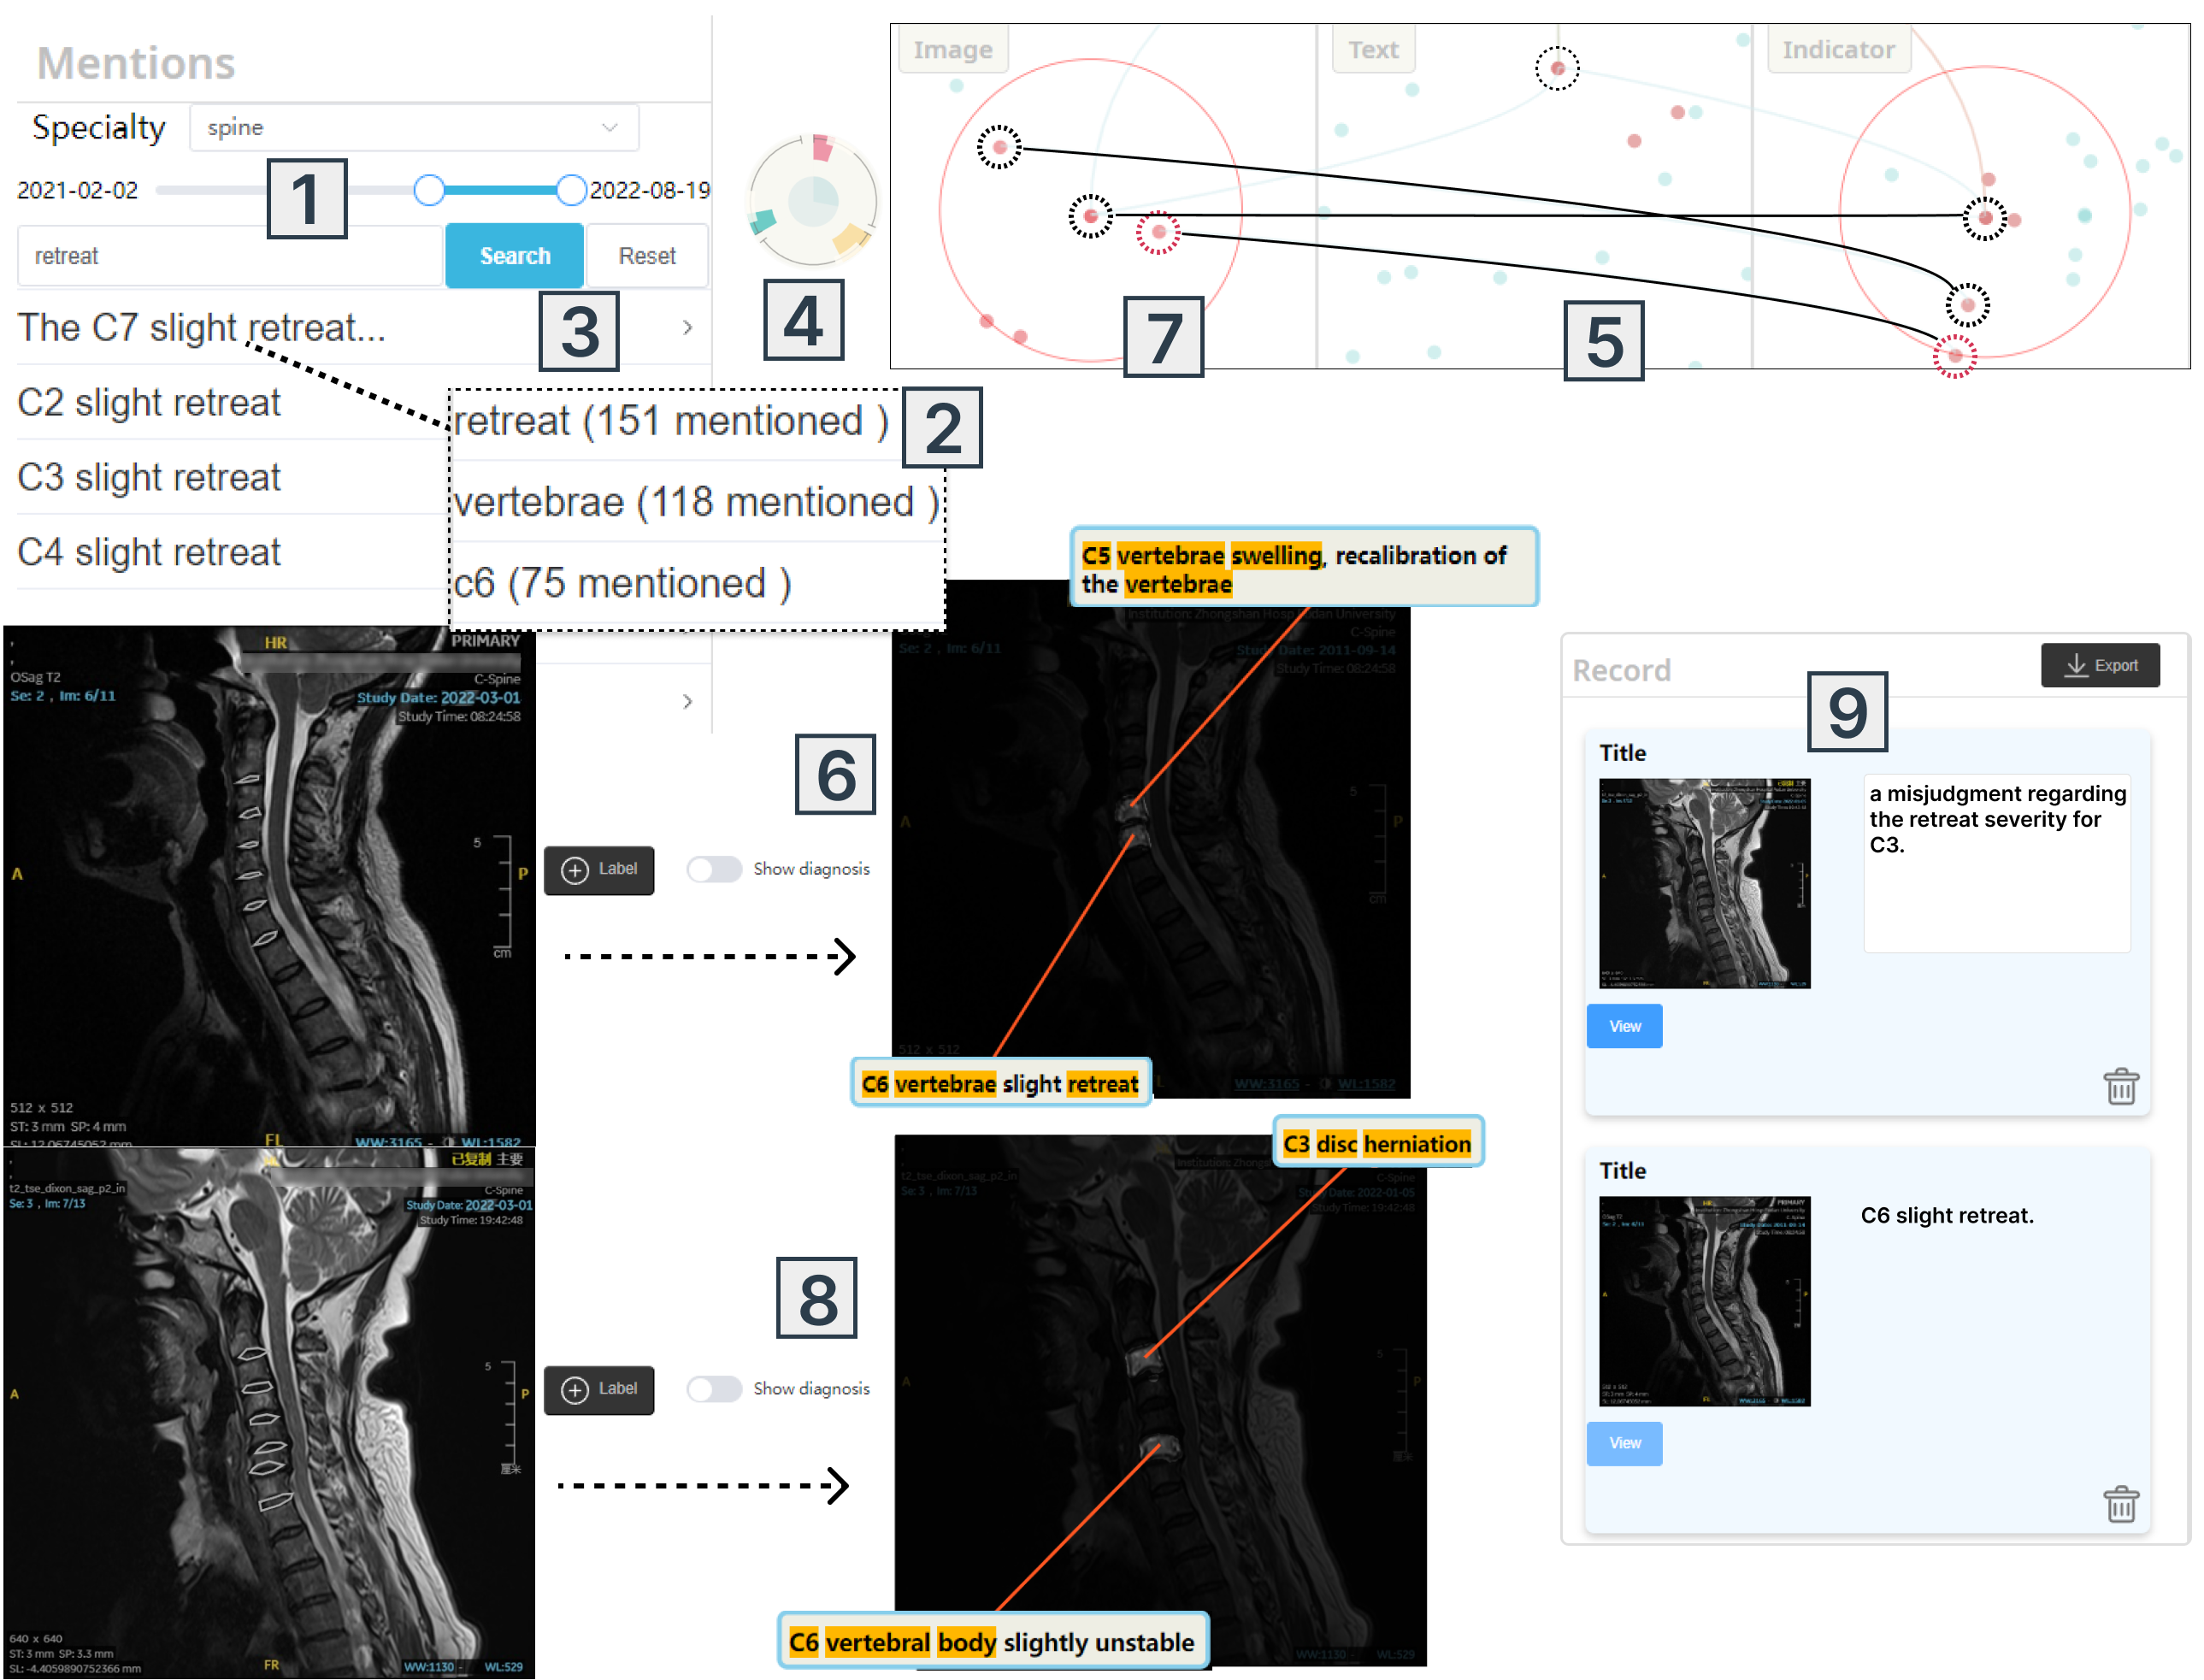
The Mentions View (Figure 4 ) offers a comprehensive textual overview of patient data. Users can select their specialty and specify time periods using an intuitive range slider. A search bar allows filtering of patient cases by specific diseases or symptoms. When the search bar is empty, keywords from patient cases are displayed, sorted by frequency, with the most mentioned keyword at the top. Clicking on a keyword reveals related diagnosis texts. Entering specific information in the search bar updates the rows below to show relevant diagnosis texts. Clicking the search icon ![]() filters patient cases to only display those containing the entered text in their diagnostic text. This method significantly reduces the number of cases requiring review, enhancing analysis efficiency (R1).
filters patient cases to only display those containing the entered text in their diagnostic text. This method significantly reduces the number of cases requiring review, enhancing analysis efficiency (R1).
4.3.2. Embedding View
The Embedding View (Figure 4 ) illustrates the distribution of patient cases across modalities’ features (R2). Each patient is depicted as a node, showcasing their distribution based on image, text, and indicator features. Additionally, a custom glyph represents the similarity between pairs of these three modalities and their distribution across patients in the fusion modal (Figure 2 ). Selecting a patient by clicking on the glyphs or lassoing for a patient group in the fusion modality connects each glyph to corresponding nodes in other modalities (Figure 2 ). This design allows users to observe patient distribution within the same modality and track patient groups across different modal embeddings. Clicking on a patient’s glyph reveals the range and corresponding nodes of the nearest neighbors (knn) in the three unimodal embedding views below. The knn nodes are marked in red within this area, with a circle centered on the current patient’s node extending to the farthest knn node based on distance (Figure 2 ). Additionally, knn nodes corresponding to the same patients across different modalities are interconnected (Figure 2 ). This presentation effectively captures variance information about the surrounding crowds of the same patient across various modalities, facilitating the identification of significant feature differences at different modal levels.
To visually represent variations in patient cases with notable differences across modalities, we devised a glyph (Figure 2 ) for each patient case in the fusion modality, depicting the consistency of patient distribution across modalities. The outer ring of the glyph is divided into three equal segments, each occupying 120 degrees (Figure 2 ). These segments denote the similarity among the surrounding crowd between image-text, image-indicator, and text-sentence pairs, respectively. We computed the knn set of the current glyph’s corresponding patient in the three modalities and utilized the Jaccard similarity(Jaccard, 1912) calculation method to capture the similarity of the surrounding crowd between these modal pairs. For each segment, we employed a donut chart, where the size of the angle represents the magnitude of the Jaccard similarity value under the comparison of the current two modalities (Figure 2 ). Drawing inspiration from existing designs(Ying et al., 2021), we introduced a refined box plot within each glyph (Figure 2 ), illustrating the distribution of similarity values between the two current modalities among all patients in each segment. This aids in assessing the distribution of modal difference values for the selected patient within the overall patient cohort. In the inner circle area of the glyph, we comprehensively calculated the Jaccard similarity of the surrounding patients set across the three modalities () and employed a pie chart-based design to depict the overall similarity status of the current glyph’s corresponding patient with the surrounding patients in each modality, represented by the size of the fan-shaped angle (Figure 2 ).
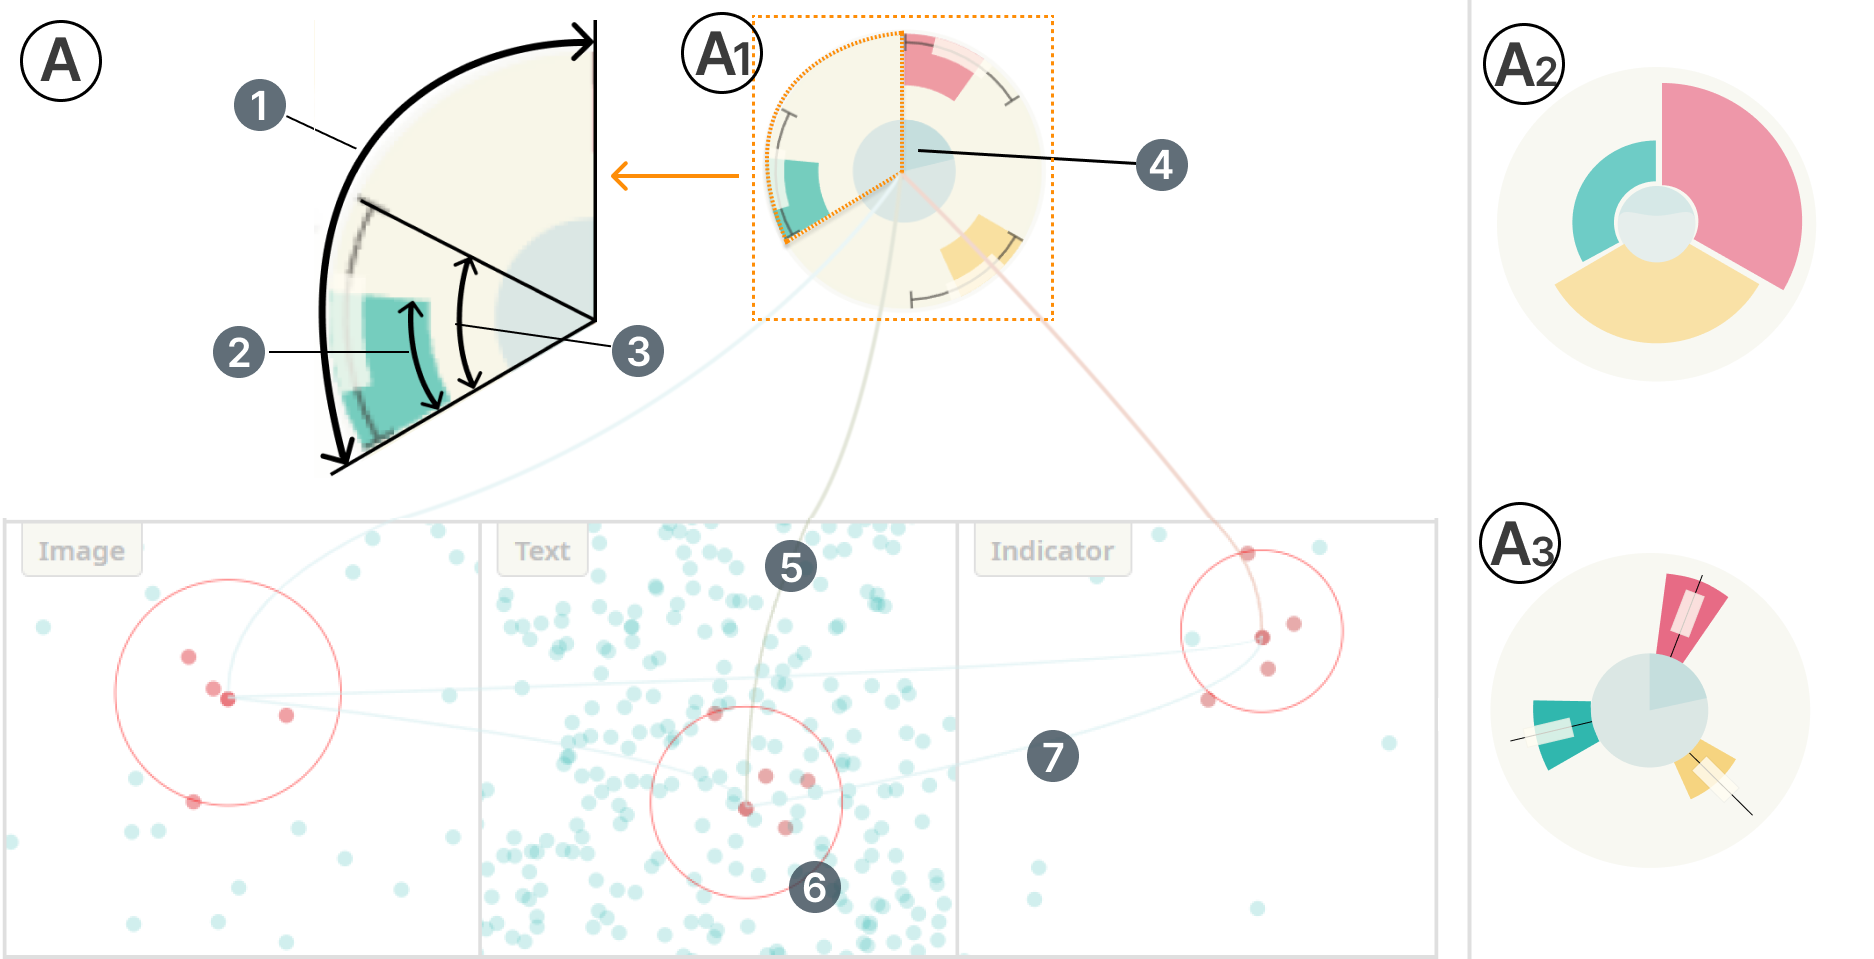
Design Alternatives. During our design iterations, we explored three glyph designs for the fusion modal. For the first alternative (Figure 2 ), we adapted the rose chart to represent modal similarity. However, we encountered issues with sectors occupying disproportionate spaces and being closely connected, hindering user comprehension. For the second alternative (Figure 2 ), we adjusted the angle each pie chart area occupied to better highlight differences in information. Additionally, we incorporated box plots within each sector to depict the distribution across patients. However, user feedback revealed this design could not effectively convey differences in similarity values. Our final design (Figure 2 ) utilized a donut chart, with angle size indicating similarity values, providing clearer representation. Moreover, we transformed the box plot into an arc curve, aligned with the donut chart. The arc’s length indicates similarity distribution across the patient population, with vertical lines denoting minimum and maximum values, and a central box highlighting quartiles. After evaluating all options, we settled on the third design.
4.3.3. Information Exploration View
We segmented the Information Exploration View into three sections, each displaying the Indicator, Medical History, and Physical Examination of the selected patient case. We also simultaneously provided information about the normal reference ranges and the distribution across the general patient population for these indicators (R3, R5).
Indicator. In the indicator subview (Figure 4
), we presented patients’ demographic information and laboratory indicator. After consulting domain experts, we selected height, weight, and age as the displayed demographic information, ensuring relevance for disease analysis while safeguarding privacy. Using a stripe plot design, color intensity reflects the count of patients corresponding to different indicator values, with a ![]() highlighting the current patient’s value.
highlighting the current patient’s value.
We categorized laboratory indicators into: Renal Function (RF) and Liver Function (LF) Tests and Complete Blood Count (CBC). Below the demographic information, a radar chart displays detailed subcategories and values of laboratory indicators for each category. Users can select the specific categories through the menu above the radar chart. The radar chart’s outer and inner circles delineate the normal reference range, while red points illustrate the current patient’s indicator values. This design effectively communicates the overall status of indicator values within each major category while also addressing the need to scrutinize individual indicators of interest.
In response to expert feedback emphasizing the importance of certain indicators for disease screening, we introduced stacked bar charts beneath the radar chart. Dark-colored stripes represent the normal reference range, with upward arrows ![]() indicating the current patient’s values.
Following experts’ advice, we chose blood sugar and cholesterol as fixed indicators, enabling users to add new indicators for further analysis by clicking on corresponding nodes
indicating the current patient’s values.
Following experts’ advice, we chose blood sugar and cholesterol as fixed indicators, enabling users to add new indicators for further analysis by clicking on corresponding nodes ![]() in the radar chart.
in the radar chart.
Design Alternatives. During the design iteration, we explored various alternatives for presenting laboratory indicators. Initially, we tested box plots, beeswarm plots, and violin plots to show current patient values alongside population distribution. However, users prioritize assessing if indicators fall within the normal range for disease analysis, rather than comparing distributions across groups. In the second alternative, we used parallel coordinate axes with normal ranges marked on each axis, but found cluttered lines due to numerous indicators. Our final design employed radar charts, indicating normal ranges in inner and outer circular areas for intuitive assessment and outlier detection. Additionally, we added stacked bar charts based on user feedback to provide detailed insights into specific indicators.
Medical History. We organized the medical history subview to present the structured text of the current patient. Initially, we highlighted the patient’s Chief Complaint, offering physicians immediate insights into the primary concern. Subsequently, we presented the patient’s medical history information chronologically, starting from the most recent to the oldest, which includes the History of Present Illness (HPI). This chronological sequence aids users in understanding the patient’s condition progressively, from the most relevant to the least, thereby streamlining information retrieval efficiency.
Physical Examination. In the Physical Examination subview (Figure 4 ), we presented the patient’s physical examination results. After consulting with domain experts, we selected physical examination indicators covering four areas: neck, upper limbs, lower limbs, and nervous system. These indicators can be categorized into three main types: general condition, range of motion, and fine movements and reflex testing results. We found that the qualitative values of these indicators often manifest as binary oppositions, such as normal/abnormal, negative/positive, and presence/absence. To prevent complexity and visual overload in the raw data, we arranged these indicators horizontally in line charts based on different body parts. We utilized ”normal” and ”abnormal” to represent positive and negative outcomes for each indicator, respectively. Hovering over a specific indicator node on the line chart reveals its name and related information. Additionally, we included a stacked bar chart below the line chart, using differently colored bars to indicate the types of examination. This design allows users to easily differentiate between abnormal and normal indicators within a cluster of various indicators, facilitating the exploration of related information, major categories, and specific examination items.
4.3.4. Detail View
The Detail View (Figure 4 ) illustrates multimodal medical data alignment and representation based on patient cases selected in the Embedding View (R3-R4). Acknowledging the human learning process, especially the forgetting curve ((2013), 1885) and cognitive load (Sweller et al., 1998; Sweller, 1988; Paas et al., 2003), underscores the challenges of flexible knowledge application. To address these challenges, we divided the Detail View into two phases: the Practice Phase and the Learning Phase.
In the Practice Phase, the raw image of the selected patient case is displayed. Thumbnails of the selected cases appear below, with the currently selected image outlined in red. Users can switch between cases by clicking on the respective thumbnails. Additionally, imaging indicators are presented on the right side of the image. These indicators include the minimum, maximum, and average signal intensity during MRI imaging process of cervical intervertebral discs (e.g., C2-C3 = [C2-C3 min, C2-C3 mean, C2-C3 max]). Using parallel coordinate axes design, the horizontal axis represents the minimum and maximum values of the disc signal indicators among all patients, while a polyline connects the current patient’s values across different indicator values within each cervical intervertebral disc region. Density information is incorporated to show the overall distribution on each axis, and indicator data is normalized to reduce biases.
Users can visually examine the variation between minimum, average, and maximum values within a specified cervical intervertebral disc region by observing slope change within the group of signal values (e.g., C2-C3). For example, a significant variance between minimum and average values suggests possible disc protrusion. To align imaging indicators with the corresponding image areas, we extracted the indicator name as text information to construct connections. Given that our target users are novice physicians with medical backgrounds, we found that their challenge lies in making accurate descriptions and diagnoses rather than matching region names with image areas. Therefore, in the Practice Phase, we directly marked the cervical intervertebral disc area on the image with a borderline.
Hovering over the relevant area highlights the corresponding indicator, while reducing the opacity of indicators for other parts to minimize disruptions. Users can customize drawing on the image to highlight their area of interest by clicking the ![]() button, then input labels, diagnostic content, and insights as notes for the selected area. Clicking the
button, then input labels, diagnostic content, and insights as notes for the selected area. Clicking the ![]() button marks the selected area on the current image. Users can view added content by hovering over the area or clicking to display it for further editing. After analyzing the current case, users can click the
button marks the selected area on the current image. Users can view added content by hovering over the area or clicking to display it for further editing. After analyzing the current case, users can click the ![]() button to save the patient case and analysis as a card in Record View (Figure 4 ) for subsequent review (R6).
button to save the patient case and analysis as a card in Record View (Figure 4 ) for subsequent review (R6).
Upon completing exploration and analysis in the Practice Phase, users can transition to the Learning Phase by clicking the ![]() . In the Learning Phase, we established links between relevant areas of the image and corresponding diagnostic text, highlighting these areas by adding a mask to the original image. To facilitate text annotations on the image, we constructed a force-directed model inspired by text layout designs (Wang et al., 2018; Cui et al., 2010). In particular, we proposed the following design principles of the model: DP1. Text area should avoid overlapping with each other or with the image. DP2. Text should be evenly distributed around the image, preventing clustering in some areas while leaving others blank. Each diagnostic text and image is treated as a single object in the force simulation and calculation process. Two types of forces are applied to these objects: textual repulsion forces and text-image spring forces. Textual repulsion forces between text area and , with mass and are proportional to their distance (). This ensures that closer texts experience stronger repulsion, thereby preventing overlaps during position adjustments (DP1). Conversely, text-image spring forces () between text and image, with mass and , are inversely proportional to their distance. This maintains a balance, preventing text from straying too far from the image during position adjustments, thus fulfilling DP2. The combined effect of these two forces ensures that text areas, subject to balanced forces, are evenly distributed around the image’s core. Furthermore, the strength of both forces is proportional to the word count (treated as mass) in the text, considering that texts with more words generally require more display space. To minimize oscillations resulting from the force updates during positional adjustments, we implemented a damping function throughout the iteration process.
. In the Learning Phase, we established links between relevant areas of the image and corresponding diagnostic text, highlighting these areas by adding a mask to the original image. To facilitate text annotations on the image, we constructed a force-directed model inspired by text layout designs (Wang et al., 2018; Cui et al., 2010). In particular, we proposed the following design principles of the model: DP1. Text area should avoid overlapping with each other or with the image. DP2. Text should be evenly distributed around the image, preventing clustering in some areas while leaving others blank. Each diagnostic text and image is treated as a single object in the force simulation and calculation process. Two types of forces are applied to these objects: textual repulsion forces and text-image spring forces. Textual repulsion forces between text area and , with mass and are proportional to their distance (). This ensures that closer texts experience stronger repulsion, thereby preventing overlaps during position adjustments (DP1). Conversely, text-image spring forces () between text and image, with mass and , are inversely proportional to their distance. This maintains a balance, preventing text from straying too far from the image during position adjustments, thus fulfilling DP2. The combined effect of these two forces ensures that text areas, subject to balanced forces, are evenly distributed around the image’s core. Furthermore, the strength of both forces is proportional to the word count (treated as mass) in the text, considering that texts with more words generally require more display space. To minimize oscillations resulting from the force updates during positional adjustments, we implemented a damping function throughout the iteration process.
4.3.5. Record View
In the Record View (Figure 4 ), users access previously saved patient cases (R6). Each case is displayed as a card with comprehensive details and analyzed information. Users can input a summary and add descriptive comments on the title area and text area, respectively. Click the ![]() can switch to previous records and related information in the Detail and Information Exploration View. They also have the option to export records for further analysis using the export feature (
can switch to previous records and related information in the Detail and Information Exploration View. They also have the option to export records for further analysis using the export feature (![]() ).
).
5. Evaluation
In this section, we performed both a case study and a controlled in-lab between-subject user study to assess the efficacy of the Medillustrator.
5.1. Case Study: Retrospective Learning and Discussion
E1, an intern physician with six months of clinical experience, adopted a meticulous and cautious learning approach while navigating the interaction workflow of Medillustrator.
I: Exploring high-value patient cases and acknowledging interpretation challenges. Beginning by selecting “spine” as the specialty of interest and filtering data from the most recent six months (Figure 3 ), E1 scrutinized various mentions presented in the Mentions View (Figure 3 ). Notably, “retreat” emerged as one of the top three frequently occurring words, piquing E1’s curiosity. Consequently, E1 filtered all diagnostic texts containing this term to investigate associated patient cases (Figure 3 ).
 , and review the analysis using
  . Navigate to the neighboring case in the image modality and inspect it in the Detail View. Annotate findings with and review the diagnosis using , discovering an incorrect diagnosis. Save the results in the Record View by clicking
  .
.In Embedding View, E1 noticed one patient glyph conspicuously distant from the others. Upon zooming in, E1 observed that while the overall similarity of this case was relatively low, the donut chart in the outer ring depicted a high similarity between the image-indicator, surpassing the three quartiles of patients (Figure 3 ). Intrigued by this, E1 delved deeper by examining the current case’s consistency in distribution among neighboring populations in each unimodal. With , E1 discovered three identical nearest neighbors in both the image and indicator modalities: c1 (the patient itself), c2, and c3, but no corresponding matches in the text modality (Figure 3 ). This discrepancy highlighted a crucial observation: cases with similar images and indicators might ultimately receive disparate diagnostic outcomes. This revelation prompted E1 to conduct a comprehensive analysis of the current case and its neighbors. Beginning with a closer examination of the current case’s image in the Detail View, E1 identified and marked retreat at the C6 position. Subsequently, clicking on the relevant medical diagnosis revealed confirmation of E1’s initial judgment: “C6 vertebrae slight retreat.” (Figure 3 )
Turning attention to patient case c2 in the image modal and clicking for switching (Figure 3 ), E1 meticulously analyzed the raw image and identified a similar protrusion in the Detail View. Marking the relevant area during the Practice Phase and referring diagnosis at Learning Phase, E1 was surprised to find a different diagnosis for c2, with the corresponding parts marked as disc herniation and slight instability (Figure 3 ). Reminded by the diagnostic results, E1 recalled the characteristics of disc herniation and instability: while they involve retreat, they denote a more severe degree. This realization led E1 to acknowledge a misjudgment regarding the severity of the condition at the initial diagnosis. Reflecting on the analysis, E1 recognized the importance of considering “consistency in some indicators but clear differences in others”, a factor previously overlooked. This insight proved invaluable for accumulating clinical experience and facilitating learning. After completing these analyses, he clicked ![]() to note insights in Record View for future review (Figure 3 ). In conclusion, E1 appreciated how the system facilitated the efficient identification of valuable learning cases, thereby enhancing retrospective learning.
to note insights in Record View for future review (Figure 3 ). In conclusion, E1 appreciated how the system facilitated the efficient identification of valuable learning cases, thereby enhancing retrospective learning.
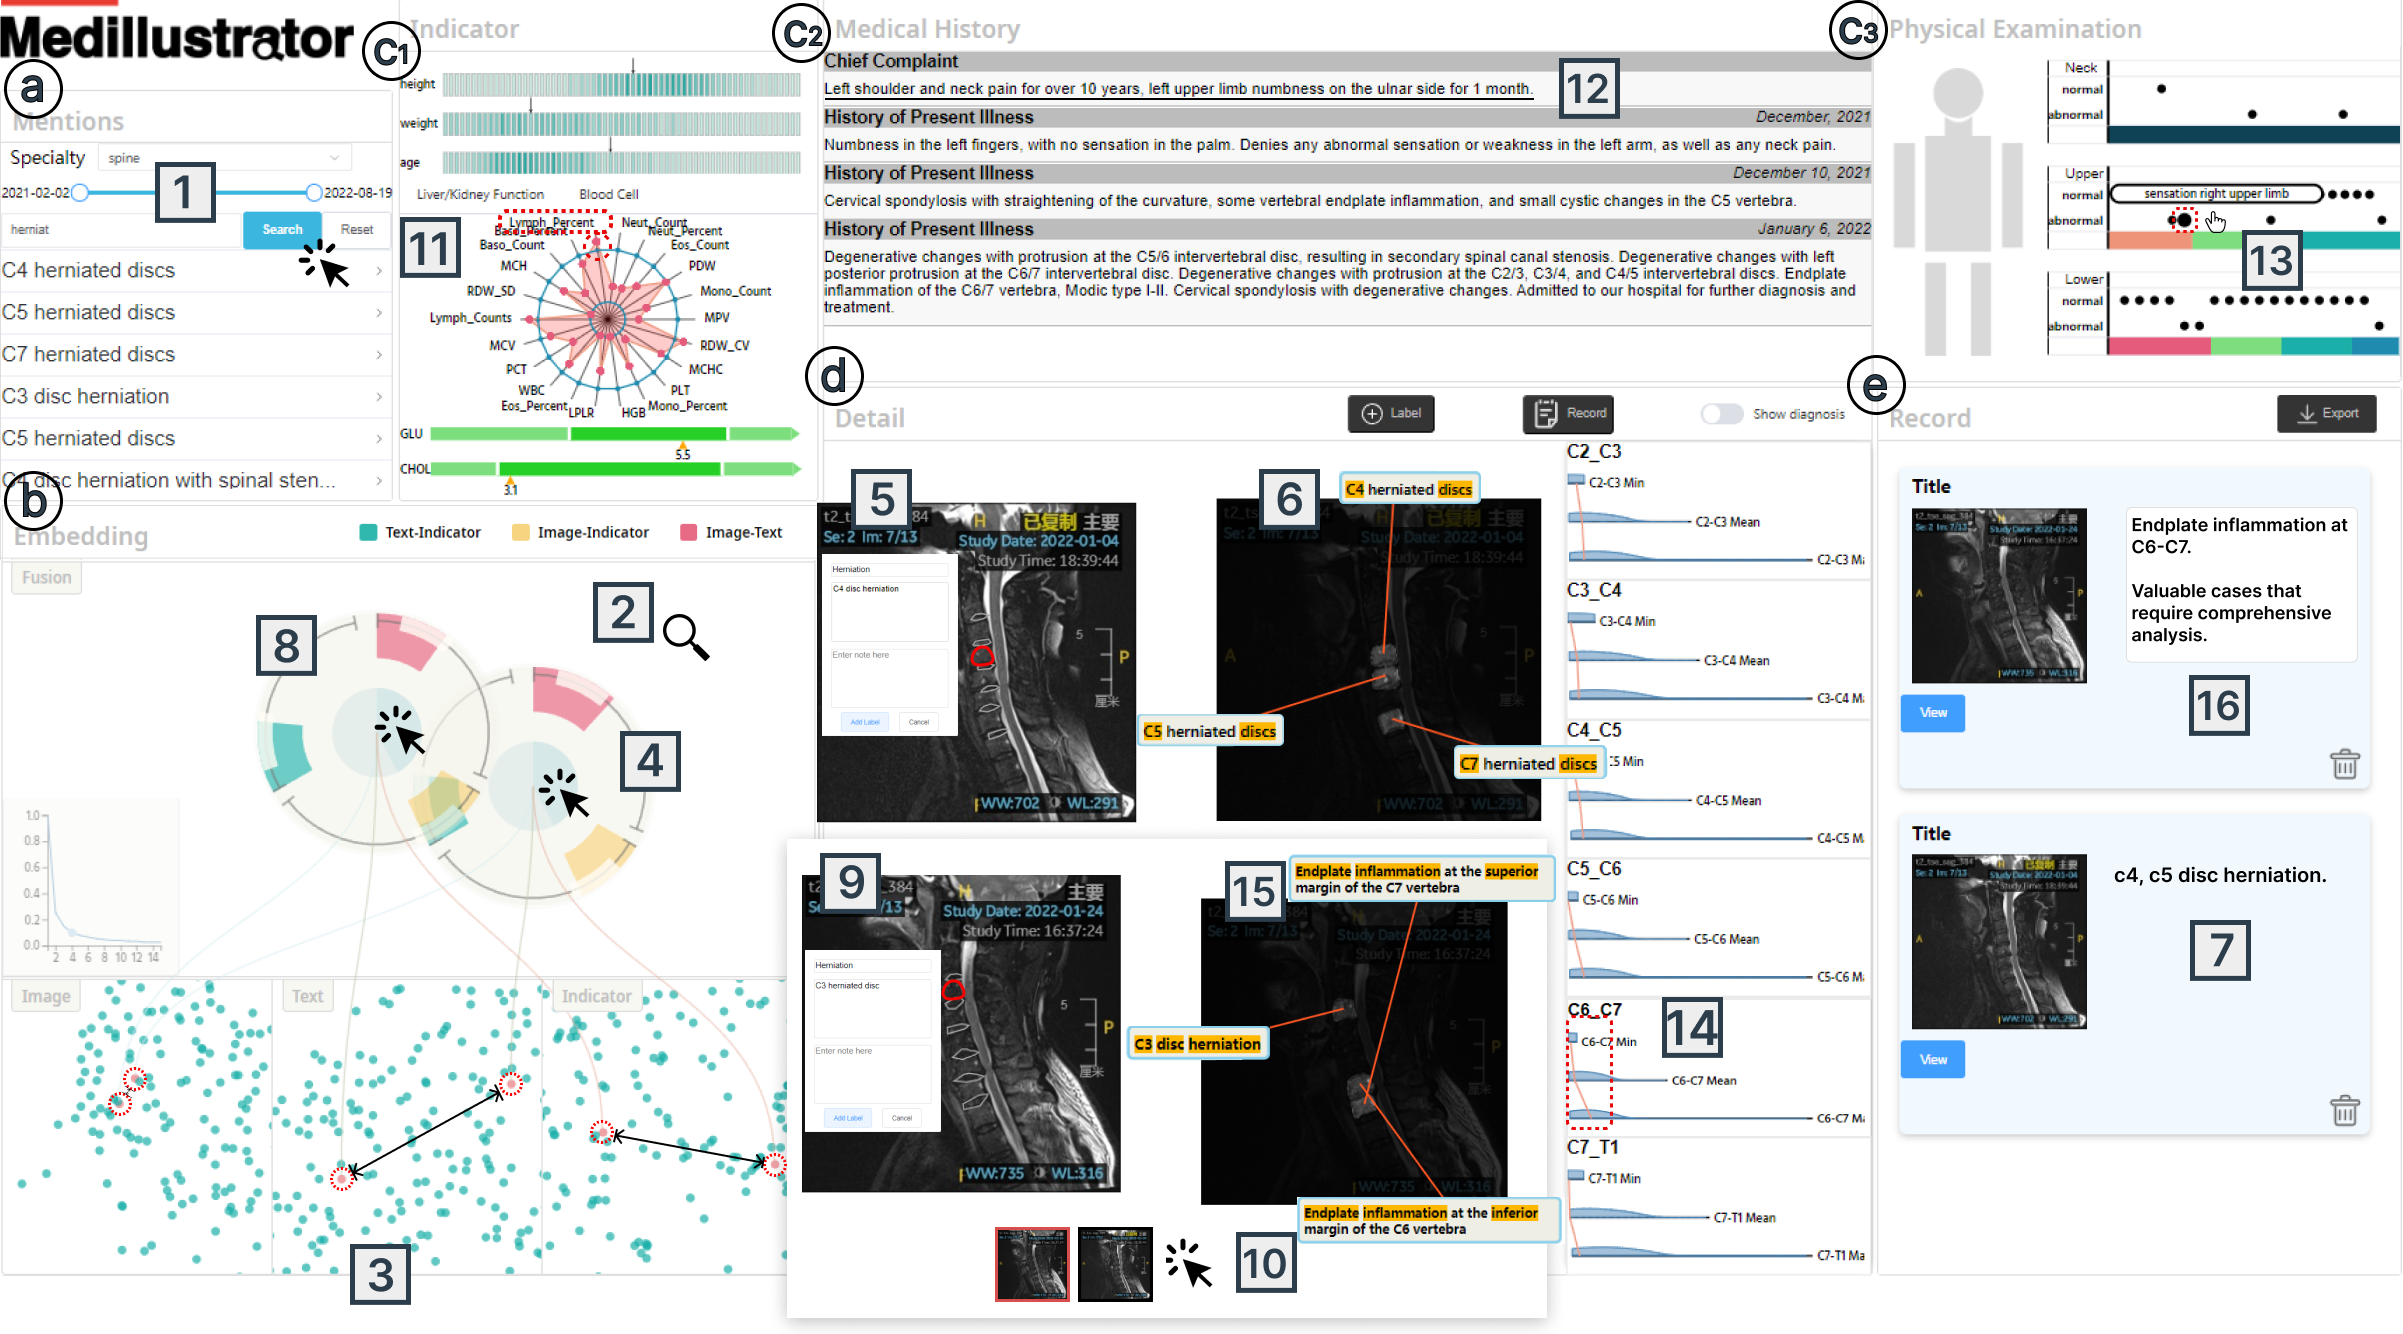
II: Gaining valuable understandings through the systematic and thorough examination of correlated multimodal patient data. After completing a previous exploration, E1 discussed his learning experience with instructor E2 in their weekly meeting. E2 recognized the findings and stressed that clinical practice often deviates from textbook scenarios, necessitating thorough and critical analysis. Continuing his learning journey, E1 decided to use the system to delve deeper into cases of “herniated discs”, recalling a previous misdiagnosis. Filtering relevant cases by searching for “herniated discs” in the Mentions View (Figure 4 ), E1 identified two cases (p1 and p2) exhibiting close proximity in the fusion modal at the Detail View (Figure 4 ). Opting to scrutinize the similarities and differences between these cases, E1 zoomed in on the glyphs and selected them as a patient group using lasso. Examining the connected lines between the fusion modal and each unimodal, E1 observed that while p1 and p2 shared similarities in the image modality, they were notably distinct in the text and indicator modalities (Figure 4 ). Realizing the significance of studying this pair of cases, E1 first clicked on the glyph of p1 (Figure 4 ) and examined it in the Detail View, identifying varying degrees of disc herniation at C4 and C5. After confirming and reviewing the right-sided corresponding imaging indicator information, E1 diagnosed “c4, c5 disc herniation” and labeled the relevant area on the image (Figure 4 ). Clicking to view the diagnosis results further validated his judgment (Figure 4 ).
After adding this cases in the Record View (Figure 4 ), E1 clicked to view glyph p2 (Figure 4 ). Consistent with the results presented on the Embedding View, p1 and p2 have similarities in images as they both show the characteristics of disc herniation in certain areas. E1 immediately identified that C3 demonstrated the characteristics of a herniated disc (Figure 4 ). Learning from the last lesson, E1 placed greater emphasis on examining the case comprehensively. Thus, E1 toggled between the thumbnails of p1 and p2 in the Record View (Figure 4 ) to gather more information before finalizing the diagnostic analysis. E1 delved into the contextual reference information within the Information Exploration View. In the Indicator subview, E1 observed that while most of p1’s laboratory indicators fell within the reference range, the lymphocyte percentage, linked to inflammation in p2, exceeded the reference values (Figure 4 ). This prompted E1 to consider possible inflammation in p2’s body. Moving to the Medical History subview, E1 noted that both patients complained of finger numbness. However, p1 experienced symptoms for only a month, whereas p2 endured them for over ten years, suggesting a longer duration and greater complexity in p2’s case (Figure 4 ). In the Physical Examination subview, E1 found that c2 also be examined as abnormal in ”Sensation Right Upper Limb” (Figure 4 ), indicating a much more severity of C2.
Upon re-examining p2’s corresponding areas in the image at the Detail View, E1 then noticed that imaging indicators contains a relatively low minimum and mean signal value in C6-C7 area, with a significant difference from maximum signal value (Figure 4 ), hinting at a possible lesion. Inspired by this, E1 identified an additional abnormality at C7, resembling end plate inflammation. Including the analysis of “C7 superior margin end plate inflammation” in his diagnosis, E1 proceeded to validate the diagnoses during the Learning Phase (Figure 4 ). To his delight, E1 confirmed the accuracy of his diagnosis of herniated discs for both p1 and p2. Furthermore, he successfully identified the inflammation of the endplate in p2, boosting his confidence. Finally E1 added the analysis and insights in the Record View (Figure 4 ). In this analysis, E1 highlighted the significance of conducting thorough contextual analyses in diagnosis, confirming the system’s value in aiding physicians with efficient analysis. This approach was particularly advantageous for learning and improvement “within limited time frames compared to traditional accumulation over extended periods.”
5.2. User Study

Baseline System. We chose the Healthcare Information System (HIS) currently used by physicians for diagnosis as the baseline for comparison. This system enables straightforward reading of structured patient cases, viewing MRI images and reports. We selected it because it mirrors the tool commonly employed by physicians in their daily work for data browsing, analysis, and learning. Its user familiarity and lack of learning curve enable a clear comparison to highlight the enhancements offered by Medillustrator over the existing system.
Participants. We recruited participants ( male, female) via snowball sampling, facilitated by our collaborator E3, a senior physician with over 20 years of experience at a reputable local hospital. To ensure unbiased assessment of user effectiveness and efficiency in using the system for retrospective learning and analysis, we recruited individuals from the same specialty (orthopedics) with similar qualifications. Most participants were interns undergoing standardized training, with one exception—P6, a resident physician with two years of experience. Participants were randomly assigned to two groups: to the Medillustrator condition and to the baseline system.
Procedure. We held discussions with domain experts to identify concerns and challenges regarding CME case analysis. Participants were tasked with screening and analyzing a total of patient cases curated by two senior physicians, including cases known for deviations from typical symptom-description patterns found in common “textbook descriptions”. These cases served as benchmarks for assessing user selection quality, with participants required to identify the most valuable cases for retrospective learning. The experiment received IRB approval, and users’ feedback was recorded with their consent. Before the experiment, participants underwent a -minute tutorial session led by senior physicians, explaining the tasks and providing examples, with opportunities for questions. Participants in the Medillustrator condition received a -minute system tutorial followed by minutes of exploration. Screening and analysis lasted one hour in both conditions. Participants compiled reports using a given template, outlining their rationale for each selection and insights gained. An in-task questionnaire assessed overall user experience, and participants in the Medillustrator condition underwent post-task interviews. The related questions can be found in Appendix. Analysis reports were evaluated by two senior physicians with a multi-observer assessment for consistency (Shrout and Fleiss, 1979). Participants received compensation upon completion.
Measurement. We utilized a -point Likert scale (from : strongly disagree to : strongly agree) in a post-task questionnaire to evaluate usability and effectiveness. Usability assessment included factors like ease of use, support for case analysis, system-related distractions, user satisfaction, likelihood of recommendation, intent for future use, and perceptions at different analysis stages, inspired by the System Usability Scale (SUS) (Brooke, 1996). Effectiveness was analyzed based on criteria such as screened case accessibility, efficiency in identifying valuable cases, perceived analysis confidence, recording and reviewing accessibility, and analysis report quality (Hart and Staveland, 1988). Analysis reports were evaluated for completeness (based on the number of identified cases matching the ground truth) and accuracy (focused on the precision of the provided rationale for case selection), with detail criterion shown in Table 4.
| Control Group | Experiment Group | U | ||
|---|---|---|---|---|
| Completeness | ||||
| Accuracy |
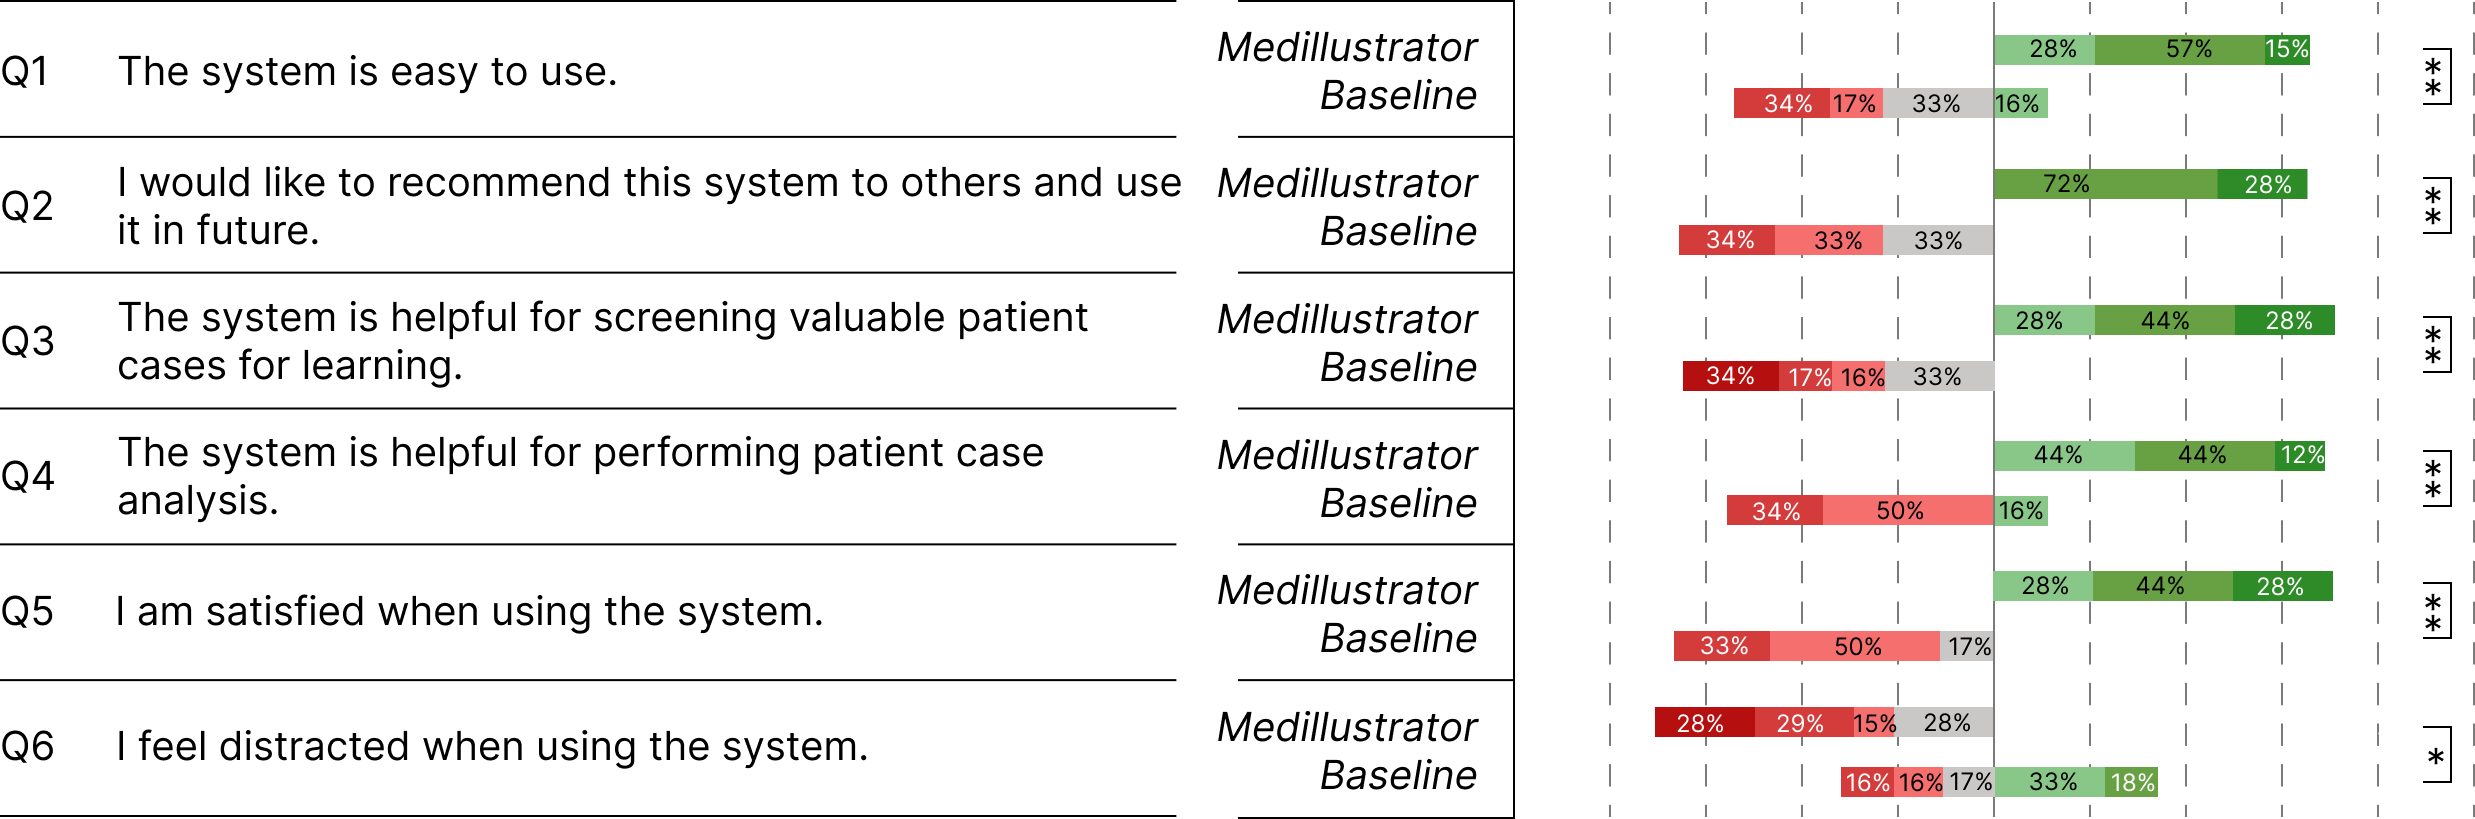
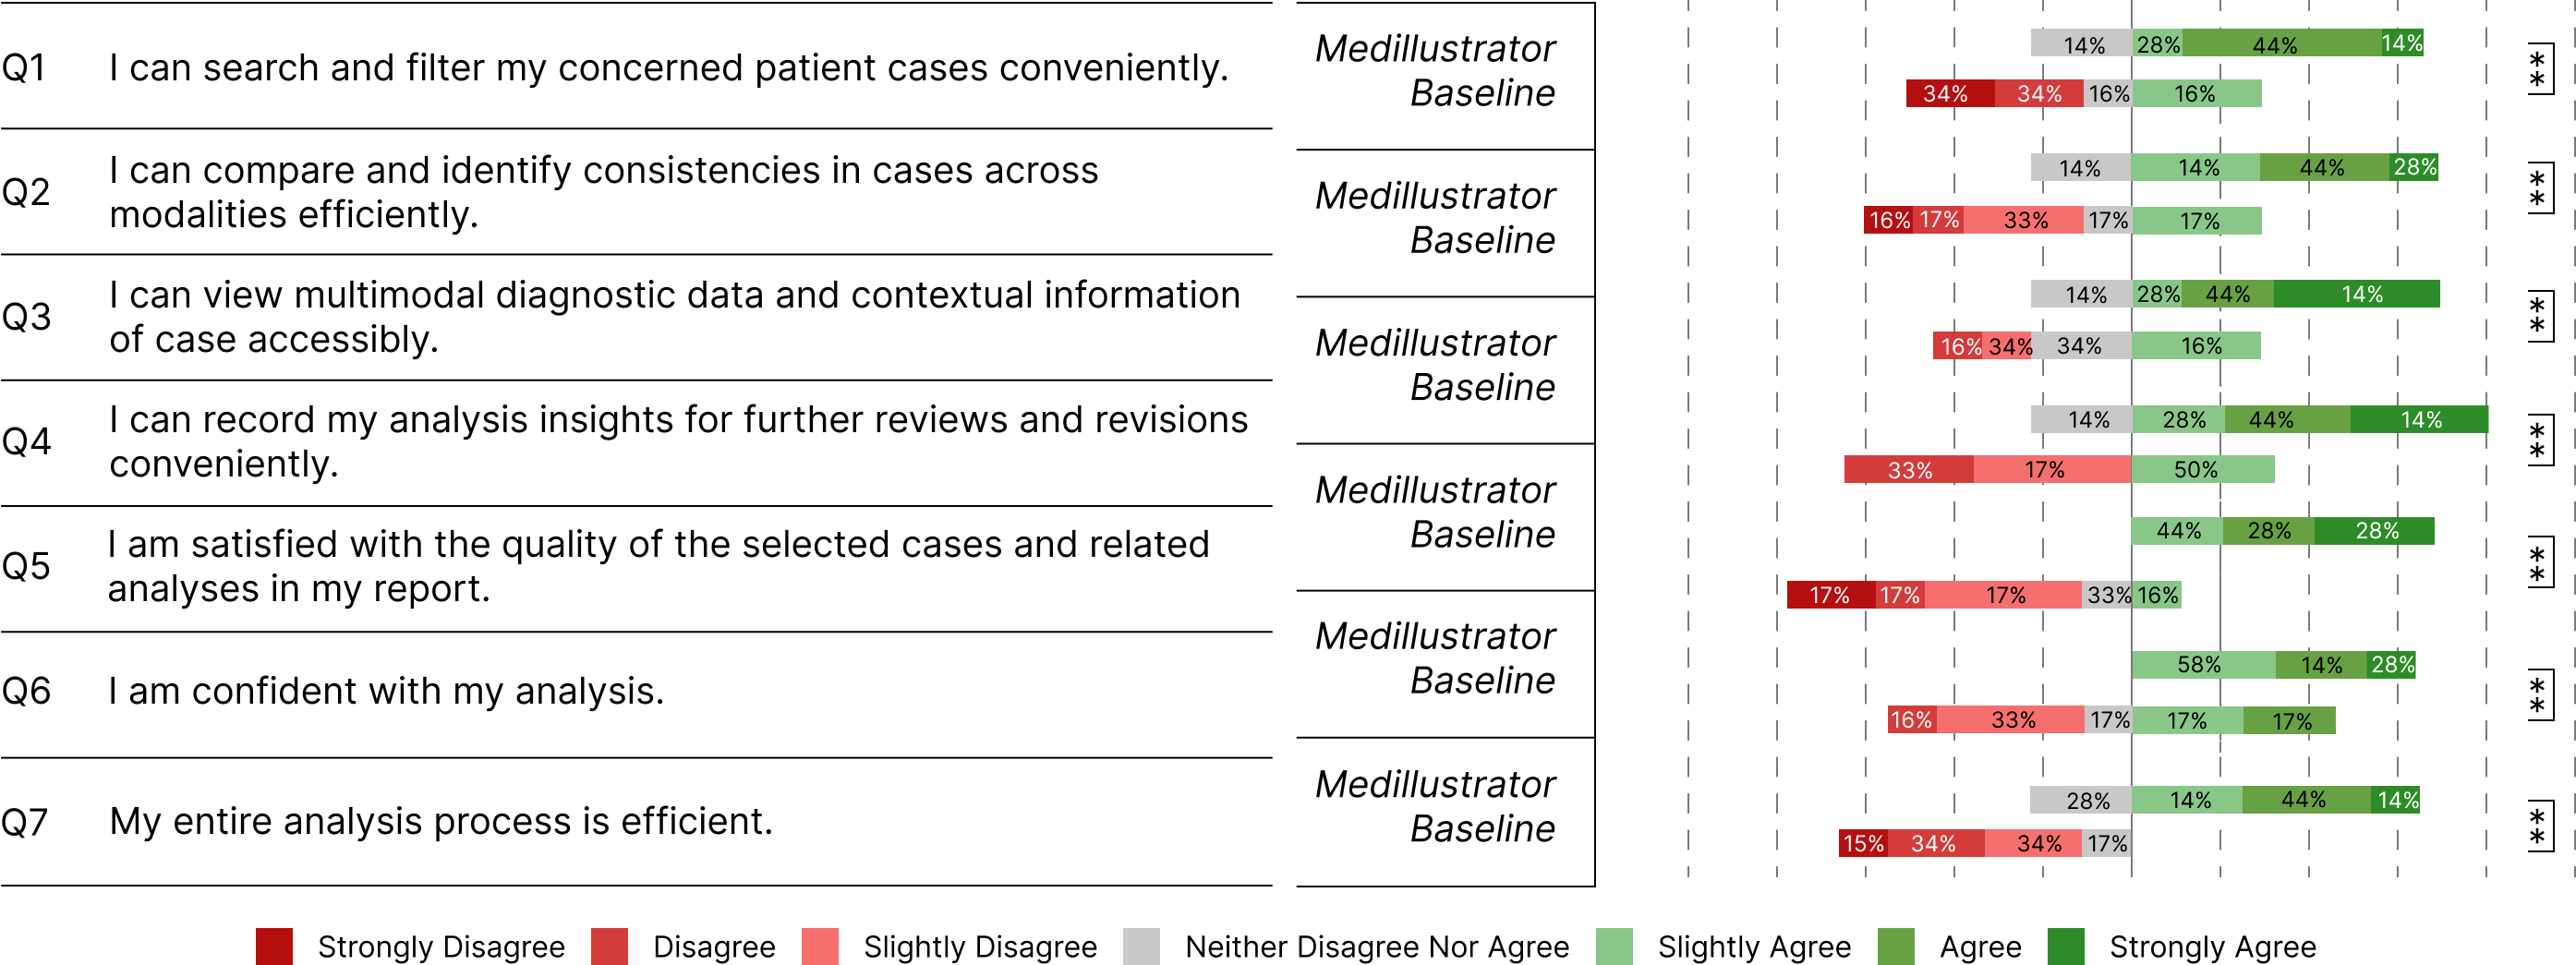
Results. We used the Mann-Whitney U test (Mann and Whitney, 1947) to compare scores between the Medillustrator and baseline systems in both the in-task questionnaire and senior physicians’ assessment of analysis reports (Figure 6). Users consistently rated the usability and effectiveness of the Medillustrator significantly higher than the baseline. Positive feedback was observed for ease of use (U=1, p ¡ 0.01), likelihood of future recommendations (U=3.5, p ¡ 0.05), helpfulness for screening (U=1, p ¡ 0.01) and analysis of cases (U=3.5, p ¡ 0.01), and satisfaction (U=3.5, p ¡ 0.05). Both systems received relatively low scores for distractions (U=15, p=0.37), indicating no significant differences. Additionally, users acknowledged the Medillustrator for its assistance in filtering cases (U=2.5, p ¡ 0.01), identifying inconsistencies (U=2, p ¡ 0.01), and analysis (U=3, p ¡ 0.01). The Medillustrator condition showed statistically significant positive feedback in perceived analysis confidence (U=6.5, p ¡ 0.05), efficiency (U=1, p ¡ 0.01), and satisfaction (U=1.5, p ¡ 0.01) in identifying valuable cases. Table 2 shows detailed analysis report ratings, where the Medillustrator condition demonstrated superior performance in both completeness (U=3, p ¡ 0.01) and accuracy (U=3.5, p ¡ 0.05). The ICC scores (Shrout and Fleiss, 1979) for each report are above 0.75, indicating good consistency of ratings between reviewers. In post-task interviews, we collected feedback on Medillustrator’s features through audio recordings, transcribed, and analyzed them using thematic analysis methods (Boyatzis, 1998b). Users appreciated the system’s assistance in case screening and analysis with an accessible display. They remarked that “Medillustrator is made to fit our’ real needs, giving organized and consistent data displays that make analyzing cases easier and more straightforward.” Some users (P3, P5, P10) mentioned that grasping the connections and individuals’ depiction across different modalities in the Embedding View took some getting used to. P5 shared, “At first, I was a bit confused by the lines and circles in different views, but after a few minutes of explanation and guidance, I started to get the hang of it.” However, they also confirmed its effectiveness in case screening, noting, “Checking out the glyphs and clicking for details really helps me spot differences between different aspects of cases, making it easier to find those unusual and valuable ones.” P7 highlighted the usefulness of aligning imaging indicators with images in the Detail View, saying, “When reviewing intervertebral disc signal values, I focus on deviations from the average to the minimum and maximum. The display highlights areas with significant differences, indicating a higher likelihood of protrusion.” Users appreciated the option to manually add annotations and make notes during the Practice Phase, stating that “Real learning often means getting your hands dirty, not just watching from the sidelines.” Additionally, P8 suggested adding a “mistake notebook” feature for timely recording after correcting errors.
6. Discussion and Limitation
Lessons from Retrospective Case Learning. In clinical diagnosis, retrospective learning often targets identifying challenging cases that offer insights for learning and research. These cases involve discrepancies between diagnostic data and actual medical conditions, requiring thorough information collection, analysis, and discussion. However, this assumes that physicians have basic knowledge and recognize typical clinical presentations. Alongside difficult cases, retrospective activities may include “teaching cases” for medical students early in their clinical diagnosis training. The presence of textbook-style symptoms in these cases and diagnostic data can aid in basic medical education. While Medillustrator aids learning from cases, its focus is primarily on analyzing challenging cases with inconsistencies. Future versions can improve case analysis by adding teaching scenarios for interactive learning and offering summarized analyses of similar cases.
Generalizability and Scalability. In this work, we primarily focus on cervical spine diagnosis in the orthopedic specialty, a key focus of future work will be exploring the adaptability of this approach to other specialties. By following the same process of image annotation, model fine-tuning, and training, Medillustrator could be extended to present aligned displays of images in areas like neurology and pulmonology, further enhancing the learning experience. Regarding visualization capabilities, our system’s features extend beyond aiding novice physicians in case analysis learning. For example, the Embedding View can identify consistency across modalities, aiding in time-series data analysis, while the Detail View’s multimodal data alignment is useful for educational demonstrations. Algorithmically, our methods for aligning images and text semantically facilitate tasks such as medical phrase grounding and visual question answering. To address scalability, hierarchical displays in the Embedding View reduce visual clutter, and edge bundling can clarify cross-modal connections.
Limitations. Our work has limitations. First, in data acquisition and processing, modality alignment involves manual annotations and large model fine-tuning. Manual annotations could lead to potential risks of limited data diversity due to the restricted specialty of data sources and annotators. One potential solution is to establish a long-term mechanism for interactive annotation and iterative updates. Recording senior physicians’ annotations as ongoing data supplements can enhance model training, increase data diversity, and improve novice physicians’ learning experience. Additionally, the lack of standardized format in text data can introduce analytical bias into the model due to varying physician descriptive granularity, necessitating a uniform descriptive granularity to mitigate this issue. Second, in our evaluation, while we minimized experimental bias by selecting participants with similar seniority from the same specialty, diverse system perceptions among physicians of different specialties and experience levels are overlooked. Therefore, we plan to conduct continuous studies across various specialties and personnel to evaluate and enhance the system.
7. Conclusion and Future work
This study identifies challenges and expectations of novice physicians in retrospective learning and introduces Medillustrator, an interactive visualization analysis system addressing these needs. Medillustrator aids users in identifying valuable cases by illustrating distribution differences across modalities and aligning diagnostic texts with corresponding image regions. Case studies and user evaluations demonstrate Medillustrator’s effectiveness in aiding novice physicians to efficiently identify and analyze research cases. Future work involves meeting retrospective learning needs across experience levels and enhancing collaborative analysis.
Acknowledgements.
We thank anonymous reviewers for their valuable feedback. This work is supported by grants from the National Natural Science Foundation of China (No. 62372298), Shanghai Frontiers Science Center of Human-centered Artificial Intelligence (ShangHAI), and MoE Key Laboratory of Intelligent Perception and Human-Machine Collaboration (KLIP-HuMaCo).References
- (1)
- 317 (2020) 2020. Active Learning Strategies to Improve Progression from Knowledge to Action. 46, 1 (Feb 2020), 1–19. https://doi.org/10.1016/j.rdc.2019.09.001
- (3) Hermann Ebbinghaus (1885). 2013. Memory: A Contribution to Experimental Psychology. Annals of Neurosciences 20 (2013), 155 – 156. https://doi.org/10.5214%2Fans.0972.7531.200408
- Ahn et al. (2021) Yura Ahn, Gil-Sun Hong, Kye Jin Park, Choong Wook Lee, Ju Hee Lee, and Seon-Ok Kim. 2021. Impact of diagnostic errors on adverse outcomes: learning from emergency department revisits with repeat CT or MRI. Insights into Imaging 12, 1 (2021), 160. https://doi.org/10.1186/s13244-021-01108-0
- Atsina et al. (2020) Kofi-Buaku Atsina, Laurence Parker, Vijay M. Rao, and David C. Levin. 2020. Advanced Imaging Interpretation by Radiologists and Nonradiologist Physicians: A Training Issue. American Journal of Roentgenology 214, 1 (2020), W55–W61. https://doi.org/10.2214/AJR.19.21802 arXiv:https://doi.org/10.2214/AJR.19.21802 PMID: 31691611.
- Bannach et al. (2017) Andreas Bannach, J. Bernard, Florian Jung, Jörn Kohlhammer, Thorsten May, Kathrin Scheckenbach, and Stefan Wesarg. 2017. Visual analytics for radiomics: Combining medical imaging with patient data for clinical research. 2017 IEEE Workshop on Visual Analytics in Healthcare (VAHC) (2017), 84–91. https://doi.org/10.1109/VAHC.2017.8387545
- Bordage et al. (2009) Georges Bordage, Brian Carlin, and Paul E. Mazmanian. 2009. Continuing medical education effect on physician knowledge: effectiveness of continuing medical education: American College of Chest Physicians Evidence-Based Educational Guidelines. Chest 135 3 Suppl (2009), 29S–36S. https://doi.org/10.1378/chest.08-2515
- Boyatzis (1998a) Richard E Boyatzis. 1998a. Transforming qualitative information: Thematic analysis and code development. sage.
- Boyatzis (1998b) Richard E. Boyatzis. 1998b. Transforming Qualitative Information: Thematic Analysis and Code Development. https://api.semanticscholar.org/CorpusID:60526017
- Brooke (1996) J. B. Brooke. 1996. SUS: A ’Quick and Dirty’ Usability Scale. https://api.semanticscholar.org/CorpusID:107686571
- Bruner (1960) Jérôme Seymour Bruner. 1960. The Process of Education. https://api.semanticscholar.org/CorpusID:177285798
- Caban and Gotz (2015) Jesus J. Caban and David Gotz. 2015. Visual analytics in healthcare - opportunities and research challenges. Journal of the American Medical Informatics Association : JAMIA 22 2 (2015), 260–2. https://doi.org/10.1093/jamia/ocv006
- Chen et al. (2023) Zhihao Chen, Yangqiaoyu Zhou, Anh Tu Tran, Junting Zhao, Liang Wan, Gideon Su Kai Ooi, Lionel T. E. Cheng, Choon Hua Thng, Xinxing Xu, Yong Liu, and H. Fu. 2023. Medical Phrase Grounding with Region-Phrase Context Contrastive Alignment. ArXiv abs/2303.07618 (2023). https://doi.org/10.1007/978-3-031-43990-2_35
- Cheng et al. (2021) Furui Cheng, Dongyu Liu, Fan Du, Yanna Lin, Alexandra Zytek, Haomin Li, Huamin Qu, and Kalyan Veeramachaneni. 2021. Vbridge: Connecting the dots between features and data to explain healthcare models. IEEE Transactions on Visualization and Computer Graphics 28, 1 (2021), 378–388. https://doi.org/10.1109/TVCG.2021.3114836
- Clarke and Braun (2017) Victoria Clarke and Virginia Braun. 2017. Thematic analysis. The journal of positive psychology 12, 3 (2017), 297–298. https://doi.org/doi/10.1037/13620-004
- Cui et al. (2022) Can Cui, Haichun Yang, Yaohong Wang, Shilin Zhao, Zuhayr Asad, Lori A. Coburn, Keith T. Wilson, Bennett A. Landman, and Yuankai Huo. 2022. Deep multimodal fusion of image and non-image data in disease diagnosis and prognosis: a review. Progress in biomedical engineering (Bristol, England) 5 (2022). https://doi.org/10.1088/2516-1091/acc2fe
- Cui et al. (2010) Weiwei Cui, Yingcai Wu, Shixia Liu, Furu Wei, Michelle X. Zhou, and Huamin Qu. 2010. Context preserving dynamic word cloud visualization. 2010 IEEE Pacific Visualization Symposium (PacificVis) (2010), 121–128. https://doi.org/10.1109/PACIFICVIS.2010.5429600
- Donkin et al. (2023) Rebecca Donkin, Heather Yule, and Trina Fyfe. 2023. Online case-based learning in medical education: a scoping review. BMC Medical Education 23, 1 (2023), 564. https://doi.org/10.1186/s12909-023-04520-w
- Donner-Banzhoff (2018) Norbert Donner-Banzhoff. 2018. Solving the Diagnostic Challenge: A Patient-Centered Approach. The Annals of Family Medicine 16, 4 (2018), 353–358. https://doi.org/10.1370/afm.2264 arXiv:https://www.annfammed.org/content/16/4/353.full.pdf
- Duanmu et al. (2020) Hongyi Duanmu, Pauline Boning Huang, Srinidhi Brahmavar, Stephanie Lin, Thomas Ren, Jun Kong, Fusheng Wang, and Tim Q. Duong. 2020. Prediction of Pathological Complete Response to Neoadjuvant Chemotherapy in Breast Cancer Using Deep Learning with Integrative Imaging, Molecular and Demographic Data. In International Conference on Medical Image Computing and Computer-Assisted Intervention. https://doi.org/10.1007/978-3-030-59713-9_24
- DynaMed (2024) DynaMed. 2024. DynaMed. https://www.dynamed.com/.
- Hart and Staveland (1988) Sandra G Hart and Lowell E Staveland. 1988. Development of NASA-TLX (Task Load Index): Results of empirical and theoretical research. In Advances in psychology. Vol. 52. Elsevier, 139–183. https://doi.org/10.1016/S0166-4115(08)62386-9
- Holste et al. (2021) Greg Holste, Savannah C. Partridge, Habib Rahbar, Debosmita Biswas, Christoph I. Lee, and Adam M. Alessio. 2021. End-to-End Learning of Fused Image and Non-Image Features for Improved Breast Cancer Classification from MRI. 2021 IEEE/CVF International Conference on Computer Vision Workshops (ICCVW) (2021), 3287–3296. https://doi.org/10.1109/ICCVW54120.2021.00368
- Huang et al. (2020) Shih-Cheng Huang, Anuj Pareek, Saeed Seyyedi, Imon Banerjee, and Matthew P. Lungren. 2020. Fusion of medical imaging and electronic health records using deep learning: a systematic review and implementation guidelines. NPJ Digital Medicine 3 (2020). https://doi.org/10.1038/s41746-020-00341-z
- Jaccard (1912) P. Jaccard. 1912. THE DISTRIBUTION OF THE FLORA IN THE ALPINE ZONE.1. New Phytologist 11 (1912), 37–50. https://doi.org/10.1111/j.1469-8137.1912.tb05611.x
- Kirillov et al. (2023) Alexander Kirillov, Eric Mintun, Nikhila Ravi, Hanzi Mao, Chloe Rolland, Laura Gustafson, Tete Xiao, Spencer Whitehead, Alexander C. Berg, Wan-Yen Lo, Piotr Dollár, and Ross B. Girshick. 2023. Segment Anything. 2023 IEEE/CVF International Conference on Computer Vision (ICCV) (2023), 3992–4003. https://doi.org/10.48550/arXiv.2304.02643
- Knowles (1975) Malcolm S Knowles. 1975. Self-directed learning: A guide for learners and teachers. (1975).
- Li et al. (2023) Yingshu Li, Yunyi Liu, Zhanyu Wang, Xinyu Liang, Lingqiao Liu, Lei Wang, Leyang Cui, Zhaopeng Tu, Longyue Wang, and Luping Zhou. 2023. A Comprehensive Study of GPT-4V’s Multimodal Capabilities in Medical Imaging. ArXiv abs/2310.20381 (2023). https://doi.org/10.1101/2023.11.03.23298067
- Liang et al. (2022) Paul Pu Liang, Yiwei Lyu, Gunjan Chhablani, Nihal Jain, Zihao Deng, Xingbo Wang, Louis-Philippe Morency, and Ruslan Salakhutdinov. 2022. MultiViz: Towards Visualizing and Understanding Multimodal Models. In International Conference on Learning Representations. https://doi.org/10.48550/arXiv.2207.00056
- Liu et al. (2023) Shilong Liu, Zhaoyang Zeng, Tianhe Ren, Feng Li, Hao Zhang, Jie Yang, Chun yue Li, Jianwei Yang, Hang Su, Jun-Juan Zhu, and Lei Zhang. 2023. Grounding DINO: Marrying DINO with Grounded Pre-Training for Open-Set Object Detection. ArXiv abs/2303.05499 (2023). https://doi.org/10.48550/arXiv.2303.05499
- Liu and Sullivan (2021) Tzu-Hung Liu and Amy M Sullivan. 2021. A story half told: a qualitative study of medical students’ self-directed learning in the clinical setting. BMC Medical Education 21, 1 (2021), 1–11. https://doi.org/10.1186/s12909-021-02913-3
- Lu et al. (2020) Ming Y. Lu, Tiffany Y. Chen, Drew F. K. Williamson, Melissa Zhao, Maha Shady, Jana Lipková, and Faisal Mahmood. 2020. AI-based pathology predicts origins for cancers of unknown primary. Nature 594 (2020), 106 – 110. https://doi.org/10.1038/s41586-021-03512-4
- Mann and Whitney (1947) Henry B Mann and Donald R Whitney. 1947. On a test of whether one of two random variables is stochastically larger than the other. The annals of mathematical statistics (1947), 50–60. https://doi.org/stable/2236101
- Marinopoulos et al. (2007) Spyridon Marinopoulos, Todd Dorman, Neda Ratanawongsa, Lisa M. Wilson, Bimal H. Ashar, Jeffrey L. Magaziner, Redonda G. Miller, Patricia A. Thomas, Gregory Prokopowicz, Rehan Qayyum, and Eric B. Bass. 2007. Effectiveness of continuing medical education. Evidence report/technology assessment 149 (2007), 1–69. https://api.semanticscholar.org/CorpusID:261068639
- McInnes et al. (2018) Leland McInnes, John Healy, and James Melville. 2018. Umap: Uniform manifold approximation and projection for dimension reduction. arXiv preprint arXiv:1802.03426 (2018).
- McLean (2016) Susan F McLean. 2016. Case-based learning and its application in medical and health-care fields: a review of worldwide literature. Journal of medical education and curricular development 3 (2016), JMECD–S20377. https://doi.org/10.4137/JMECD.S20377
- Medscape (2024) Medscape. 2024. Medscape. https://www.medscape.org/.
- Mörth et al. (2020) Eric Mörth, Kari S. Wagner-Larsen, Erlend Hodneland, Camilla Krakstad, Ingfrid S. Haldorsen, Stefan Bruckner, and Noeska N. Smit. 2020. RadEx: Integrated Visual Exploration of Multiparametric Studies for Radiomic Tumor Profiling. Computer Graphics Forum 39 (2020). https://doi.org/10.1111/cgf.14172
- Nguyen et al. (2021) Kevin A. Nguyen, Maura Borrego, Cynthia J. Finelli, Matt DeMonbrun, Caroline Crockett, Sneha Tharayil, Prateek Shekhar, Cynthia Waters, and Robyn Rosenberg. 2021. Instructor strategies to aid implementation of active learning: a systematic literature review. International Journal of STEM Education 8, 1 (2021), 9. https://doi.org/10.1186/s40594-021-00270-7
- Paas et al. (2003) Fred Paas, Alexander Renkl, and John Sweller. 2003. Cognitive Load Theory and Instructional Design: Recent Developments. Educational Psychologist 38 (2003), 1 – 4. https://doi.org/10.1207/S15326985EP3801_1
- Pattni et al. (2023) Chandni Pattni, Michael Scaffidi, Juana Li, Shai Genis, Nikko Gimpaya, Rishad Khan, Rishi Bansal, Nazi Torabi, Catharine M. Walsh, and Samir C. Grover. 2023. Video-based interventions to improve self-assessment accuracy among physicians: A systematic review. PLOS ONE 18, 7 (07 2023), 1–15. https://doi.org/10.1371/journal.pone.0288474
- Qiao et al. (2014) Yu Qi Qiao, Jun Shen, Xiao Liang, Song Ding, Fang Yuan Chen, Li Shao, Qing Zheng, and Zhi Hua Ran. 2014. Using cognitive theory to facilitate medical education. BMC Medical Education 14, 1 (2014), 79. https://doi.org/10.1186/1472-6920-14-79
- Qin et al. (2022) Ziyuan Qin, Huahui Yi, Qicheng Lao, and Kang Li. 2022. Medical Image Understanding with Pretrained Vision Language Models: A Comprehensive Study. ArXiv abs/2209.15517 (2022). https://doi.org/10.48550/arXiv.2209.15517
- Raidou et al. (2018) Renata Georgia Raidou, Oscar Casares-Magaz, Artem Amirkhanov, Vitali Moiseenko, Ludvig Paul Muren, John P. Einck, Anna Vilanova, and Eduard Gröller. 2018. Bladder Runner: Visual Analytics for the Exploration of RT‐Induced Bladder Toxicity in a Cohort Study. Computer Graphics Forum 37 (2018). https://doi.org/10.1111/cgf.13413
- Rokach (2010) Lior Rokach. 2010. Ensemble-based classifiers. Artificial Intelligence Review 33 (2010), 1–39. https://doi.org/10.1007/s10462-009-9124-7
- Rosendal et al. (2013) Marianne Rosendal, Dorte Ejg Jarbøl, Anette Fischer Pedersen, and Rikke Sand Andersen. 2013. Multiple perspectives on symptom interpretation in primary care research. BMC Family Practice 14, 1 (2013), 167. https://doi.org/10.1186/1471-2296-14-167
- Russell et al. (2008) Bryan C Russell, Antonio Torralba, Kevin P Murphy, and William T Freeman. 2008. LabelMe: a database and web-based tool for image annotation. International journal of computer vision 77 (2008), 157–173. https://doi.org/10.1007/s11263-007-0090-8
- Shahar et al. (2006) Yuval Shahar, Dina Goren-Bar, David Boaz, and Gil Tahan. 2006. Distributed, intelligent, interactive visualization and exploration of time-oriented clinical data and their abstractions. Artificial intelligence in medicine 38 2 (2006), 115–35. https://doi.org/10.1016/j.artmed.2005.03.001
- Shehanaz et al. (2021) Shaik Shehanaz, Ebenezer Daniel, Sitaramanjaneya Reddy Guntur, and Sivaji Satrasupalli. 2021. Optimum weighted multimodal medical image fusion using particle swarm optimization. Optik 231 (2021), 166413. https://doi.org/10.1016/j.ijleo.2021.166413
- Shimizu (2023) T. Shimizu. 2023. Twelve tips for physicians’ mastering expertise in diagnostic excellence. MedEdPublish 13 (2023), 21. https://doi.org/10.12688/mep.19618.1 Version 1; Peer review: 2 approved with reservations, 1 not approved.
- Shneiderman (1996) Ben Shneiderman. 1996. The eyes have it: a task by data type taxonomy for information visualizations. Proceedings 1996 IEEE Symposium on Visual Languages (1996), 336–343. https://doi.org/10.1016/B978-155860915-0/50046-9
- Shrout and Fleiss (1979) Patrick E. Shrout and Joseph L. Fleiss. 1979. Intraclass correlations: uses in assessing rater reliability. Psychological bulletin 86 2 (1979), 420–8. https://doi.org/doi/10.1037/0033-2909.86.2.420
- Silberberg et al. (2021) Mina Silberberg, Lawrence H. Muhlbaier, Elaine Hart-Brothers, Glenda M. Small, Arwen E. Bunce, Rupal Patel, Seronda Robinson, and Sherman A. James. 2021. Melding Multiple Sources of Knowledge: Using Theory and Experiential Knowledge to Design a Community Health Intervention Study. Journal of Participatory Research Methods 2, 3 (17 11 2021). https://doi.org/10.35844/001c.29013
- Stephenson et al. (2020) Christopher R. Stephenson, Sara L. Bonnes, Adam P. Sawatsky, Lukas W. Richards, Cathy D. Schleck, Jayawant N. Mandrekar, Thomas J. Beckman, and Christopher M. Wittich. 2020. The relationship between learner engagement and teaching effectiveness: a novel assessment of student engagement in continuing medical education. BMC Medical Education 20, 1 (Nov 2020), 403. https://doi.org/10.1186/s12909-020-02331-x
- Sultanum et al. (2022) Nicole Sultanum, Farooq Naeem, Michael Brudno, and Fanny Chevalier. 2022. ChartWalk: Navigating large collections of text notes in electronic health records for clinical chart review. IEEE Transactions on Visualization and Computer Graphics 29, 1 (2022), 1244–1254. https://doi.org/10.1109/TVCG.2022.3209444
- Sweller (1988) John Sweller. 1988. Cognitive Load During Problem Solving: Effects on Learning. Cogn. Sci. 12 (1988), 257–285. https://doi.org/10.1016/0364-0213(88)90023-7
- Sweller et al. (1998) John Sweller, Jeroen J. G. van Merrienboer, and Fred Paas. 1998. Cognitive Architecture and Instructional Design. Educational Psychology Review 10 (1998), 251–296. https://doi.org/10.1023/A:1022193728205
- Tagawa (2008) Masami Tagawa. 2008. Physician self-directed learning and education. The Kaohsiung Journal of Medical Sciences 24, 7 (2008), 380–385. https://doi.org/10.1016/S1607-551X(08)70136-0
- Tang et al. (2021) Tan Tang, Yanhong Wu, Lingyun Yu, Yuhong Li, and Yingcai Wu. 2021. VideoModerator: A Risk-aware Framework for Multimodal Video Moderation in E-Commerce. IEEE Transactions on Visualization and Computer Graphics PP (2021), 1–1. https://doi.org/10.1109/TVCG.2021.3114781
- VisualDx (2024) VisualDx. 2024. VisualDx. https://www.visualdx.com/.
- Wang et al. (2022) Guotai Wang, Xiangde Luo, Ran Gu, Shuojue Yang, Yijie Qu, Shuwei Zhai, Qianfei Zhao, Kang Li, and Shaoting Zhang. 2022. PyMIC: A deep learning toolkit for annotation-efficient medical image segmentation. Computer methods and programs in biomedicine 231 (2022), 107398. https://doi.org/10.1016/j.cmpb.2023.107398
- Wang et al. (2021c) Hongzhi Wang, Vaishnavi Subramanian, and Tanveer F. Syeda-Mahmood. 2021c. Modeling Uncertainty in Multi-Modal Fusion for Lung Cancer Survival Analysis. 2021 IEEE 18th International Symposium on Biomedical Imaging (ISBI) (2021), 1169–1172. https://doi.org/10.1109/ISBI48211.2021.9433823
- Wang et al. (2021b) Qianwen Wang, Tali Mazor, Theresa Anisja Harbig, Ethan G. Cerami, and Nils Gehlenborg. 2021b. ThreadStates: State-based Visual Analysis of Disease Progression. IEEE Transactions on Visualization and Computer Graphics PP (2021), 1–1. https://doi.org/10.1109/TVCG.2021.3114840
- Wang et al. (2020) Shanshan Wang, Cheng Li, Rongpin Wang, Zaiyi Liu, Meiyun Wang, Hongna Tan, Yaping Wu, Xinfeng Liu, Hui Sun, Rui Yang, Xin Liu, Jie Chen, Hui-Chong Zhou, Ismail Ben Ayed, and Hairong Zheng. 2020. Annotation-efficient deep learning for automatic medical image segmentation. Nature Communications 12 (2020). https://doi.org/10.1038/s41467-021-26216-9
- Wang et al. (2021a) Xingbo Wang, Jianben He, Zhihua Jin, Muqiao Yang, and Huamin Qu. 2021a. M2Lens: Visualizing and Explaining Multimodal Models for Sentiment Analysis. IEEE Transactions on Visualization and Computer Graphics PP (2021), 1–1. https://doi.org/10.1109/TVCG.2021.3114794
- Wang et al. (2018) Yunhai Wang, Xiaowei Chu, Chen Bao, Lifeng Zhu, Oliver Deussen, Baoquan Chen, and Michael Sedlmair. 2018. EdWordle: Consistency-Preserving Word Cloud Editing. IEEE Transactions on Visualization and Computer Graphics 24 (2018), 647–656. https://doi.org/10.1109/TVCG.2017.2745859
- Worum et al. (2019) Hilde Worum, Daniela Lillekroken, Birgitte Ahlsen, Kirsti Skavberg Roaldsen, and Astrid Bergland. 2019. Bridging the gap between research-based knowledge and clinical practice: a qualitative examination of patients and physiotherapists’ views on the Otago exercise Programme. BMC Geriatrics 19, 1 (2019), 278. https://doi.org/10.1186/s12877-019-1309-6
- Wu et al. (2023) Yuchen Wu, Yuansong Xu, Shenghan Gao, Xingbo Wang, Wen gang Song, Zhiheng Nie, X. Fan, and Qu Li. 2023. LiveRetro: Visual Analytics for Strategic Retrospect in Livestream E-Commerce. IEEE Transactions on Visualization and Computer Graphics 30 (2023), 1117–1127. https://doi.org/10.1109/TVCG.2023.3326911
- Yang et al. (2023) Ouyang Yang, Yuchen Wu, Hengbao Wang, Chenyang Zhang, Furui Cheng, Chang Jiang, Lixia Jin, Yuanwu Cao, and Qu Li. 2023. Leveraging Historical Medical Records as a Proxy via Multimodal Modeling and Visualization to Enrich Medical Diagnostic Learning. IEEE transactions on visualization and computer graphics PP (2023). https://doi.org/10.1109/TVCG.2023.3326929
- Ying et al. (2021) Lu Ying, Tan Tang, Yuzhe Luo, Lvkeshen Shen, Xiao Xie, Lingyun Yu, and Yingcai Wu. 2021. GlyphCreator: Towards Example-based Automatic Generation of Circular Glyphs. IEEE Transactions on Visualization and Computer Graphics PP (2021), 1–1. https://doi.org/10.1109/TVCG.2021.3114877
- Zeng et al. (2022) Haipeng Zeng, Xingbo Wang, Yong Wang, Aoyu Wu, Ting-Chuen Pong, and Huamin Qu. 2022. GestureLens: Visual Analysis of Gestures in Presentation Videos. IEEE Transactions on Visualization and Computer Graphics PP (2022), 1–1. https://doi.org/10.1109/TVCG.2022.3169175
- Zhu et al. (2022) Xiner Zhu, Yichao Wu, Haoji Hu, Xianwei Zhuang, Jincao Yao, Di Ou, Wei Li, Mei Song, Na Feng, and Dong-Guo Xu. 2022. Medical lesion segmentation by combining multi-modal images with modality weighted UNet. Medical physics (2022). https://doi.org/10.1002/mp.15610
Appendix A Usability and Effectiveness Questions
| Category | Question |
|---|---|
| Usability | 1. The system is easy to use. |
| 2. I would like to recommend this system to others and use it in the future. | |
| 3. The system is helpful for screening valuable patient cases for learning. | |
| 4. The system is helpful for performing patient case analysis. | |
| 5. I am satisfied when using the system. | |
| 6. I feel distracted when using the system. | |
| Effectiveness | 1. I can search and filter my concerned patient cases conveniently. |
| 2. I can compare and identify consistencies in cases across modalities efficiently. | |
| 3. I can view multimodal diagnostic data and contextual information of case accessibly. | |
| 4. I can record my analysis insights for further reviews and revisions conveniently. | |
| 5. I am satisfied with the quality of the selected cases and related analyses in my report. | |
| 6. I am confident with my analysis. | |
| 7. My entire analysis process is efficient. |
Appendix B Criterion of Analysis Report
| Criterion | Description | Scoring Criteria |
|---|---|---|
| Completeness | Measures the number of identified cases matching the ground truth. | 9-10: Identifies 95-100% of cases. |
| 7-8: Identifies 85-94% of cases. | ||
| 5-6: Identifies 70-84% of cases. | ||
| 3-4: Identifies 50-69% of cases. | ||
| 1-2: Identifies less than 50% of cases. | ||
| Accuracy | Assesses the precision of the rationale provided for each selected case. | 9-10: Rationale is precise, relevant, and aligns perfectly with each case. |
| 7-8: Rationale is mostly precise with minor inconsistencies. | ||
| 5-6: Rationale is somewhat precise but lacks clarity or relevance in some cases | ||
| 3-4: Rationale is generally imprecise with limited relevance. | ||
| 1-2: Rationale is inaccurate or missing for most cases. |