Impacts of UV Radiation from an AGN on Planetary Atmospheres and Consequences for Galactic Habitability
Abstract
We present a study of the effects of ultraviolet (UV) emission from active galactic nuclei (AGN) on the atmospheric composition of planets and potential impact on life. It is expected that all supermassive black holes, which reside at galactic centers, have gone through periods of high AGN activity in order to reach their current masses. We examine potential damaging effects on lifeforms on planets with different atmosphere types and receiving different levels of AGN flux, using data on the sensitivity of various species’ cells to UV radiation to determine when radiation becomes “dangerous”. We also consider potential chemical changes to planetary atmospheres as a result of UV radiation from AGN, using the PALEO photochemical model. We find the presence of sufficient initial oxygen (surface mixing ratio ) in the planet’s atmosphere allows a thicker ozone layer to form in response to AGN radiation, which reduces the level of dangerous UV radiation incident on the planetary surface from what it was in absence of an AGN. We estimate the fraction of solar systems in galaxies that would be affected by AGN UV radiation, and find that the impact is most pronounced in compact galaxies such as “red nugget relics”, as compared to typical present-day ellipticals and spirals (using M87 and the Milky Way as examples). Our work generally supports the Gaia hypothesis, where the development of life on a planet (and resulting oxygenation of the atmosphere) causes the environment to become more stable against potential extinction events in the future.
1 Introduction
Supermassive black holes (SMBHs) exist at the center of virtually every massive galaxy and are known to grow via periods of intense accretion activity (Hopkins et al., 2006; Volonteri, 2010). There is evidence that our own galaxy’s central black hole (BH), Sagittarius A*, experienced an active galactic nucleus (AGN) phase a few million years ago, as suggested by the observed Fermi bubbles (Su et al., 2010; Zhang & Guo, 2020) as well as the unexpectedly high population of young stars near Sagittarius A* (Chen & Amaro-Seoane, 2015).
Previous works have considered the risks to planetary habitability due to radiation from an AGN, primarily considering the dangers posed by Sagittarius A* in an active phase, from direct radiation (e.g., Balbi & Tombesi, 2017; Amaro-Seoane & Chen, 2019; Lingam et al., 2019; Pacetti et al., 2020) as well as from atmospheric mass loss (e.g., Balbi & Tombesi, 2017; Chen et al., 2018; Forbes & Loeb, 2018; Wisłocka et al., 2019; Ishibashi, 2024). Of these, to our knowledge only Lingam et al. (2019) consider risks stemming from UV radiation of an AGN specifically, using a framework where they argue that there may be danger to life on the planetary surface if the top-of-atmosphere (TOA) flux received from the AGN is equal to or greater than the total TOA flux of the Sun on Earth— in other words if the TOA flux received on a hypothetical Earthlike planet orbiting a Sunlike star is doubled. Pacetti et al. (2020) also use a similar framework to estimate UV radiation danger associated with tidal disruption events (TDEs) from a central SMBH.
Our study on UV radiation from AGN builds upon this previous work by making use of the range of studies considering habitability of planets around M dwarf stars, which are known to be very active and expose their planets to high levels of ultraviolet (UV) and extreme-UV (XUV) fluence during flares (Segura et al., 2010; Chen et al., 2021; Ridgway et al., 2023). We modified the Platform for Atmosphere, Land, Earth, and Ocean model, PALEO, which had previously been used to study the effects of different stellar spectra on planetary atmospheres (Eager-Nash et al., 2024), to address the problem of high UV flux from an AGN.
1.1 UV Radiation and Life
There are a number of effects that high levels of UV radiation, such as those produced in an M dwarf flare or AGN radiation, may have on planetary habitability. Depending on a planet’s atmospheric composition, these effects can be helpful or harmful. It is possible that high UV radiation could severely hinder the development of life on a planet with an Earthlike atmosphere by preventing the formation of complex chemicals (Balbi & Tombesi, 2017), however, in lower doses the formation of complex chemicals could be triggered by UV radiation, which might aid the development of life (Ranjan et al., 2017; Rimmer et al., 2018; Lingam et al., 2019). There is also the possibility that UV radiation would have virtually no effect at all, if the atmosphere is composed such that it effectively blocks out UV light from reaching the surface (O’Malley-James & Kaltenegger, 2019; Estrela et al., 2020).
Exoplanets in the super-Earth/miniature Neptune regime could also be made more habitable as XUV radiation could trigger hydrodynamic escape of hydrogen-rich atmospheres (Luger et al., 2015; Chen et al., 2018; Wisłocka et al., 2019). Simulations have shown that oxygen in an atmosphere can be resistant to hydrodynamic escape even while lighter elements like hydrogen escape (Wisłocka et al., 2019), and that the presence of can potentially make the atmosphere as a whole resistant to hydrodynamic escape from XUV radiation (Tian, 2009). Therefore, depending on the composition of a planetary atmosphere, the risks of atmospheric escape might also be mitigated. It has also been demonstrated that ozone depletion of planetary atmospheres via ionizing radiation from M dwarf flares can be disastrous for life on the planet (Thomas et al., 2015), as ozone is largely responsible for the protection of the planetary surface from UV radiation which is harmful to life (Gebauer et al., 2017). The generation or depletion of ozone is in turn connected to the abundance of oxygen in the atmosphere.
It is clear that the atmospheric composition of a planet is a particularly important factor regarding how its overall habitability responds to high doses of radiation. Aside from the loss of atmospheric gas, there is also the potential for high UV flux to generate chemical reactions within the planetary atmosphere that alter its properties, as is seen for 3D models of terrestrial planets orbiting flaring M dwarf stars (Chen et al., 2021; Ridgway et al., 2023). In Ridgway et al. (2023), the UV flux from the M dwarf flares is shown to generate a thicker ozone layer which persists and offers some protection from future flares. While we model Earthlike planets orbiting Sunlike stars for the purposes of this work, we motivate our research questions by drawing upon the effects that UV radiation (from M dwarf flares) has already been demonstrated to have on planetary atmospheres and therefore habitability.
Different biological species on Earth are known to have varying tolerances to UV radiation. In our analysis of effects that AGN radiation has on planetary habitability, we consider the levels of UV flux incident on the planetary surface and how those compare to the tolerances of various species, as well as the chemical changes AGN flux can cause in the planet’s atmosphere and how the subsequent evolution of the atmosphere may improve or worsen conditions for species on the planetary surface.
1.2 Galaxies of Interest
In order to relate our study to the planetary populations of real galaxies, we consider examples of elliptical and spiral galaxies (M87 and the Milky Way [MW], respectively), as well as “red nugget relic” galaxies for which the impact of AGN radiation may be particularly pronounced. We use the stellar population distribution data from each galaxy as a proxy for the distribution of Earth-like planets orbiting Sun-like stars throughout the galaxies, to determine what percentage of these planets in a given galaxy will be affected by certain levels of AGN UV radiation. This stellar population analysis is described in more detail in 2.2.
M87 is one of the most well-observed elliptical galaxies, containing the BH recently imaged with the Event Horizon Telescope at its center— an SMBH of mass (Prieto et al., 2016). Due to its nature as a large elliptical, the potential planetary systems in this galaxy are far more susceptible to damage from its central SMBH, M87*. This galaxy has an almost complete lack of cold interstellar medium (ISM) which might attenuate radiation, a very massive central SMBH, and a compact stellar population distribution, with large portions of the stars near to M87’s galactic center (Fan et al., 2008; Prieto et al., 2016; Whitmire, 2020).
We also consider the MW, as an example spiral galaxy and because these results have more direct impacts for humans and the search for extraterrestrial life in our neighborhood. Our central SMBH, Sgr A* (with a mass of ) is known to have experienced active phases in the past, the most recent of which is estimated to have occurred a few million years ago (e.g. Mezger et al., 1996; Su et al., 2010; Volonteri, 2010; Bland-Hawthorn et al., 2013; Chen & Amaro-Seoane, 2015; Zhang & Guo, 2020).
Finally, we consider the local relic galaxies Mrk 1216, NGC 1271, NGC 1277, NGC 384, UGC 2698, and PGC 11179. These relics, also called ‘compact elliptical galaxies’ (CEGs) or “red nuggets”, are local analogs for the expected progenitors of modern massive elliptical galaxies (van Dokkum et al., 2010; Yıldırım et al., 2017); these six in particular are selected because they have both stellar mass distributions and BH mass estimates in the literature. These galaxies all host SMBHs, with masses as follows: NGC 1271 = (Walsh et al., 2015); NGC 1277 = (Walsh et al., 2016); Mrk 1216 = (Walsh et al., 2017); UGC 2698 = (Cohn et al., 2021); PGC 11179 = (Cohn et al., 2023); and NGC 384 = (Cohn et al., 2024). This sample of relic galaxies allows us to probe how the planetary population of galaxies in the early universe might have been affected by UV radiation from AGN. Also, by virtue of having more compact stellar populations than large ellipticals like M87, they are good candidates to potentially have a large percentage of their stellar population be substantially affected by AGN radiation as opposed to typically more extended modern galaxies.
2 Methods
In this section, we present the methods by which we have analyzed the effect of AGN radiation on planetary atmospheres and biological species residing within them. In Section 2.1, we describe how we scaled an AGN spectral energy distribution (SED) to represent various physical situations we aim to simulate. In Section 2.2, we discuss how we estimate the percent of the stellar population in a given galaxy affected by different levels of AGN radiation. In Section 2.3 we elaborate on the properties of the Platform for Atmosphere, Land, Earth, and Ocean model, PALEO, and configurations used; in particular our initial and boundary conditions for the atmosphere in PALEO, which represent surface oxygen mixing ratios typical of the Archean, Proterozoic, and Modern atmospheric compositions of the Earth. Further details on PALEO can be found in Eager-Nash et al. (2024). Lastly, in Section 2.4, we detail how we quantify danger to different species (humans, rats, E. Coli, and D. Radiodurans) due to UV radiation.
2.1 AGN Radiation
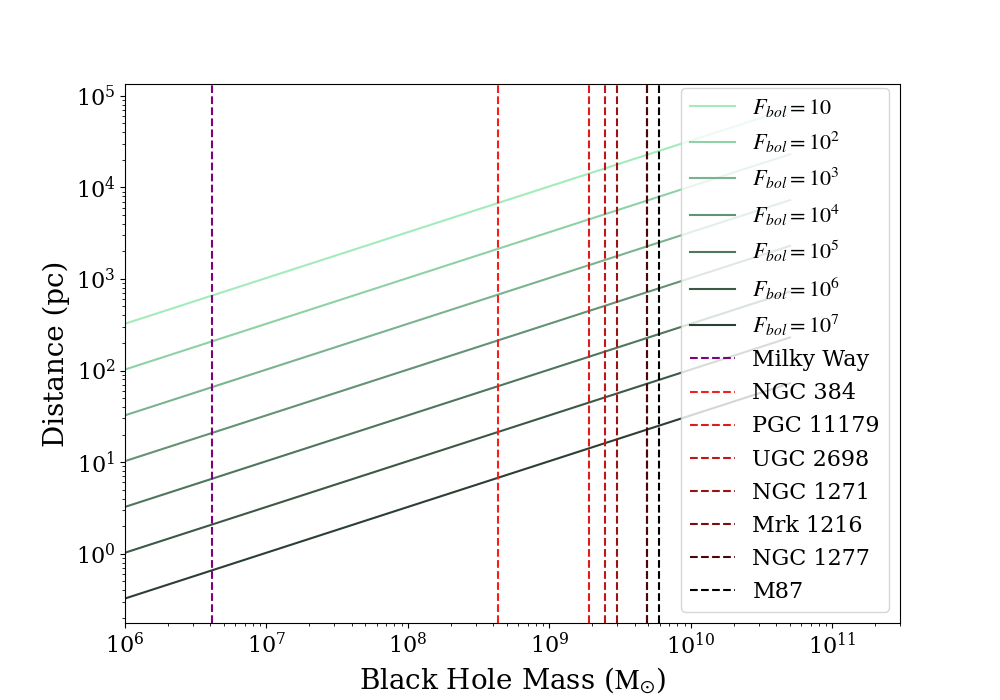
We use a mean quasar SED from Richards et al. (2006) as a model for the SED of an AGN, and consider the hypothetical conditions in our galaxies of interest if their central SMBHs were to enter an AGN phase. For simplicity we assume the AGN SED does not change with luminosity or Eddington ratio. We scale the mean quasar SED by factors such that their bolometric flux at the position of a hypothetical planet is equal to , , etc. up to . This scaling is chosen to cover the range of bolometric fluxes roughly associated with danger to different species on the surface of an Earthlike planet, as defined further in Section 2.4. Table 1 provides the legend of what physical conditions (BH mass, Eddington ratio, and distance) each scaled flux could represent in the main three galaxies we discuss: M87, the MW, and NGC 1277. NGC 1277 is chosen as an example of the conditions in our red nugget relic galaxy sample, because it has the most dramatic result in terms of large percentages of the planets in the galaxy potentially receiving substantial doses of radiation (due to the combination of its BH mass and stellar population distribution; see Section 3.2.1), so it represents an upper limit on the impacts of AGN UV radiation on a galaxy’s habitability. However, the results in the other red nuggets are qualitatively similar. A visual representation of this information is shown in Figure 7 in the Appendix. The corresponding information for the other five red nuggets is provided in the Appendix, Table 7 in Section B.
| Flux () = | ||||||||
| Galaxy | Edd. Ratio | Distance (pc) | ||||||
| M87 | ||||||||
| MW Bulge | ||||||||
| NGC 1277 | ||||||||
2.2 Stellar Distributions
We use the stellar mass distribution in our galaxies of interest to estimate what percentage of the galaxy’s total stars would be receiving flux above certain limits that we define as dangerous to life in Section 2.4. This is a proxy for estimating what percentage of possible habitable worlds in the galaxy would be affected by this radiation, assuming a spherically symmetric distribution of stars and a constant stellar mass function and mass-to-light ratio.
For the M87 galaxy, we use the radial stellar luminosity volume-density profile provided in Figure 1 of Gebhardt & Thomas (2009), and integrate in order to find a count of stars. For the MW, we only consider stars within the bulge of the galaxy. This region has a ‘boxy-peanut’ shape, but for the sake of simplicity we also assume spherical symmetry. We use the stellar mass versus radius data for the MW bulge from Figure 2 Panel 3 of Sofue et al. (2009). The choice to only consider the central bulge of the MW is motivated by how limited the radiation received on hypothetical planets even within the bulge is, assuming no attenuation from the ISM (see Table 1). In the disk, which has a much more substantial ISM and stars located much further from the galactic center (Wyse et al., 1997), the radiation is assumed to be negligible.
Lastly, for the red nugget relics, we use the surface brightness density versus projected radius data provided in Figure 6 of Yıldırım et al. (2017), and deproject and integrate the data to get a count of stars as a function of radial distance. The surface brightness profiles given in Yıldırım et al. (2017) only extend down to from the galactic center at its minimum, but the stellar population at radii nearer to the center than this become important later on in our analysis. Therefore, we extrapolate the surface brightness profiles, , down to from the center— this is done before any deprojection or integration (Harris et al., 2020). We produce these extrapolated data points using a power law fit to the inner region of the surface brightness profile for each galaxy (projected radii from to ; the choice of as the outer limit is arbitrary).
2.3 Planetary Atmospheres
We model the effects that AGN UV radiation has on planetary atmospheres, which in turn affects habitability of the planetary surface, using the the Platform for Atmosphere, Land, Earth, and Ocean model, PALEO. PALEO was developed as a flexible framework for modelling the Earth System (e.g. Daines & Lenton, 2016), and more recently, the addition of the 1D photochemical atmosphere component has allowed PALEO to model the atmospheric chemistry of exoplanets (Eager-Nash et al., 2024). We used a configuration of PALEO with a 1D photochemical atmosphere, similar to that described in Eager-Nash et al. (2024), to test the effects of AGN radiation on a planetary atmosphere.
Previously, Eager-Nash et al. (2024) used PALEO to investigate the evolution of atmospheres under radiation from a single source, comparing the effects of radiation from the Sun at ago versus the M dwarf Trappist 1. For our work, we have developed the PALEO framework to model photochemistry resulting from multiple irradiating bodies, allowing us to combine the SEDs of the host star and an AGN. Specifically, PALEO uses an SED in the UV, visible and near-infrared wavelengths, from approximately to . This is the wavelength range that is relevant to photochemistry in a planetary atmosphere containing carbon, hydrogen, oxygen, sulfur, and nitrogen compounds. Our two inputted SEDs are that of the modern Sun, for simplicity’s sake, and the AGN SED described in Section 2.1.
Notably, the AGN SED we use includes a wider range of wavelengths than those that PALEO requires, because PALEO only captures those wavelengths of light relevant to photochemistry of carbon, hydrogen, oxygen, nitrogen, and sulfur molecules. As such the bolometric fluxes () by which our simulations are labeled in all plots in Section 3 are bolometric fluxes integrated over the full wavelength range our SED covers, from approximately to . In practice, the total integrated flux over the range which PALEO considers is roughly of the AGN’s bolometric flux as we define it. We have chosen this labeling method because using a value closer to the true bolometric luminosity of the AGN is more intuitive, and can then also be related directly to the Eddington ratio of the black hole (BH).
The atmosphere modeled in PALEO is cloud-free with a model top of (divided into equally spaced levels in which reactions are computed), and assumes a constant flux at the top of the single column atmosphere for the entire model runtime, evenly distributed on all sides of the planet. We use the same parameterizations for the atmosphere described in Eager-Nash et al. (2024), but we do not include the ocean component. We use the “full” chemical network described in Eager-Nash et al. (2024), which includes C, N, H, O, and S containing gaseous molecules. The full network of reactions between these can be found in Appendix A of Eager-Nash et al. (2024). The boundary conditions and other initial parameters we use can be found in Table 2.
| Molecule | Surface mixing ratio () |
| , , | |
| Surface flux () | |
For our AGN experiments, we use the chemical parameters to model the composition of Earth’s atmosphere today, during the Archean period, and during the Proterozoic period by changing the surface mixing ratio. We use these different epochs in Earth history as an attempt at accounting for different atmospheric compositions exoplanets may have, though we are still inherently very biased towards inhabited, terrestrial planets. The Archean period occurred on Earth from around ago, before the Great Oxidation Event, thus its very low levels (Bekker et al., 2004). The Proterozoic period occurred directly after the Great Oxidation event, beginning roughly ago (Bekker et al., 2004) and ending roughly ago. The most important difference, for our analysis, between these three epochs in Earth’s history is the oxygen mixing ratio, which is for the modern Earth, and we take values of and for the Proterozoic and Archean atmospheres, respectively. These represent two stable surface mixing ratios on either side of the Great Oxidation Event (Gregory et al., 2021), though the exact concentration of oxygen likely changed over these eras. We only vary the concentration of oxygen between our three model atmospheres (see Table 2), as this the most significant difference between these three epochs of Earth’s history. Furthermore, the most influential chemical process occurring in our simulations is the formation of ozone, , via the Chapman mechanism (Chapman, 1930), which is driven by UV flux. The varying levels in our atmospheric simulations dictate the amount of ozone that is ultimately able to form.
We run simulations for to allow for an equilibrium to be reached, which we determine as when the mixing ratios of gasses are no longer evolving. We initialize our AGN runs using the equilibrium composition of the Sun-only simulations, to allow us to investigate the evolution of the atmosphere following the onset of an AGN phase. We use the SED of the modern Sun in all experiments, seeing as the difference in UV flux between the prehistoric Sun and the modern Sun is negligible compared to the UV flux provided by the AGN in our simulations (Claire et al., 2012). In the highest AGN flux simulation we ran under the Archean atmosphere, the tolerance of the solver was increased to allow the simulation to fully equilibrate. In addition to chemical concentration as a function of altitude, PALEO also outputs the integrated spectrum of transmitted flux of the atmosphere (for light passing from the top to the bottom of the atmosphere), which in turn gives us the surface flux on the model planet. We can compare the input SED, also called the TOA flux, to surface flux to assess how much or little protection from UV radiation the atmosphere provides.
2.4 UV Tolerance of Species
In order to quantify the level of UV flux at which organisms on a planetary surface may be endangered, we turn to several biological studies considering the average dose of UV radiation to kill of a sample of cells () from several lifeforms— humans, rats, E. Coli, and D. Radiodurans— as the “limit of danger”. The flux limits we discuss do not imply that the species in question will face immediate death upon experiencing this level of flux, simply that there are dangers to individual organisms’ health, and potentially to the species’ long-term survival if this level of radiation persists for a significant period of time. In Section 3.2, it can be observed that even radiation from the Sun surpasses some of these danger limits. This is indeed true, in the sense that an organism experiencing 24 hours of continuous radiation from the Sun with no kind of shade or other sun protection has an increased risk of long term health damage (D’Orazio, 2013), and that if this persists for all members of the species for extended periods of time, there are risks to their long term survival.
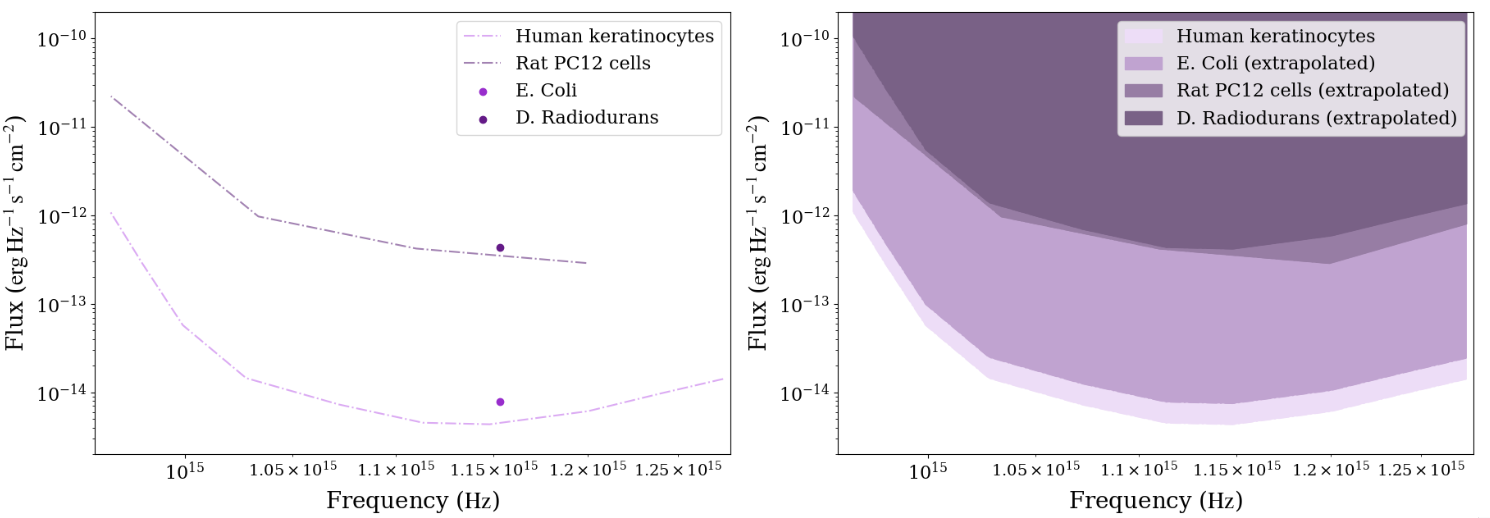
We use data for human epidermal keratinocytes, the cell type that makes up the majority of the skin’s outermost layer (Aoki et al., 2011), rat PC12 cells derived from rat pheochromocytoma tumors (Masuma et al., 2013), E. Coli, a common bacteria, and D. Radiodurans, an extremophile known to be very resistant to high radiation levels (Krisko & Radman, 2010). Krisko & Radman (2010), Aoki et al. (2011), and Masuma et al. (2013) provide lethal doses to these cell types over either or of UV exposure, at a variety of wavelengths. We standardize them all to , assuming that the total UV fluence received is what defines the limit of danger. We refer to these data as “spectra” throughout, but note that they represent a differential flux incident on cells required to generate a certain effect, not a flux radiated from a body.
The lethal UV doses to human keratinocytes provided in Aoki et al. (2011) cover a wavelength range from to , whereas the doses for rats in Masuma et al. (2013) range from to , and in Krisko & Radman (2010) the lethal dose is only provided at for E. Coli and D. Radiodurans. Observing the similar shape of the spectra of fluxes lethal to of humans and rat cells, we extrapolate all of the spectra out to the wavelength limits of the human cell lethality spectrum. We perform this extrapolation by assuming each of the spectra share the same shape, scaled up or down by a constant factor. The original and extrapolated spectra are shown in the Appendix, Figure 8 in Section A.2, for reference.
All three studies providing the lethal dose data to cells uses bulbs with a bandwidth to provide UV light at each wavelength. Using this, we can convert their flux data into a differential flux with respect to wavelength, , assuming the spectrum of each bulb has a ‘top hat’ shape and delivers a constant flux at each wavelength in its bandwidth. We then convert to a differential flux with respect to frequency, , which matches the units of the AGN SED and can be compared.
3 Results and Discussion
In this section, we give an overview of how UV radiation from an AGN affects planetary atmospheres and therefore habitability. First, in Section 3.1 we present the results of our simulations in PALEO, showing how different levels of AGN flux alter the atmospheric composition and transmission of UV radiation over time. We also make note of the possibility of a runaway greenhouse effect in some cases, which PALEO does not simulate. Then, in Section 3.2, we compare the UV transmission of the various model planetary atmospheres before and after their composition was changed by AGN radiation. We comment on how the danger to species on the planetary surface has evolved as a result of this. We estimate based on AGN radiation alone (excluding solar radiation) the percentage of the potential habitable worlds which may be in danger in our galaxies of interest, which were described in Section 1.2.
3.1 Atmospheric Evolution with PALEO
High levels of UV radiation from an AGN will not only be radiatively transported through an existing atmosphere, but can cause chemical reactions that alter atmospheric composition, as discussed in Section 1.1. Here we use the atmospheric modeling code PALEO (described in Section 2.3) to study these changes.
3.1.1 Modern Earth Atmosphere
First, we run the model for the Modern Earth atmosphere, with AGN SEDs scaled to various bolometric fluxes. The TOA flux applied to all simulations (which is consistent across all three atmosphere types) is shown in Figure 1A. The results for the Modern atmosphere are shown in Figure 1B and Figure 2A.
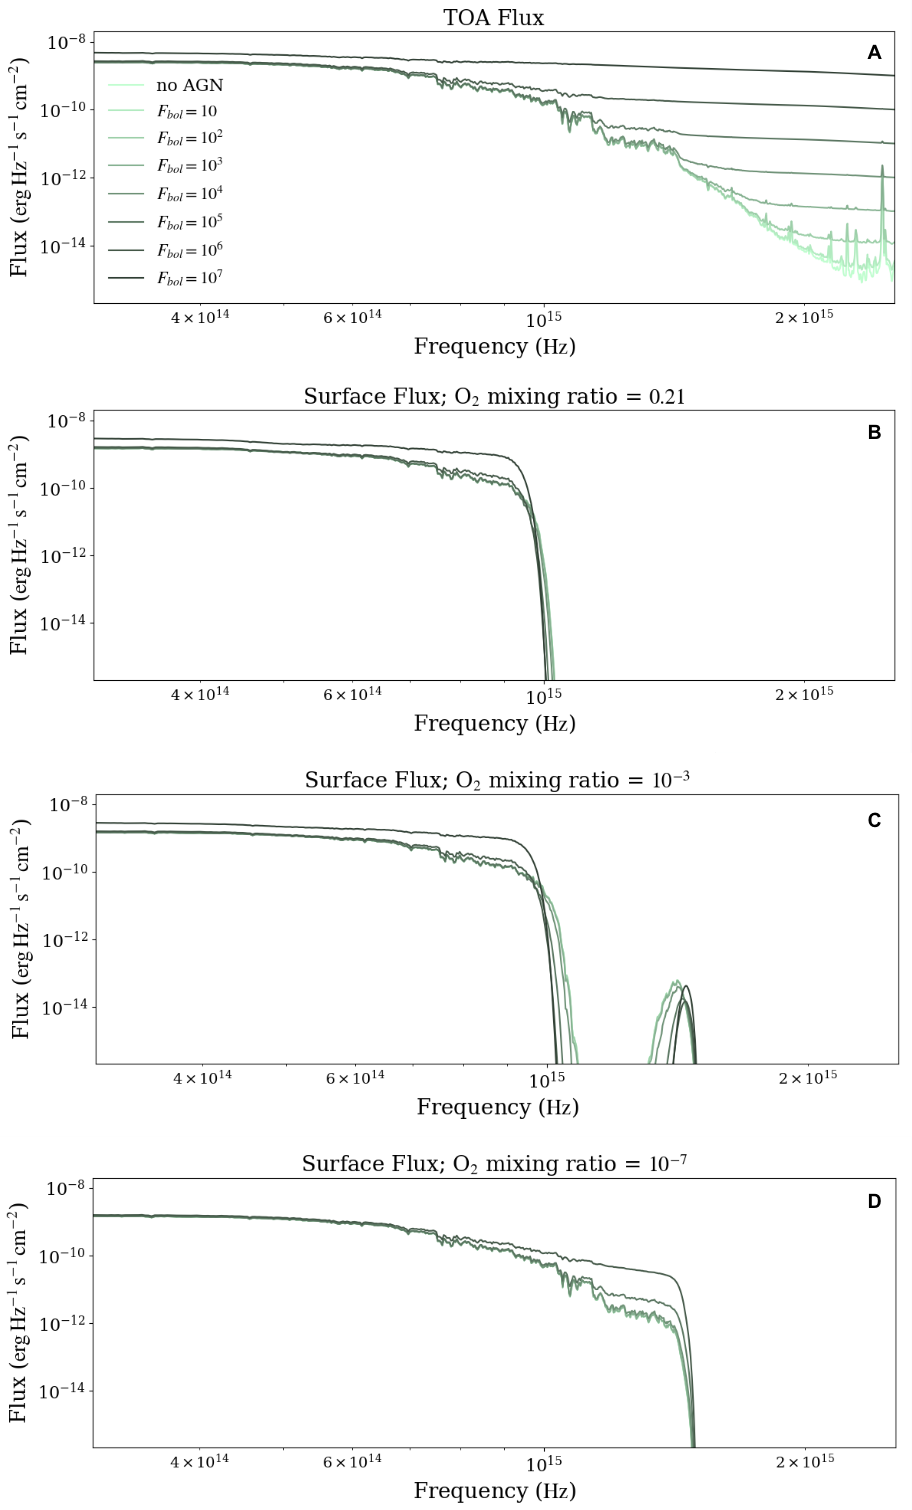

In Figure 1A, we see that the main difference in the AGN radiation versus the No AGN case is the high UV radiation introduced. The AGN spectrum is much bluer than the solar spectrum, so the solar radiation dominates at lower frequencies, while the AGN radiation dominates around the UV. The surface spectrum nevertheless has a negligible flux transmitted through the atmosphere in the UV regardless of the AGN flux (see Figure 1B). The explanation for these results lies in Figure 2A, where we see how the atmospheric composition of the model has evolved for the AGN cases. Based on these results we hypothesize that increased UV flux caused chemical reactions of in the atmosphere into via the Chapman mechanism, which then provided greater protection against UV radiation, as was the case in Ridgway et al. (2023) for a model planet receiving excess UV flux from a flaring M dwarf star.
3.1.2 Proterozoic Earth Atmosphere
Next, we tested an intermediate case, the Proterozoic Earth atmosphere, which has a greater concentration of oxygen than the Archean, but less than the modern Earth. The results for these experiments are shown in Figure 1C, and Figure 2B.
In this case, we see once again that there is attenuation in the UV at the planet’s surface, though less so than the Modern Earth atmosphere. Interestingly, adding more flux to the simulation is actually reducing the amount of flux which is ultimately transmitted to the surface from and upwards in AGN flux (darker green curves). This is also the case in the Modern atmosphere (Figure 1B), but the effect is much more pronounced for the Proterozoic. The Archean (Figure 1D, discussed in Section 3.1.3) does not exhibit this behavior. This result suggests that the concentration of oxygen in the Proterozoic atmosphere represents an intermediate case, where the production of UV-protecting ozone is highly sensitive to small changes in the flux. The lower initial oxygen level means this rapid ozone protection produces a more substantial increase in surface protection from UV radiation as compared to the Modern or Archean atmospheres. In the ozone mixing ratio plot for these simulations, Figure 2B, at of AGN flux and above the ozone layer in the upper atmosphere becomes notably thicker and moves to a somewhat lower altitude. This is consistent with that we observed in the surface flux plot (Figure 1C).
3.1.3 Archean Earth Atmosphere
Since the formation of an ozone layer is dependent on sufficient molecular oxygen, we now examine surface mixing ratios that are not sufficient to form an ozone layer, as occurred during the Archean period. The results for the Archean atmosphere are shown in Figure 1D and Figure 2C. The simulation for the Archean atmosphere is not included because it did not converge, due to the high level of flux combined with the very low level of oxygen.
In the surface flux plot, we see that there is now virtually no attenuation in the UV. With this atmosphere, even the No AGN/Sun-only case provides a high dose of UV radiation to the surface, though we note that simple, monocellular life did exist on Earth’s surface during this time (Lepot, 2020), so these conditions are, in principle, habitable. In terms of the ozone concentration in the Archean atmosphere simulations, Figure 2C, we can see that there is minimal ozone production compared to the other two atmospheres, which is consistent with the limited amount of oxygen that existed initially. The fact that little ozone is produced also reaffirms the key role of ozone production to planetary surface protection from UV radiation in these simulations.
3.1.4 Time Evolution
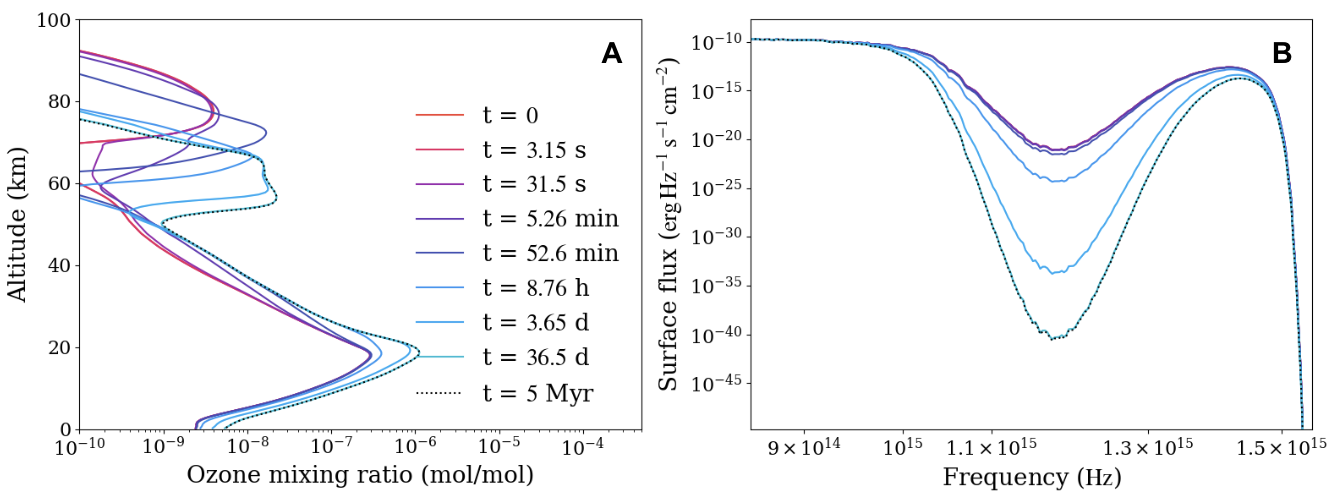
As discussed in Sections 3.1.1, 3.1.2, and 3.1.3, the increased flux from the AGN leads to the increase in ozone mixing ratio in the atmosphere in the Modern and Proterozoic atmospheres (and not in the low-oxygen Archean atmosphere), which in turn protects the surface from potentially dangerous UV radiation. Next, we quantify how quickly this UV-protecting ozone layer develops, in order to determine how long the initial radiation danger level persists before it is mitigated by a thickening of the ozone layer.
The ozone formation at different times for a Proterozoic Earth atmosphere with radiation scaled to is shown in Figure 3. We model this particular flux level in the Proterozoic atmosphere here because it represents a limiting case where small (order of magnitude) increases in TOA flux are generating substantial amounts of ozone production (see Section 3.1.2). In the first approximately of simulated time, there is a dramatic evolution of the ozone distribution from its initial atmospheric conditions having experienced only solar radiation (red curve, representing , Figure 3A). We see that after , the ozone distribution and surface flux virtually stop changing. The lack of change in the surface flux indicates the atmospheric transmission is no longer changing. These results are consistent with what was found for planetary atmospheres experienced UV radiation from M dwarf flares in Ridgway et al. (2023), where after the initial simulated M dwarf flare the atmospheric ozone level rises to what will ultimately be its final level before , as shown in their Figure 9.
Relative to the timescales we are considering for AGN activity, which are on the order of (Schawinski et al., 2015), this ozone development happens virtually instantaneously. However, for the species living on the planetary surface, this is still a significant period of time to experience high irradiation. When we quantified danger to species (see Section 2.4) we considered the fluence necessary to kill cells on a timescale of . So while the timescale for atmospheric evolution is negligible compared to the time the AGN will be active, there will still be significant risks to species on the surface during this period, assuming a constant AGN flux from the time the AGN “turns on”.
3.1.5 Runaway Greenhouse
The PALEO atmospheric modeling code we use in this work does not model the evolving climate - only chemistry evolves under a fixed pressure-temperature profile. This means we cannot model the runaway greenhouse transition, which involves heating of the atmosphere. However, if the incoming TOA flux exceeds a certain threshold, we can predict this phenomenon will occur. The limit for a runaway greenhouse process to occur on a planet has been estimated at a TOA flux of in solar radiation (Leconte et al., 2013), equivalent to . To compare our models to this threshold, we integrate the AGN flux over the full wavelength range of our original AGN SED from Richards et al. (2006), and add the total flux from the Sun— , or .
The integrated incoming TOA flux from the AGN plus the Sun exceeds this limit at a bolometric AGN flux of . If a runaway greenhouse does develop, then this may negate any benefits to species living on a planet with increased ozone protection developed from UV radiation, as the high temperature of the planetary surface may render it uninhabitable regardless.
3.2 Results Post-Atmospheric Evolution
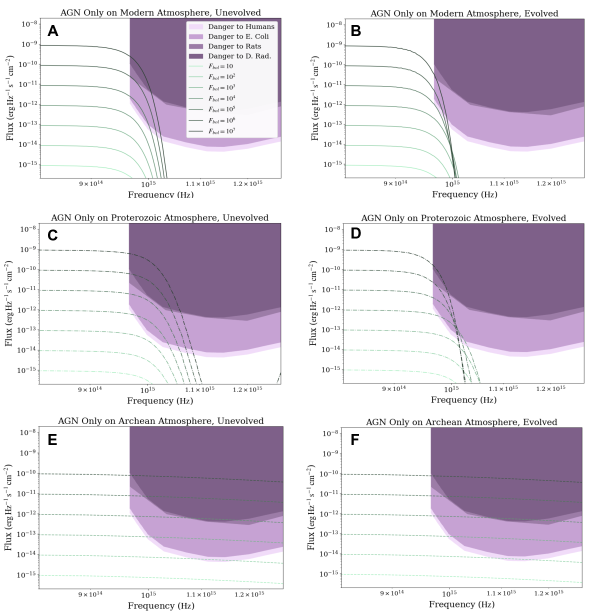
To determine the reduction of danger that species face as a result of their planetary atmospheres evolving, we plot the PALEO surface flux output over our limits of danger to species established previously. These are shown side-by-side with the same plot for the initial/unevolved atmospheres in Figure 4.
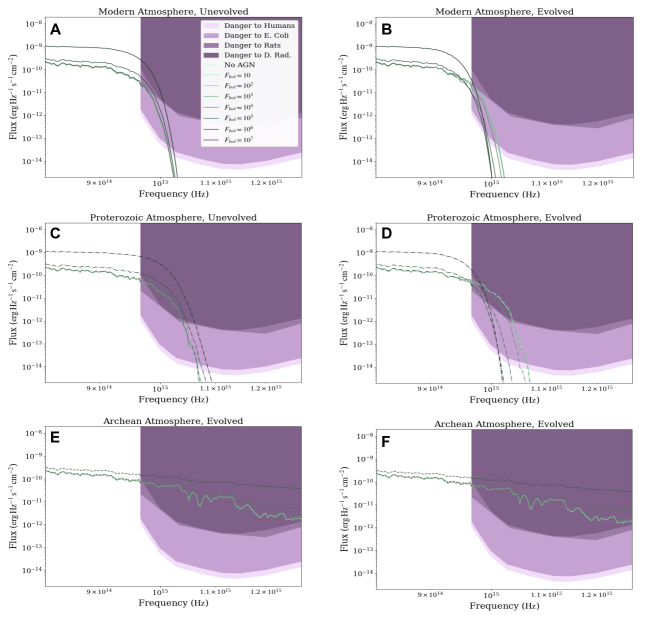
With the presence of a stellar spectrum (the Sun), we see that all species under a given atmosphere do experience some level of danger from stellar radiation— even with no AGN present— as quantified by the purple zones of ‘species danger’ which are plotted over each panel of Figure 4, and were motivated in Section 2.4. Nevertheless, there are variations in how much area of the purple-shaded danger zone is included under the different flux curves, and therefore the integrated dangerous flux received at the surface. Figure 4 shows differential flux versus frequency , so an area shown on a plot can be expressed as an integrated flux. We can qualitatively compare the total amount of dangerous flux received in each simulation to make statements about relative protection received from the atmosphere. The amount of dangerous flux received versus overall AGN flux is also quantitatively represented in Figure 5.
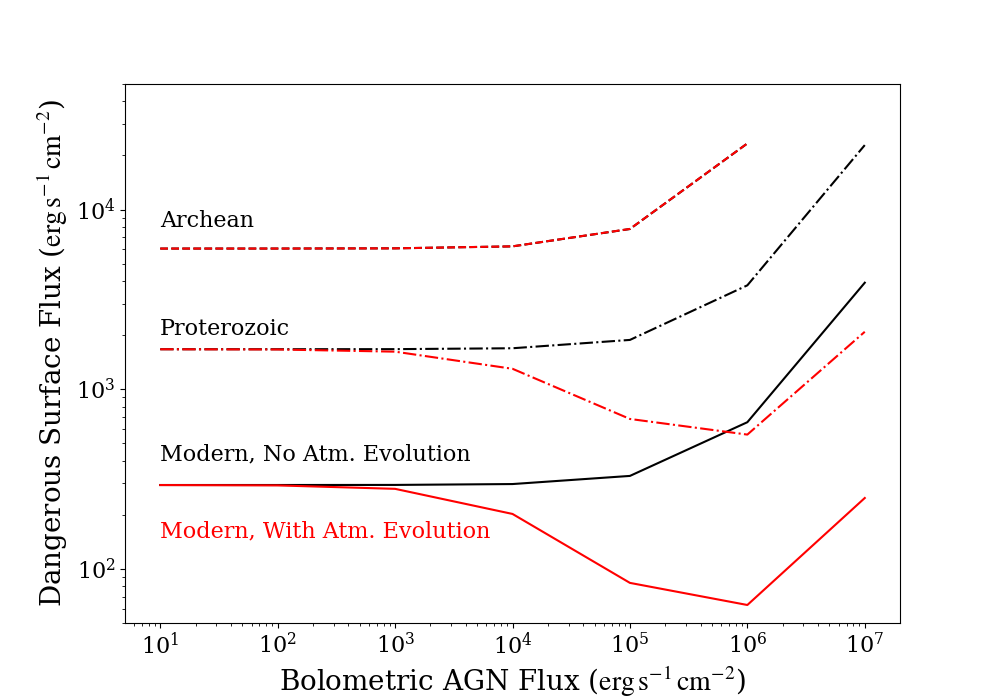
In the modern atmosphere case, Figure 4A and B, we see a smaller area of the purple shaded regions are included under the flux curves with an evolved atmosphere versus the initial atmosphere, indicating a reduction in danger to species. Notably, the reduction is more pronounced with the higher flux cases. This is consistent with a scenario where larger amounts of UV flux generate higher ozone mixing ratios and higher levels of protection on the surface at lower UV wavelengths. In Figure 5, we see that even in the most extreme AGN flux case we test, there is still less dangerous flux on the planetary surface versus a scenario where solar flux dominates.
In the Proterozoic atmosphere case, Figure 4C and D, we see that under the evolved atmosphere the lowest flux curves cover a substantially larger area on the shaded purple zone where species are in danger versus the higher flux cases. This is similar to what was observed in the modern atmosphere, however the transition is more dramatic in this case, with a lower amount of starting oxygen (surface mixing ratio of ) generating less initial protection. However, the level of dangerous flux on the surface is still much more than the same AGN flux scenarios for the Modern atmosphere, as we see in Figure 5.
Both the Proterozoic and Modern atmospheres exhibit slightly increased protection overall in the higher flux cases compared not only to the lower AGN flux cases, but also compared to the No AGN case. This indicates that the production of additional ozone triggered by the AGN radiation actually results in a net increase in surface UV protection for species, as compared to the same atmosphere with only the Sun’s radiation. This raises the interesting question of how the presence of an AGN may actually foster improved habitability in the long-term, after potential short-term damages to species from UV radiation.
Lastly, in the Archean atmosphere case shown in Figure 4E and F, we see virtually no change between the initial and evolved atmospheres. This is consistent with what we saw in Section 3.1.3. During the actual Archean period, life on Earth consisted of monocellular organisms, which were more resistant to radiation than many modern species (Lepot, 2020). Nevertheless, our results shows that even D. Radiodurans, one of the most radiation-resistant monocellular organisms known today, is still in danger on the surface of a planet facing these conditions— so even very hardy, early life developing on a planet’s surface would still be at risk. Oceans may provide further protection from UV radiation that allows life to persist underwater, as demonstrated in Estrela et al. (2020) for exoplanets experiencing high UV radiation from M dwarf flares, but that is beyond the scope of this work.
3.2.1 Stellar Population Impacts in Galaxies
Previous works on the subject of AGN UV radiation and galactic habitability (Lingam et al., 2019; Pacetti et al., 2020) have considered only the radiation from the AGN and not the additional radiation of a host star, and given distances from the galactic center within which a hypothetical planet would become dangerous to life due to high UV radiation. In order to make this work more naturally comparable to these previous studies, we now analyze the results found in Section 3.2 using the AGN flux only.
The surface flux from only the AGN before and after chemical evolution of the atmosphere is shown in Figure 6. This is identical to Figure 4 but with the solar flux subtracted out. The point at which a species is in danger is now defined as the radial distance from the galactic center at which the surface differential flux () from the AGN exceeds the lower limit of danger for the species at any frequency. We determine the bolometric flux at which this occurs by linearly interpolating between the surface flux SEDs shown in Figure 6 (Virtanen et al., 2020). These flux limits representing danger to species in a given galaxy are shown in Table 3. The distances from the galactic center within which species face danger are shown in Table 4 for M87, Table 5, and Table 6, as well as in corresponding tables in Appendix Section B for the other red nugget relic galaxies. Also listed in these tables are the percentages of the stellar population in a given galaxy which would experience equal to or greater than the dangerous level of AGN flux.
We are not able to find exact distance or population percentage values for D. Radiodurans under a modern atmosphere, as the entire shaded danger region to D. Radiodurans (Figure 6B) sits above the highest AGN flux simulation that converged under the Modern atmosphere, so no interpolation could be performed. However the flux needed to cause danger to D. Radiodurans is greater than that needed to cause danger to rats across all of the UV wavelengths we interrogate, so we list the values derived for rats as upper or lower limits.
| Atmosphere | Time | Human | E. Coli | Rat | D. Rad. |
| Modern | |||||
| d | |||||
| Proterozoic | |||||
| d | |||||
| Archean | |||||
| d | |||||
In making broad conclusions about the impact of AGN on life across a galaxy, we are assuming Sunlike stars with Earthlike planets (with a corresponding likelihood of hosting life) are evenly distributed throughout each galaxy. We have included all species for all atmosphere types for consistency, but it should be noted that in Earth’s history, only monocellular species existed during the Archean period (Lepot, 2020), and species as complex as rats or humans only arose during the Modern period.
While significant radial distances from the galactic center are in danger during Eddington-limited accretion in M87 before and after atmospheric evolution, particularly for the Proterozoic and Archean atmospheres, the corresponding stellar populations are still very small (see Table 4). Even the maximum possible radius of danger listed— which is near , for humans under the Archean atmosphere before atmospheric evolution— accounts for less than half of the total stellar population. In spite of this large elliptical galaxy having a more centrally peaked stellar population as compared to spiral galaxies, its enormous size still means less than half of its total stars are contained in the inner regions ( from the center), so the majority of potential planetary systems in the galaxy are always safe from this radiation.
The decrease in danger to species on planetary surfaces is substantial under the Modern and Proterozoic atmospheres. For the Modern atmosphere, the fraction of the stellar population which would have its planets affected by dangerous radiation levels before atmospheric evolution is up to times greater than after atmospheric evolution. For Proterozoic, the population affected before atmospheric evolution is up to times than after. The changes in the Archean atmosphere are more subtle, but there is still a small decrease in the percentage of potential planets experiencing dangerous levels of UV flux on their surfaces.
In the Milky Way bulge, we observe that the radii of danger during Eddington-limited accretion are mostly insignificant compared to the extent of the bulge itself (around , per Sofue et al., 2009), but this still accounts for percentages of the stellar population in the bulge comparable the same scenario in M87 (see Table 5). If so little of the bulge is affected, assuming zero attenuation by the ISM, then the vast majority of the stellar population in the disk, which contains the majority of its stars within a radius of roughly but has a full extent out to (Sofue et al., 2009), as well as a substantial ISM, will be unaffected. We also see a similar result to M87, where there are substantial decreases in the percent of planets receiving dangerous surface flux after atmospheric evolution.
| Species | Human | E. Coli | Rat | D. Radiodurans | ||||||
| Atmosphere | Time | Edd. Ratio | Distance (pc) | Population | Dist. | Pop. | Dist. | Pop. | Dist. | Pop. |
| Modern | ||||||||||
| d | ||||||||||
| Proterozoic | ||||||||||
| d | ||||||||||
| Archean | ||||||||||
| d | ||||||||||
| Species | Human | E. Coli | Rat | D. Radiodurans | ||||||
| Atmosphere | Time | Edd. Ratio | Distance (pc) | Population | Dist. | Pop. | Dist. | Pop. | Dist. | Pop. |
| Modern | ||||||||||
| d | ||||||||||
| Proterozoic | ||||||||||
| d | ||||||||||
| Archean | ||||||||||
| d | ||||||||||
The red nugget relic galaxies show an even more centrally peaked stellar population than the large elliptical M87. While the physical regions of the galaxy experiencing potentially dangerous radiation in NGC 1277 during Eddington-limited accretion are similar in size to those in M87, since both have SMBH masses on the order of , we see that the corresponding percentage of stars affected is much higher in NGC 1277 than in M87. In particular, for several species and Eddington ratios under an Archean atmosphere we see that the majority of stars in the galaxy are affected, and there is only a slight decrease in danger to species after atmospheric evolution, as is consistent with our results for the Milky Way and M87. This suggests that species in earlier eras of the Universe, whose galaxies may have looked more like these relics (e.g. van Dokkum et al., 2010; Barro et al., 2013; van der Wel et al., 2014), could have been in significantly more danger from UV radiation from AGN than species in galaxies we typically see today. Depending on the shielding properties of individual planetary atmospheres, even worlds at the furthest edge of the galaxy could still be affected. This may have impacted the formation or continuation of existing life in the inner regions of red nugget galaxies for significant parts of their history.
| Species | Human | E. Coli | Rat | D. Radiodurans | ||||||
| Atmosphere | Time | Edd. Ratio | Distance (pc) | Population | Dist. | Pop. | Dist. | Pop. | Dist. | Pop. |
| Modern | ||||||||||
| d | ||||||||||
| Proterozoic | ||||||||||
| d | ||||||||||
| Archean | ||||||||||
| d | ||||||||||
3.3 Discussion
Overall, these results suggest that in atmospheres with initial oxygen surface mixing ratio , AGN radiation would generate an increase in protection against UV radiation on the planetary surface due to the development of a thicker ozone layer. This evolution is more dramatic when the AGN flux received is higher— i.e. for worlds nearer to the galactic center, or when the AGN is radiating at a higher Eddington ratio. In all cases, the net level of dangerous UV radiation on the surface is less than or comparable to the No AGN/baseline conditions. However, if the level of oxygen in the initial atmosphere is not adequate, as with the Archean, there is virtually no ozone evolution as a result of AGN flux, and all of the excess flux from the AGN goes directly to the planetary surface. Our model is also cloud-free, and the clouded areas in simulations such as those of Ridgway et al. (2023) experienced a substantial increase in UV protection on the planetary surface, so it is possible that with the presence of clouds the protection from UV radiation could be heightened even further.
Planets in the innermost regions of the galaxy with atmospheres like the Modern and Proterozoic types would gain the most protection. This means we can plausibly envision a scenario where we see a “ring” of danger about the galactic center, i.e. there may be some “goldilocks zone” near the AGN where AGN radiation has net neutral or positive effects for habitability via production of ozone and increased protection on the surface from UV radiation, and a zone of danger outside of that. This is an interesting question to explore in future work.
Our work generally supports the Gaia hypothesis, where the development of life on the planet (and resulting oxygenation of the atmosphere) affects the environment in such a way that it has more favorable conditions to that life’s survival (e.g. Lovelock & Margulis, 1974; Alcabes et al., 2020; Nicholson & Mayne, 2023). In our Modern and Proterozoic models (which correspond to epochs on Earth with more complex life than during the Archean), not only is the atmosphere able to recover its original surface flux conditions after being perturbed by radiation from an AGN, but the atmosphere now tends towards becoming even more resistant to future UV irradiating events after the perturbation than it was originally, as is demonstrated in Figure 5. Specifically, our results exhibit a “Gaian bottleneck” phenomenon, where life is very vulnerable to potential extinction events before it has substantially altered its planetary atmosphere towards more suitable conditions for itself, and after that point is invulnerable to similar potential extinction events (Nicholson et al., 2018).
4 Conclusion
We have studied the impact of UV radation from an AGN on the surface habitability of planets and on their atmospheric composition. We find that for galaxies similar to M87 and the Milky Way, only the innermost regions of the galaxy are dramatically affected by high UV radiation from an AGN, and even then the affected volume typically contains a low percentage of the galaxy’s overall stellar population. This is the case even in massive ellipticals such as M87, which have been proposed as potential candidates to be sterilized by AGN radiation in previous works due to their more centrally peaked stellar population density (Whitmire, 2020). In spiral galaxies such as the Milky Way, the level of danger is even lower, seeing as only the bulge population is affected, even when we completely disregard attenuation by the ISM. In the even more centrally-peaked populations of the red nugget relic galaxies, AGN radiation can affect a larger percentage of the overall potential planetary systems— potentially even the majority of planetary systems in the galaxy, depending on the atmospheric oxygen levels of individual planets. This indicates that galaxies being sterilized by AGN radiation could have been a more important phenomenon in the early Universe than it is in the typical present-day galaxies we considered (M87 and the Milky Way).
We find that the level of danger on individual planetary surfaces is highly dependent on the atmospheric conditions, particularly the level of oxygen. For planets with substantial atmospheric oxygen (mixing ratio greater than roughly ), AGN radiation could have a neutral or positive effect on habitability in the galaxy rather than discourage it, particularly in the inner regions of the galaxy. However on planets with lower atmospheric oxygen, no ozone layer can develop and the level of danger remains fairly consistent over time. A runaway greenhouse effect is predicted to occur in the two highest flux cases we model, which could potentially lead to a net detriment to habitability on planets with oxygenated atmospheres receiving high levels of flux from an AGN.
Working out the nuances of where this increased-habitability effect eventually gives way to a runaway greenhouse, and what percentages of a stellar population may benefit from or be harmed by these effects, remains another interesting question to explore in the future. One exciting possibility for future work is to include UV radiation from an AGN in a 3D climate simulation, which would be equipped to model spatial and climate effects on exoplanets that are not possible in a 1D simulation, and— importantly for our results here— to model a runaway greenhouse scenario (e.g. Mayne et al., 2014). These simulations would facilitate an exploration of the potential secondary dangers to habitability that result from the AGN radiation.
Acknowledgements
We thank Jonathan H. Cohn for assistance with selecting the red nugget relic galaxy sample. R.C.H. is grateful for support from NASA through Astrophysics Data Analysis Program grant 80NSSC23K0485. N.J.M. gratefully acknowledges funding from a Leverhulme Trust Research Project Grant [RPG-2020-82]. This work was partly supported by a Science and Technology Facilities Council Consolidated Grant [ST/R000395/1]. This work was also supported by a UKRI Future Leaders Fellowship [grant number MR/T040866/1].
References
- Alcabes et al. (2020) Alcabes, O. D. N., Olson, S., & Abbot, D. S. 2020, MNRAS, 492, 2572, doi: 10.1093/mnras/staa055
- Amaro-Seoane & Chen (2019) Amaro-Seoane, P., & Chen, X. 2019, J. Cosmology Astropart. Phys, 2019, 056, doi: 10.1088/1475-7516/2019/12/056
- Aoki et al. (2011) Aoki, K., Nakanishi-Ueda, T., Tsuji, M., et al. 2011, The Showa University Journal of Medical Sciences, 23, 1, doi: 10.15369/sujms.23.1
- Astropy Collaboration et al. (2018) Astropy Collaboration, Price-Whelan, A. M., Sipőcz, B. M., et al. 2018, AJ, 156, 123, doi: 10.3847/1538-3881/aabc4f
- Balbi & Tombesi (2017) Balbi, A., & Tombesi, F. 2017, Scientific Reports, 7, 16626, doi: 10.1038/s41598-017-16110-0
- Barro et al. (2013) Barro, G., Faber, S. M., Pérez-González, P. G., et al. 2013, ApJ, 765, 104, doi: 10.1088/0004-637X/765/2/104
- Bekker et al. (2004) Bekker, A., Holland, H. D., Wang, P. L., et al. 2004, Nature, 427, 117, doi: 10.1038/nature02260
- Bland-Hawthorn et al. (2013) Bland-Hawthorn, J., Maloney, P. R., Sutherland, R. S., & Madsen, G. J. 2013, ApJ, 778, 58, doi: 10.1088/0004-637X/778/1/58
- Chapman (1930) Chapman, S. 1930, The London, Edinburgh, and Dublin Philosophical Magazine and Journal of Science, 10, 369, doi: 10.1080/14786443009461588
- Chen et al. (2018) Chen, H., Forbes, J. C., & Loeb, A. 2018, ApJ, 855, L1, doi: 10.3847/2041-8213/aaab46
- Chen et al. (2021) Chen, H., Zhan, Z., Youngblood, A., et al. 2021, Nature Astronomy, 5, 298, doi: 10.1038/s41550-020-01264-1
- Chen & Amaro-Seoane (2015) Chen, X., & Amaro-Seoane, P. 2015, Classical and Quantum Gravity, 32, 064001, doi: 10.1088/0264-9381/32/6/064001
- Claire et al. (2012) Claire, M. W., Sheets, J., Cohen, M., et al. 2012, ApJ, 757, 95, doi: 10.1088/0004-637X/757/1/95
- Cohn et al. (2021) Cohn, J. H., Walsh, J. L., Boizelle, B. D., et al. 2021, ApJ, 919, 77, doi: 10.3847/1538-4357/ac0f78
- Cohn et al. (2023) Cohn, J. H., Curliss, M., Walsh, J. L., et al. 2023, ApJ, 958, 186, doi: 10.3847/1538-4357/ad029d
- Cohn et al. (2024) —. 2024, ApJ, 975, 179, doi: 10.3847/1538-4357/ad7bb0
- Daines & Lenton (2016) Daines, S. J., & Lenton, T. M. 2016, Earth and Planetary Science Letters, 434, 42, doi: 10.1016/j.epsl.2015.11.021
- D’Orazio (2013) D’Orazio, J., J. S. A. A. S. T. 2013, International Journal of Molecular Sciences, 14, 12222, doi: 10.3390/ijms140612222
- Eager-Nash et al. (2024) Eager-Nash, J. K., Daines, S. J., McDermott, J. W., et al. 2024, Monthly Notices of the Royal Astronomical Society, 531, 468, doi: 10.1093/mnras/stae1142
- Estrela et al. (2020) Estrela, R., Palit, S., & Valio, A. 2020, Astrobiology, 20, 1465, doi: 10.1089/ast.2019.2126
- Fan et al. (2008) Fan, L., Lapi, A., De Zotti, G., & Danese, L. 2008, ApJ, 689, L101, doi: 10.1086/595784
- Forbes & Loeb (2018) Forbes, J. C., & Loeb, A. 2018, MNRAS, 479, 171, doi: 10.1093/mnras/sty1433
- Gebauer et al. (2017) Gebauer, S., Grenfell, J. L., Stock, J. W., et al. 2017, Astrobiology, 17, 27, doi: 10.1089/ast.2015.1384
- Gebhardt & Thomas (2009) Gebhardt, K., & Thomas, J. 2009, ApJ, 700, 1690, doi: 10.1088/0004-637X/700/2/1690
- Gregory et al. (2021) Gregory, B. S., Claire, M. W., & Rugheimer, S. 2021, Earth and Planetary Science Letters, 561, 116818, doi: 10.1016/j.epsl.2021.116818
- Harris et al. (2020) Harris, C. R., Millman, K. J., van der Walt, S. J., et al. 2020, Nature, 585, 357, doi: 10.1038/s41586-020-2649-2
- Hopkins et al. (2006) Hopkins, P. F., Hernquist, L., Cox, T. J., et al. 2006, ApJS, 163, 1, doi: 10.1086/499298
- Ishibashi (2024) Ishibashi, W. 2024, MNRAS, 533, 455, doi: 10.1093/mnras/stae1840
- Krisko & Radman (2010) Krisko, A., & Radman, M. 2010, Proceedings of the National Academy of Sciences of the Unites States of America, 107, 14373–14377, doi: 10.1073/pnas.1009312107
- Leconte et al. (2013) Leconte, J., Forget, F., Charnay, B., Wordsworth, R., & Pottier, A. 2013, Nature, 504, 268, doi: 10.1038/nature12827
- Lepot (2020) Lepot, K. 2020, Earth-Science Reviews, 209, doi: 10.1016/j.earscirev.2020.103296
- Lingam et al. (2019) Lingam, M., Ginsburg, I., & Bialy, S. 2019, ApJ, 877, 62, doi: 10.3847/1538-4357/ab1b2f
- Lovelock & Margulis (1974) Lovelock, J. E., & Margulis, L. 1974, Tellus, 26, 2, doi: 10.1111/j.2153-3490.1974.tb01946.x10.3402/tellusa.v26i1-2.9731
- Luger et al. (2015) Luger, R., Barnes, R., Lopez, E., et al. 2015, Astrobiology, 15, 57, doi: 10.1089/ast.2014.1215
- Masuma et al. (2013) Masuma, R., Kashima, S., Kurasaki, M., & Okuno, T. 2013, Journal of Photochemistry and Photobiology B: Biology, 125, 202, doi: https://doi.org/10.1016/j.jphotobiol.2013.06.003
- Mayne et al. (2014) Mayne, N. J., Baraffe, I., Acreman, D. M., et al. 2014, A&A, 561, A1, doi: 10.1051/0004-6361/201322174
- Mezger et al. (1996) Mezger, P. G., Duschl, W. J., & Zylka, R. 1996, A&A Rev., 7, 289, doi: 10.1007/s001590050007
- Nicholson & Mayne (2023) Nicholson, A. E., & Mayne, N. J. 2023, MNRAS, 521, 5139, doi: 10.1093/mnras/stad848
- Nicholson et al. (2018) Nicholson, A. E., Wilkinson, D. M., Williams, H. T. P., & Lenton, T. M. 2018, MNRAS, 477, 727, doi: 10.1093/mnras/sty658
- O’Malley-James & Kaltenegger (2019) O’Malley-James, J. T., & Kaltenegger, L. 2019, MNRAS, 485, 5598, doi: 10.1093/mnras/stz724
- Pacetti et al. (2020) Pacetti, E., Balbi, A., Lingam, M., Tombesi, F., & Perlman, E. 2020, MNRAS, 498, 3153, doi: 10.1093/mnras/staa2535
- Prieto et al. (2016) Prieto, M. A., Fernández-Ontiveros, J. A., Markoff, S., Espada, D., & González-Martín, O. 2016, MNRAS, 457, 3801, doi: 10.1093/mnras/stw166
- Ranjan et al. (2017) Ranjan, S., Wordsworth, R. D., & Sasselov, D. D. 2017, in LPI Contributions, Vol. 2042, Habitable Worlds 2017: A System Science Workshop, 4008
- Richards et al. (2006) Richards, G. T., Lacy, M., Storrie-Lombardi, L. J., et al. 2006, The Astrophysical Journal Supplement Series, 166, 470, doi: 10.1086/506525
- Ridgway et al. (2023) Ridgway, R. J., Zamyatina, M., Mayne, N. J., et al. 2023, MNRAS, 518, 2472, doi: 10.1093/mnras/stac3105
- Rimmer et al. (2018) Rimmer, P. B., Xu, J., Thompson, S. J., et al. 2018, Science Advances, 4, eaar3302, doi: 10.1126/sciadv.aar3302
- Schawinski et al. (2015) Schawinski, K., Koss, M., Berney, S., & Sartori, L. F. 2015, MNRAS, 451, 2517, doi: 10.1093/mnras/stv1136
- Segura et al. (2010) Segura, A., Walkowicz, L. M., Meadows, V., Kasting, J., & Hawley, S. 2010, Astrobiology, 10, 751, doi: 10.1089/ast.2009.0376
- Sofue et al. (2009) Sofue, Y., Honma, M., & Omodaka, T. 2009, Publications of the Astronomical Society of Japan, 61, 227, doi: 10.1093/pasj/61.2.227
- Su et al. (2010) Su, M., Slatyer, T. R., & Finkbeiner, D. P. 2010, ApJ, 724, 1044, doi: 10.1088/0004-637X/724/2/1044
- Thomas et al. (2015) Thomas, B. C., Neale, P. J., & Snyder, Brock R., I. 2015, Astrobiology, 15, 207, doi: 10.1089/ast.2014.1224
- Tian (2009) Tian, F. 2009, ApJ, 703, 905, doi: 10.1088/0004-637X/703/1/905
- van der Wel et al. (2014) van der Wel, A., Franx, M., van Dokkum, P. G., et al. 2014, ApJ, 788, 28, doi: 10.1088/0004-637X/788/1/28
- van Dokkum et al. (2010) van Dokkum, P. G., Whitaker, K. E., Brammer, G., et al. 2010, ApJ, 709, 1018, doi: 10.1088/0004-637X/709/2/1018
- Virtanen et al. (2020) Virtanen, P., Gommers, R., Oliphant, T. E., et al. 2020, Nature Methods, 17, 261, doi: 10.1038/s41592-019-0686-2
- Volonteri (2010) Volonteri, M. 2010, A&A Rev., 18, 279, doi: 10.1007/s00159-010-0029-x
- Walsh et al. (2015) Walsh, J. L., van den Bosch, R. C. E., Gebhardt, K., et al. 2015, ApJ, 808, 183, doi: 10.1088/0004-637X/808/2/183
- Walsh et al. (2017) —. 2017, ApJ, 835, 208, doi: 10.3847/1538-4357/835/2/208
- Walsh et al. (2016) —. 2016, ApJ, 817, 2, doi: 10.3847/0004-637X/817/1/2
- Whitmire (2020) Whitmire, D. P. 2020, MNRAS, 494, 3048, doi: 10.1093/mnras/staa957
- Wisłocka et al. (2019) Wisłocka, A. M., Kovačević, A. B., & Balbi, A. 2019, A&A, 624, A71, doi: 10.1051/0004-6361/201834655
- Wyse et al. (1997) Wyse, R. F. G., Gilmore, G., & Franx, M. 1997, ARA&A, 35, 637, doi: 10.1146/annurev.astro.35.1.637
- Yıldırım et al. (2017) Yıldırım, A., van den Bosch, R. C. E., van de Ven, G., et al. 2017, MNRAS, 468, 4216, doi: 10.1093/mnras/stx732
- Zhang & Guo (2020) Zhang, R., & Guo, F. 2020, ApJ, 894, 117, doi: 10.3847/1538-4357/ab8bd0
Appendix A Additional Figures
A.1 Visual Representation of Fluxes Received at Various Distances from an AGN
A visual representation of the information presented in Table 1 is shown in Figure 7. This figure also contains a visual representation of the equivalent table (Table 7, shown in Appendix Section B) for the red nugget relic galaxy sample.
A.2 Extrapolation of Species’ UV Flux Tolerance
The original data on species UV flux tolerance from Aoki et al. (2011), Masuma et al. (2013), and Krisko & Radman (2010) is shown in the left panel of Figure 8. The extrapolated limits of UV tolerance are shown in the right panel of Figure 8.
Appendix B Red Nugget Relics
The correspondence of scaled total AGN fluxes used in our simulations to physical situations for the remaining red nugget galaxies are shown in Table 7, analogous to Table 1. A visual representation of the information in Table 7 is shown in Figure 7. Tables 8, 9, 10, 11, and 12 represent danger to species before and after the atmosphere responds to the radiation, for NGC 384, PGC 11179, UGC 2698, NGC 1271, and Mrk 1216, respectively. These are analogous to Tables 4, 5, and 6; they also correspond to the dangerous bolometric AGN fluxes listed for each species and atmospheric composition in Table 3.
| Flux () = | ||||||||
| Galaxy | Edd. Ratio | Distance (pc) | ||||||
| NGC 384 | ||||||||
| PGC 11179 | ||||||||
| UGC 2698 | ||||||||
| NGC 1271 | ||||||||
| Mrk 1216 | ||||||||
| Species | Human | E. Coli | Rat | D. Radiodurans | ||||||
| Atmosphere | Time | Edd. Ratio | Distance (pc) | Population | Dist. | Pop. | Dist. | Pop. | Dist. | Pop. |
| Modern | ||||||||||
| d | ||||||||||
| Proterozoic | ||||||||||
| d | ||||||||||
| Archean | ||||||||||
| d | ||||||||||
| Species | Human | E. Coli | Rat | D. Radiodurans | ||||||
| Atmosphere | Time | Edd. Ratio | Distance (pc) | Population | Dist. | Pop. | Dist. | Pop. | Dist. | Pop. |
| Modern | ||||||||||
| d | ||||||||||
| Proterozoic | ||||||||||
| d | ||||||||||
| Archean | ||||||||||
| d | ||||||||||
| Species | Human | E. Coli | Rat | D. Radiodurans | ||||||
| Atmosphere | Time | Edd. Ratio | Distance (pc) | Population | Dist. | Pop. | Dist. | Pop. | Dist. | Pop. |
| Modern | ||||||||||
| d | ||||||||||
| Proterozoic | ||||||||||
| d | ||||||||||
| Archean | ||||||||||
| d | ||||||||||
| Species | Human | E. Coli | Rat | D. Radiodurans | ||||||
| Atmosphere | Time | Edd. Ratio | Distance (pc) | Population | Dist. | Pop. | Dist. | Pop. | Dist. | Pop. |
| Modern | ||||||||||
| d | ||||||||||
| Proterozoic | ||||||||||
| d | ||||||||||
| Archean | ||||||||||
| d | ||||||||||
| Species | Human | E. Coli | Rat | D. Radiodurans | ||||||
| Atmosphere | Time | Edd. Ratio | Distance (pc) | Population | Dist. | Pop. | Dist. | Pop. | Dist. | Pop. |
| Modern | ||||||||||
| d | ||||||||||
| Proterozoic | ||||||||||
| d | ||||||||||
| Archean | ||||||||||
| d | ||||||||||