Forestalled Phase Separation as the Precursor to Stripe Order
Abstract
Stripe order is a prominent feature in the phase diagram of the high-temperature cuprate superconductors and has been confirmed as the ground state of the two-dimensional Fermi Hubbard model in certain parameter regimes. Upon increasing the temperature, stripes and the superconducting state give way to the enigmatic strange metal and pseudogap regime, whose precise nature poses long-standing, unresolved puzzles. Using modern tensor network techniques, we discover a crucial aspect of these regimes. Infinite projected entangled pair state (iPEPS) simulations in the fully two-dimensional limit reveal a maximum in the charge susceptibility at temperatures above the stripe phase. This maximum is located around hole-doping and intensifies upon cooling. Using minimally entangled typical thermal states (METTS) simulations on finite cylinders, we attribute the enhanced charge susceptibility to the formation of charge clusters, reminiscent of phase separation where the system is partitioned into hole-rich and hole-depleted regions. In contrast to genuine phase separation, the charge cluster sizes fluctuate statistically without a divergent charge susceptibility. Hence, while this precursor state features clustering of charge carriers, true phase separation is ultimately forestalled at lower temperatures by the onset of stripe order.
In the context of high- superconductors (HTSCs), phase separation refers to the segregation of a uniformly doped system into hole-rich metallic and hole-depleted antiferromagnetic regions [1, 2]. Experimental findings demonstrate that some HTSCs exhibit such charge inhomogeneities. These include early discoveries of phase separation in \ceLa2CuO_4+δ by Grenier et al. [3] and the subsequent identification of stripe order, i.e., intertwined charge and spin order, in the copper oxide \ceLa_1.6-xNd_0.4Sr_xCuO_4 (with ) by Tranquada et al. in 1995 [4]. Beyond cuprate superconductors [5, 6, 7], phase separation has been found recently in materials like iron-based chalcogenides [8, 9], doped manganites [10], and nickelates [11]; see Ref. [12] for a recent review. Prior to these discoveries, research on phase separation in cuprate superconductors has primarily focused on its role in superconductivity [1, 2]. Early mean-field theories suggest that doped charge carriers form clusters, which evolve into metallic networks that are essential for superconductivity [1, 13, 14]. The theoretical concepts of charge density waves (CDW) and stripe order in cuprates [15, 16, 17, 18] emerged alongside ideas about phase separation and electronic inhomogeneities in these materials [19]. This includes the work of Emery and Kivelson on frustrated phase separation [20], where it was argued that long-range Coulomb repulsion might play a key role in breaking up macroscale phase separation into CDW-like order. Experimental discoveries of CDWs in cuprates [4] were tied into this picture. Recently, theoretical studies on phase separation have regained attention, focusing on Hubbard-Holstein and related models, which include both electron and phonon interactions [21, 22, 23].
The square lattice two-dimensional (2D) Fermi-Hubbard model (FHM) [24] stands as a fundamental model for interacting electrons on a lattice, crucial for understanding high-temperature superconductivity [25, 26, 27]. The model with nearest-neighbor (NN) hopping, is described by the Hamiltonian:
| (1) |
where represents the NN hopping amplitude and denotes the on-site Coulomb repulsion. Here, () is the creation (annihilation) operator for an electron with spin at site , and is the number operator for electrons of spin at site . The summation runs over NN sites on the square lattice. In this article, we set . The phase diagram of these models has been the subject of intense debate for decades [28, 29]. Recently, a consensus has emerged among most numerical methods that, when the model is constrained to nearest-neighbor (NN) electron hopping, the ground state for the slightly doped case is the stripe order under conditions relevant to cuprates [30, 31, 32, 33, 34, 35, 36, 37, 38]. The pseudogap and strange metal phenomena in cuprate superconductors, which emerge at higher temperatures before the stripe order and superconductivity, have spurred extensive studies on the finite-temperature behavior of the Hubbard model [39, 40, 41, 42, 43, 44]. Notable findings include a cellular dynamical mean-field theory (CDMFT) study [40], which shows that short-range spin correlations contribute to additional spectral bands, suppressing momentum-dependent spectral weight and forming the pseudogap. Recently, diagrammatic Monte Carlo simulations [44] attributed the pseudogap mainly to spin correlations, with limited influence from charge fluctuations. Another study [43] reinforced the spin origin of the pseudogap, while highlighting that charge inhomogeneities may play some role.
This work explores the parameter regimes of the Fermi-Hubbard model at finite temperatures and slight doping, specifically where the pseudogap and strange metal regimes occur. We employ state-of-the-art tensor network techniques—the minimally entangled typical thermal states (METTS)[45, 46] with matrix product states (MPS)[47, 48] ansatz, and purification [49] with infinite projected entangled pair states (iPEPS) [50, 51] ansatz. The iPEPS with purification allows us to explore infinite 2D systems effectively in the thermodynamic limit, which complements MPS with METTS, suited for studying 1D and quasi-1D systems like finite-width cylinders at lower temperatures. Our simulations reveal a novel aspect of matter in this regime: the onset of charge clustering facilitated by antiferromagnetism at intermediate temperatures, suggesting an imminent phase separation. However, phase separation is ultimately forestalled by the emergence of stripe order at lower temperatures.
To simulate the system, we initially implement the purification method [52] with fermionic iPEPS [51] following Ref. [53]. Here we use the particle-hole symmetric form of the FHM,
| (2) | |||||
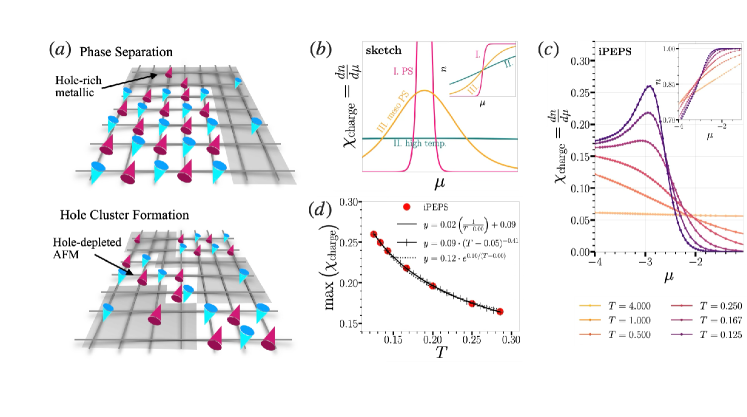
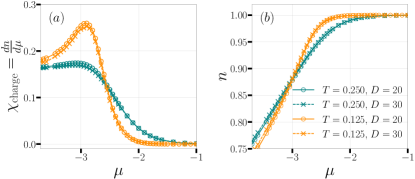
We control the filling by changing the chemical potential . In this grand-canonical formalism, the system exchanges particles with a reservoir, and the particle density adjusts to reach equilibrium, leading to a unique equilibrium density for a given chemical potential. The charge susceptibility quantifies how sensitive the particle density is to changes in the chemical potential. The sketch Fig. 1(b) illustrates three scenarios with versus plots and density versus plots (inset). Scenario I (pink curve) shows a sharp phase separation at ground state for some with a sharp discontinuity in the vs plot and a divergent peak in , suggesting enhanced susceptibility. This signature has been used to provide evidence for phase separation in iPEPS studies of fermions on square and honeycomb lattices [51, 54]. Scenario II (green curve) describes a high-temperature state with substantial thermal fluctuations that smoothes the vs curve and keeps relatively flat. There exists a scenario III (orange curve), which demonstrates a subdued phase transition at finite temperatures. Here, the vs curve exhibits a noticeable change in curvature without a discontinuous jump. The charge susceptibility in this case shows a modest peak, signifying an increased, but finite, susceptibility to variations in . We will later see that in the Hubbard model it can be caused due to statistically fluctuating hole clusters that mimic phase separation on a smaller scale without achieving full phase separation. Cartoon illustrations of Scenario I and III for the Fermi-Hubbard model are presented in Fig. 1(a), with Scenario I depicted at the top and Scenario III at the bottom. Here, Fig. 1(c) presents calculations done with iPEPS for an infinite square lattice at and shows a gradual shift from scenario II to III as we change the temperature from to . Fig. 1(d) plots the maxima of of Fig. 1(c) as a function of temperature. We tested three kinds of fit, linear with given as solid black line; a polynomial fit with given as a solid black line with plus markers and an exponential fit which goes as , where is a constant and given as a dotted line. Both the linear and polynomial fits align well with the iPEPS data, implying that may diverge at some critical temperature . This behavior is consistent with findings from dynamical cluster approximation (DCA) [55, 56] for the Hubbard model with the next-nearest neighbor coupling . It was shown there that does not diverge at finite temperatures but shows signs of divergence as . In the presence of finite , however, the Hubbard model was shown to undergo a first-order phase separation transition at finite temperatures, terminating at a second-order critical point where diverges. This critical point aligns with a quantum critical point () at , separating pseudogap and Fermi-liquid regions. Sordi et al. [57] connect this behavior to the Widom line, a line of maxima in that extends from the QCP, but mapped in our article in the vs. framework rather than across the - plane. The Widom line represents a thermodynamic crossover boundary, organizing the phase space and marking the onset of the pseudogap phase at a characteristic temperature .
Simulations employing iPEPS at finite temperature in the grand-canonical ensemble typically result in a uniform particle density across the system due to choice of a translationally invariant ansatz. While for studies done with the canonical ensemble using METTS [45, 46], fixes the total number of particles. Thereby charge inhomogenities can be readily observed. Here, we follow the methodologies outlined in Ref. [58]. Unless otherwise specified, we conducted our simulations primarily on a cylindrical lattice with length (open boundary conditions along the length) and width (periodic boundary conditions along the width). Using the same on-site Coulomb repulsion as in the previous iPEPS study (), we set the electron filling to . The METTS algorithm, a Markov chain Monte Carlo method, simulates thermal states via iterative imaginary-time evolution of product states [45, 46]. The evolution process involves creating METTS snapshots ,
| (3) |
where denotes the basis of product states, , and the inverse temperature. By averaging over the individual observables calculated via snapshot wavefunctions , we estimate the thermal observables:
| (4) |
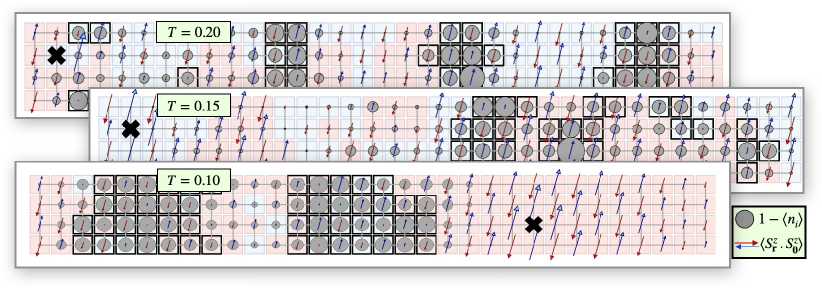
where is the partition function given by . Hole densities and spin correlations can be calculated directly from these snapshots. In representative typical snapshots in Fig. 2, we observe at (top panel), (middle panel) and (bottom panel), large hole clusters and pronounced antiferromagnetic domains, indicative of strong hole clustering. Hole densities at a lattice site are calculated as , where . Spin correlations are illustrated by red and blue arrows of length proportional to . To represent staggered domains, the squares denoting lattice sites are color-coded; regions with staggered correlations are shaded in one color, with adjacent staggered domains differing by a -phase shift shown in the alternate color (either red or blue). As we examine the typical snapshots, it becomes evident that, as thermal fluctuations diminish with decreasing temperature, the system increasingly favors the formation of more extensive antiferromagnetic domains. These strong fluctuations reflect the system’s proximity to an instability leading to stripe formation. For clustering in lattices of larger width, see Fig. 7 of appendix B. However, at , we observe regular charge density wave patterns with a wavelength of lattice sites (not shown here; see Fig. 8 of appendix B or references [58, 59] for a typical snapshot showing stripe order) instead of a fully formed phase separation.
To capture the clustering behavior, we employ an algorithm to statistically analyze the hole clusters in the METTS snapshots. Let’s define the set of all lattice sites in a METTS snapshot as . Each snapshot is scrutinized to identify sites where the local hole density exceeds a specified threshold. This threshold is defined as
| (5) |
where is the mean hole density, is the standard deviation of the hole density distribution within a METTS snapshot ,
| (6) |
where is the total number of lattice sites. Here, is a sensitivity parameter set to to balance between detecting meaningful clusters and avoiding sensitivity to individual site variations. We refer to appendix C to check the robustness of clustering analysis against other values of . Next we examine the hole-density of one given METTS snapshot to identify the subset of sites where the hole density exceeds the threshold :
| (7) |
We partition into disjoint clusters , where each cluster is a maximal connected component of sites satisfying for all :
| (8) |
Each cluster, indexed by , can be associated with two quantities: the cluster size , representing the number of sites within the cluster, and the cluster weight , representing the total hole density of the cluster. From each snapshot, we output a set of pairs for all clusters identified within that snapshot. To obtain a comprehensive view of the clustering structure across the entire ensemble, we aggregate values from all METTS snapshots generated via the sampling process. From this aggregate, we define the normalized frequency as
| (9) |
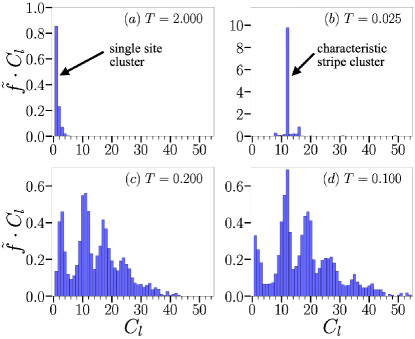
where the numerator sums the weights of all clusters of size across all snapshots, and the denominator is the total weight of all clusters extracted from all snapshots. This quantity thus represents the relative prevalence of clusters of size , averaged over the METTS ensemble. These frequency distributions multiplied by the cluster sizes , plotted in Fig. 3, highlight interesting features. At higher temperatures (Fig. 3(a)), almost no large clusters are formed due to enhanced thermal fluctuations; a single-site cluster, i.e., , is the most dominant. At lower temperatures, (Fig. 3(c)) and (Fig. 3(d)), larger clusters dominate showing a broad spread in cluster sizes. At very low temperatures , is the dominant one, corresponding to charge density wave order.
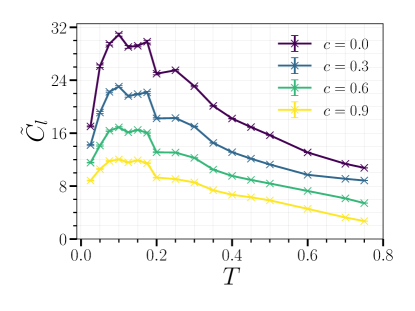
We further calculate the mean cluster size , weighted by the normalized frequencies , as
and plot it as a function of temperature in Fig. 4(a). Additionally, we compute the magnetic structure factor, defined as
| (10) |
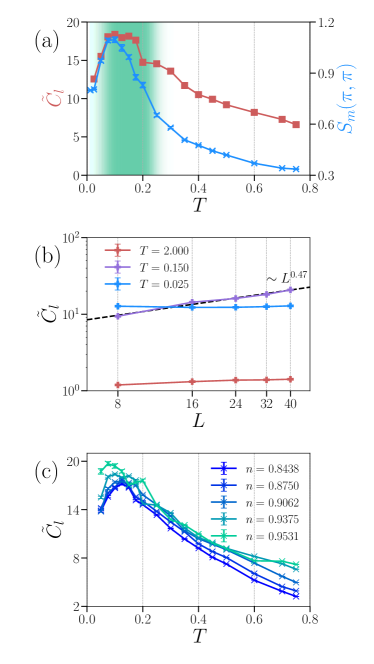
Here, denotes the coordinate of the -th lattice point, and denotes the quasi-momentum in reciprocal space. In particular, we focus on the spin structure factor at , which denotes antiferromagnetic correlations. , alongside at in Fig. 4(a), reveals that the peaks in cluster sizes and antiferromagnetic ordering at intermediate temperatures are approximately correlated. This correlation indicates that large hole clustering is accompanied by antiferromagnetic domains which enhances the magnetic structure factor at , a behavior characteristic of phase separation in the Fermi-Hubbard model.
In Fig. 4(b), we show the mean cluster sizes for cylindrical lattice sizes of different lengths and , and same width for temperatures and . While for which is in the charge clustering regime we see a commensurate dependence on size, at high () and very low temperatures (), there is almost no size-dependence. For the latter, is locked at a value of around , characterizing the stripe cluster size. In Fig. 4(c), we show that this typical maxima in clustering behavior at intermediate temperatures range across a wide range of fillings . We applied a bootstrap analysis to get an estimate of the error in case of the mean cluster sizes.
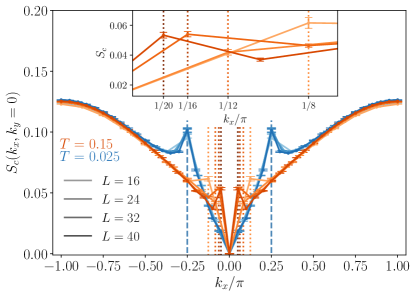
Finally, we explore a more conventional approach to detecting phase separation. In Fig. 5, we present the charge structure factor,
| (11) |
for a filling of , considering various system sizes of lengths , and , with a fixed width . Note that, since we are working in the canonical ensemble, , because there is no fluctuation in total density at zero momentum. At a temperature , an inner peak is present at the lowest momentum mode resolved by the lattice, which shifts inward as the system size increases. Physically, this inward shift with system size indicates a build-up of long-wavelength density fluctuations, characteristic of phase separation. This trend is highlighted by dotted orange lines marking peak positions in both the main plot and inset. The inset further amplifies the inner peaks corresponding to different system sizes, using darker shades to represent larger sizes. As the temperature decreases to , the system transitions into a stripe phase, characterized by a pronounced peak at (illustrated by a blue dashed line) that remains consistent across different system sizes.
Discussion
In this study, we employed advanced tensor network simulations to explore the thermal phase diagram of the two-dimensional Fermi-Hubbard model, focusing on regimes where pseudogap and strange metallic behavior are anticipated. Our simulation results reveal an intriguing progression: at intermediate temperatures, the system shows a propensity for phase separation, marked by hole clustering and the formation of antiferromagnetic (AFM) domains. However, as temperature decreases, these clusters are prevented from merging into a fully phase-separated state. Instead, stripe order emerges, suggesting that fluctuations linked to an incipient stripe order might have been steering the system’s behavior at elevated temperatures—an instability that becomes increasingly prominent as temperatures drop. The rise in charge susceptibility observed in our iPEPS simulations, which intensifies with decreasing temperature, lends further support to this interpretation. The onset of antiferromagnetic correlations have previously been tied to the formation of a pseudogap in numerous works [60, 61, 58, 59, 43, 44]. Now, we discover that, additionally, the onset of antiferromagnetic correlations favors the formation of hole clusters as shown in Fig. 4. The clustering also clearly manifests itself in susceptibility towards phase separation, where the charge structure factor develops a small peak at the smallest momentum resolved by the lattice in the canonical ensemble, cf. Fig. 5. Intuitively, antiferromagnetic correlations can be maximized whenever exactly two electrons reside on nearest-neighbor sites, and hence, strong antiferromagnetic correlations favor half-filled regions. Thus, an attraction between electrons mediated by antiferromagnetic correlations depletes other regions of the system, which constitute the hole-rich clusters. Notably, experimental techniques such as resonant inelastic X-ray scattering (RIXS) observed high-temperature precursor charge density wave (PCDW) fluctuations and stripe correlations in cuprate superconductors, supporting the idea that charge fluctuations play a significant role in the pseudogap regime [62, 63, 64, 65]. These findings motivate us to propose a connection between our observations and the pseudogap phenomenon in high-temperature cuprate superconductors. Within the AFM domains, strong spin correlations and electron localization introduce a gap in the electronic spectrum, leading to insulating behavior. Adjacent hole-rich metallic regions introduce low-energy states that partially fill this gap, suppressing the density of states at the Fermi level without creating a full gap—an iconic feature of the pseudogap phase. While an exhaustive exploration of this phenomenon is outside the scope of the current study, our results suggest that the interaction between AFM ordering and metallicity arising from hole clustering could play a pivotal role in the development of the pseudogap. In the - model, when the exchange coupling , the ground state is known to phase-separate [66, 67]. Recent studies done in this regime observed that under long time evolution, the charge degrees of freedom remain completely frozen [68]. This could be related to the large resistivity encountered in cuprates in the pseudogap, strange and bad metal regimes.
Methods
Solving the FHM presents substantial challenges due to its strongly interacting nature; analytical solutions are rare and limited to specific cases [69, 70]. Even the most advanced numerical methods often face difficulties in accurately solving the model without biases from approximation schemes [71]. For finite temperature, the minimally entangled typical thermal states (METTS) algorithm, when applied to MPS [45, 46] offers significant advantages over traditional methods like purification [49], notably in representing thermal states with lower bond dimensions. METTS has facilitated insightful studies into the thermal phase diagram of the square-lattice FHM including the study of the pseudogap regime and the stripe phase [58]. Similarly, purification techniques using iPEPS [72, 73, 74, 75] have explored the phase diagram from high to intermediate temperatures, revealing significant distortions in antiferromagnetism upon doping [53]. Additionally, alternative approaches for finite temperature simulations using tensor networks for the Hubbard model include the exponential thermal tensor renormalization group (XTRG) [76], tangent space tensor renormalization group (tanTRG) [77], and METTS applied to PEPS [78]. A recent study using diagrammatic Monte Carlo [79] was able to achieve temperatures as low as and up to for arbitrary large lattices, providing insights into momentum-resolved spin and charge susceptibilities. See Ref. [80] for a detailed list of methods approaching the FHM at finite temperatures. Complementing these computational breakthroughs, experimental techniques with ultracold atoms have similarly advanced, enabling precise simulation and investigation of many-body physics that echo the complex interactions found in the Hubbard model [81, 82, 83, 84, 85, 86, 87]. These experiments confine systems with hundreds of fermions and can reach temperatures as low as of the hopping energy, hosting non-trivial charge and spin correlations [88, 89, 90, 91, 92, 93].
In this work, we utilize two tensor network (TN) methods to simulate the FHM, focusing on approaches that are constrained by entanglement entropy, typically characterized by the bond dimension . The first method uses the infinite projected entangled pair states (iPEPS) ansatz, using the neighborhood tensor update (NTU) algorithm [94, 95, 96], as described in Ref. [53]. The iPEPS operates in the thermodynamic limit, effectively eliminating finite-size effects. We focus on local updates for iPEPS optimization, called the neighborhood tensor update (NTU) [96]. This method is computationally more efficient and numerically stable compared to global updates like the Full Update. Additionally, NTU provides greater accuracy than the Simple Update [97] which does mean-field-like approximations. The iPEPS approach we used simulates thermal states using the purification technique, which is broadly favored for finite-temperature simulations. In iPEPS, the purification of a thermal state is performed using a tensor network in which the thermal density matrix , representing the system at inverse temperature , is encoded as a pure state in an enlarged Hilbert space that includes both physical and ancillary degrees of freedom (d.o.f.). The process begins by representing the infinite temperature state as a product of maximally entangled states between corresponding local physical and ancillary d.o.f. This state serves as the starting point for imaginary-time evolution, implemented through a sequence of tensor network operations that progressively cool the system to the desired temperature. The thermal density matrix is then obtained by tracing out the ancillary degrees of freedom from the pure state representation. Mathematically, this is described by the equation:
where is the state obtained after applying the imaginary-time evolution operator to the initial state, and denotes the partial trace over the ancillary degrees of freedom. In our simulations, we enforced symmetry, which conserves particle number, using the YASTN package [98], optimized for fermionic and symmetric PEPS. This symmetry conservation helps to reduce computational overhead. With this approach, we could go up to bond dimensions and were able to explore temperatures as low as . However, the rapid growth of the bond dimension due to the entanglement introduced by purification limits iPEPS’s ability to access very low temperatures without significant computational cost.
The second method we employed is the minimally entangled typical thermal states (METTS) algorithm, which uses matrix product states (MPS) as the variational ansatz. METTS is especially effective in one- dimensional cylindrical geometries and excels at lower temperatures. Unlike purification, METTS does not require the full representation of the thermal density matrix. Instead, METTS relies on generating a sequence of typical thermal states through a Monte Carlo sampling process. The method works by selecting a product state, evolving it in imaginary time by , and then collapsing the evolved state into a new product state using Markov chain sampling (see Eqn. 3 and Eqn. 4 of the main text). The imaginary time evolution in METTS is carried out using the time-dependent variational principle (TDVP) [99, 100], with subspace expansion [101], which helps improve the stability and accuracy of the evolution process. By avoiding the full tracking of the thermal density matrix, METTS can achieve accurate results with significantly lower bond dimensions than purification. Our METTS implementation, based on the ITensor library [102, 103], was able to reach bond dimensions up to , particularly for systems on cylinder geometries, following successful approaches from previous studies [58, 104]. Another notable advantage of METTS is its ability to provide spatially resolved data, which was key in identifying the clustering at intermediate temperatures.
Acknowledgements.
We thank Antoine Georges, George Batrouni, Salvatore Manmana, Roderich Moessner, Steve White, Luke Staszewski, Martin Ulaga, Joe H. Winter, Timon Hilker, Lode Pollet, Zhenjiu Wang, Thomas Chalopin, Immanuel Bloch, Fabian Grusdt and Annabelle Bohrdt for insightful discussions and in particular Fakher Assaad for highlighting the signatures of phase separation in the charge structure factor to us. We thank Chris Hooley for suggesting the adjective “forestalled” and further discussions. A.W. acknowledges support by the DFG through the Emmy Noether program (Grant No. 509755282). A.S. thanks Marek M. Rams and Jacek Dziarmaga for previous technical discussions on iPEPS. A.S. acknowledges support from National Science Centre (NCN), Poland under project 2019/35/B/ST3/01028, at Jagiellonian University, Kraków, where part of the work was completed.Appendix A Convergence for iPEPS
To confirm convergence with respect to bond dimension, we compare charge compressibility and electron density at bond dimensions and in Fig. 6. There is close alignment between the results for two representative temperatures and at both bond dimensions across a range of for the values of and . This suggests that increasing the bond dimension further would yield minimal differences, validating the accuracy of our compressibility and density calculations for the interesting parameter ranges.
Appendix B Additional Plots for METTS Cylinder
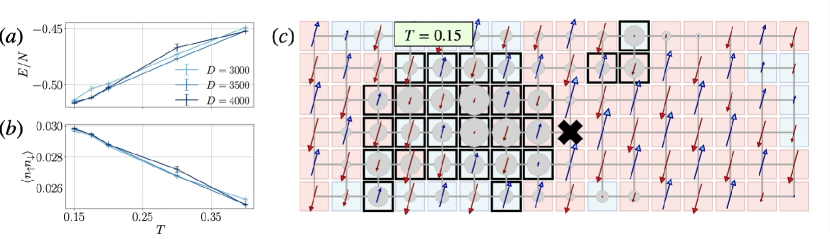
To see whether hole clustering happens for systems of larger cylinder width, we choose a cylinder of length and . Converging larger-width cylinders in MPS is challenging due to the increased entanglement entropy between the left and right halves of the system, which scales with the width. As the width grows, the number of entangled degrees of freedom increases, demanding a much higher bond dimension to faithfully capture this entanglement, leading to higher computational costs. For simulations of width , we used and to check convergence for energy per system size and average double occupancy in Fig. 7 (a) and (b) and the data seems well converged till temperature . In Fig. 7(c), we plot a random METTS snapshot at . The black-bordered squares are those which are above a certain threshold density defined in Eq. 5 in the main text, and they highlight the significant hole-clustering. We also notice the presence of antiferromagnetic domains.
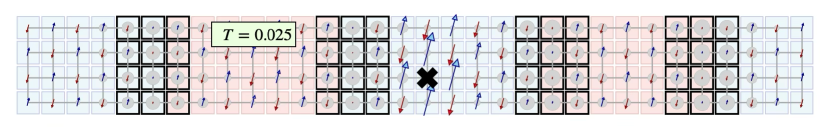
Fig. 8 depicts a typical METTS snapshot at very low temperature for a cylinder of size where stripe order has set in. They form well-formed striped clusters of size which is the dominating cluster size at low temperatures as found in Fig. (b) of the main text.
Appendix C Robustness of definition of clusters
In the main text, clusters are identified in each METTS snapshot by locating sites where the hole density exceeds the threshold , where is a coefficient that modulates the impact of the standard deviation of the hole density distribution. Figure 9 shows that, even when varying the coefficient , the overall behavior of the mean cluster size as a function of temperature remains robust. The threshold for cluster definition is slightly altered by changing , but the general trends, with small clusters prevailing at higher temperatures and larger clusters dominating at lower temperatures, are unaffected. This demonstrates that the clustering analysis is not extremely sensitive to the specific choice of , and the observed trends in cluster size versus temperature remain reliable across different threshold definitions. In the main text we set to balance sensitivity to local density fluctuations.
References
- Sigmund and Müller [2012] E. Sigmund and K. A. Müller, Phase separation in cuprate superconductors: Proceedings of the second international workshop, September 4-10, 1993, Cottbus, Germany (2012).
- Dagotto [1994] E. Dagotto, Correlated electrons in high-temperature superconductors, Rev. Mod. Phys. 66, 763 (1994).
- Grenier et al. [1992] J.-C. Grenier, A. Wattiaux, and M. Pouchard, Phase separation in the superconducting phases () prepared by electrochemical oxidation, Phase Separation in Cuprate Superconductors , 187 (1992).
- Tranquada et al. [1995] J. Tranquada, B. Sternlieb, J. Axe, Y. Nakamura, and S. Uchida, Evidence for stripe correlations of spins and holes in copper oxide superconductors, Nature 375, 561 (1995).
- Pan et al. [2001] S. H. Pan, J. P. O’Neal, R. L. Badzey, C. Chamon, H. Ding, J. R. Engelbrecht, Z. Wang, H. Eisaki, S.-i. Uchida, A. K. Gupta, E. W. Hudson, K. M. Lang, and J. C. Davis, Microscopic electronic inhomogeneity in the high- superconductor Bi2Sr2CaCu2O8+δ, Nature 413, 282 (2001).
- McElroy et al. [2005] K. McElroy, J. Lee, J. Slezak, D.-H. Lee, H. Eisaki, S. Uchida, and J. C. Davis, Atomic-scale sources and mechanism of nanoscale electronic disorder in Bi2Sr2CaCu2O8+δ, Science 309, 1048 (2005).
- Campi et al. [2015] G. Campi, A. Bianconi, N. Poccia, G. Bianconi, L. Barba, G. Arrighetti, D. Innocenti, J. Karpinski, N. D. Zhigadlo, S. M. Kazakov, et al., Inhomogeneity of charge-density-wave order and quenched disorder in a high-t c superconductor, Nature 525, 359 (2015).
- Yuan et al. [2012] R. Yuan, T. Dong, Y. Song, P. Zheng, G. Chen, J. Hu, J. Li, and N. Wang, Nanoscale phase separation of antiferromagnetic order and superconductivity in , Sci. Rep. 2, 221 (2012).
- Ricci et al. [2011] A. Ricci, N. Poccia, G. Campi, B. Joseph, G. Arrighetti, L. Barba, M. Reynolds, M. Burghammer, H. Takeya, Y. Mizuguchi, Y. Takano, M. Colapietro, N. L. Saini, and A. Bianconi, Nanoscale phase separation in the iron chalcogenide superconductor as seen via scanning nanofocused x-ray diffraction, Phys. Rev. B 84, 060511 (2011).
- Miao et al. [2020] T. Miao, L. Deng, W. Yang, J. Ni, C. Zheng, J. Etheridge, S. Wang, H. Liu, H. Lin, Y. Yu, et al., Direct experimental evidence of physical origin of electronic phase separation in manganites, Proc. Natl. Acad. Sci. U.S.A. 117, 7090 (2020).
- Campi et al. [2022] G. Campi, A. Bianconi, B. Joseph, S. K. Mishra, L. Müller, A. Zozulya, A. A. Nugroho, S. Roy, M. Sprung, and A. Ricci, Nanoscale inhomogeneity of charge density waves dynamics in La2-xSrxNiO4, Sci. Rep. 12, 15964 (2022).
- Kagan et al. [2021] M. Y. Kagan, K. Kugel, and A. Rakhmanov, Electronic phase separation: Recent progress in the old problem, Phys. Rep. 916, 1 (2021).
- Hizhnyakov and Sigmund [1988] V. Hizhnyakov and E. Sigmund, High- superconductivity induced by ferromagnetic clustering, Physica C 156, 655 (1988).
- Hizhnyakov et al. [1989] V. Hizhnyakov, N. Kristoffel, and E. Sigmund, On the percolation induced conductivity in high- superconducting materials, Physica C 160, 119 (1989).
- Zaanen and Gunnarsson [1989] J. Zaanen and O. Gunnarsson, Charged magnetic domain lines and the magnetism of high- oxides, Phys. Rev. B 40, 7391 (1989).
- Poilblanc and Rice [1989] D. Poilblanc and T. M. Rice, Charged solitons in the Hartree-Fock approximation to the large-U Hubbard model, Phys. Rev. B 39, 9749 (1989).
- Machida [1989] K. Machida, Magnetism in La2CuO4-based compounds, Physica C 158, 192 (1989).
- Zaanen and Oleś [1996] J. Zaanen and A. M. Oleś, Striped phase in the cuprates as a semiclassical phenomenon, Ann. Phys. 508, 224 (1996).
- Caprara [2019] S. Caprara, The ancient romans route to charge density waves in cuprates, Condens. Matter 4, 60 (2019).
- Emery and Kivelson [1993] V. J. Emery and S. Kivelson, Frustrated electronic phase separation and high-temperature superconductors, Physica C 209, 597 (1993).
- Ohgoe and Imada [2017] T. Ohgoe and M. Imada, Competition among Superconducting, Antiferromagnetic, and Charge Orders with Intervention by Phase Separation in the 2D Holstein-Hubbard model, Phys. Rev. Lett. 119, 197001 (2017).
- Julia-Farré et al. [2020] S. Julia-Farré, A. Dauphin, R. W. Chhajlany, P. T. Grochowski, S. Wall, M. Lewenstein, and P. R. Grzybowski, Nanoscale phase separation and pseudogap in the hole-doped cuprates from fluctuating Cu-O-Cu bonds, Phys. Rev. B 101, 125107 (2020).
- Karakuzu et al. [2022] S. Karakuzu, A. Tanjaroon Ly, P. Mai, J. Neuhaus, T. A. Maier, and S. Johnston, Stripe correlations in the two-dimensional Hubbard-Holstein model, Commun. Phys. 5, 311 (2022).
- Hubbard [1963] J. Hubbard, Electron correlations in narrow energy bands, Proc. R Soc. Lond. A Math. Phys. Sci. 276, 238 (1963).
- Anderson [1987] P. W. Anderson, The resonating valence bond state in and superconductivity, Science 235, 1196 (1987).
- Zhang and Rice [1988] F. C. Zhang and T. M. Rice, Effective hamiltonian for the superconducting Cu oxides, Phys. Rev. B 37, 3759 (1988).
- Emery and Reiter [1988] V. J. Emery and G. Reiter, Mechanism for high-temperature superconductivity, Phys. Rev. B 38, 4547 (1988).
- Hellberg and Manousakis [1997] C. S. Hellberg and E. Manousakis, Phase separation at all Interaction Strengths in the Model, Phys. Rev. Lett. 78, 4609 (1997).
- White and Scalapino [2000] S. R. White and D. J. Scalapino, Phase separation and stripe formation in the two-dimensional - model: A comparison of numerical results, Phys. Rev. B 61, 6320 (2000).
- Zheng et al. [2017] B.-X. Zheng, C.-M. Chung, P. Corboz, G. Ehlers, M.-P. Qin, R. M. Noack, H. Shi, S. R. White, S. Zhang, and G. K.-L. Chan, Stripe order in the underdoped region of the two-dimensional Hubbard model, Science 358, 1155 (2017).
- White and Scalapino [2003] S. R. White and D. J. Scalapino, Stripes on a 6-leg hubbard ladder, Phys. Rev. Lett. 91, 136403 (2003).
- Hager et al. [2005] G. Hager, G. Wellein, E. Jeckelmann, and H. Fehske, Stripe formation in doped hubbard ladders, Phys. Rev. B 71, 075108 (2005).
- Zheng and Chan [2016] B.-X. Zheng and G. K.-L. Chan, Ground-state phase diagram of the square lattice hubbard model from density matrix embedding theory, Phys. Rev. B 93, 035126 (2016).
- Huang et al. [2017] E. W. Huang, C. B. Mendl, S. Liu, S. Johnston, H.-C. Jiang, B. Moritz, and T. P. Devereaux, Numerical evidence of fluctuating stripes in the normal state of high-Tc cuprate superconductors, Science 358, 1161 (2017).
- Huang et al. [2018] E. W. Huang, C. B. Mendl, H.-C. Jiang, B. Moritz, and T. P. Devereaux, Stripe order from the perspective of the hubbard model, npj Quantum Mater. 3, 22 (2018).
- Ehlers et al. [2017] G. Ehlers, S. R. White, and R. M. Noack, Hybrid-space density matrix renormalization group study of the doped two-dimensional hubbard model, Phys. Rev. B 95, 125125 (2017).
- Qin et al. [2020] M. Qin, C.-M. Chung, H. Shi, E. Vitali, C. Hubig, U. Schollwöck, S. R. White, and S. Zhang (Simons Collaboration on the Many-Electron Problem), Absence of Superconductivity in the Pure Two-Dimensional Hubbard Model, Phys. Rev. X 10, 031016 (2020).
- Jiang et al. [2020] Y.-F. Jiang, J. Zaanen, T. P. Devereaux, and H.-C. Jiang, Ground state phase diagram of the doped hubbard model on the four-leg cylinder, Phys. Rev. Res. 2, 033073 (2020).
- Huscroft et al. [2001] C. Huscroft, M. Jarrell, T. Maier, S. Moukouri, and A. N. Tahvildarzadeh, Pseudogaps in the 2d hubbard model, Phys. Rev. Lett. 86, 139 (2001).
- Kyung et al. [2006] B. Kyung, S. S. Kancharla, D. Sénéchal, A.-M. S. Tremblay, M. Civelli, and G. Kotliar, Pseudogap induced by short-range spin correlations in a doped Mott insulator, Phys. Rev. B 73, 165114 (2006).
- Gull et al. [2013] E. Gull, O. Parcollet, and A. J. Millis, Superconductivity and the pseudogap in the two-dimensional hubbard model, Phys. Rev. Lett. 110, 216405 (2013).
- Huang et al. [2019] E. W. Huang, R. Sheppard, B. Moritz, and T. P. Devereaux, Strange metallicity in the doped hubbard model, Science 366, 987 (2019).
- Meixner et al. [2024] M. Meixner, H. Menke, M. Klett, S. Heinzelmann, S. Andergassen, P. Hansmann, and T. Schäfer, Mott transition and pseudogap of the square-lattice Hubbard model: Results from center-focused cellular dynamical mean-field theory, SciPost Phys. 16, 059 (2024).
- Šimkovic IV et al. [2024] F. Šimkovic IV, R. Rossi, A. Georges, and M. Ferrero, Origin and fate of the pseudogap in the doped Hubbard model, Science 385, eade9194 (2024).
- White [2009] S. R. White, Minimally entangled typical quantum states at finite temperature, Phys. Rev. Lett. 102, 190601 (2009).
- Stoudenmire and White [2010] E. Stoudenmire and S. R. White, Minimally entangled typical thermal state algorithms, New J. Phys. 12, 055026 (2010).
- Fannes et al. [1992] M. Fannes, B. Nachtergaele, and R. F. Werner, Finitely correlated states on quantum spin chains, Commun. Math. Phys. 144, 443 (1992).
- Rommer and Östlund [1997] S. Rommer and S. Östlund, Class of ansatz wave functions for one-dimensional spin systems and their relation to the density matrix renormalization group, Phys. Rev. B 55, 2164 (1997).
- Verstraete et al. [2004] F. Verstraete, J. J. Garcia-Ripoll, and J. I. Cirac, Matrix product density operators: Simulation of finite-temperature and dissipative systems, Phys. Rev. Lett. 93, 207204 (2004).
- Jordan et al. [2008] J. Jordan, R. Orús, G. Vidal, F. Verstraete, and J. I. Cirac, Classical simulation of infinite-size quantum lattice systems in two spatial dimensions, Phys. Rev Lett. 101, 250602 (2008).
- Corboz et al. [2010] P. Corboz, R. Orús, B. Bauer, and G. Vidal, Simulation of strongly correlated fermions in two spatial dimensions with fermionic Projected Entangled-Pair States, Phys. Rev. B 81, 165104 (2010).
- Czarnik et al. [2019] P. Czarnik, J. Dziarmaga, and P. Corboz, Time evolution of an infinite projected entangled pair state: An efficient algorithm, Phys. Rev. B 99, 035115 (2019).
- Sinha et al. [2022] A. Sinha, M. M. Rams, P. Czarnik, and J. Dziarmaga, Finite-temperature tensor network study of the Hubbard model on an infinite square lattice, Phys. Rev. B 106, 195105 (2022).
- Corboz et al. [2012] P. Corboz, S. Capponi, A. M. Läuchli, B. Bauer, and R. Orús, Comment on “Topological quantum phase transitions of attractive spinless fermions in a honeycomb lattice” by Poletti D. et al., EPL 98, 27005 (2012).
- Macridin et al. [2006] A. Macridin, M. Jarrell, and T. Maier, Phase separation in the Hubbard model using the dynamical cluster approximation, Phys. Rev. B 74, 085104 (2006).
- Khatami et al. [2010] E. Khatami, K. Mikelsons, D. Galanakis, A. Macridin, J. Moreno, R. T. Scalettar, and M. Jarrell, Quantum criticality due to incipient phase separation in the two-dimensional Hubbard model, Phys. Rev. B 81, 201101 (2010).
- Sordi et al. [2012] G. Sordi, P. Sémon, K. Haule, and A.-M. Tremblay, Pseudogap temperature as a widom line in doped mott insulators, Sci. Rep. 2, 547 (2012).
- Wietek et al. [2021a] A. Wietek, Y.-Y. He, S. R. White, A. Georges, and E. M. Stoudenmire, Stripes, Antiferromagnetism, and the Pseudogap in the Doped Hubbard Model at Finite Temperature, Phys. Rev. X 11, 031007 (2021a).
- Xiao et al. [2023] B. Xiao, Y.-Y. He, A. Georges, and S. Zhang, Temperature Dependence of Spin and Charge Orders in the Doped Two-Dimensional Hubbard Model, Phys. Rev. X 13, 011007 (2023).
- Gunnarsson et al. [2015] O. Gunnarsson, T. Schäfer, J. P. F. LeBlanc, E. Gull, J. Merino, G. Sangiovanni, G. Rohringer, and A. Toschi, Fluctuation diagnostics of the electron self-energy: Origin of the pseudogap physics, Phys. Rev. Lett. 114, 236402 (2015).
- Schäfer et al. [2021] T. Schäfer, N. Wentzell, F. Šimkovic, Y.-Y. He, C. Hille, M. Klett, C. J. Eckhardt, B. Arzhang, V. Harkov, F. m. c.-M. Le Régent, A. Kirsch, Y. Wang, A. J. Kim, E. Kozik, E. A. Stepanov, A. Kauch, S. Andergassen, P. Hansmann, D. Rohe, Y. M. Vilk, J. P. F. LeBlanc, S. Zhang, A.-M. S. Tremblay, M. Ferrero, O. Parcollet, and A. Georges, Tracking the footprints of spin fluctuations: A multimethod, multimessenger study of the two-dimensional hubbard model, Phys. Rev. X 11, 011058 (2021).
- Miao et al. [2017] H. Miao, J. Lorenzana, G. Seibold, Y. Peng, A. Amorese, F. Yakhou-Harris, K. Kummer, N. B. Brookes, R. Konik, V. Thampy, et al., High-temperature charge density wave correlations in la1. 875ba0. 125cuo4 without spin–charge locking, Proceedings of the National Academy of Sciences 114, 12430 (2017).
- Miao et al. [2018] H. Miao, D. Ishikawa, R. Heid, M. Le Tacon, G. Fabbris, D. Meyers, G. D. Gu, A. Q. R. Baron, and M. P. M. Dean, Incommensurate phonon anomaly and the nature of charge density waves in cuprates, Phys. Rev. X 8, 011008 (2018).
- Miao et al. [2019] H. Miao, R. Fumagalli, M. Rossi, J. Lorenzana, G. Seibold, F. Yakhou-Harris, K. Kummer, N. B. Brookes, G. D. Gu, L. Braicovich, G. Ghiringhelli, and M. P. M. Dean, Formation of incommensurate charge density waves in cuprates, Phys. Rev. X 9, 031042 (2019).
- Arpaia and Ghiringhelli [2021] R. Arpaia and G. Ghiringhelli, Charge order at high temperature in cuprate superconductors, J. Phys. Soc. Jpn. 90, 111005 (2021).
- Rommer et al. [2000] S. Rommer, S. R. White, and D. J. Scalapino, Phase separation in - ladders, Phys. Rev. B 61, 13424 (2000).
- Shih et al. [2001] C. Shih, Y. Chen, and T. Lee, Revisit phase separation of the two-dimensional model by the power-lanczos method, J. Phys. Chem. Solids 62, 1797 (2001).
- Staszewski and Wietek [2024] L. Staszewski and A. Wietek, Quench dynamics of stripes and phase separation in the two-dimensional model, arXiv:2410.16387 (2024).
- Lieb and Wu [1968] E. H. Lieb and F. Y. Wu, Absence of mott transition in an exact solution of the short-range, one-band model in one dimension, Phys. Rev. Lett. 20, 1445 (1968).
- Nagaoka [1966] Y. Nagaoka, Ferromagnetism in a narrow, almost half-filled band, Phys. Rev. 147, 392 (1966).
- Qin et al. [2022] M. Qin, T. Schäfer, S. Andergassen, P. Corboz, and E. Gull, The Hubbard model: A computational perspective, Annu. Rev. Condens. Matter Phys. 13, 275 (2022).
- Czarnik et al. [2012] P. Czarnik, L. Cincio, and J. Dziarmaga, Projected entangled pair states at finite temperature: Imaginary time evolution with ancillas, Phys. Rev. B 86, 245101 (2012).
- Czarnik and Dziarmaga [2014] P. Czarnik and J. Dziarmaga, Fermionic projected entangled pair states at finite temperature, Phys. Rev. B 90, 035144 (2014).
- Kshetrimayum et al. [2019] A. Kshetrimayum, M. Rizzi, J. Eisert, and R. Orús, Tensor Network Annealing Algorithm for Two-Dimensional Thermal States, Phys. Rev. Lett. 122, 070502 (2019).
- Czarnik et al. [2021] P. Czarnik, M. M. Rams, P. Corboz, and J. Dziarmaga, Tensor network study of the magnetization plateau in the Shastry-Sutherland model at finite temperature, Phys. Rev. B 103, 075113 (2021).
- Chen et al. [2021] B.-B. Chen, C. Chen, Z. Chen, J. Cui, Y. Zhai, A. Weichselbaum, J. von Delft, Z. Y. Meng, and W. Li, Quantum many-body simulations of the two-dimensional fermi-hubbard model in ultracold optical lattices, Phys. Rev. B 103, L041107 (2021).
- Li et al. [2023] Q. Li, Y. Gao, Y.-Y. He, Y. Qi, B.-B. Chen, and W. Li, Tangent Space Approach for Thermal Tensor Network Simulations of the 2d Hubbard model, Phys. Rev. Lett. 130, 226502 (2023).
- Sinha et al. [2024] A. Sinha, M. M. Rams, and J. Dziarmaga, Efficient representation of minimally entangled typical thermal states in two dimensions via projected entangled pair states, Phys. Rev. B 109, 045136 (2024).
- Šimkovic IV et al. [2022] F. Šimkovic IV, R. Rossi, and M. Ferrero, Two-dimensional Hubbard model at finite temperature: Weak, strong, and long correlation regimes, Phys. Rev. Res. 4, 043201 (2022).
- LeBlanc et al. [2015] J. P. F. LeBlanc, A. E. Antipov, F. Becca, I. W. Bulik, G. K.-L. Chan, C.-M. Chung, Y. Deng, M. Ferrero, T. M. Henderson, C. A. Jiménez-Hoyos, E. Kozik, X.-W. Liu, A. J. Millis, N. V. Prokof’ev, M. Qin, G. E. Scuseria, H. Shi, B. V. Svistunov, L. F. Tocchio, I. S. Tupitsyn, S. R. White, S. Zhang, B.-X. Zheng, Z. Zhu, and E. Gull (Simons Collaboration on the Many-Electron Problem), Solutions of the two-dimensional Hubbard Model: Benchmarks and Results from a Wide Range of Numerical Algorithms, Phys. Rev. X 5, 041041 (2015).
- Esslinger [2010] T. Esslinger, Fermi-Hubbard physics with atoms in an optical lattice, Annu. Rev. Condens. Matter Phys. 1, 129 (2010).
- Bohrdt et al. [2021] A. Bohrdt, L. Homeier, C. Reinmoser, E. Demler, and F. Grusdt, Exploration of doped quantum magnets with ultracold atoms, Ann. Phys. 435, 168651 (2021), special issue on Philip W. Anderson.
- Bakr et al. [2009] W. S. Bakr, J. I. Gillen, A. Peng, S. Fölling, and M. Greiner, A quantum gas microscope for detecting single atoms in a Hubbard-regime optical lattice, Nature 462, 74 (2009).
- Sherson et al. [2010] J. F. Sherson, C. Weitenberg, M. Endres, M. Cheneau, I. Bloch, and S. Kuhr, Single-atom-resolved fluorescence imaging of an atomic mott insulator, Nature 467, 68 (2010).
- Gross and Bakr [2021] C. Gross and W. S. Bakr, Quantum gas microscopy for single atom and spin detection, Nat. Phys. 17, 1316 (2021).
- Cheuk et al. [2015] L. W. Cheuk, M. A. Nichols, M. Okan, T. Gersdorf, V. V. Ramasesh, W. S. Bakr, T. Lompe, and M. W. Zwierlein, Quantum-gas microscope for fermionic atoms, Phys. Rev. Lett. 114, 193001 (2015).
- Parsons et al. [2015] M. F. Parsons, F. Huber, A. Mazurenko, C. S. Chiu, W. Setiawan, K. Wooley-Brown, S. Blatt, and M. Greiner, Site-resolved imaging of fermionic in an optical lattice, Phys. Rev. Lett. 114, 213002 (2015).
- Boll et al. [2016] M. Boll, T. A. Hilker, G. Salomon, A. Omran, J. Nespolo, L. Pollet, I. Bloch, and C. Gross, Spin-and density-resolved microscopy of antiferromagnetic correlations in Fermi-Hubbard chains, Science 353, 1257 (2016).
- Parsons et al. [2016] M. F. Parsons, A. Mazurenko, C. S. Chiu, G. Ji, D. Greif, and M. Greiner, Site-resolved measurement of the spin-correlation function in the Fermi-Hubbard model, Science 353, 1253 (2016).
- Hilker et al. [2017] T. A. Hilker, G. Salomon, F. Grusdt, A. Omran, M. Boll, E. Demler, I. Bloch, and C. Gross, Revealing hidden antiferromagnetic correlations in doped Hubbard chains via string correlators, Science 357, 484 (2017).
- Koepsell et al. [2019] J. Koepsell, J. Vijayan, P. Sompet, F. Grusdt, T. A. Hilker, E. Demler, G. Salomon, I. Bloch, and C. Gross, Imaging magnetic polarons in the doped Fermi-Hubbard model, Nature 572, 358 (2019).
- Chiu et al. [2019] C. S. Chiu, G. Ji, A. Bohrdt, M. Xu, M. Knap, E. Demler, F. Grusdt, M. Greiner, and D. Greif, String patterns in the doped Hubbard model, Science 365, 251 (2019).
- Koepsell et al. [2021] J. Koepsell, D. Bourgund, P. Sompet, S. Hirthe, A. Bohrdt, Y. Wang, F. Grusdt, E. Demler, G. Salomon, C. Gross, et al., Microscopic evolution of doped mott insulators from polaronic metal to fermi liquid, Science 374, 82 (2021).
- Verstraete and Cirac [2004] F. Verstraete and J. I. Cirac, Renormalization algorithms for quantum-many body systems in two and higher dimensions, arXiv:cond-mat/0407066 (2004).
- Lubasch et al. [2014] M. Lubasch, J. I. Cirac, and M.-C. Bañuls, Algorithms for finite projected entangled pair states, Phys. Rev. B 90, 064425 (2014).
- Dziarmaga [2021] J. Dziarmaga, Time evolution of an infinite projected entangled pair state: Neighborhood tensor update, Phys. Rev. B 104, 094411 (2021).
- Orús [2014] R. Orús, A practical introduction to tensor networks: Matrix product states and projected entangled pair states, Ann. Phys. 349, 117 (2014).
- Rams et al. [2024] M. M. Rams, G. Wójtowicz, A. Sinha, and J. Hasik, YASTN: Yet Another Symmetric Tensor Networks; A Python library for abelian symmetric tensor network calculations (2024), source code available at https://github.com/yastn/yastn.
- Haegeman et al. [2011] J. Haegeman, J. I. Cirac, T. J. Osborne, I. Pižorn, H. Verschelde, and F. Verstraete, Time-dependent variational principle for quantum lattices, Phys. Rev. Lett. 107, 070601 (2011).
- Paeckel et al. [2019] S. Paeckel, T. Köhler, A. Swoboda, S. R. Manmana, U. Schollwöck, and C. Hubig, Time-evolution methods for matrix-product states, Ann. Phys. 411, 167998 (2019).
- Yang and White [2020] M. Yang and S. R. White, Time-dependent variational principle with ancillary krylov subspace, Phys. Rev. B 102, 094315 (2020).
- Fishman et al. [2022a] M. Fishman, S. R. White, and E. M. Stoudenmire, Codebase release 0.3 for ITensor, SciPost Phys. Codebases , 4 (2022a).
- Fishman et al. [2022b] M. Fishman, S. R. White, and E. M. Stoudenmire, The ITensor Software Library for Tensor Network Calculations, SciPost Phys. Codebases , 4 (2022b).
- Wietek et al. [2021b] A. Wietek, R. Rossi, F. Šimkovic, M. Klett, P. Hansmann, M. Ferrero, E. M. Stoudenmire, T. Schäfer, and A. Georges, Mott Insulating States with Competing Orders in the Triangular Lattice Hubbard Model, Phys. Rev. X 11, 041013 (2021b).