Cell as Point: One-Stage Framework for Efficient Cell Tracking
Abstract
Cellular activities are dynamic and intricate, playing a crucial role in advancing diagnostic and therapeutic techniques, yet they often require substantial resources for accurate tracking. Despite recent progress, the conventional multi-stage cell tracking approaches not only heavily rely on detection or segmentation results as a prerequisite for the tracking stage, demanding plenty of refined segmentation masks, but are also deteriorated by imbalanced and long sequence data, leading to under-learning in training and missing cells in inference procedures. To alleviate the above issues, this paper proposes the novel end-to-end CAP framework, which leverages the idea of regarding Cell as Point to achieve efficient and stable cell tracking in one stage. CAP abandons detection or segmentation stages and simplifies the process by exploiting the correlation among the trajectories of cell points to track cells jointly, thus reducing the label demand and complexity of the pipeline. With cell point trajectory and visibility to represent cell locations and lineage relationships, CAP leverages the key innovations of adaptive event-guided (AEG) sampling for addressing data imbalance in cell division events and the rolling-as-window (RAW) inference method to ensure continuous tracking of new cells in the long term. Eliminating the need for a prerequisite detection or segmentation stage, CAP demonstrates strong cell tracking performance while also being 10 to 55 times more efficient than existing methods. The code and models will be released.
1 Introduction
Cells are the fundamental units of organs in the human body [18]. Cell events are diverse, continuously changing, and intricate, involving cell migration (translocation), mitosis (division), and apoptosis (death) [36]. Cell tracking is the task of keeping track of each cell’s location and reconstructing cell lineages (mother-daughter relations), which help develop preventive therapies [51] and drug discovery [17]. Traditional methods of manual tracking demand significant resources and expertise to achieve reliable results. This complexity creates a pressing need for efficient, automated cell tracking systems.
Indeed, several existing works and platforms [21] have demonstrated relatively effective performance in achieving automated cell tracking. The taxonomies of strategies typically involve segmentation followed by linking (SegLnk) [19, 45], segmentation and linking (Seg&Lnk) [14, 35, 40], or even detection prior to the segmentation and linking stages (DetSegLnk [49] or DetLnkSeg [36, 20]) [43]. Also, frameworks [24, 25] often incorporate isolated data-preprocessing stages to represent cell tracking data. These multi-stage cell tracking pipelines can limit the overall performance of the framework, constrained by the errors that occur at earlier stages and are accumulated and amplified at subsequent stages [37]. Additionally, a multi-stage framework involving both detection/segmentation and tracking not only requires the tracking ground-truth but also demands additional labels, i.e., segmentation masks, to train the model. It is highly labor-intensive and time-consuming to produce the data annotation, rendering such methods impractical for clinical applications [72].
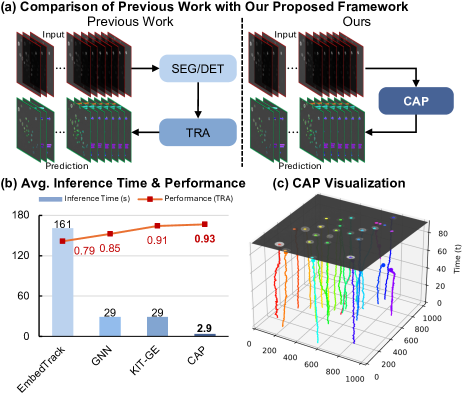
To overcome the data challenge for existing multi-stage frameworks, we propose a novel one-stage cell tracking framework, Cell as Point (CAP), as demonstrated in Fig. 1 (a), that treats each cell as a point to jointly track numerous cell points within a sequence. The one-stage CAP framework not only benefits from the efficient prediction procedure through a straightforward pipeline, shown in Fig. 1 (b), but also from its low requirement for data annotation, solely relying on tracking ground-truth (coarse masks and cell acyclic graphs) to represent the position and status of each cell. Specifically, by proposing cell point trajectory and visibility to represent the cell tracking data within one-stage framework, CAP offers an elegant solution to alleviate the issues of the complicated data-preprocessing and the dilemma of representation of cell decay, which existing methods struggle to cope with. Another highlight of CAP is the creation of adaptive event-guided (AEG) sampling method and rolling-as-window (RAW) inference approach. Specifically, AEG sampling is a temporal data sampling strategy for cell microscopy imaging sequence data to remedy the imbalance of cell division occurrences in the dataset; RAW is an inference approach to capture and track new cells within a long sequence in an efficient way. To summarize, our key contributions include:
-
•
We propose a novel CAP cell tracking framework that is highly efficient in terms of inference time and data annotation requirements, enabling one-stage tracking that bypasses detection/segmentation to observe and investigate cellular behaviors.
-
•
We address prevalent challenges in the cell tracking field by proposing AEG sampling to resolve imbalanced cell division occurrence, representing complex cell events for training purposes through cell point trajectory and visibility concepts within a one-stage framework, and employing a RAW inference approach to capture and track new cells in long sequences.
-
•
Our one-stage approach, CAP, achieves comparable or higher performance compared to multi-stage methods while alleviating the need for detection or segmentation.
2 Related Work
2.1 Cell Tracking
Cell tracking is a crucial task in biological imaging that typically involves the identification and temporal association of cell instances across image frames. Traditionally, this process includes two main steps: cell segmentation (detection) and cell linking [13]. The segmentation step identifies individual cells in each frame, while the linking step establishes temporal associations between these cells across frames, sometimes capturing complex dynamics such as cell division and migration [40, 43]. Nowadays, instead of traditional approaches such as Nearest Neighbors linking [56], Bayesian filters [54, 12, 26, 67, 27, 61], Viterbi [42, 41], and graph-based matching [3, 60, 2, 39], the advent of deep learning has transformed the landscape of cell tracking, leveraging advanced neural architectures for segmentation and tracking tasks. Deep learning approaches often utilize convolutional neural networks (CNNs) and recurrent neural networks (RNNs) to perform these tasks [55], employing complex models that combine multiple stages like detection [10, 8, 9, 38, 74, 23, 46, 65, 24, 25], segmentation [68, 47, 7, 1, 40, 57, 5, 6, 52], and tracking into the frameworks. Several contemporary methods [50, 48, 23] aim to integrate contextual cell data into tracking models. ConvGRU [48] is introduced by Payer et al., capturing local cellular and inter-frame features. However, this method requires extensive annotated training data for all cell regions, making it labor-intensive. Motion and Position Map (MPM) is capable of representing detection and association at once, which is proposed by Hayashida et al. [24], marking an advancement in simplifying the pipeline for cell tracking. However, it still requires multiple stages, first generating the MPM followed by subsequent detection and tracking procedures.
Thus, although existing multi-stage methods, which are based on individual cell detection followed by linking/association or evolving segmentation masks over time, show great cell tracking performance, they heavily rely on segmentation as a preliminary step before tracking. These methods often require high-quality data annotation for training and can be computationally intensive, especially when dealing with high-resolution [69]. Additionally, these methods often involve complex pipelines that may not support end-to-end or one-stage training, posing challenges for both training and inference phases in terms of efficiency and scalability [37, 72]. Thus, to tackle these issues, an end-to-end one-stage framework that omits the intermediate segmentation or detection stage is essential.
2.2 Point Tracking
In the field of natural images, recent end-to-end video point-tracking frameworks have achieved commendable performance. Notably, TAP-Vid [15] pioneered tracking any point across video frames, establishing a benchmark, and claiming a baseline method. However, this method does not support tracking occluded points, limiting its applicability in cell-tracking scenarios. Even though PIPs [22] and PointOdyssey [73] methods take measures to address the issue of point occlusion in long sequences by tracking selected points using a fixed sliding window and resuming tracking from the last visible frame, these methods struggle with point tracking independently, which may not capture the dependencies between multiple points. OmniMotion [64] accounts for estimated correspondences within a canonical space by optimizing a volumetric representation for video sequences. Although innovative, this method involves test-time optimization, making it computationally expensive, which is less viable for clinical applications. CoTracker [32] represents significant advancements in the field of point tracking. It addresses the inaccuracies led by independent tracking among points by incorporating incremental point coordinates updates based on 4D correlation volumes, first proposed by RAFT [59] constructed for all pairs of points from point/object features. CoTracker3 [31] is advanced by involving a semi-supervised training methodology to reduce reliance on synthetic datasets and utilizing pseudo-labeling techniques to generate training labels from unannotated real-world videos.
Although the performance of cell tracking may benefit from investigating the interdependencies between each cell, inspired by joint tracking [32], the unique properties of cell behaviors, i.e., cell mitosis and apoptosis, have not been considered in the model construction. Specifically, cells are not only relative with position and occlusion but also potentially associated with their ancestors due to the regulation of cellular life decay and division, triggering another issue: missing tracking for new daughter cells. Moreover, regarding the publicly available cell tracking data [45, 43, 62, 33], the diversity of cell types results in significant variations in cell division rates and sequence length across different datasets categorized by specimens. Imbalanced data [34] can lead to the omission of complete division events (from the death of the mother cell to the birth of the daughter cell) during random sampling with a low division rate; long sequences typically require more time or computational resources to predict cell locations and lineages at once. Thus, existing methods potentially result in the under-learning of division cases in the model training process and a higher resource requirement in the inference procedure.
Therefore, the uniqueness of this time-lapse cell sequential image data poses the most significant challenge in developing a one-stage cell tracking framework to effectively track cells jointly.
3 Cell as Point (CAP)
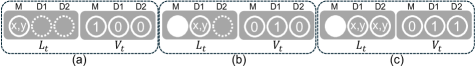
Cell tracking aims to identify the characteristics of cell migration and division, thereby fully automating the prediction of specific cell position and division status changes in each frame of a time-lapse microscopy video. In our framework, CAP, every single cell is a point, tracking all cell points throughout the duration of a frame sequence containing grayscale cell microscopy images . CAP primarily utilizes and learns the dependencies between cell point trajectories and visibilities to predict cell locations and lineages. The cell point trajectory is constituted by the cell centroid point locations , , , where is the time of a frame sequence. The cell point visibility of the cell indicates whether the -th cell point appears at the location in the frame at time ; in other words, whether the cell has divided into new cells and disappeared. Fig. 2 demonstrates the combination of cell point trajectory and visibility, representing various states of cells, such as migration, mitosis, apoptosis, and cell lineages (with two potential daughter cells). This simple yet effective representation method will efficiently aid the CAP framework in achieving one-stage efficient cell tracking.
3.1 Adaptive Event-Guided (AEG) Sampling
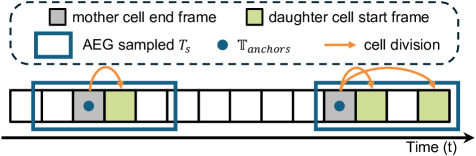
To facilitate the effective training of models to understand the biological behavior of cell division while mitigating data imbalance [70], we propose the Adaptive Event-Guided (AEG) sampling technique to balance the occurrences of cell division in a sequence of frames the model sees. In order to reduce operational costs and compromise overfitting [4], instead of seeing the entire training sequence in a single instance, the model learns a continuous sequence of frames, where , with the initial frame index determined using AEG for each iteration. The AEG method leverages the intrinsic dynamics of cell division within the frame sequences to guide the sampling process, enhancing the representational diversity of the training dataset and ensuring the model’s robustness to variations in cell behavior. Technically, as data loading iterates through the whole dataset by detecting the complete cell division processes (from the death of parent cell to the birth of daughter cell), an anchor is added at each time cell division occurs . When the probability indicates the application of the AEG method, our CAP framework enables AEG sampling applied to selecting as illustrated in Fig. 3; Otherwise, the starting frame of is randomly located in the range of .
For each training sequence, we crop a fixed-length frame sequence in accordance with the starting frame from the video. Occasionally, the process of cell division, resulting in the formation of new cells, may span multiple frames. Thus, the leverage of the AEG approach allows us to capture complete division processes within sampled sequences in data pre-processing. This fixed-length cropping is critical to maintaining uniformity in the input data, facilitating more stable and reliable learning outcomes.
3.2 Cell Joint Tracking
By regarding each cell as a point and leveraging the two-dimensional feature across time and a set of tracked cell points, we implement an effective and efficient method for cell tracking via the correlation between cell point trajectories and visibilities. Specifically, the training process of CAP as a transformer neural network [63], where . In order to improve the estimated cell trajectories and visibilities along with iterations, the trajectories and visibilities of points (cells) in a -frame sequence are encoded into a grid of input tokens . is the corresponding output of for representing the refined trajectories and visibilities. The following sections elaborate on the transformer formulation visualized in Fig. 4.
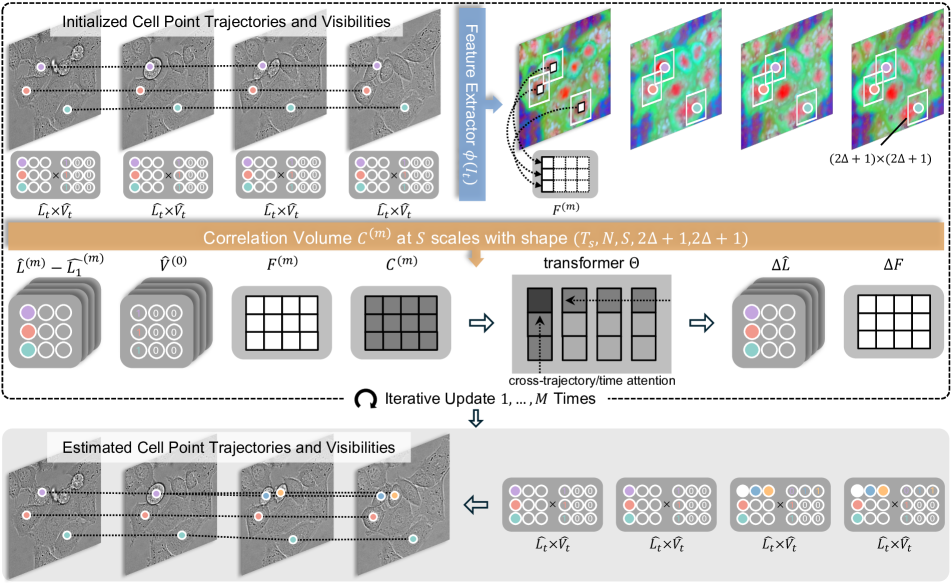
Feature Extraction.
To initialize the tracking feature for the part of input tokens , we first generate image features (feature map) for each frame in the training sequence, from which the tracking features are distilled according to cell point locations. Specifically, the feature extractor is a convolutional neural network (CNN) trained end-to-end in the framework for computational efficiency. Leveraging the CNN feature extractor, the feature maps with dimensions are generated from , , where for computational efficiency, and the features are downscaled by average pooling with strides for multi-scaled features.
The tracking features for are captured by bilinear sampling from the location of cell points on the initial frame on the feature map . By broadcasting the tracking features in frame for all training frames into shape , the tracking feature vector is initialized for the transformer input, which is refined and updated with the training process.
Correlation Volume.
To achieve the objective of associating cell point trajectories with a sequence of frames, CAP employs correlation volume , where , proposed in RAFT [59]. These correlation volumes are derived by assessing the relationship between the tracking features and the image features in proximity to the estimated cell point location of the trajectory on the -th frame. Technically, each is the average over the correlation response in a grid:
| (1) | ||||
where are the feature scales and , are offsets around cell points, and are the estimated location of the cell point . This means that the value at can be computed as the inner product between the feature vector and at pooled with kernel size . All different scaled features are sampled by using bilinear interpolation at non-integer locations and border padding from the image feature map .
Input and Output Tokens.
The input tokens express the concatenation of features: location , visibility , tracking features , and correlation volume of cell trajectories . As for the output tokens , contain updates for location and refined tracking features:
| (2) |
where CAP estimates locations for each cell, following the structure in Fig. 2: the cell’s own location and the locations of two potential daughter cells. This is because any cell division that happened in the event would have been that of the parent cell into two daughter cells [29]. Thus, CAP represents and through a -column format to reserve space for each cell’s progeny.
Iterative Updates.
Utilizing the approach of applying the transformer iteratively for a sequence , the update operator in CAP produces and progressively improves the cell locations estimation . Considering times estimating the cell locations, the update of the output computes , which is applied to the next iteration:
| (3) |
where and denotes initialization. At the last iteration of the update , cell point visibility for locations estimated is computed by , where represents the sigmoid activation function and is a learned matrix of weights. By investigating the visibilities , CAP tells if the cell division occurred on cell in the -th frame.
Supervision.
We supervised our transformer on the trajectory and visibility between predicted and ground truth for every semi-overlapping window. The trajectory loss function is location regression summed over the update iterations, and the visibility loss function is the cross entropy of binary visibility options:
| (4) | |||
| (5) |
where is the number of times iteratively estimating the cell locations with updated for a sequence, and is updated at the -th iteration; is the total number of whose trajectory starts in the middle of the previous .
3.3 Rolling-as-Window (RAW) Inference
In the field of cell tracking, the inference part plays a crucial role in generating the final tracking mask and in documenting cell lineage relationships based on predicted cell locations and division events. In existing works [57, 52, 65, 40, 6], the inference and post-processing stages are mostly explicitly tailored to different datasets, which vary in sequence lengths, which may hinder broad application to other datasets. In contrast, our proposed inference approach, rolling-as-window (RAW) in the CAP, not only simplifies and unifies these processes but also proves effective across varying lengths of frame sequences, facilitating high-quality inference regardless of computational resources. Within our model, the mechanism of iterative updates assists in maintaining the quality of inference results. It ensures that the output remains consistent and high-quality while utilizing a rolling loop that crops the yet-to-be-inferred clip from the whole sequence into a window for inference.
In a certain sequence with frames, if the inference window length supported by either computational resources or architecture is shorter than , the first rolling of window frames is passed into the trained transformer ; otherwise, the whole sequence will be inferred at once. The RAW inference approach is summarized in Alg. 1, which will be triggered while the former scenario happens. Specifically, a -length subsequence starting from is passed into for prediction. The output, cell point trajectories and visibilities , where , are processed frame-by-frame to update query points based on the of identified cells and check for cell division or the emergence of new cells. Whenever a new cell appears, the predicted location of this new cell is incorporated into the updated query points for the subsequent rolling of analysis by the formula:
| (6) |
where is the times of rolling for window inference. Subsequently, RAW segments a new window sequence starting from the frame where the new cell appeared, preparing it for the next application of . By adjusting the based on the capacity of computational resources and value, our CAP is capable of performing efficient and high-quality inference on sequences of any length.
4 Experiments and Results
| Metrics | PhC-C2DH-U373 | Fluo-N2DH-GOWT1 | Fluo-C2DL-Huh7 | |||||||||
|---|---|---|---|---|---|---|---|---|---|---|---|---|
| GNN | EmbedTrack | KIT-GE | CAP | GNN | EmbedTrack | KIT-GE | CAP | GNN | EmbedTrack | KIT-GE | CAP | |
| 214 | 0 | 3 | 0 | 49 | 39 | 45 | 18 | 34 | 0 | 34 | 31 | |
| 371 | 44 | 50 | 0 | 140 | 119 | 111 | 120 | 85 | 733 | 77 | 71 | |
| 0 | 0 | 0 | 0 | 1 | 0 | 0 | 2 | 2 | 0 | 0 | 0 | |
| 0 | 7 | 1 | 0 | 13 | 0 | 1 | 2 | 835 | 5 | 0 | 1 | |
| 135 | 211 | 197 | 119 | 5 | 21 | 6 | 75 | 36 | 1392 | 41 | 101 | |
| 25 | 32 | 25 | 0 | 28 | 40 | 32 | 46 | 4 | 636 | 0 | 1 | |
| 0.771 | 0.931 | 0.939 | 0.985 | 0.958 | 0.961 | 0.966 | 0.960 | 0.889 | 0.187 | 0.970 | 0.966 | |
| 19.7 | 123.6 | 22.0 | 2.6 | 67.2 | 171.6 | 39.4 | 7.1 | 27.1 | 125.0 | 25.7 | 3.2 | |
| Metrics | HeLa | PC-3 | 3T3 | RAW264 | ||||||||
|---|---|---|---|---|---|---|---|---|---|---|---|---|
| GNN | EmbedTrack | CAP | GNN | EmbedTrack | CAP | GNN | EmbedTrack | CAP | GNN | EmbedTrack | CAP | |
| 2 | 0 | 3 | 2 | 0 | 1 | 6 | 2 | 107 | 186 | 68 | 67 | |
| 385 | 211 | 82 | 52 | 43 | 11 | 613 | 603 | 949 | 1451 | 1475 | 1098 | |
| 1 | 1 | 1 | 3 | 3 | 0 | 16 | 14 | 2 | 89 | 74 | 12 | |
| 13 | 1 | 0 | 12 | 1 | 0 | 3 | 4 | 4 | 21 | 28 | 17 | |
| 62 | 31 | 60 | 33 | 0 | 35 | 100 | 201 | 250 | 239 | 669 | 647 | |
| 342 | 218 | 70 | 0 | 42 | 7 | 9 | 589 | 709 | 1341 | 1259 | 898 | |
| 0.776 | 0.849 | 0.926 | 0.868 | 0.912 | 0.952 | 0.857 | 0.853 | 0.832 | 0.801 | 0.803 | 0.864 | |
| 23.3 | 41.5 | 1.3 | 18.3 | 48.7 | 1.1 | 21.7 | 74.6 | 2.2 | 28.5 | 59.6 | 2.8 | |
We conducted experiments to demonstrate the high efficacy and efficiency of our end-to-end, one-stage framework for cell tracking, CAP. While utilizing minimal inference time and without extra segmentation masks, the performance is competitive and even outperforms existing works. Also, we perform comprehensive ablation studies to verify the effectiveness of CAP components in detail.
4.1 Experimental Setup
Datasets.
We evaluate our proposed framework on DynamicNuclearNet Tracking in DeepCell [45] public database, HeLa, PC-3, 3T3, and RAW264 datasets divided by specimen, and ISBI cell tracking challenge [43, 62] public datasets, PhC-C2DH-U373 (U373), Fluo-N2DH-GOWT1 (GOWT1), and Fluo-C2DL-Huh7 (Huh7). These temporal data used for cell tracking, shot by different devices in various durations on diverse specimens, exhibit diverse morphologies and sequence characteristics. DeepCell contains sequences in total: for HeLa, for PC-3, for 3T3, and for RAW264, with , , , and frames in each sequence, respectively. For the ISBI dataset, The U373 comprises glioblastoma-astrocytoma U373 cells in a frames sequence of size . Dataset GOWT1 documents GFP-GOWT1 mouse stem cells into frames with a size of per sequence. Huh7 is a dataset of human hepatocarcinoma-derived cells in a sequence of frames with a size.
Implementation Details.
For the training process, we use training sequences in DeepCell and sequence in the ISBI dataset with only tracking (TRA) GT, from each dataset with cropping sequence frames for each iteration using sliding window length . We utilize pre-trained checkpoints provided by the authors of CoTracker [32], which has been trained exclusively on synthetic data with channels, so we duplicate grayscale images channel times. We use an end-to-end trained -dimensional CNN architecture as the encoder to extract tracking features . Specifically, it integrates bilinear interpolation and utilizes it to extract different scaled image features with -channel output features concatenated to optimized dynamic feature extraction (Sec. 3.2). While training the transformer, we follow the pre-trained checkpoint that downsamples the resolution of frames to and choose , to calculate 4D multi-scaled correlation volumes (Sec. 3.2). More details can be found in the supplementary.
As for the testing (evaluation) process, we first select query points for each cell that appeared on the first frame for each sequence and start the process of window rolling. The evaluation sequence , which is the subsequence in the dataset, follows the native resolution (), which the dataset is trained on. We set , which is mentioned in Sec. 3.3. We use the evaluation criteria provided by ISBI [43, 62], which lay in the range that a higher score corresponds with a better performance and is calculated by , where is the measure of acyclic oriented graphs matching [44], penalizing the number of transformations needed to transform the predicted tracking graph into the ground-truth tracking graph, e.g., merged cells (), missing links (), wrong links (), links with wrong semantics (), false positives (), and false negatives (), and is the value for empty tracking results.
Baselines.
We compare our approach CAP with three methods, cell-tracker-gnn (GNN) [6], EmbedTrack [40], and KIT-GE [52], which have publicly available code and utilize the evaluation system provided by ISBI [43, 62] and acyclic oriented graphs matching (AOGM) measure [44]. For the ISBI dataset, to control for variables and ensure fairness, we train these methods on sequence and evaluate on , following [52]. For the DeepCell data, we follow the experiments [45] and report the result. We report the measures involved in the cell tracking, , , , , , , , and average inference time ().
4.2 Results and Analysis
Tab. 1 presents the quantitative performance comparison of our method, CAP, and baseline methods, GNN, EmbedTrack, and KIT-GE on the ISBI dataset (U373, GOWT1, and Huh7) and DeepCell dataset (HeLa, PC-3, 3T3, and RAW264). Since is derived from metrics , , , , , and , we primarily focus on the score for the model performance and for efficiency.
U373 dataset with a -frame sequence not only does CAP outperform all GNN, KIT-GE, and EmbedTrack significantly, achieving a perfect score of for , , , , and with the highest score of , but also it has the smallest inference time of s. In contrast, GNN, EmbedTrack, and KIT-GE exhibit higher error counts and inference time. The of datasets HeLa, PC-3, and RAW264, , , and , show that The CAP not only significantly leads other methods in terms of the values but also utilizes markedly less inference time compared to other approaches. CAP still demonstrates comparable performance with the score of , , and across previous works in datasets GOWT1, Huh7, and 3T3. The trade-off remains advantageous given that CAP directly eliminates the stages of segmentation or detection, thereby significantly reducing the volume of data labels required and inference time (s, s, and s) by approximately to times, while it has a slightly lower measure than the greatest performance in existing methods.
As for the extreme instability of EmbedTrack method on Huh7 with , our analysis suggests that the observed results stem from the method’s excessive reliance on the segmentation (SEG) stage and the usage of refined masks during the training of the segmentation model, while Huh7 contains only SEG golden truth (GT) masks without the more refined SEG silver truth (ST). More details about the difference between tracking GT mask, SEG GT, and SEG ST is illustrated in the supplementary. This further substantiates an end-to-end one-stage cell tracking framework, which bypasses the segmentation or detection stage, enhances model stability, and raises the overall performance limits achievable by the model.
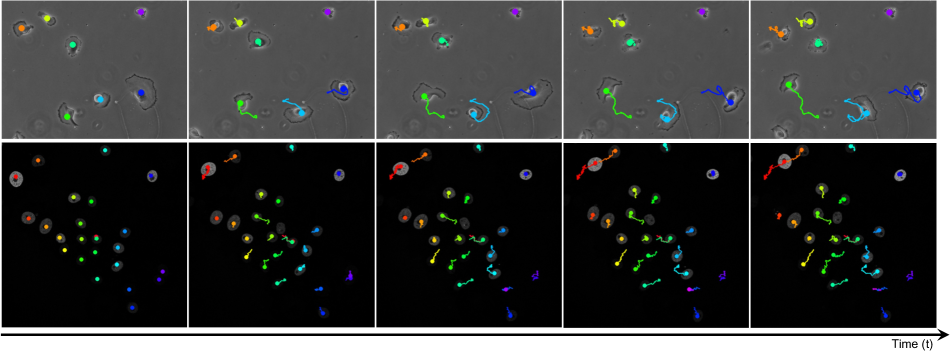
Overall, the CAP method demonstrates robust performance and constant high efficiency on inference and label usage across all datasets, consistently achieving high scores and the lowest s. In other words, these results suggest that CAP is a highly effective, efficient, and reliable method for cell tracking field in a practical biomedical context. Fig. 5 demonstrates a great qualitative result (visualization) of a sequence of time-lapse microscopy images obtained by CAP cell tracking framework.
4.3 Ablation Study
| AEG Sampling | Score | ||
|---|---|---|---|
| U373 | GOWT1 | Huh7 | |
| ✗ | 0.556 | 0.941 | 0.942 |
| ✓ | 0.985 | 0.960 | 0.966 |
Effectiveness of AEG Sampling.
To mitigate the data imbalance in cell division in samples, AEG sampling Sec. 3.1 is an effective method we proposed to calibrate the sample experience in a complete cell division process. Tab. 2 illustrates that switching off AEG sampling decreases performance from to .
| Attention | Score | |||
|---|---|---|---|---|
| time | joint | U373 | GOWT1 | Huh7 |
| ✓ | ✗ | 0.974 | 0.903 | 0.944 |
| ✓ | ✓ | 0.985 | 0.960 | 0.966 |
Effectiveness of Cell Joint Tracking.
By replacing the cross-trajectory attention layers with only time attention layers to keep the model size, Tab. 3 shows model performance declined by to across datasets. Thus, the mechanism of tracking cells jointly plays an important role in CAP. More ablations can be found in the supplementary.
| Stride | Score | ||
|---|---|---|---|
| U373 | GOWT1 | Huh7 | |
| 8 | 0.531 | 0.609 | 0.853 |
| 4 | 0.985 | 0.960 | 0.966 |
Ablation on Feature Stride.
5 Conclusion and Future Work
In this paper, we introduce the one-stage CAP (Cell as Point) framework, which eliminates the need for a separate segmentation or detection stage—a significant innovation in cell tracking. This approach substantially improves efficiency by reducing inference time by a factor of to , while also minimizing the need for high-quality data annotation. CAP effectively captures complex cell states and tracks cells in a single step, all while maintaining high efficiency. Additionally, it addresses common challenges in cell tracking, such as data imbalance and long sequence inference. In conclusion, CAP not only offers considerable practical value in real-world applications due to its efficiency but also pioneers a novel approach in the field of cell tracking.
Limitations and Future Work.
Different datasets are captured by different devices, potentially resulting in variations in the luminance of cells presented in the time-lapse microscopy images; the datasets we utilized to evaluate our framework are annotated by various experts, so the quality of labels and annotation practices may vary; and different cell densities for datasets may cause disparities in performance. Consequently, a strategy to train a versatile model via our one-stage framework that could mitigate the gap and generalize to all datasets deserves future exploration.
References
- Akram et al. [2016] Saad Ullah Akram, Juho Kannala, Lauri Eklund, and Janne Heikkilä. Joint cell segmentation and tracking using cell proposals. In 2016 IEEE 13th International Symposium on Biomedical Imaging (ISBI), pages 920–924, 2016.
- Akram et al. [2017] Saad Ullah Akram, Juho Kannala, Lauri Eklund, and Janne Heikkilä. Cell tracking via proposal generation and selection. arXiv preprint arXiv:1705.03386, 2017.
- Arbelle et al. [2018] Assaf Arbelle, Jose Reyes, Jia-Yun Chen, Galit Lahav, and Tammy Riklin Raviv. A probabilistic approach to joint cell tracking and segmentation in high-throughput microscopy videos. Medical image analysis, pages 140–152, 2018.
- Babaeizadeh et al. [2020] Mohammad Babaeizadeh, Mohammad Taghi Saffar, Suraj Nair, Sergey Levine, Chelsea Finn, and Dumitru Erhan. Fitvid: Overfitting in pixel-level video prediction. arXiv preprint arXiv:2106.13195, 2020.
- Bao et al. [2021] Rina Bao, Noor M Al-Shakarji, Filiz Bunyak, and Kannappan Palaniappan. Dmnet: Dual-stream marker guided deep network for dense cell segmentation and lineage tracking. In Proceedings of the IEEE/CVF International Conference on Computer Vision, pages 3361–3370, 2021.
- Ben-Haim and Riklin-Raviv [2022] Tal Ben-Haim and Tammy Riklin-Raviv. Graph neural network for cell tracking in microscopy videos. In Proceedings of the European Conference on Computer Vision, pages 610–626. Springer, 2022.
- Bensch and Ronneberger [2015] Robert Bensch and Olaf Ronneberger. Cell segmentation and tracking in phase contrast images using graph cut with asymmetric boundary costs. In 2015 IEEE 12th International Symposium on Biomedical Imaging (ISBI), pages 1220–1223, 2015.
- Bise et al. [2011] Ryoma Bise, Zhaozheng Yin, and Takeo Kanade. Reliable cell tracking by global data association. In 2011 IEEE International Symposium on Biomedical Imaging: From Nano to Macro, pages 1004–1010, 2011.
- Bise et al. [2013] Ryoma Bise, Yoshitaka Maeda, Mee-hae Kim, and Masahiro Kino-Oka. Cell tracking under high confluency conditions by candidate cell region detection-based-association approach. Biomedical Engineering, pages 1004–1010, 2013.
- Bochinski et al. [2017] Erik Bochinski, Volker Eiselein, and Thomas Sikora. High-speed tracking-by-detection without using image information. In 2017 14th IEEE International Conference on Advanced Video and Signal Based Surveillance, pages 1–6, 2017.
- Bruhn et al. [2005] Andres Bruhn, Joachim Weickert, and Christoph Schnörr. Lucas/kanade meets horn/schunck: Combining local and global optic flow methods. International Journal of Computer Vision, pages 211–231, 2005.
- Chang et al. [2017] Yuan-Hsiang Chang, Hideo Yokota, Kuniya Abe, Chia-Tong Tang, and Ming-Dar Tasi. Automated detection and tracking of cell clusters in time-lapse fluorescence microscopy images. Journal of Medical and Biological Engineering, pages 18–25, 2017.
- Chen [2021] Mei Chen. Chapter 5 - cell tracking in time-lapse microscopy image sequences. In Computer Vision for Microscopy Image Analysis, pages 101–129. Academic Press, 2021.
- Chen et al. [2021] Yuqian Chen, Yang Song, Chaoyi Zhang, Fan Zhang, Lauren O’Donnell, Wojciech Chrzanowski, and Weidong Cai. Celltrack r-cnn: A novel end-to-end deep neural network for cell segmentation and tracking in microscopy images. In 2021 IEEE 18th International Symposium on Biomedical Imaging, pages 779–782. IEEE, 2021.
- Doersch et al. [2022] Carl Doersch, Ankush Gupta, Larisa Markeeva, Adria Recasens, Lucas Smaira, Yusuf Aytar, Joao Carreira, Andrew Zisserman, and Yi Yang. TAP-vid: A benchmark for tracking any point in a video. Advances in Neural Information Processing Systems, pages 13610–13626, 2022.
- Dosovitskiy et al. [2015] Alexey Dosovitskiy, Philipp Fischer, Eddy Ilg, Philip Hausser, Caner Hazirbas, Vladimir Golkov, Patrick Van Der Smagt, Daniel Cremers, and Thomas Brox. Flownet: Learning optical flow with convolutional networks. In Proceedings of the IEEE International Conference on Computer Vision, pages 2758–2766, 2015.
- Eccles et al. [2005] Suzanne A Eccles, Carol Box, and William Court. Cell migration/invasion assays and their application in cancer drug discovery. Biotechnology annual review, pages 391–421, 2005.
- Emami et al. [2021] Neda Emami, Zahra Sedaei, and Reza Ferdousi. Computerized cell tracking: Current methods, tools and challenges. Visual Informatics, pages 1–13, 2021.
- Emre Akbas et al. [2018] Cem Emre Akbas, Vladimir Ulman, Martin Maska, Florian Jug, and Michal Kozubek. Automatic fusion of segmentation and tracking labels. In Proceedings of the European Conference on Computer Vision Workshops, 2018.
- Girkin and Carvalho [2018] John M Girkin and Mariana Torres Carvalho. The light-sheet microscopy revolution. Journal of Optics, page 053002, 2018.
- Gómez-de Mariscal et al. [2024] Estibaliz Gómez-de Mariscal, Hanna Grobe, Joanna W Pylvänäinen, Laura Xénard, Ricardo Henriques, Jean-Yves Tinevez, and Guillaume Jacquemet. Celltrackscolab is a platform that enables compilation, analysis, and exploration of cell tracking data. Plos Biology, 22(8):e3002740, 2024.
- Harley et al. [2022] Adam W Harley, Zhaoyuan Fang, and Katerina Fragkiadaki. Particle video revisited: Tracking through occlusions using point trajectories. In Proceedings of the European Conference on Computer Vision, 2022.
- Hayashida and Bise [2019] Junya Hayashida and Ryoma Bise. Cell tracking with deep learning for cell detection and motion estimation in low-frame-rate. In Medical Image Computing and Computer Assisted Intervention, pages 397–405. Springer, 2019.
- Hayashida et al. [2020] Junya Hayashida, Kazuya Nishimura, and Ryoma Bise. Mpm: Joint representation of motion and position map for cell tracking. In The IEEE Conference on Computer Vision and Pattern Recognition, 2020.
- Hayashida et al. [2022] Junya Hayashida, Kazuya Nishimura, and Ryoma Bise. Consistent cell tracking in multi-frames with spatio-temporal context by object-level warping loss. In Proceedings of the IEEE/CVF Winter Conference on Applications of Computer Vision, pages 1727–1736, 2022.
- Hirose et al. [2017] Osamu Hirose, Shotaro Kawaguchi, Terumasa Tokunaga, Yu Toyoshima, Takayuki Teramoto, Sayuri Kuge, Takeshi Ishihara, Yuichi Iino, and Ryo Yoshida. Spf-celltracker: Tracking multiple cells with strongly-correlated moves using a spatial particle filter. IEEE/ACM transactions on computational biology and bioinformatics, pages 1822–1831, 2017.
- Hossain et al. [2018] Mohammed I Hossain, Amirali K Gostar, Alireza Bab-Hadiashar, and Reza Hoseinnezhad. Visual mitosis detection and cell tracking using labeled multi-bernoulli filter. In 2018 21st International Conference on Information Fusion, pages 1–5. IEEE, 2018.
- Ilg et al. [2017] Eddy Ilg, Nikolaus Mayer, Tonmoy Saikia, Margret Keuper, Alexey Dosovitskiy, and Thomas Brox. Flownet 2.0: Evolution of optical flow estimation with deep networks. In Proceedings of the IEEE Conference on Computer Vision and Pattern Recognition, pages 2462–2470, 2017.
- Inoué [1981] Shinya Inoué. Cell division and the mitotic spindle. The Journal of cell biology, pages 131s–147s, 1981.
- Janai et al. [2018] Joel Janai, Fatma Guney, Anurag Ranjan, Michael Black, and Andreas Geiger. Unsupervised learning of multi-frame optical flow with occlusions. In Proceedings of the European Conference on Computer Vision, 2018.
- Karaev et al. [2024a] Nikita Karaev, Iurii Makarov, Jianyuan Wang, Natalia Neverova, Andrea Vedaldi, and Christian Rupprecht. Cotracker3: Simpler and better point tracking by pseudo-labelling real videos. arXiv preprint arXiv:2410.11831, 2024a.
- Karaev et al. [2024b] Nikita Karaev, Ignacio Rocco, Benjamin Graham, Natalia Neverova, Andrea Vedaldi, and Christian Rupprecht. CoTracker: It is better to track together. In Proceedings of the European Conference on Computer Vision, 2024b.
- Ker et al. [2018] Dai Fei Elmer Ker, Sungeun Eom, Sho Sanami, Ryoma Bise, Corinne Pascale, Zhaozheng Yin, Seung-il Huh, Elvira Osuna-Highley, Silvina N Junkers, Casey J Helfrich, et al. Phase contrast time-lapse microscopy datasets with automated and manual cell tracking annotations. Scientific data, 5(1):1–12, 2018.
- Krawczyk [2016] Bartosz Krawczyk. Learning from imbalanced data: open challenges and future directions. Progress in artificial intelligence, pages 221–232, 2016.
- Lewis et al. [2021] Sabrina M Lewis, Marie-Liesse Asselin-Labat, Quan Nguyen, Jean Berthelet, Xiao Tan, Verena C Wimmer, Delphine Merino, Kelly L Rogers, and Shalin H Naik. Spatial omics and multiplexed imaging to explore cancer biology. Nature methods, pages 997–1012, 2021.
- Li et al. [2008] Kang Li, Eric D Miller, Mei Chen, Takeo Kanade, Lee E Weiss, and Phil G Campbell. Cell population tracking and lineage construction with spatiotemporal context. Medical image analysis, pages 546–566, 2008.
- Li et al. [2022] Zhen Li, Cheng-Ze Lu, Jianhua Qin, Chun-Le Guo, and Ming-Ming Cheng. Towards an end-to-end framework for flow-guided video inpainting. In Proceedings of the IEEE/CVF Conference on Computer Vision and Pattern Recognition, pages 17562–17571, 2022.
- Liu et al. [2017] An-An Liu, Yao Lu, Mei Chen, and Yu-Ting Su. Mitosis detection in phase contrast microscopy image sequences of stem cell populations: A critical review. IEEE Transactions on Big Data, pages 443–457, 2017.
- Löffler et al. [2021] Katharina Löffler, Tim Scherr, and Ralf Mikut. A graph-based cell tracking algorithm with few manually tunable parameters and automated segmentation error correction. PloS one, page e0249257, 2021.
- Löffler and Mikut [2022] Katharina Löffler and Ralf Mikut. Embedtrack—simultaneous cell segmentation and tracking through learning offsets and clustering bandwidths. IEEE Access, pages 77147–77157, 2022.
- Magnusson and Jaldén [2015] Klas EG Magnusson and Joakim Jaldén. Tracking of non-brownian particles using the viterbi algorithm. In 2015 IEEE 12th International Symposium on Biomedical Imaging (ISBI), pages 380–384. IEEE, 2015.
- Magnusson et al. [2015] Klas E. G. Magnusson, Joakim Jaldén, Penney M. Gilbert, and Helen M. Blau. Global linking of cell tracks using the viterbi algorithm. IEEE Transactions on Medical Imaging, pages 911–929, 2015.
- Maška et al. [2023] Martin Maška, Vladimír Ulman, Pablo Delgado-Rodriguez, Estibaliz Gómez-de Mariscal, Tereza Nečasová, Fidel A Guerrero Peña, Tsang Ing Ren, Elliot M Meyerowitz, Tim Scherr, Katharina Löffler, et al. The cell tracking challenge: 10 years of objective benchmarking. Nature Methods, pages 1010–1020, 2023.
- Matula et al. [2015] Pavel Matula, Martin Maška, Dmitry V Sorokin, Petr Matula, Carlos Ortiz-de Solórzano, and Michal Kozubek. Cell tracking accuracy measurement based on comparison of acyclic oriented graphs. PloS one, page e0144959, 2015.
- Moen et al. [2019] Erick Moen, Enrico Borba, Geneva Miller, Morgan Schwartz, Dylan Bannon, Nora Koe, Isabella Camplisson, Daniel Kyme, Cole Pavelchek, Tyler Price, et al. Accurate cell tracking and lineage construction in live-cell imaging experiments with deep learning. Biorxiv, page 803205, 2019.
- Nishimura et al. [2020] Kazuya Nishimura, Junya Hayashida, Chenyang Wang, Dai Fei Elmer Ker, and Ryoma Bise. Weakly-supervised cell tracking via backward-and-forward propagation. In Proceedings of the European Conference on Computer Vision, pages 104–121. Springer, 2020.
- Padfield et al. [2011] Dirk Padfield, Jens Rittscher, and Badrinath Roysam. Coupled minimum-cost flow cell tracking for high-throughput quantitative analysis. Medical image analysis, pages 650–668, 2011.
- Payer et al. [2018] Christian Payer, Darko Štern, Thomas Neff, Horst Bischof, and Martin Urschler. Instance segmentation and tracking with cosine embeddings and recurrent hourglass networks. In International Conference on Medical Image Computing and Computer-Assisted Intervention, pages 3–11. Springer, 2018.
- Pena et al. [2020] Fidel A Guerrero Pena, Pedro D Marrero Fernandez, Paul T Tarr, Tsang Ing Ren, Elliot M Meyerowitz, and Alexandre Cunha. J regularization improves imbalanced multiclass segmentation. In 2020 IEEE 17th International Symposium on Biomedical Imaging, pages 1–5. IEEE, 2020.
- Rempfler et al. [2017] Markus Rempfler, Sanjeev Kumar, Valentin Stierle, Philipp Paulitschke, Bjoern Andres, and Bjoern H Menze. Cell lineage tracing in lens-free microscopy videos. In Medical Image Computing and Computer-Assisted Intervention- MICCAI 2017: 20th International Conference, Quebec City, QC, Canada, September 11-13, 2017, Proceedings, Part II 20, pages 3–11. Springer, 2017.
- Rodriguez-Porcel et al. [2012] Martin Rodriguez-Porcel, Marvin W Kronenberg, Timothy D Henry, Jay H Traverse, Carl J Pepine, Stephen G Ellis, James T Willerson, Lemuel A Moyé, and Robert D Simari. Cell tracking and the development of cell-based therapies: a view from the cardiovascular cell therapy research network. JACC: Cardiovascular Imaging, pages 559–565, 2012.
- Scherr et al. [2020] Tim Scherr, Katharina Löffler, Moritz Böhland, and Ralf Mikut. Cell segmentation and tracking using cnn-based distance predictions and a graph-based matching strategy. PLoS One, page e0243219, 2020.
- Seidel et al. [2021] Roman Seidel, André Apitzsch, and Gangolf Hirtz. Omniflow: Human omnidirectional optical flow. In Proceedings of the IEEE/CVF Conference on Computer Vision and Pattern Recognition, pages 3678–3681, 2021.
- Smal et al. [2006] Ihor Smal, Wiro Niessen, and Erik Meijering. Bayesian tracking for fluorescence microscopic imaging. In 3rd IEEE International Symposium on Biomedical Imaging: Nano to Macro, 2006., pages 550–553. IEEE, 2006.
- Soelistyo et al. [2023] Christopher J Soelistyo, Kristina Ulicna, and Alan R Lowe. Machine learning enhanced cell tracking. Frontiers in Bioinformatics, 3:1228989, 2023.
- Stegmaier and Mikut [2017] Johannes Stegmaier and Ralf Mikut. Fuzzy-based propagation of prior knowledge to improve large-scale image analysis pipelines. Plos one, page e0187535, 2017.
- Stringer et al. [2021] Carsen Stringer, Tim Wang, Michalis Michaelos, and Marius Pachitariu. Cellpose: a generalist algorithm for cellular segmentation. Nature methods, pages 100–106, 2021.
- Sun et al. [2018] Deqing Sun, Xiaodong Yang, Ming-Yu Liu, and Jan Kautz. Pwc-net: Cnns for optical flow using pyramid, warping, and cost volume. In Proceedings of the IEEE conference on computer vision and pattern recognition, pages 8934–8943, 2018.
- Teed and Deng [2020] Zachary Teed and Jia Deng. Raft: Recurrent all-pairs field transforms for optical flow. In Proceedings of the European Conference on Computer Vision, pages 402–419. Springer, 2020.
- Türetken et al. [2016] Engin Türetken, Xinchao Wang, Carlos J Becker, Carsten Haubold, and Pascal Fua. Network flow integer programming to track elliptical cells in time-lapse sequences. IEEE Transactions on Medical Imaging, pages 942–951, 2016.
- Ulicna et al. [2021] Kristina Ulicna, Giulia Vallardi, Guillaume Charras, and Alan R Lowe. Automated deep lineage tree analysis using a bayesian single cell tracking approach. Frontiers in Computer Science, 3:734559, 2021.
- Ulman et al. [2017] Vladimír Ulman, Martin Maška, Klas EG Magnusson, Olaf Ronneberger, Carsten Haubold, Nathalie Harder, Pavel Matula, Petr Matula, David Svoboda, Miroslav Radojevic, et al. An objective comparison of cell-tracking algorithms. Nature methods, pages 1141–1152, 2017.
- Vaswani et al. [2017] Ashish Vaswani, Noam Shazeer, Niki Parmar, Jakob Uszkoreit, Llion Jones, Aidan N Gomez, Ł ukasz Kaiser, and Illia Polosukhin. Attention is all you need. In Advances in Neural Information Processing Systems. Curran Associates, Inc., 2017.
- Wang et al. [2023] Qianqian Wang, Yen-Yu Chang, Ruojin Cai, Zhengqi Li, Bharath Hariharan, Aleksander Holynski, and Noah Snavely. Tracking everything everywhere all at once. In Proceedings of the IEEE/CVF International Conference on Computer Vision, 2023.
- Weigert et al. [2020] Martin Weigert, Uwe Schmidt, Robert Haase, Ko Sugawara, and Gene Myers. Star-convex polyhedra for 3d object detection and segmentation in microscopy. In Proceedings of the IEEE/CVF Winter Conference on Applications of Computer Vision, pages 3666–3673, 2020.
- Xu et al. [2017] Jia Xu, René Ranftl, and Vladlen Koltun. Accurate optical flow via direct cost volume processing. In Proceedings of the IEEE Conference on Computer Vision and Pattern Recognition, pages 1289–1297, 2017.
- Xu et al. [2019] Jiarui Xu, Yue Cao, Zheng Zhang, and Han Hu. Spatial-temporal relation networks for multi-object tracking. In Proceedings of the IEEE/CVF international conference on computer vision, pages 3988–3998, 2019.
- Yang et al. [2005] Fuxing Yang, Michael A Mackey, Fiorenza Ianzini, Greg Gallardo, and Milan Sonka. Cell segmentation, tracking, and mitosis detection using temporal context. In International Conference on Medical Image Computing and Computer-Assisted Intervention, pages 302–309. Springer, 2005.
- Yang et al. [2023] Hujun Yang, Zhongyang Wang, Xinyao Liu, Chuangang Li, Junchang Xin, and Zhiqiong Wang. Deep learning in medical image super resolution: a review. Applied Intelligence, pages 20891–20916, 2023.
- Yudistira et al. [2020] Novanto Yudistira, Muthusubash Kavitha, Takeshi Itabashi, Atsuko H Iwane, and Takio Kurita. Prediction of sequential organelles localization under imbalance using a balanced deep u-net. Scientific reports, page 2626, 2020.
- Zhai et al. [2021] Mingliang Zhai, Xuezhi Xiang, Ning Lv, and Xiangdong Kong. Optical flow and scene flow estimation: A survey. Pattern Recognition, page 107861, 2021.
- Zhao et al. [2020] Shengyu Zhao, Tingfung Lau, Ji Luo, Eric I-Chao Chang, and Yan Xu. Unsupervised 3d end-to-end medical image registration with volume tweening network. IEEE Journal of Biomedical and Health Informatics, pages 1394–1404, 2020.
- Zheng et al. [2023] Yang Zheng, Adam W. Harley, Bokui Shen, Gordon Wetzstein, and Leonidas J. Guibas. Pointodyssey: A large-scale synthetic dataset for long-term point tracking. In Proceedings of the IEEE/CVF International Conference on Computer Vision, 2023.
- Zhou et al. [2019] Zibin Zhou, Fei Wang, Wenjuan Xi, Huaying Chen, Peng Gao, and Chengkang He. Joint multi-frame detection and segmentation for multi-cell tracking. In Image and Graphics: 10th International Conference, ICIG 2019, Beijing, China, August 23–25, 2019, Proceedings, Part II 10, pages 435–446. Springer, 2019.
Supplementary Material
This supplementary material complements the main manuscript by providing detailed information and additional support. It is structured as follows:
Appendix A: Additional Related Work
- Provides more related work about computing visual similarity and iterative updates proposed by RAFT.
Appendix B: Dataset Details
- Provides more detailed information and analysis on the ISBI and DeepCell datasets we utilized.
Appendix C: Experiment Details
- Offers the training and optimizer configuration details and evaluation metrics calculation details.
Appendix D: Additional Qualitative Results
- Provides more qualitative results (visualization) on detailed cell division events.
Appendix E: Additional Ablations
- Shows the effectiveness of adaptive event-guided sampling, cell joint tracking structure, and different feature strides in our proposed CAP framework.
Appendix A Additional Related Work
Optical flow refers to the pattern of apparent motion of objects, surfaces, or edges in a visual scene caused by the relative movement between an observer and the scene. In the natural imaging field, the optical flow algorithms, methods for estimating per-pixel motion in images [71], were studied through the lens of the color constancy equation [11, 30]. However, with the advancement in the deep learning field, more modern approaches [58], starting from FlowNet [16, 28] and DCFlow [66], introduced a 4D cost volume computation method and have shifted towards leveraging deep learning for high-accuracy optical flow estimation.
RAFT [59] is introduced by Teed and Deng, which further refined the DCFlow approach by incorporating incremental flow updates based on 4D correlation volumes constructed for computing the similarity between all pairs of pixels across two images [22], enabling the model to handle large displacements and complex motion patterns effectively. The model iteratively updates the flow field using a recurrent unit that performs lookups on the correlation volumes, leading to precise motion estimation [53].
A.1 Computing Visual Similarity
A.1.1 Correlation Volume
Given two feature maps and with output -dimensions, which are features extracted from two input images and , by feature extractor :
| (7) |
RAFT computes a 4D correlation volume that captures the similarity between all pairs of pixels across the two images. The correlation between a pixel at position in and a pixel at position in is calculated as the dot product of their feature vectors:
| (8) | ||||
The correlation volume is a 4D tensor of dimensions , where and are respectively the height and width of feature maps s.
A.1.2 Correlation Pyramid
RAFT constructs a correlation pyramid by applying average pooling to the last two dimensions of the 4D correlation volume to capture multi-scale feature information. Specifically, this pooling is performed with kernel sizes of , , and , and a set of multi-scale correlation volumes is generated. Thus, each volume in the pyramid has dimensions .
A.2 Iterative Updates
The update operator estimates a sequence of flow estimations with initializing the start point . For each iteration, it produces as the direction that should be applied to the current estimation:
| (9) |
Specifically, given the current flow estimation , the correlation volume pyramid is retrieved and undergoes processing through two convolutional layers to extract relevant information. The updated information is comprised of correlation, flow, and context features and is updated over time as a feature map concatenation.
Appendix B Dataset Details
B.1 ISBI Dataset
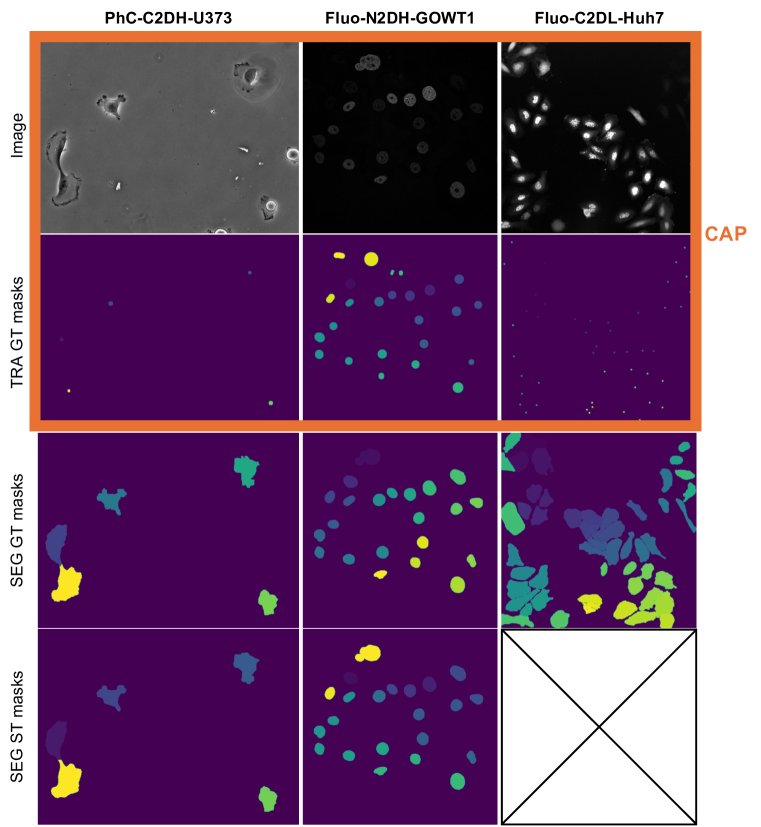
To support the claim in Sec. 4.2, Fig. 6 illustrates datasets we leveraged, PhC-C2DH-U373, Fluo-N2DH-GOWT1, and Fluo-C2DL-Huh7 [43, 62], with the difference between tracking (TRA) GT mask, segmentation (SEG) GT, and segmentation (SEG) ST if available. No segmentation ST is available specific to dataset Fluo-C2DL-Huh7. We observe that SEG GT and ST are much more refined and high-quality than TRA GT masks, requiring more resources and manpower. Fig. 6 also demonstrates the comparison of data annotation requirements between the previous works and our framework CAP that, instead of previous works leveraging all TRA GT masks, segmentation GT, and ST if available, CAP utilizes the TRA GT masks. Thus, in addition to being a highly efficient framework for inference time, the CAP also excels in efficiency with respect to both the quality and quantity of labels required, which is attributed to the one-stage characteristic of the framework.
Furthermore, detailed information on data collection and the characteristics of each dataset are described below:
-
•
The PhC-C2DH-U373 dataset comprises active glioblastoma-astrocytoma U373 cells on a polyacrylamide substrate. Each sequence is captured by a Nikon microscope with an object lens Plan Fluor DLL 20x/0.5 for a relatively long duration of 15 minutes, totaling frames with the size of . The cells are relatively sparse in frames. The distinct feature of this dataset, compared to others, is its higher grayscale background.
-
•
Dataset Fluo-N2DH-GOWT1 documents the activity of GFP-GOWT1 mouse stem cells over a 5-minute period as observed by Leica TCS SP5 microscope with objective lens Plan-Apochromat 63x/1.4 (oil), segmented into frames with a size of per sequence. The target cells for tracking are notably active in cell events and exhibit a relatively high density within the frames.
-
•
Fluo-C2DL-Huh7 is a dataset of human hepatocarcinoma-derived cells expressing the fusion protein YFP-TIA-1. The Nikon Eclipse Ti2 microscope with a lens CFI Plan Apo Lambda 20x/0.75 is the shooting device to capture the cell migration, death, and division in a duration of 15 minutes with frames for each sequence. Cells in this dataset exhibit a relatively low frequency of cell events; However, due to the smaller number of frames recorded within the same time period, some cells exhibit significantly larger movements than others within a sequence. Cells are relatively small and have high density in frames.
B.2 DeepCell Dataset
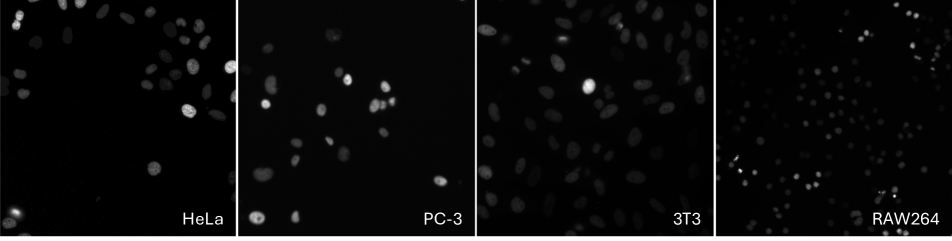
The DynamicNuclearNet Tracking in the DeepCell [45] database consists of HeLa, PC-3, 3T3, and RAW264 datasets, which respectively contains cell type HeLa-S3, PC-3, NIH-3T3, and RAW 264.7, visualized in Fig. 7. These four cell types are mammalian cell lines that were acquired from the American Type Culture Collection [45]. The cells are cultured in Dulbecco’s modified Eagle’s medium (RAW 264.7 and NIH-3T3) or F-12K medium (Hela-S3 and PC-3) supplemented with the necessary drugs, e.g., L-glutamine, penicillin, for all other cells.
There are , , , and evaluation sequences for datasets HeLa, PC-3, 3T3, and RAW264, respectively. In the main manuscript, we report the average metric values for each dataset. In the following additional ablation study Appendix E in this supplementary, we report the detailed metric values for each sequence.
The detailed information on each cell type is illustrated below:
-
•
HeLa includes objects, tracks, and cell divisions, with a relatively high cell density. Each sequence is segmented into frames, lasting minutes, containing cell behaviors, i.e., cell migration and division. For each frame in the sequences, they are with a pixel size .
-
•
PC-3 is the smallest subset in DynamicNuclearNet, with objects, tracks, and only divisions, captured in a -minute duration. All sequences are segmented into frames with a size and pixel size .
-
•
3T3 cells are fibroblasts from mouse embryonic tissue. In this paper, this cell line contributes objects, tracks, and divisions, offering insights into cell growth and cycle dynamics. There are frames in each sequence, and each frame is with a pixel size of .
-
•
The RAW264 cell line, derived from murine macrophages, includes objects, tracks, and divisions, making it the largest subset in our study. Each sequence has frames with a size of with a pixel size of . The cell density in this dataset is the highest, with the smallest cell size.
| Hyperparameter | Value |
|---|---|
| Learning rate scheduler | OneCycleLR |
| Upper learning rate | 5e-4 |
| Weight decay | 1e-5 |
| Epsilon | 1e-8 |
| Optimizer | AdamW |
| Percentage of the cycle increasing the learning rate | 0.05 |
| Cycle momentum | False |
| Annealing strategy | linear |
Appendix C Experiment Details
C.1 Training and Optimizer
C.2 Evaluation Metrics
We follow the evaluation metrics of the operations to correct the situations of merged cells, missing links, wrong links, links with wrong semantics, false positives, and false negatives: (), (), (), (), , and . measure [43, 62] is calculated from AOGM:
| (10) | |||
| (11) |
AOGM is the weighted sum of the executed operations considered as the cost of transforming (, , , , , and ) the computed graph into the reference one. and used in the ISBI cell tracking challenge. The details of , , , , , and are elaborated in the following:
| AEG Sampling | HeLa | PC-3 | 3T3 | RAW264 | |||||||
|---|---|---|---|---|---|---|---|---|---|---|---|
| 01 | 02 | 03 | 04 | 05 | 01 | 02 | 01 | 01 | 02 | 03 | |
| ✗ | 0.898 | 0.908 | 0.883 | 0.921 | 0.878 | 0.952 | 0.924 | 0.829 | 0.804 | 0.828 | 0.843 |
| ✓ | 0.962 | 0.958 | 0.921 | 0.900 | 0.891 | 0.980 | 0.924 | 0.832 | 0.824 | 0.868 | 0.900 |
| Attention | HeLa | PC-3 | 3T3 | RAW264 | ||||||||
|---|---|---|---|---|---|---|---|---|---|---|---|---|
| time | joint | 01 | 02 | 03 | 04 | 05 | 01 | 02 | 01 | 01 | 02 | 03 |
| ✓ | ✗ | 0.853 | 0.949 | 0.861 | 0.921 | 0.906 | 0.925 | 0.947 | 0.812 | 0.805 | 0.845 | 0.821 |
| ✓ | ✓ | 0.962 | 0.958 | 0.921 | 0.900 | 0.891 | 0.980 | 0.924 | 0.832 | 0.824 | 0.868 | 0.900 |
| Stride | HeLa | PC-3 | 3T3 | RAW264 | |||||||
|---|---|---|---|---|---|---|---|---|---|---|---|
| 01 | 02 | 03 | 04 | 05 | 01 | 02 | 01 | 01 | 02 | 03 | |
| 8 | 0.884 | 0.919 | 0.806 | 0.936 | 0.853 | 0.105 | 0.274 | 0.387 | 0.610 | 0.622 | 0.758 |
| 4 | 0.962 | 0.958 | 0.921 | 0.900 | 0.891 | 0.980 | 0.924 | 0.832 | 0.824 | 0.868 | 0.900 |
is the operation for non-split vertices that the computed markers with more than one reference marker assigned.
is the operation for missing links that the cell lineage relations are not indicated.
is the operation for redundant links that the fake cell lineage relations are indicated.
is the operation for altering the edge semantics, that is, the difference in semantics between the reference graph and the induced subgraph.
is the situation in the extra detected objects (i.e., computed markers without any reference marker assigned).
is the situation in the missed objects (i.e., reference markers not assigned to any computed marker).
Appendix D Additional Qualitative Results
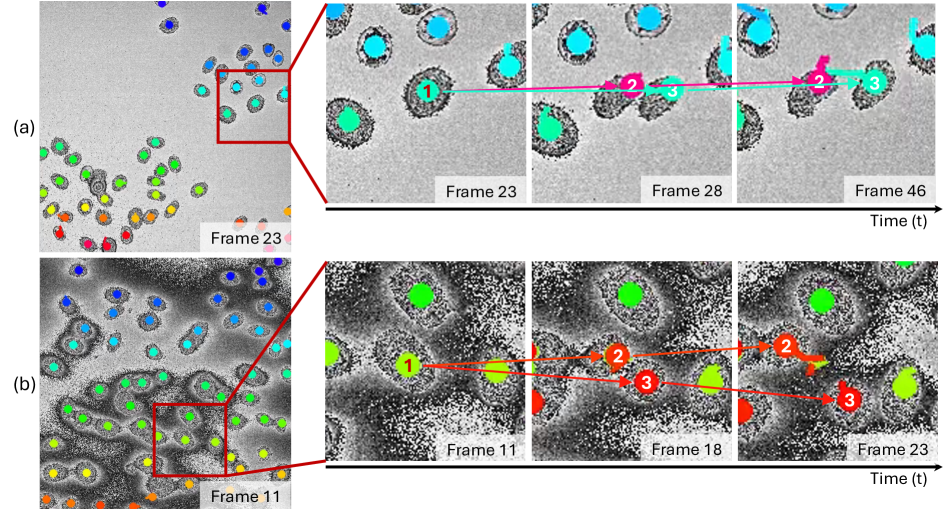
In the main manuscript, we demonstrate the general qualitative result of CAP cell tracking performance. To show more details, i.e., the process of cell division, Fig. 8 demonstrates that CAP is capable of capturing cell division events and continuously tracking the new cells in different datasets in the long term.
Appendix E Additional Ablations
Following the initial assessment of adaptive event-guided (AEG) sampling, cell joint tracking structure, and feature stride on the ISBI dataset in Sec. 4.3, we extended our ablation studies to the DeepCell dataset to validate the generalizability and effectiveness of these components in our CAP framework. The findings, presented in Tab. 6, Tab. 7, and Tab. 8, underscore the significant impact of each component on the framework’s performance across various cell types and conditions.
E.1 Effectiveness of AEG Sampling
Tab. 6 shows that adaptive AEG sampling effectively balances cell event occurrences during training sequences, which enables AEG sampling to generally improve performance across all cell types. For instance, in the HeLa dataset, AEG sampling boosts the scores from to in the best case, indicating a substantial enhancement in the model’s ability to handle imbalanced data effectively. This improvement is consistent across other cell types like PC-3 and RAW264, affirming AEG sampling’s role in optimizing event-centric learning.
E.2 Effectiveness of Cell Joint Tracking
As represented in the main manuscript, we replace the cross-trajectory attention layers with only time attention layers to keep the model size. As illustrated in Tab. 7, the integration of both time and joint attention mechanisms in cell joint tracking significantly enhances tracking accuracy. The dual attention strategy not only improves temporal coherence but also reinforces the relational context between trajectories, evident from the increased scores in datasets such as HeLa, where the combined attention boosts the performance from to in the best cases. This enhancement highlights the importance of sophisticated tracking mechanisms in complex cellular environments.
E.3 Ablation on Feature Stride
The impact of feature stride on model accuracy is depicted in Tab. 8. Reducing the stride from to leads to a marked improvement in the resolution of feature maps, which in turn enhances the model’s predictive accuracy. For example, in the HeLa dataset, reducing the stride results in an increase from to in the best scenarios. This finding suggests that higher resolution features are critical for accurate cell tracking, particularly in datasets with intricate cell dynamics and small cell sizes like 3T3 and RAW264.