The origin of strings and rings in the atomic dynamics of disordered systems
Abstract
It has long been believed that the atomic dynamics in disordered structures, such as undercooled liquids and pre-melted interfaces, are characterized by collective atomic rearrangements in the form of quasi-one-dimensional chains of atomic displacements (strings) and their closed forms (rings). Here, we show by molecular dynamics (MD) simulations that strings do not form by a single collective event. Instead, they are simply MD trajectories of propagating local density perturbations, which we call densitons. The atoms on this trajectory are physically indistinguishable from their environments except for the moving head of the string (densiton). A densiton migrates by either single-atom jumps or a concerted rearrangement of 2-3 atoms. The simulations reveal a remarkable similarity between the strings in disordered and crystalline structures, in which the densitons localize into point defects. This work calls for a significant reinterpretation of the string concept and instead proposes a densiton model of the atomic dynamics.
Department of Physics and Astronomy, MSN 3F3, George Mason University, Fairfax, Virginia 22030, USA
Introduction
The atomic dynamics in fully or partially disordered materials controls many of their properties, such as diffusive mass transport, viscosity, and heat conduction [1, 2, 3, 4, 5]. Despite decades of dedicated research efforts, the atomic dynamics of disordered systems remains one of the least understood phenomena in materials physics. One of the prominent features of such systems is the dynamic heterogeneity in space and time [6, 7, 8, 4, 9, 10, 11, 12, 13]. Namely, the atomic mobility is distributed highly non-uniformly across the system, and this distribution constantly changes over time.
The dynamic heterogeneity has been investigated by several experimental probes [14, 13]. However, the most detailed information about the underlying atomic mechanisms comes from computer simulations. In particular, molecular dynamics (MD) simulations have revealed that atomic displacements often occur in the form of chains, or strings, encompassing a group of atoms whose displacements are such that one atom jumps into the previous location of another [6, 7, 11, 8]. That other atom, in turn, jumps into the previous position of yet another atom, and so on. Occasionally, a string can be closed to itself, forming what is called a ring. Strings and rings were observed in amorphous solids and undercooled glass-forming liquids [6, 7, 8, 4, 9, 10, 11], polymers [4], super-ionic solids [15], disordered grain boundaries [16, 17, 18, 19], phase boundaries [20, 21], dislocation cores [21], and open surfaces [22, 23]. It is generally believed that a string is a quasi-one-dimensional dynamic object representing a collective (also called cooperative or correlated) displacement of a group of atoms [24, 11, 6, 7, 8, 4].
In MD simulations, the strings are revealed by the following procedure [7]. First, mobile atoms are identified by the criterion that their displacements during a chosen time interval lie within the range , where is an average interatomic distance in the system. Here, the lower bound eliminates immobile atoms and the upper bound eliminates multiple atomic hops. The second criterion selects pairs of mobile atoms that remain nearest neighbors of each other during the interval : . Mobile pairs satisfying this criterion and sharing an atom are then joined together into a mobile cluster, which often looks like a string or a ring. (The hyper-parameters in the above criteria are slightly adjusted for each particular system.) The string size measured by this procedure depends on the chosen time interval . In most cases, is set as the position of the maximum of the non-Gaussian parameter as a function of time. Alternatively, is identified with the maximum of the average string length computed as a function of time, which is usually close to [11]. Yet another method identifies with the inflection point on the mean-square displacement (MSD) plot as a function of time, giving a similar value. Typical string length identified by the above criteria varies from to atoms at high temperatures to or more atoms at low temperatures. As an example, Fig. 1 demonstrates a 10-atom string in a disordered grain boundary in copper. In this case, is set to the maximum position ps on the NGP curve.
Statistical properties of strings and rings in diverse materials have been studied in great detail [6, 7, 8, 4, 9, 10, 11]. However, their origin and the formation and growth mechanisms remain poorly understood. The MD simulations reported in this article reveal that strings containing more than 2-3 atoms do not form by a single coordinated/cooperative atomic displacement. Instead, such strings represent computer-generated trajectories of density fluctuations propagating through the material by a series of discrete atomic rearrangements. Such trajectories carry information about the relaxation dynamics of the density fluctuations. However, the present simulations challenge the previously claimed association of the strings with collective displacements of large () atomic groups. That association significantly overestimates the degree of coordination among atomic movements in disordered systems.
Results
Strings in structurally ordered systems
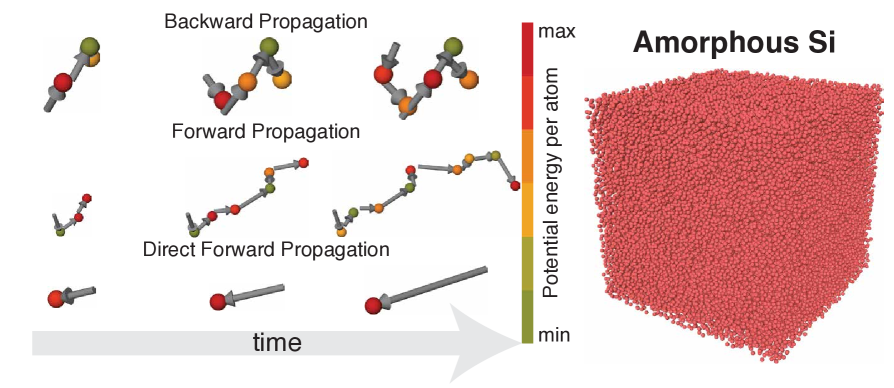
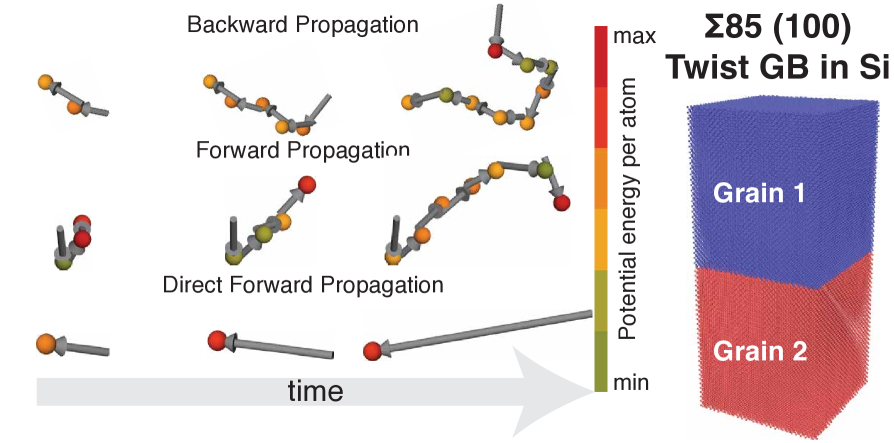
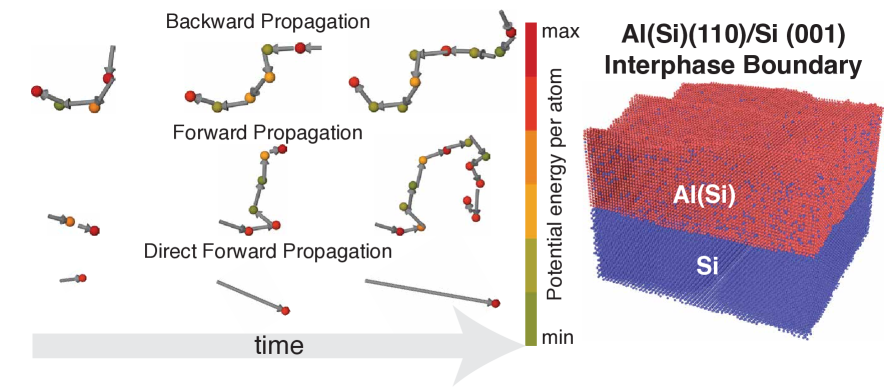
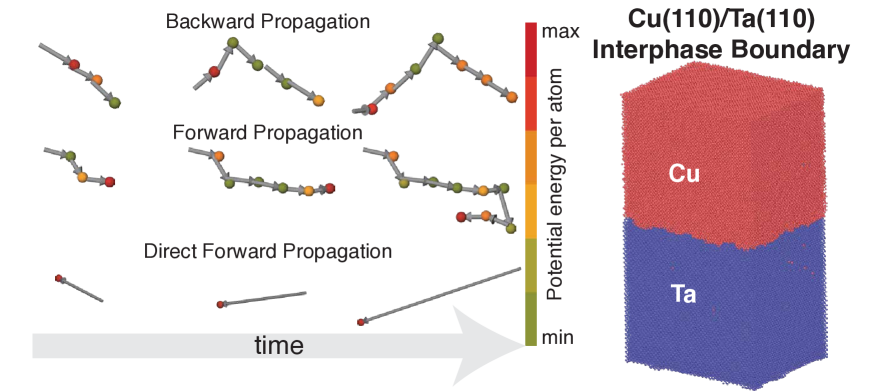
To set the stage for the analysis of atomic dynamics in disordered structures, we start by examining the atomic trajectories during self-diffusion in crystalline solids mediated by vacancies and interstitial atoms. Fig. 2(a) illustrates typical chains of atomic displacements caused by these defects in crystalline Cu. Note that these chains look very similar to the strings widely observed in structurally disordered systems. The images are snapshots of the strings at sequential points in time, showing their growth direction. Each string has a head (the last atom joining the string in the growth direction) and a tail (the first atom that initiated the string). If the string is created by a vacancy, the individual atomic displacements are opposite to the growth direction. If the string is created by an interstitial, the atomic displacements are in the growth direction. We call these growth mechanisms backward propagation and forward propagation, respectively.
It is important to note that the vacancy and the interstitial execute an uncorrelated random walk by a Markov process. After each defect jump, the system has plenty of time to thermalize (de-phase) the atomic trajectories, erasing all memory of all previous jumps. This process is typically described in terms of the transition-state theory [25]. Thus, the strings shown in Fig. 2(a) represent nothing more than computer-generated atomic trajectories caused by the point defect migration. The atoms forming the strings are physically indistinguishable from the surrounding atoms, except for the head atom, which possess excess energy due to its proximity to the defect. This is evident in Fig. 2(a), where the atoms are color-coded by the potential energy. In other words, the only physically distinct part of a string is its moving head. The rest of the string is a ghost object that only exists due to the computer’s ability to label and track individual atoms.
Note that a point defect is associated with a positive (interstitial) or negative (vacancy) local deviation of the atomic density from the background value. We refer to both types of the local excess density as a “densiton”, which can be either positive (e.g., interstitial) or negative (e.g., vacancy). While this term is redundant in the context of crystalline solids, it facilitates the subsequent discussion of strings in disordered systems, in which vacancies and interstitials are not well-defined while the respective density fluctuations play similar roles. In this terminology, we can say that the strings shown in Fig. 2(a) are trajectories of the positive and negative densitons.
A moving positive densiton causes a forward propagation of atomic displacements, while a moving negative densiton causes a backward propagation. Each displacement of a negative densiton is accomplished by an atomic jump in the opposite direction, filling the low-density site and creating a new low-density site (densiton) behind. This is the mechanism of the backward propagation. A displacement of a positive densiton can be a more complex process. At relatively low temperatures, interstitial atoms in Cu form a split dumbbell configuration parallel to directions. A dumbbell jumps by a concerted displacement of three atoms moving the dumbbell center into a nearest-neighboring lattice site with a simultaneous rotation. Thus, the forward propagation caused by a positive densiton occurs by a chain of atomic rearrangements involving a collective displacement of three atoms. At high temperatures, however, thermal fluctuations nearly destroy the close coordination of the three atoms, and the process is better described by a chain of individual atomic jumps.
It is important to recognize that the forward propagation of a string is only possible due to the indirect interstitial (also called interstitialcy) mechanism, in which each displacement of a positive densiton moves a new group of atoms. As a result, each atom in a long string only undergoes a nearest-neighbor displacement. The direct interstitial mechanism, in which a single interstitial atom hops between interstitial positions, does not produce a string. This is illustrated in Fig. 2(a) for a Ta interstitial atom in Cu. Instead of a string, the MD simulation produces a single long arrow pointing to the time-dependent position of the Ta atom. The three atomic mechanisms discussed here are summarized in the conceptual diagram in Fig. 2(b).
Finally, note that the strings in crystalline systems can grow to a very long but finite size. Several mechanisms can stop the growth. A winding trajectory can accidentally cross itself, breaking the string into two parts. Furthermore, if two different trajectories accidentally cross, each of them will be chopped into two parts. In a relatively small system, the maximum string length is on the order of the system dimensions. If the crystal contains both vacancies and interstitials, they can mutually annihilate, terminating two strings.
To summarize the above analysis, the standard algorithm based on the time interval identifies relatively long strings comprising atoms. Such strings do not form by a single collective event. They represent a chain of dynamically uncorrelated atomic rearrangements involving from 1 to 3 atoms. A string grows by the motion of a densiton located at the string’s head. The string is simply the densiton’s trajectory, which is physically indistinguishable from the background except for its head. Depending on the densiton’s sign, the growth occurs by either forward or backward propagation of discrete atomic displacements. The string growth continues as long as the densiton exists. The observation of a moving positive densiton indicates that the atomic displacements propagate by an indirect mechanism.
Strings in structurally disordered systems
We next consider strings in structurally disordered systems. We have studied the formation and growth of strings and rings in undercooled liquids and thermally disordered interfaces such as grain boundaries and interphase boundaries. The materials that we studied included elemental Cu and Si, as well as Al-Si interfaces obtained by simulated vapor deposition and Cu-Ta interfaces obtained by the direct bonding method. Most of the results are presented in the Supplementary Information file. Representative examples are shown in Fig. 3 for strings in a Cu grain boundary and in undercooled Cu liquid. Note the striking similarity with the strings produced by vacancy and interstitial migration in crystalline Cu (cf. Fig. 2(a)). In both ordered and disordered systems, some strings grow by forward propagation of atomic jumps while others grow by backward propagation. In all cases studied here, the atoms forming a string could not be physically distinguished from the surrounding atoms in the MD simulations. (In fully disordered structures, even the moving head of a string could not be reliably identified by our image analysis if the arrows showing the atomic displacements were erased.)
This remarkable similarity strongly suggests that the atomic dynamics in disordered systems are governed by fundamentally similar atomic-level mechanisms to those in crystals. The concept of a vacancy in disordered structures is not well-defined due to the absence of an underlying lattice. However, the observation of back-propagating strings suggests the existence of similar local-low-density structures that can migrate by a vacancy-like mechanism. Namely, one of the nearby atoms jumps into the low-density “cage” and fills it, leaving a similar low-density spot behind. Repeated atomic rearrangements of this type create a chain of atomic displacements in the direction opposite to the low-density propagation (Fig. 2(a)). Recognizing that such vacancy-like low-density structures are not “real” vacancies, we unify both crystalline and disordered cases under the term of a negative densiton.
Similarly, in the absence of a crystalline lattice, interstitials in disordered structures are not well-defined. However, the existence of forward-propagating strings is strong evidence that disordered structures can host similar local-high-density excitations, which we call positive densitons. They can migrate through the system by causing a chain of relatively short () atomic displacements in the forward direction, creating a forward-propagating string. This mechanism is similar to the indirect interstitial migration mechanism in crystalline solids. Other authors also suggested the existence of a high concentration of interstitial-like “defects” in liquid phases with properties similar to those of real interstitials existing in the respective solid phase near the melting point [26, 27].
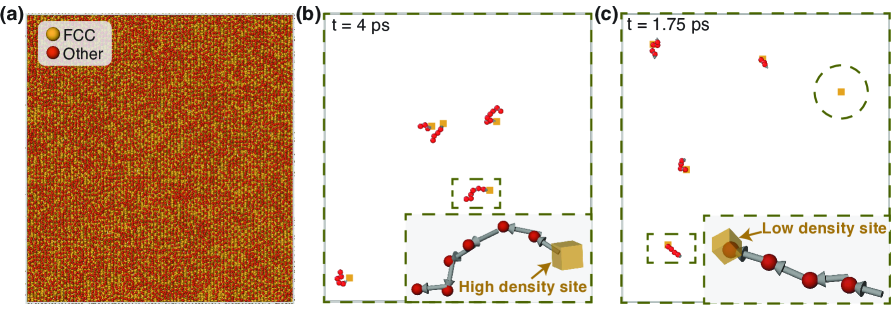
The link between strings and densitons is further demonstrated in Fig. 4. In one test, a few atoms were randomly inserted into a disordered grain boundary, creating a set of high-density spots. In another test, a few atoms were randomly removed from the same grain boundary, creating a set of low-density spots. In other words, we have artificially planted a set of positive or negative densitons into the boundary. In the subsequent MD simulations, most of the positive densitons drifted away from the initial location and created a forward-propagating string. Likewise, most of the negative densitons gave rise to a backward-propagating string. These tests demonstrate that densitons can persist for an extended period of time and migrate by creating strings. In some cases, a negative densiton would not produce a string and would, instead, dissolve in the surrounding structure (Fig. 4(c)). Such cases provide examples of short-lived densitons whose lifetime is shorter than the inverse frequency of atomic jumps during the string growth.
Similar scenarios were earlier observed by Delaye and Limoge [28], who examined static structural relaxations in a Lennard-Jones glass after removing an atom. They found that the displacements of neighboring atoms could be large enough to fill the void and restore the average atomic density. In other cases, the displacements could be small enough to preserve the local excess free volume. In yet another scenario, the relaxation had the form of a “cooperative evolution” involving many atoms. The latter process apparently represented a string nucleation, but its nature was not studied in detail.
Exploring the timescales of string evolution
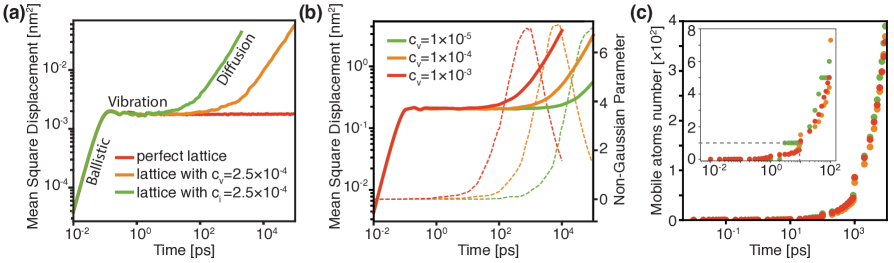
The string growth involves several different time scales. We will discuss them starting with a crystalline system. Fig. 5 displays several log-log plots of the MSD versus time over several orders of magnitude. For the defect-free Cu lattice, the plot is linear with a slope of two in the short time limit. This linear behavior represents the ballistic motion of the atoms. At ps, the plot reaches a local maximum followed by a few oscillations, signaling a dynamic transition from the ballistics to atomic vibrations. The time interval of this transition is approximately ps, which is comparable to the inverse of the Debye frequency of Cu ( Hz at 0 K). This transition is followed by a horizontal segment representing the MSD of atomic vibrations at 1000 K.
For systems with a single point defect, the MSD curve shows an upward deviation from the perfect-lattice behavior when reaches the timescale of string nucleation (i.e., activation of point-defect jumps) (Fig. 5(a)). This time is shorter for an interstitial than for a vacancy due to the lower activation barrier. The horizontal segment on the curve evolves into a shoulder. Since point-defect jumps are dynamically memoryless, the jump activation time is the same as the average time increment of string growth, which we call the jump waiting time . To quantify this time for vacancy-induced strings, we computed MSD curves for three vacancy concentrations. As expected, the vacancy-induced deviation of the MSD curve from the lattice behavior starts earlier as the vacancy concentration increases (Fig. 5(b)). Note, however, this shift of the curves does not mean that the string activation time becomes shorter. Since the vacancies do not interact with each other, does not change. This example demonstrates that the location of the shoulder on the MSD curves does not characterize the string activation time.
To demonstrate this point further, we have computed the average number of vacancy jumps in the system as a function of time for the three vacancy concentrations. While increases with the number of vacancies present in the system, the number of jumps per vacancy, , does not change. In other words, the versus time plots for different collapse into a single master curve representing the true dynamics of a single vacancy (Fig. 5(c)). Using this master curve, we can estimate as the time for which , which is a few picoseconds.
Returning to Fig. 5(b), note that the NGP maximum occurs on a significantly longer timescale than . On this timescale, a vacancy can make over 10 jumps. Moreover, the NGP peak position shifts with the vacancy concentration. Given the previously discussed similarity between the ordered and disordered system, the following conclusions can be made: (1) the time commonly used for string identification is too long () and overlooks the key mechanisms of the string growth, and (2) reflects not only the growth of individual strings but also the degree of disorder in the system. In our terminology, depends not only on the densiton dynamics but also on their concentration. Disentangling the two factors is not an easy task.
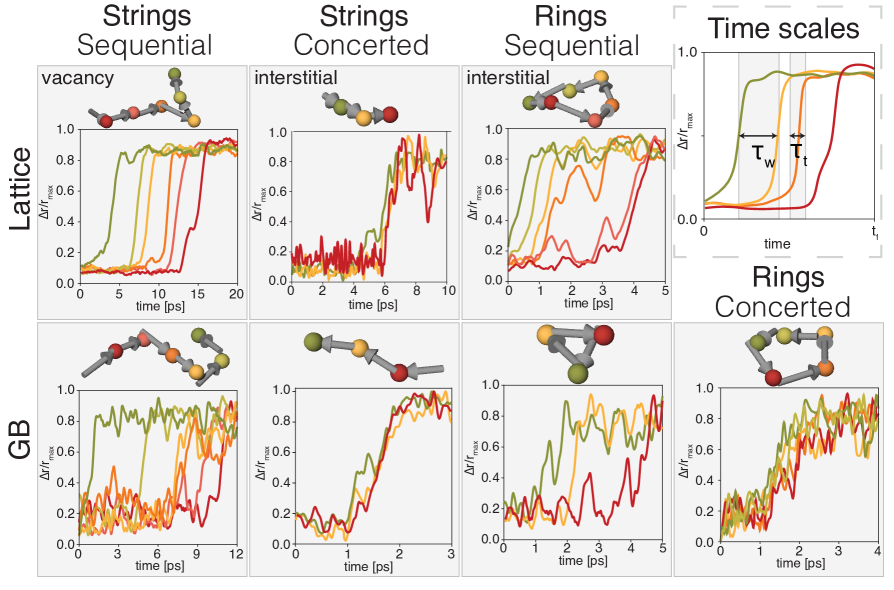
Another relevant timescale is one on which the atomic rearrangements occur at the head of the string. The rearrangement/transition time, which we denote , is significantly shorter than the waiting time . For lattice strings, is roughly on the order of . For concerted atomic rearrangements involving several atoms, is longer but still below . The diagram in the top right corner of Fig. 6 explains the difference between and using a plot of atomic displacements versus time for a set of atoms involved in a string. This graphical format [11, 15, 24] allows one to distinguish between sequential atomic jumps and truly collective events. In the latter case, several curves bunch together into a single transition. Fig. 6 summarizes such plots for both sequential and concerted atomic rearrangements in ordered and disordered systems, highlighting the differences between and . In addition to open strings, Fig. 6 shows rings, which are observed less frequently. Like open strings, rings can also evolve by either a sequence of single-atom jumps or as a single concerted displacement of an atomic group. The bottom right corner in Fig. 6 shows a rare case of a five-atom ring in a grain boundary, which forms by a single concerted atomic displacement.
Discussion
Previous MD simulations of disordered systems were focused on collective statistical metrics characterizing the atomic dynamics on diverse length and time scales. We are aware of only two prior investigations of atomic displacements in individual strings [11, 24]. In [11], the displacements were found to propagate sequentially with occasional collective jumps of small atomic groups called “micro-strings”. However, the string was treated as a physically distinct dynamical object with a “backbone” hosting the micro-strings. Furthermore, the previous studies identified the strings using a timescale on which the strings had grown relatively long and were unlikely to have formed by a single concerted rearrangement of the participating atoms. Because the entire string emerged in the simulation during the time increment , this gave the impression that the atoms had moved collectively.
In the present study, we have focused on a detailed analysis of individual atomic trajectories with small () time increments. We find that strings containing more than a few atoms do not form by a single collective rearrangement. Instead, they grow by a sequence of dynamically uncorrelated increments. Each increment occurs by a local atomic rearrangement at the head of the string. The rearrangement involves either a single-atom jump or a concerted displacement of 2-3 atoms. In either case, the local rearrangement happens very fast (on the timescale) while the waiting time between sequential rearrangements is significantly longer. Importantly, the part of the string left behind the moving head is fully relaxed and physically indistinguishable from the surrounding atoms. It can only be revealed by tracking the atoms in MD simulations. Only the moving head of the string is physically distinct due to its excess energy and (positive or negative) local free volume.
The simulations have revealed a remarkable similarity between the strings and rings in disordered structures and the atomic trajectories created by vacancy and interstitial migration in crystalline solids. To reflect this similarity, we describe the string growth in both ordered and disordered structures as migration of positive (interstitial-like) or negative (vacancy-like) densitons. The densiton sign can be determined in MD simulations from the direction of the atomic displacements relative to the direction of the densiton migration (i.e., the direction of string growth). We have shown that positive densitons migrate by forward propagation while negative densitons migrate by backward propagation. The strings created by moving densitons in disordered structures are analogs to the MD trajectories of point defects in crystals.
Densitons have a distribution of lifetimes. Short-lived densitons delocalize before they can migrate. Densitons with a longer life (persistent densitons) migrate and can create relatively long strings before they delocalize or encounter another densiton of the opposite sign. Interpretation of the average string length is not straightforward because it involves several factors. On one hand, depends on the densitons’ lifetime, which is a physical factor. On the other hand, MD simulations capture purely computational string-truncation processes such as their mutual intersections and self-intersections. Nevertheless, the observation of strings is useful as a means of locating the densitons and establishing their sign.
The present simulations call for a significant reinterpretation of the strings and rings in disordered structures as simply MD trajectories of moving densitons and not physically distinct dynamic objects formed by a collective atomic rearrangement. Instead of focusing on the strings, the atomic dynamics can be better described by a random walk of positive and negative densitons populating the system and exhibiting a spectrum of mobilities and lifetimes. Fluctuations in the densiton concentration cause the dynamic heterogeneity. The densiton migration can be responsible for the atomic self-diffusion and possibly other transport properties of disordered systems.
Methods
The MD simulations were performed using the GPU-accelerated implementation of the Large-scale Atomic/Molecular Massively Parallel Simulator (LAMMPS) [29]. Visualization and analysis of atomic configurations utilized the Open Visualization Tool (OVITO) [30]. The MD integration time step was set to 0.1 fs. Atomic interactions were described using the embedded atom method interatomic potential for Cu [31], the modified Tersoff potential for Si [32], the angular embedded atom potential for Al–Si [33], and angular-dependent interatomic potential for the Cu–Ta system [34].
The single-crystalline Cu simulations used a fully periodic cubic supercell whose size varied between 3.6 nm and 10.8 nm, depending on the simulation goal. Vacancies were created by randomly removing atoms to achieve the target vacancy concentration. To study interstitial defects, a single Cu or Ta interstitial atom was introduced. Multiple interstitials were not created to avoid their clustering. The Si simulations utilized a nm fully periodic cubic supercell. A single vacancy or a single interstitial atom were introduced into the system, creating a point-defect concentration of . The amorphous Si model was constructed in a nm supercell following the protocol described in Ref. [35].
A Cu bicrystal with a tilt grain boundary was generated using the -surface method [36]. The bicrystal had the approximate dimensions of nm3. Periodic boundary conditions were applied in lateral directions parallel to the boundary plane, while free surfaces were imposed along the normal direction. To preserve the periodicity of the grain boundary structure, the system dimensions were slightly adjusted to ensure an integer number of unit cells within the simulation box. A Si bicrystal containing a twist grain boundary had similar boundary conditions and was also generated using the -surface method [36]. The model dimensions were nm3. The atomic displacements were studied in the NVT ensemble.
An Al(110)/Si(001) interphase boundary was constructed by a vapor deposition simulation. A layer of Al0.905(Si0.095) solution was deposited onto a Si(001) substrate from a gas phase at the temperature of 648 K. The substrate dimensions were nm3. Details of the vapor deposition can be found in Ref. [37]. The layer composition and temperature were chosen so as to keep the alloy within the single-phase region on the left of the solvus line on the Al-Si phase diagram [20] computed with the interatomic potential. Diffusion processes were investigated in the NVT ensemble.
A Cu(110)/Ta(110) interphase boundary was created by bonding Cu and Ta single crystals with the desired crystallographic orientations. The system was equilibrated by semi-grand canonical Monte Carlo simulations using the parallel Monte Carlo code ParaGrandMC [38]. Careful consideration was given to minimizing the lattice mismatch between the two bonded materials. The cross-sectional area of the interface was nm2. Periodic boundary conditions were applied in the in-plane directions with surface boundary conditions normal to the interface. The system was equilibrated by isothermal anneals at various temperatures. Interface diffusion was studied by NVE MD simulations with various durations up to 20 ns.
The Debye frequency of Cu was estimated from using the Debye temperature of K [39].
Data availability.
The data supporting the findings of this study are available in the Supplementary Information file or from the corresponding author upon reasonable request. The computer simulation part of this research used the publicly available codes LAMMPS and OVITO. The routine computer scripts controlling the execution of the calculations are not central to this work but are available from the corresponding author upon reasonable request.
References
- Derlet et al. [2021] P. Derlet, H. Bocquet, R. Maaß, Viscosity and transport in a model fragile metallic glass, Physical Review Materials 5 (2021) 125601.
- Derlet [2020] P. M. Derlet, Correlated disorder in a model binary glass through a local SU(2) bonding topology, Physical Review Materials 4 (2020) 125601–.
- Derlet and Maaß [2018] P. M. Derlet, R. Maaß, Thermally-activated stress relaxation in a model amorphous solid and the formation of a system-spanning shear event, Acta Materialia 143 (2018) 205–213.
- Zhang et al. [2021] H. Zhang, X. Wang, H.-B. Yu, J. F. Douglas, Dynamic heterogeneity, cooperative motion, and Johari–Goldstein relaxation in a metallic glass-forming material exhibiting a fragile-to-strong transition, The European Physical Journal E 44 (2021) 1–30.
- Berthier and Biroli [2011] L. Berthier, G. Biroli, Theoretical perspective on the glass transition and amorphous materials, Rev. Mod. Phys. 83 (2011) 587–645.
- Donati et al. [1999] C. Donati, S. C. Glotzer, P. H. Poole, W. Kob, S. J. Plimpton, Spatial correlations of mobility and immobility in a glass-forming Lennard-Jones liquid, Phys. Rev. B 60 (1999) 3107–3119.
- Donati et al. [1998] C. Donati, J. F. Douglas, W. Kob, S. J. Plimpton, P. H. Poole, S. C. Glotzer, Stringlike cooperative motion in a supercooled liquid, Phys. Rev. Lett. 80 (1998) 2338–2341.
- Kob et al. [1997] W. Kob, C. Donati, S. J. Plimpton, P. H. Poole, S. C. Glotzer, Dynamical heterogeneities in a supercooled Lennard-Jones liquid, Phys. Rev. Lett. 79 (1997) 2827–2830.
- Chandler and Garrahan [2010] D. Chandler, J. P. Garrahan, Dynamics on the way to forming glass: Bubbles in space-time, Annual review of physical chemistry 61 (2010) 191–217.
- Jung et al. [2005] Y. Jung, J. P. Garrahan, D. Chandler, Dynamical exchanges in facilitated models of supercooled liquids, The Journal of Chemical Physics 123 (2005) 084509.
- Gebremichael et al. [2004] Y. Gebremichael, M. Vogel, S. C. Glotzer, Particle dynamics and the development of string-like motion in a simulated monoatomic supercooled liquid, The Journal of Chemical Physics 120 (2004) 4415–4427.
- Karmakar et al. [2009] S. Karmakar, C. Dasgupta, S. Sastry, Growing length and time scales in glass-forming liquids, Proceedings of the National Academy of Sciences 106 (2009) 3675–3679.
- Cui et al. [2001] B. Cui, B. Lin, S. A. Rice, Dynamical heterogeneity in a dense quasi-two-dimensional colloidal liquid, The Journal of Chemical Physics 114 (2001) 9142–9155.
- Marcus et al. [1999] A. H. Marcus, J. Schofield, S. A. Rice, Experimental observations of non-Gaussian behavior and stringlike cooperative dynamics in concentrated quasi-two-dimensional colloidal liquids, Physical Review E 60 (1999) 5725–5736.
- Annamareddy and Eapen [2017] A. Annamareddy, J. Eapen, Low dimensional string-like relaxation underpins superionic conduction in fluorites and related structures, Scientific reports 7 (2017) 1–12.
- Warren et al. [2009] J. A. Warren, J. F. Douglas, H. Zhang, D. J. Srolovitz, Grain boundaries exhibit the dynamics of glass-forming liquids, Proc. Natl. Acad. Sci. U. S. A. 106 (2009) 7735–7740.
- Zhang et al. [2006] H. Zhang, D. J. Srolovitz, J. F. Douglas, J. A. Warren, Characterization of atomic motion governing grain boundary migration, Phys. Rev. B 74 (2006) 115404.
- Chesser and Mishin [2022] I. Chesser, Y. Mishin, Point-defect avalanches mediate grain boundary diffusion, Communications Materials 3 (2022) 90.
- Mishin [2015] Y. Mishin, An atomistic view of grain boundary diffusion, Defect and Diffusion Forum 363 (2015) 1–11 (arXiv:1904.10756).
- Chesser et al. [2023] I. Chesser, R. Koju, A. Vellore, Y. Mishin, Atomistic modeling of metal-nonmetal interphase boundary diffusion, Acta Materialia 257 (2023) 119172.
- Chesser et al. [2024] I. Chesser, R. K. Koju, Y. Mishin, Atomic-level mechanisms of short-circuit diffusion in materials, International journal of materials research 115 (2024) 85–105.
- Zhang et al. [2010] H. Zhang, P. Kalvapalle, J. F. Douglas, String-like collective atomic motion in the interfacial dynamics of nanoparticles, Soft Matter 6 (2010) 5944–5955.
- Salez et al. [2015] T. Salez, J. Salez, K. Dalnoki-Veress, E. Raphaël, J. A. Forrest, Cooperative strings and glassy interfaces, Proceedings of the National Academy of Sciences 112 (2015) 8227–8231.
- Fransson and Erhart [2020] E. Fransson, P. Erhart, Defects from phonons: Atomic transport by concerted motion in simple crystalline metals, Acta Materialia 196 (2020) 770–775.
- Vineyard [1957] G. H. Vineyard, Frequency factors and isotope effects in solid state rate processes, Journal of Physics and Chemistry of Solids 3 (1957) 121–127.
- Nordlund et al. [2005] K. Nordlund, Y. Ashkenazy, R. S. Averback, A. V. Granato, Strings and interstitials in liquids, glasses and crystals, Europhys. Lett. 71 (2005) 625–631.
- Ashkenazy and Averback [2010] Y. Ashkenazy, R. S. Averback, Kinetic stages in the crystallization of deeply undercooled body-centered-cubic and face-centered-cubic metals, Acta Mater. 58 (2010) 524–530.
- Delaye and Limoge [1993] J. M. Delaye, Y. Limoge, Molecular dynamics study of vacancy-like defects in a model glass : static behaviour, J. Phys. I France 3 (1993) 2063–2077.
- Plimpton [1995] S. Plimpton, Fast parallel algorithms for short-range molecular-dynamics, J. Comput. Phys. 117 (1995) 1–19.
- Stukowski [2010] A. Stukowski, Visualization and analysis of atomistic simulation data with OVITO – the open visualization tool, Model. Simul. Mater. Sci. Eng 18 (2010) 015012.
- Mishin et al. [2001] Y. Mishin, M. J. Mehl, D. A. Papaconstantopoulos, A. F. Voter, J. D. Kress, Structural stability and lattice defects in copper: Ab initio, tight-binding and embedded-atom calculations, Phys. Rev. B 63 (2001) 224106.
- Purja Pun and Mishin [2017] G. P. Purja Pun, Y. Mishin, Optimized interatomic potential for silicon and its application to thermal stability of silicene, Phys. Rev. B 95 (2017) 224103.
- Saidi et al. [2014] P. Saidi, T. Frolov, J. J. Hoyt, M. Asta, An angular embedded atom method interatomic potential for the aluminum–silicon system, Modelling and Simulation in Materials Science and Engineering 22 (2014) 055010.
- Purja Pun et al. [2015] G. P. Purja Pun, K. A. Darling, L. J. Kecskes, Y. Mishin, Angular-dependent interatomic potential for the Cu–Ta system and its application to structural stability of nano-crystalline alloys, Acta Mater. 100 (2015) 377–391.
- Moon [2021] J. Moon, Examining normal modes as fundamental heat carriers in amorphous solids: The case of amorphous silicon, Journal of Applied Physics 130 (2021) 055101.
- Mishin and Farkas [1998] Y. Mishin, D. Farkas, Atomistic simulation of 001 symmetrical tilt grain boundaries in NiAl, Philosophical Magazine A 78 (1998) 29–56.
- Li et al. [2024] Y. Li, R. K. Koju, Y. Mishin, Atomistic modeling of diffusion processes at Al (Si)/Si (111) interphase boundaries obtained by vapor deposition, arXiv preprint arXiv:2411.01672 (2024).
- Yamakov [2016] V. Yamakov, The ParaGrandMC code can be obtained from the NASA Software Catalog: https://software.nasa.gov/software/LAR-18773-1, NASA/CR–2016-219202 (2016). URL: https://software.nasa.gov/software/LAR-19893-1.
- Kittel [1986] C. Kittel, Introduction to Sold State Physics, Wiley-Interscience, New York, 1986.
Acknowledgments
We are grateful to Dr. Ian Chesser for carefully reading the manuscripts and providing helpful suggestions. This research was supported by the U.S. Department of Energy, Office of Basic Energy Sciences, Division of Materials Sciences and Engineering, under Award # DE-SC0023102.
Author contributions
O. H. heavily contributed in the concept development and conducted all simulations reported in the main text of the article. Y. L. actively participated in discussions and performed all simulations reported in the Supplementary Information file. Y. M. contributed to the concept development, supervised the effort, and prepared the first draft of the complete manuscript. All co-authors participated in the manuscript editing and approved its final version.
Additional information
Supplementary Information accompanies this paper at https://doi.org/…
Competing interests:
The authors declare no competing interests.
The origin of strings and rings in the atomic dynamics of disordered systems
Omar Hussein, Yang Li, and Y. Mishin
Department of Physics and Astronomy, MSN 3F3, George Mason University, Fairfax, Virginia 22030, USA
SUPPLEMENTARY INFORMATION
This file contains additional figures showing the investigations of string dynamics in systems other than those discussed in the main text.