Supplementary Information for: “From underground natural gas to hydrogen storage in fractured reservoir rock : comparing relative permeabilities for hydrogen versus methane and nitrogen"
keywords:
Underground hydrogen storage , Relative permeability , Fractured rock , Hydrogen , Methane\ul
Contents
-
•
Section S1: Fluid occupancy for fractional flows
-
•
Section S2: Differential pressure
-
•
Section S3: Sensitivity analysis: saturation
-
•
Section S4: Nitrogen relative permeability comparison
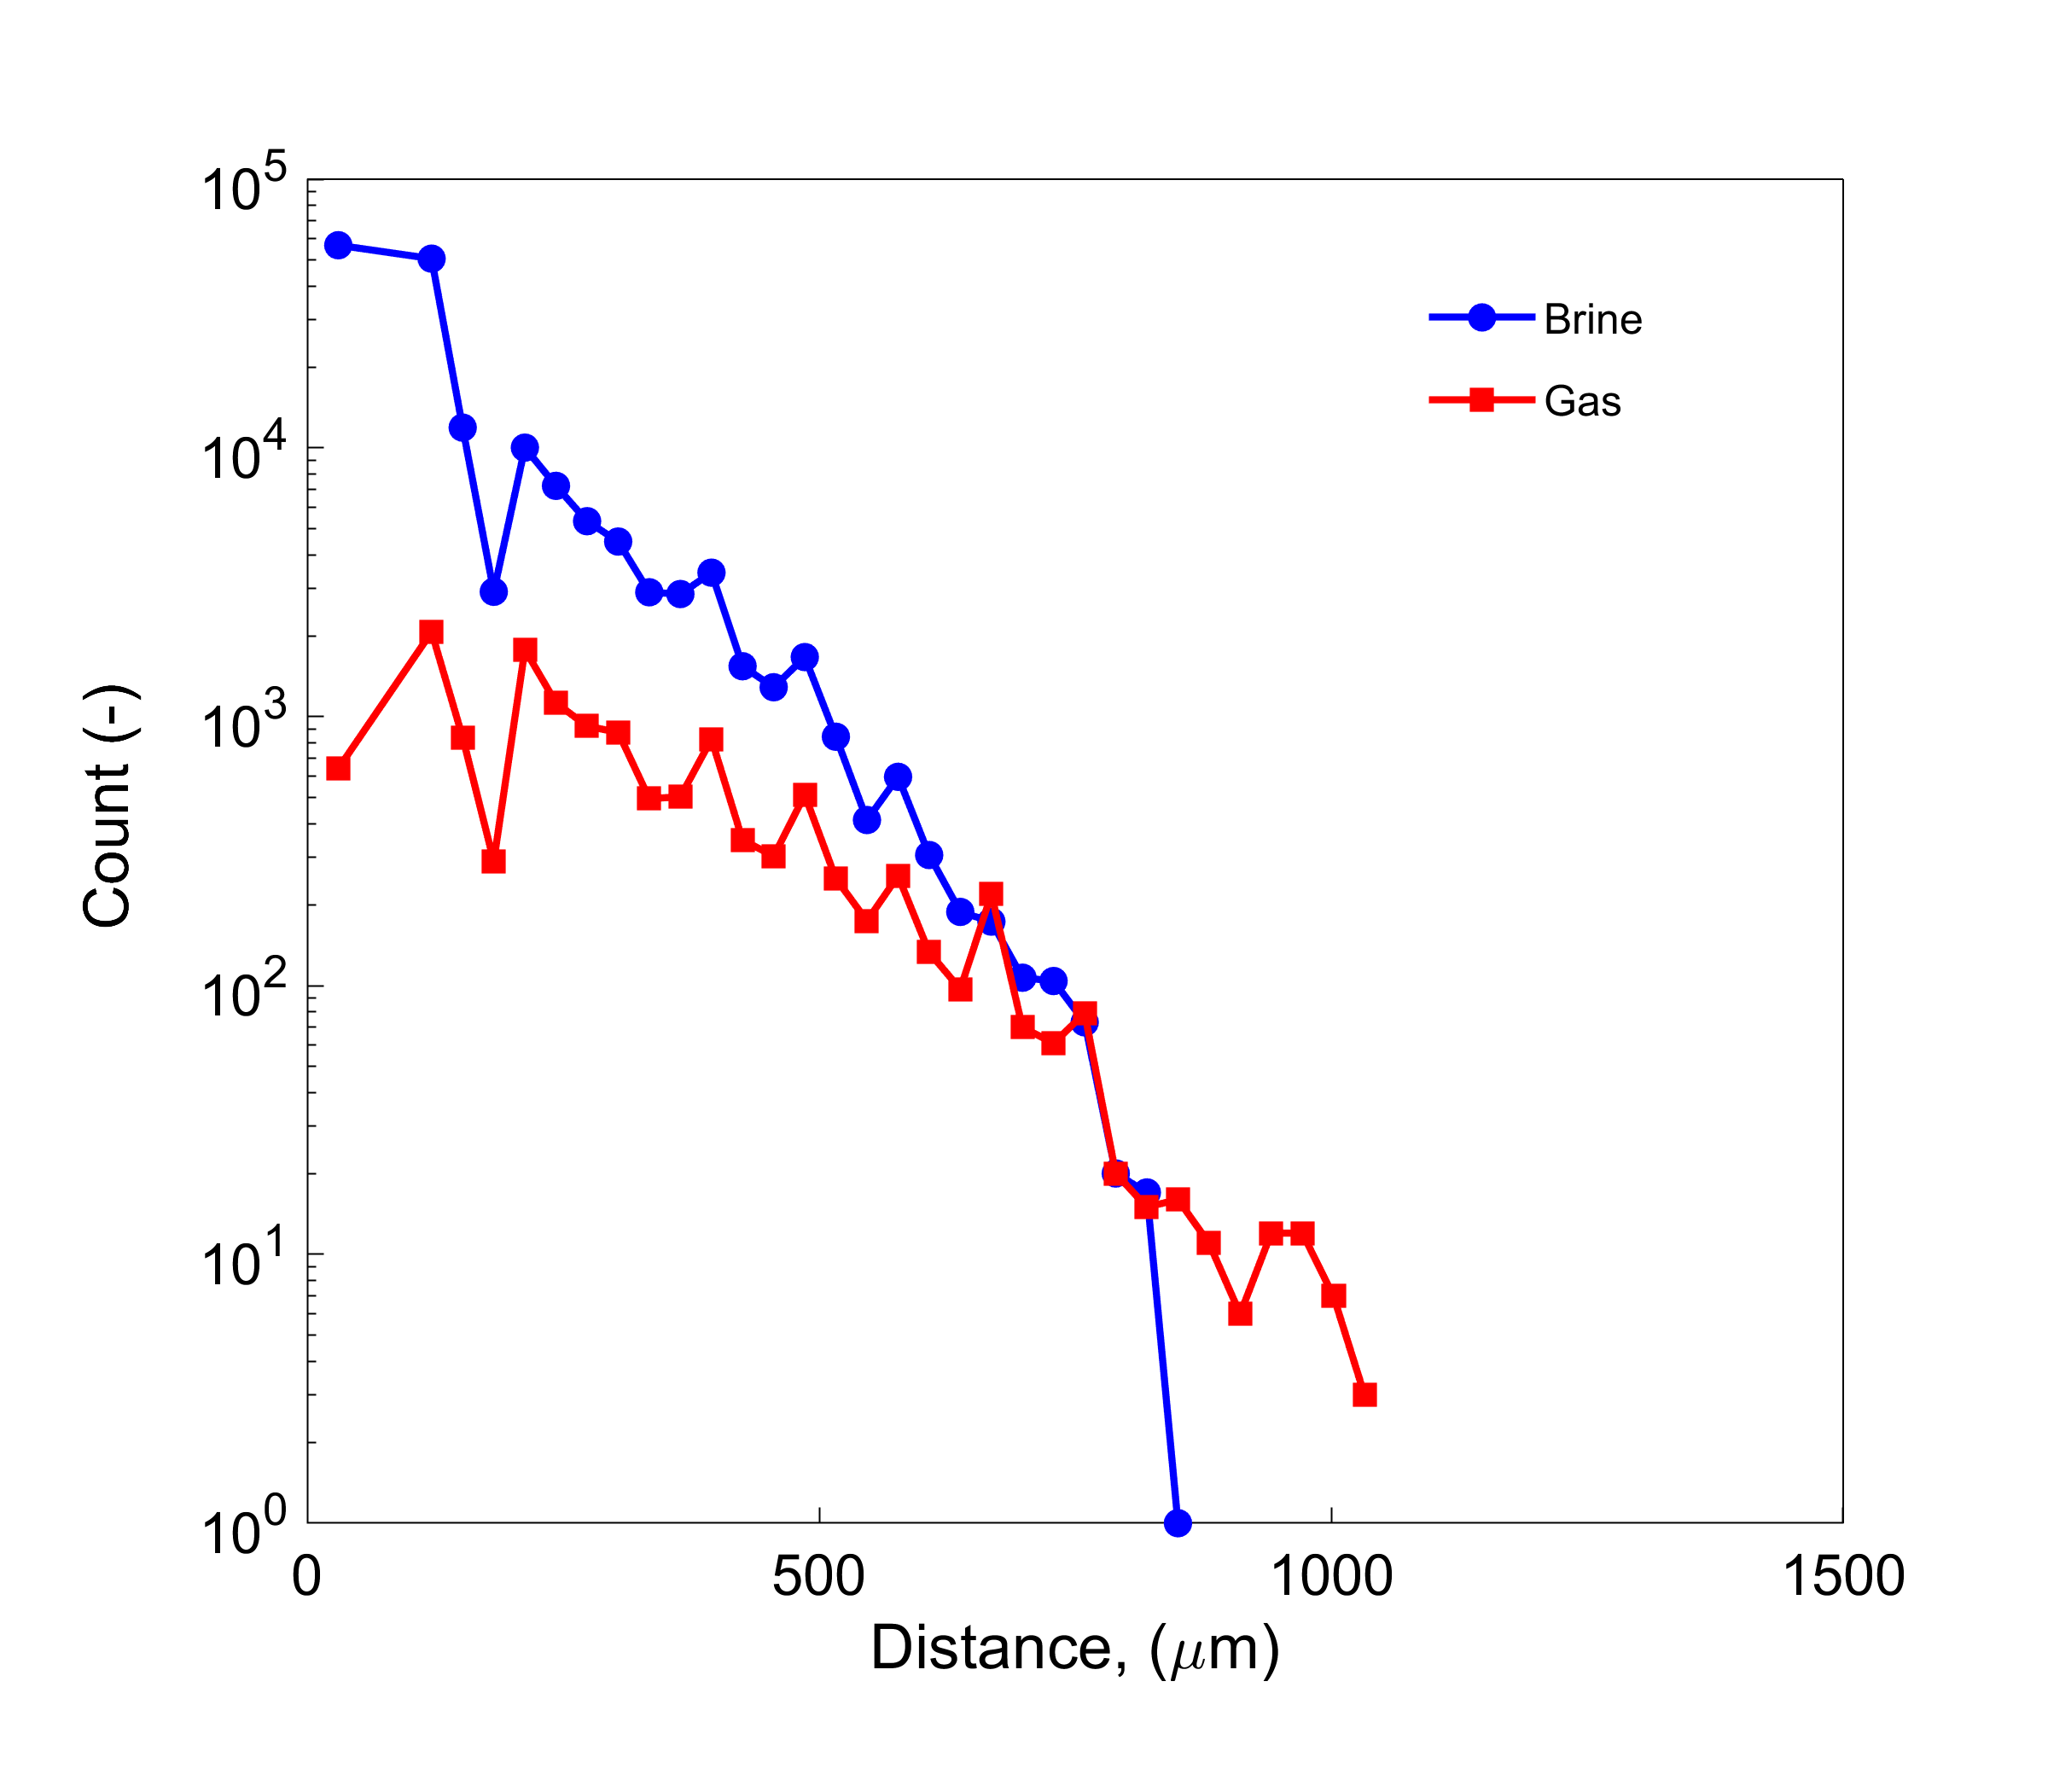
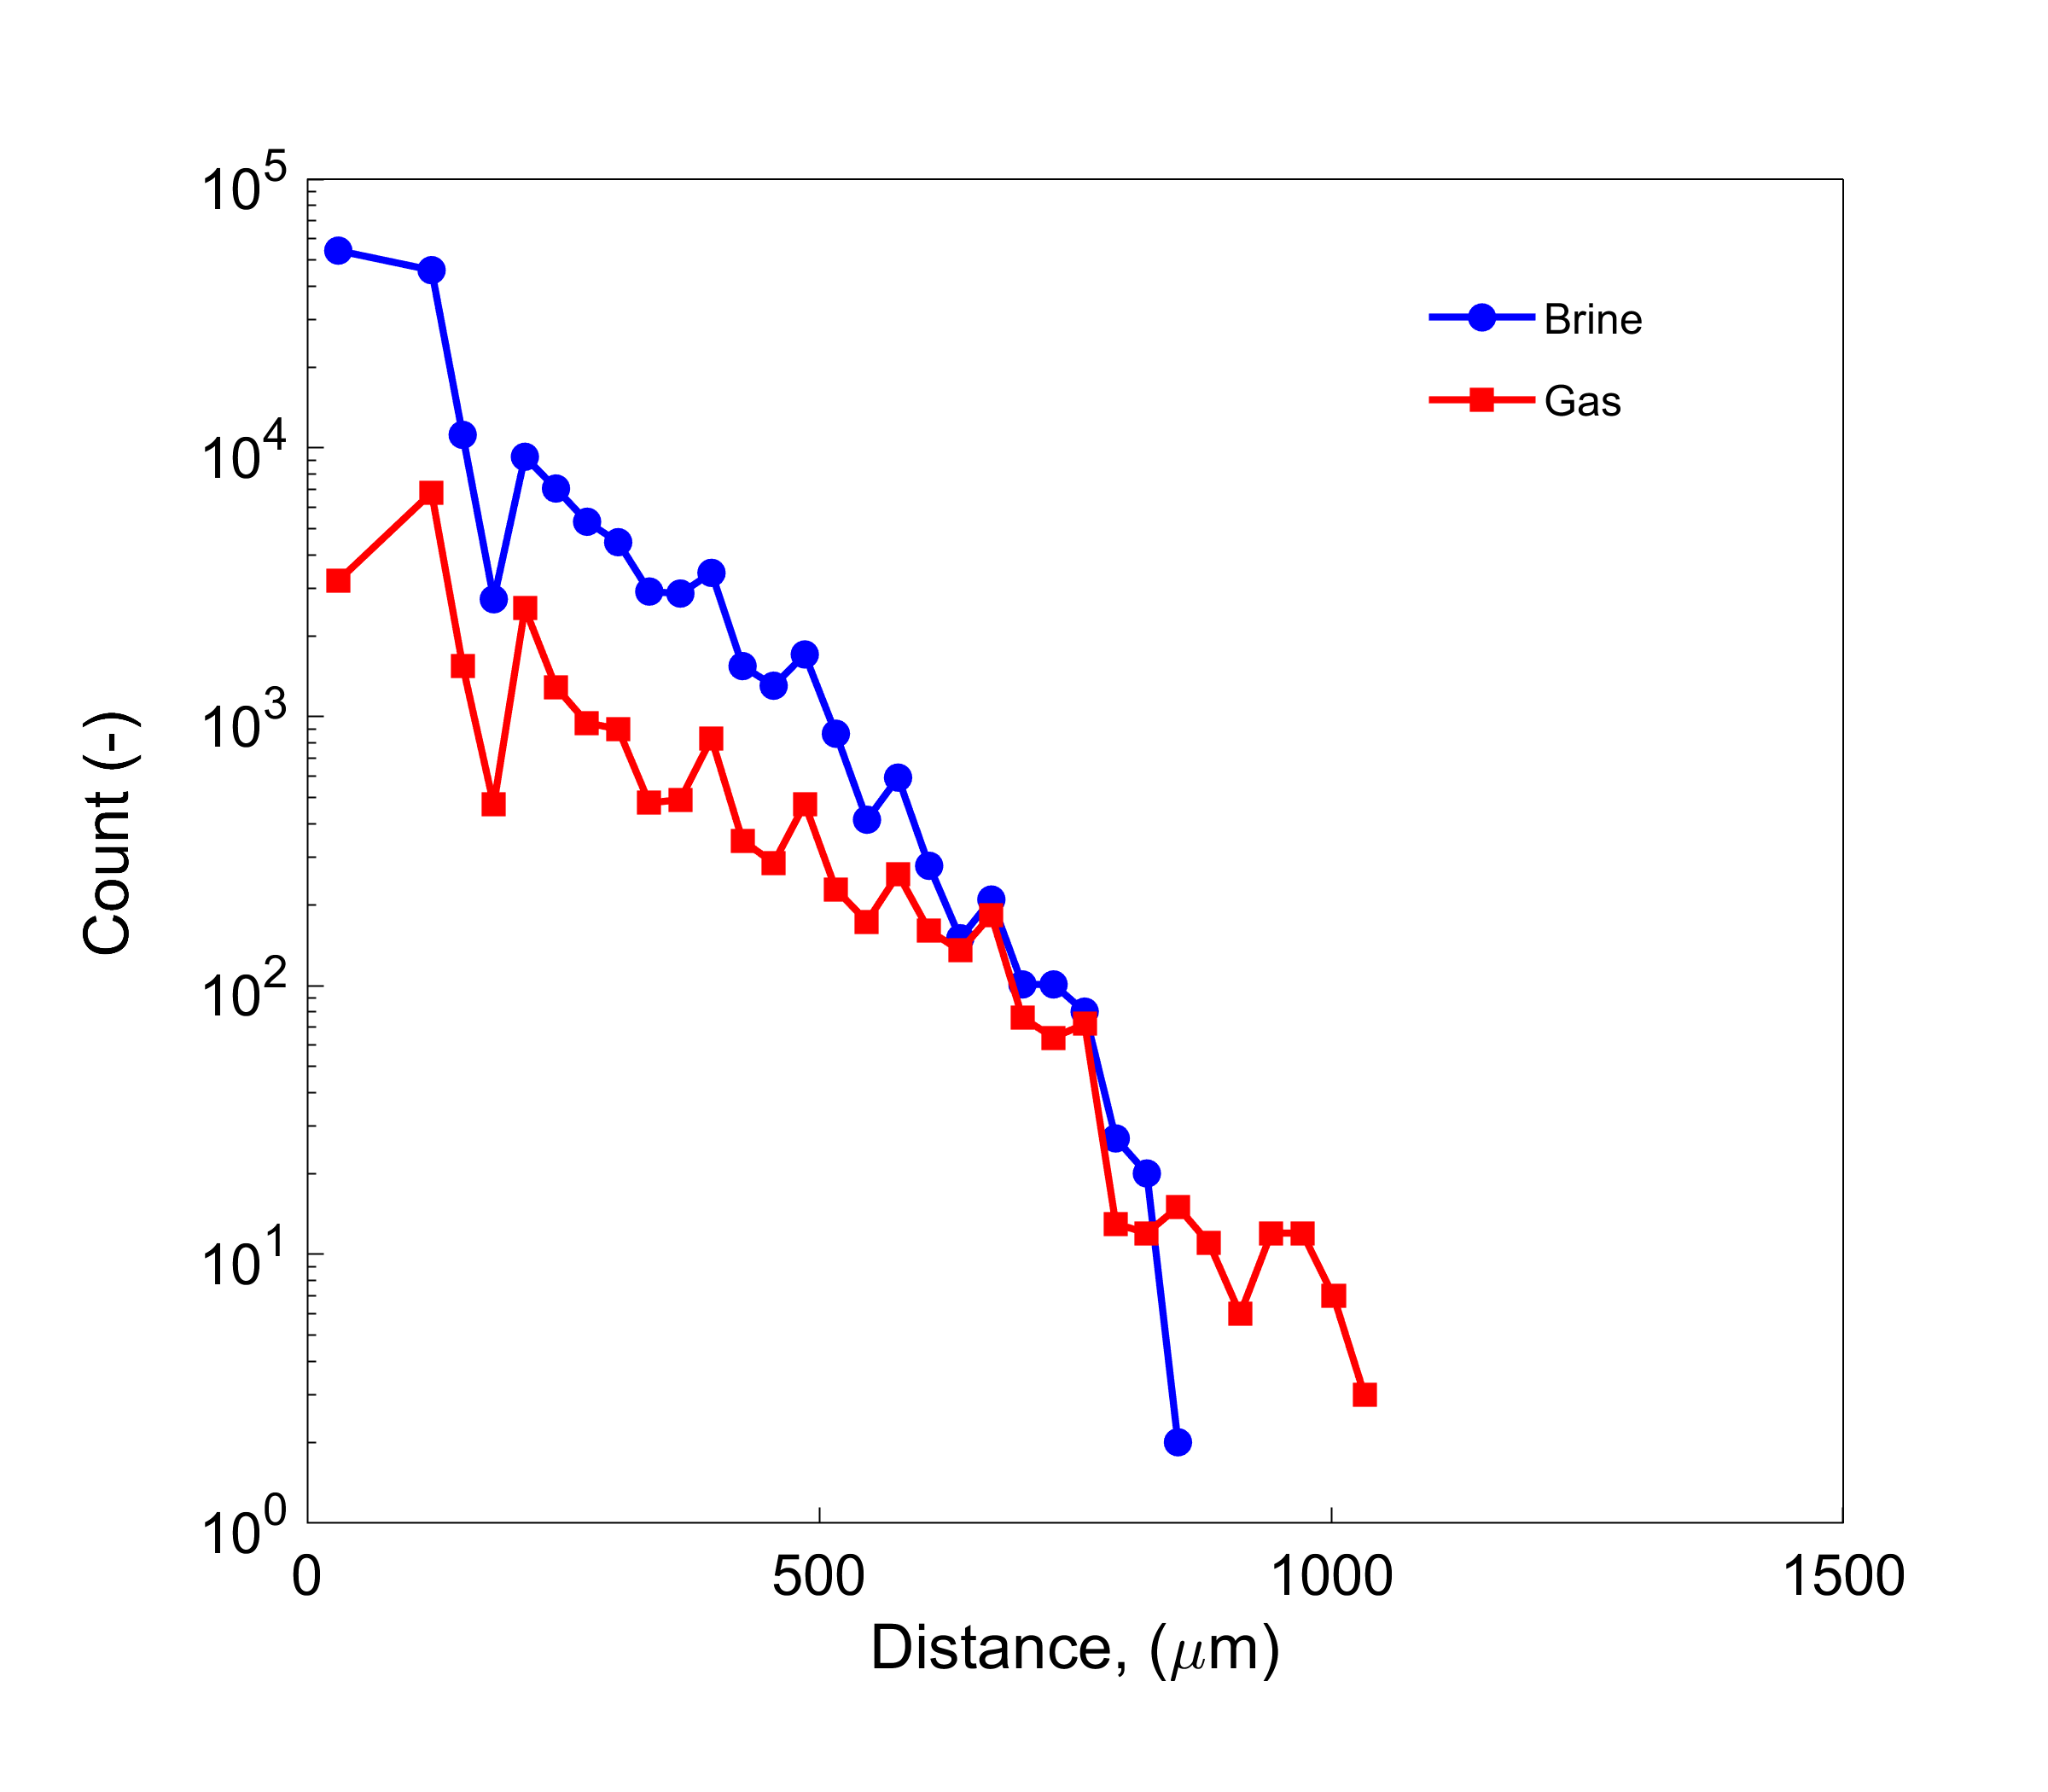
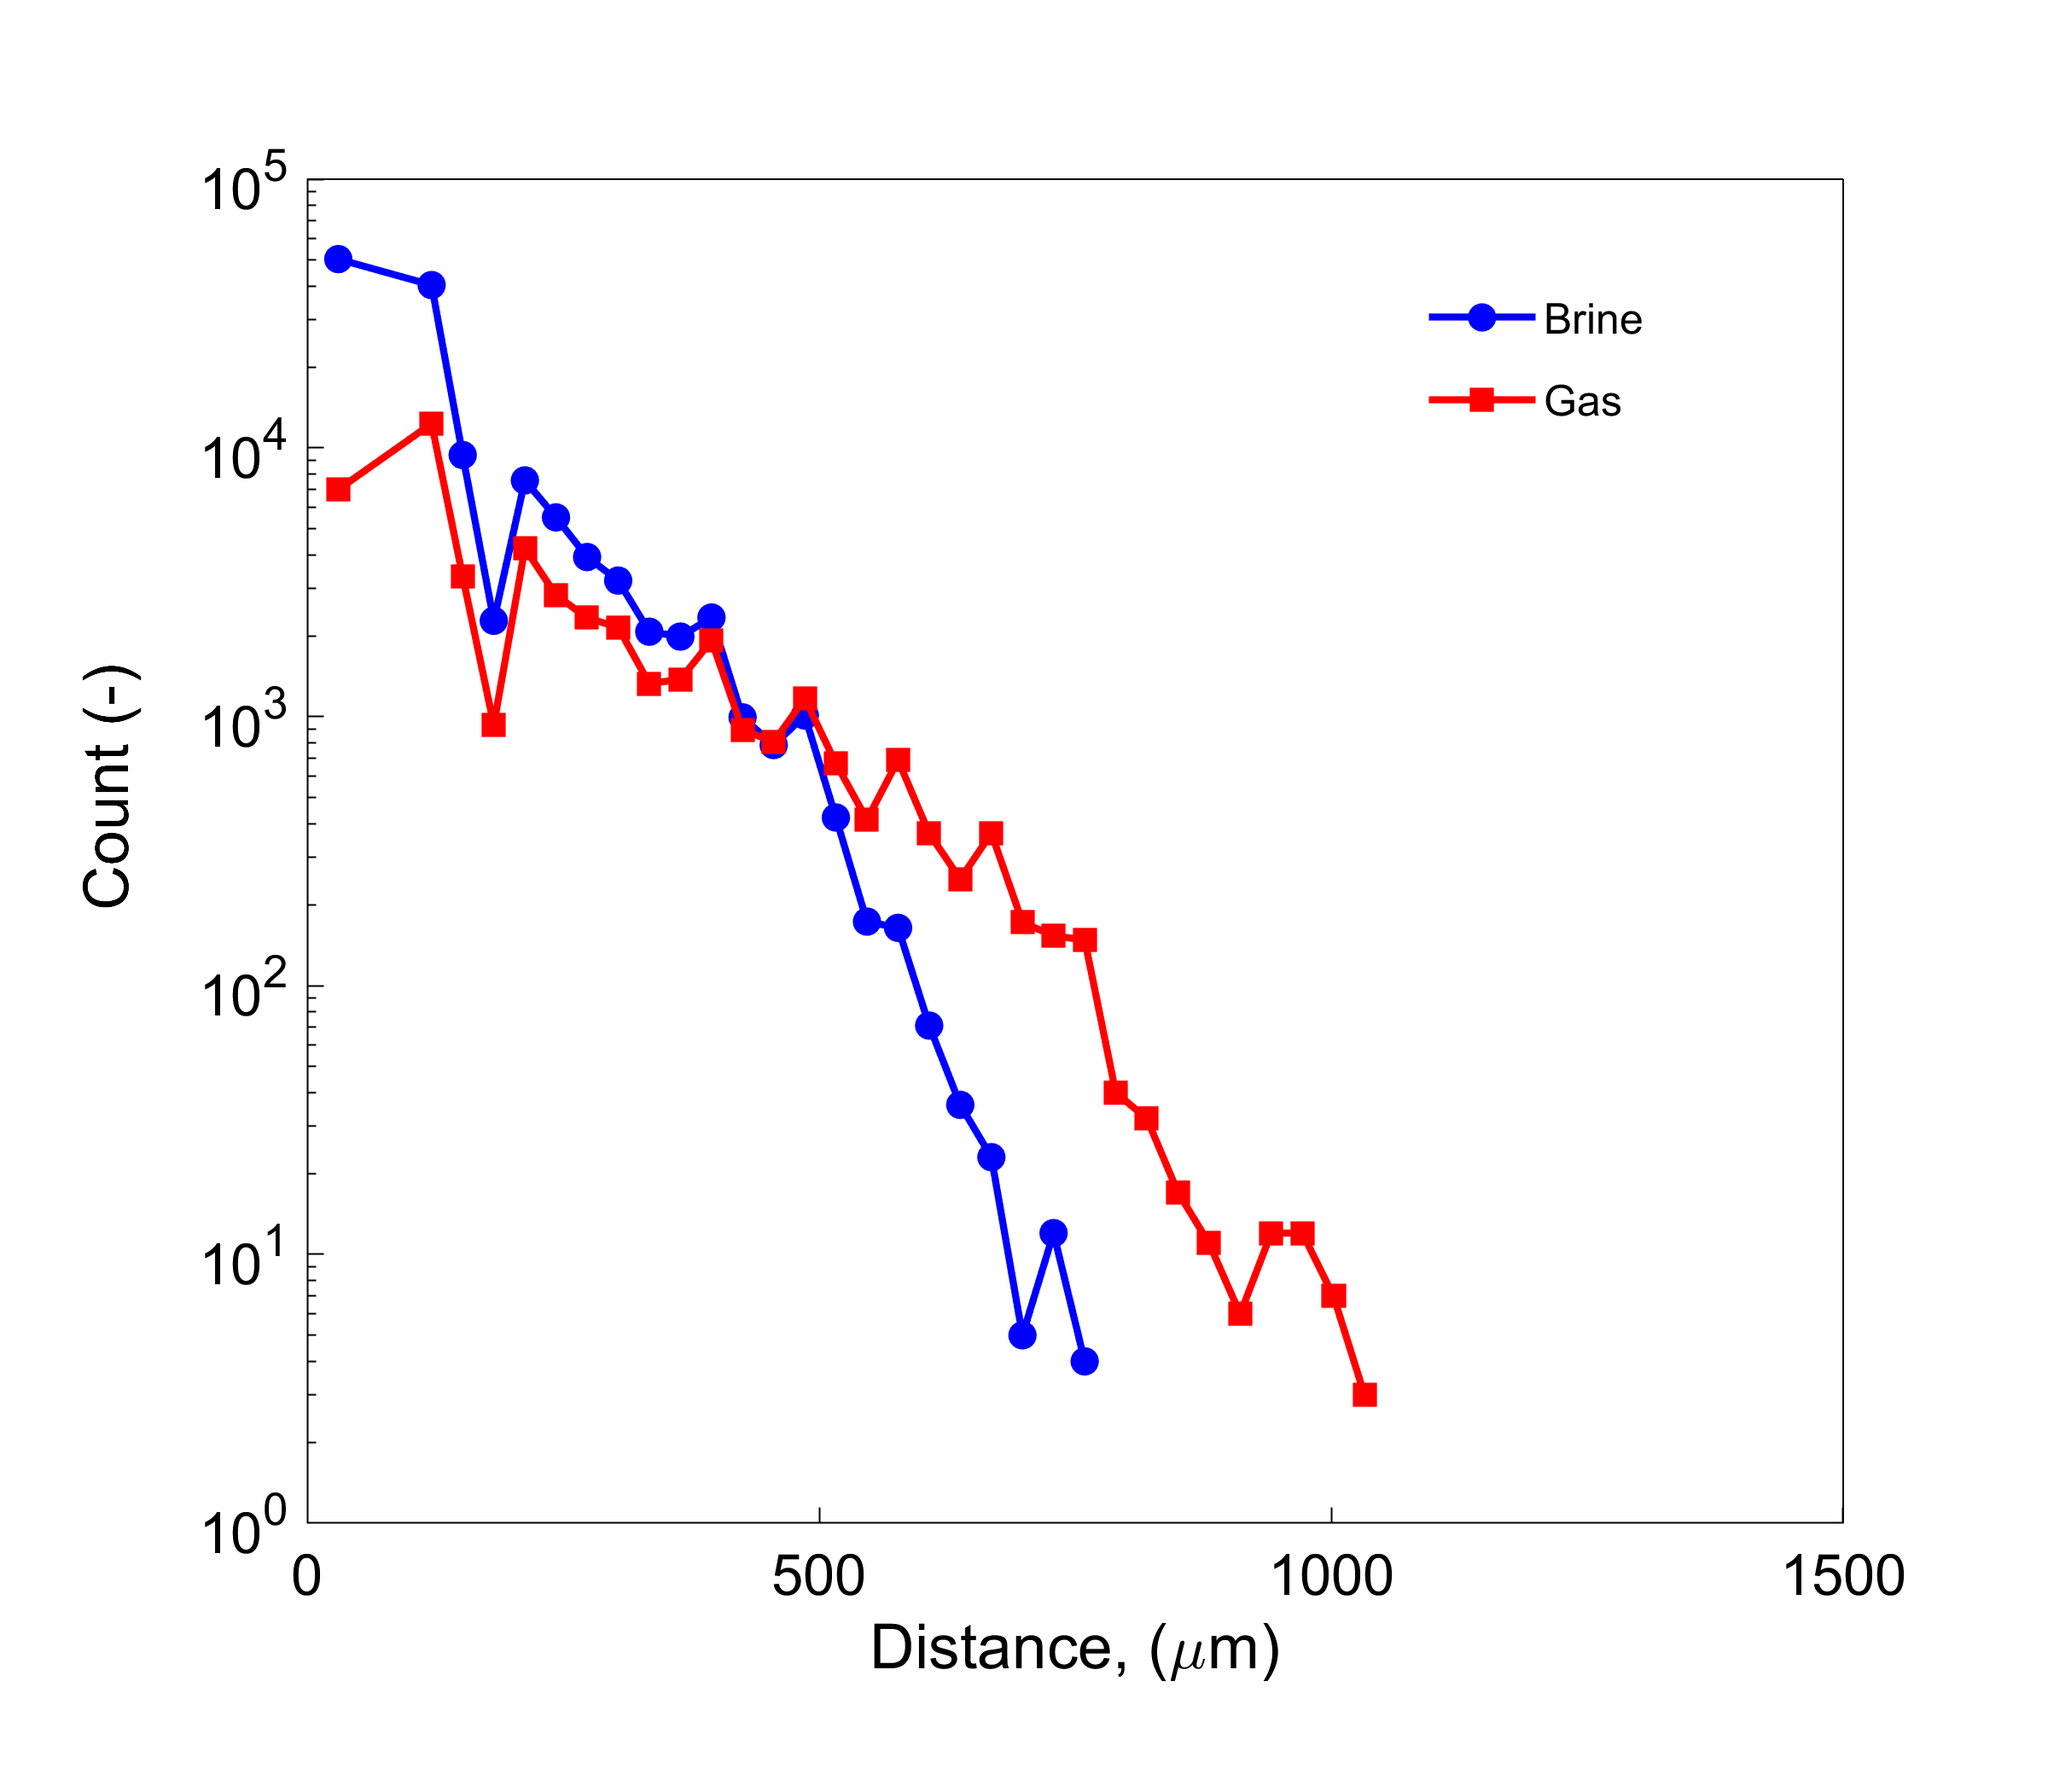
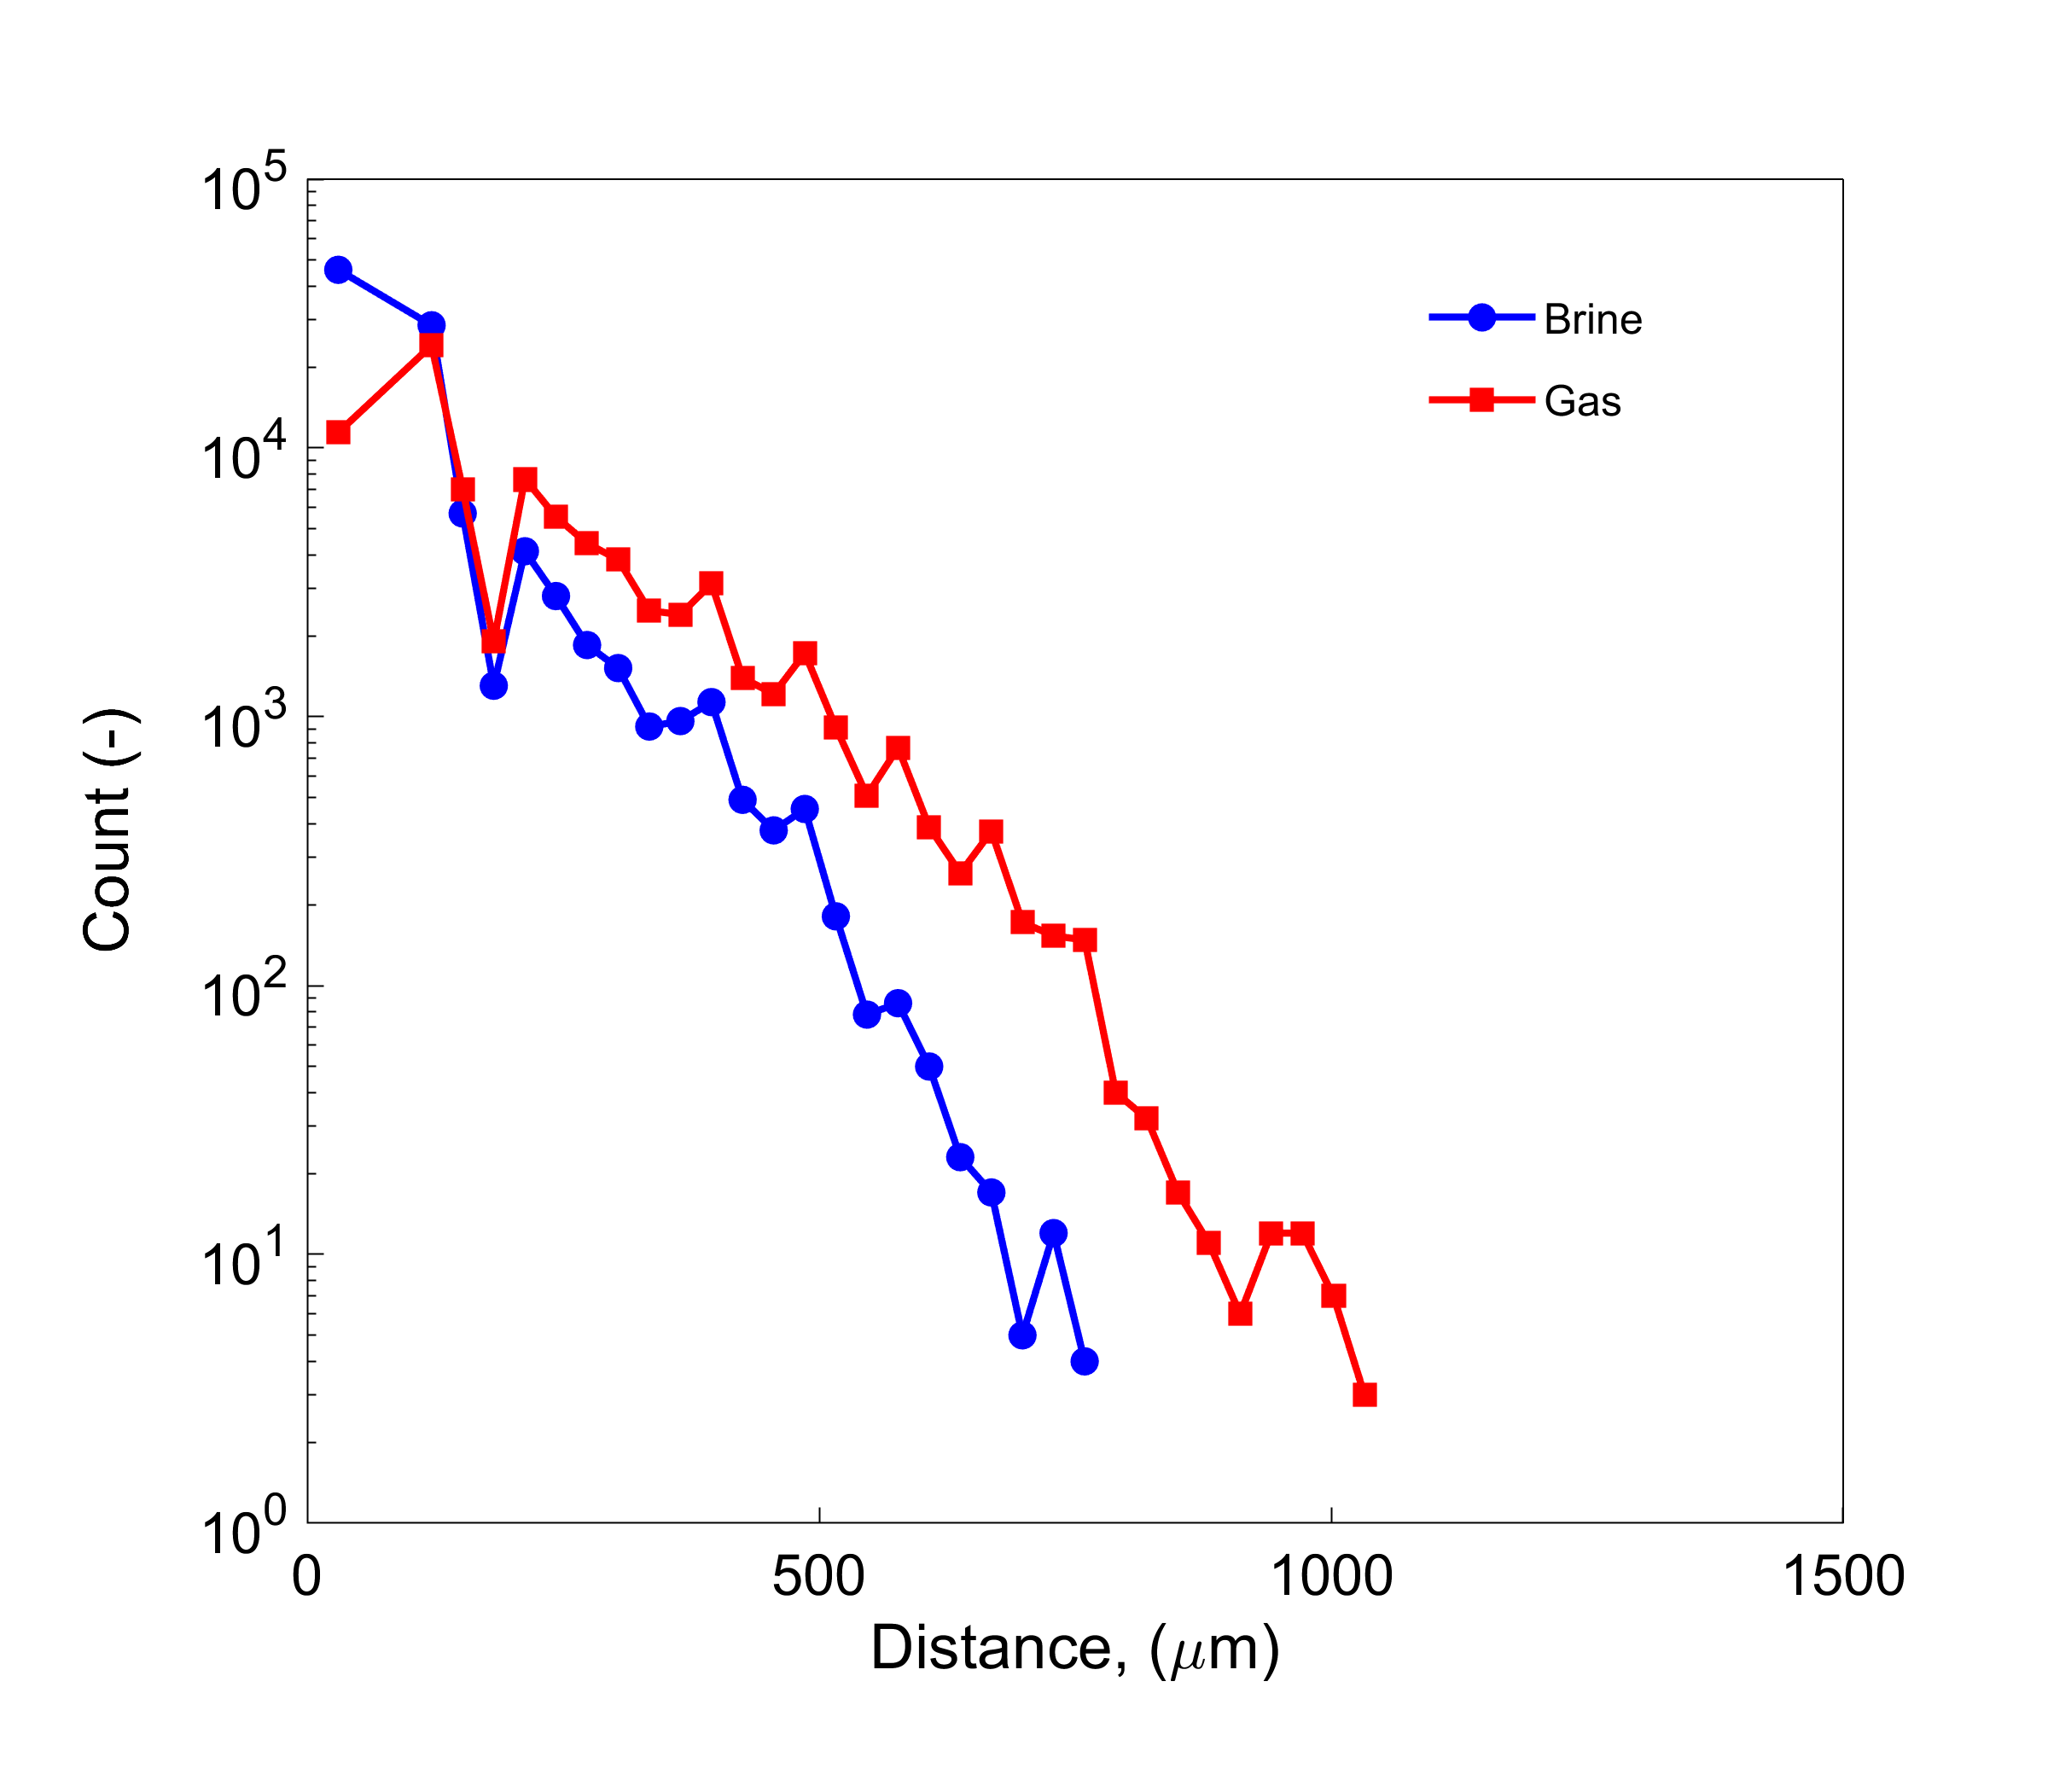
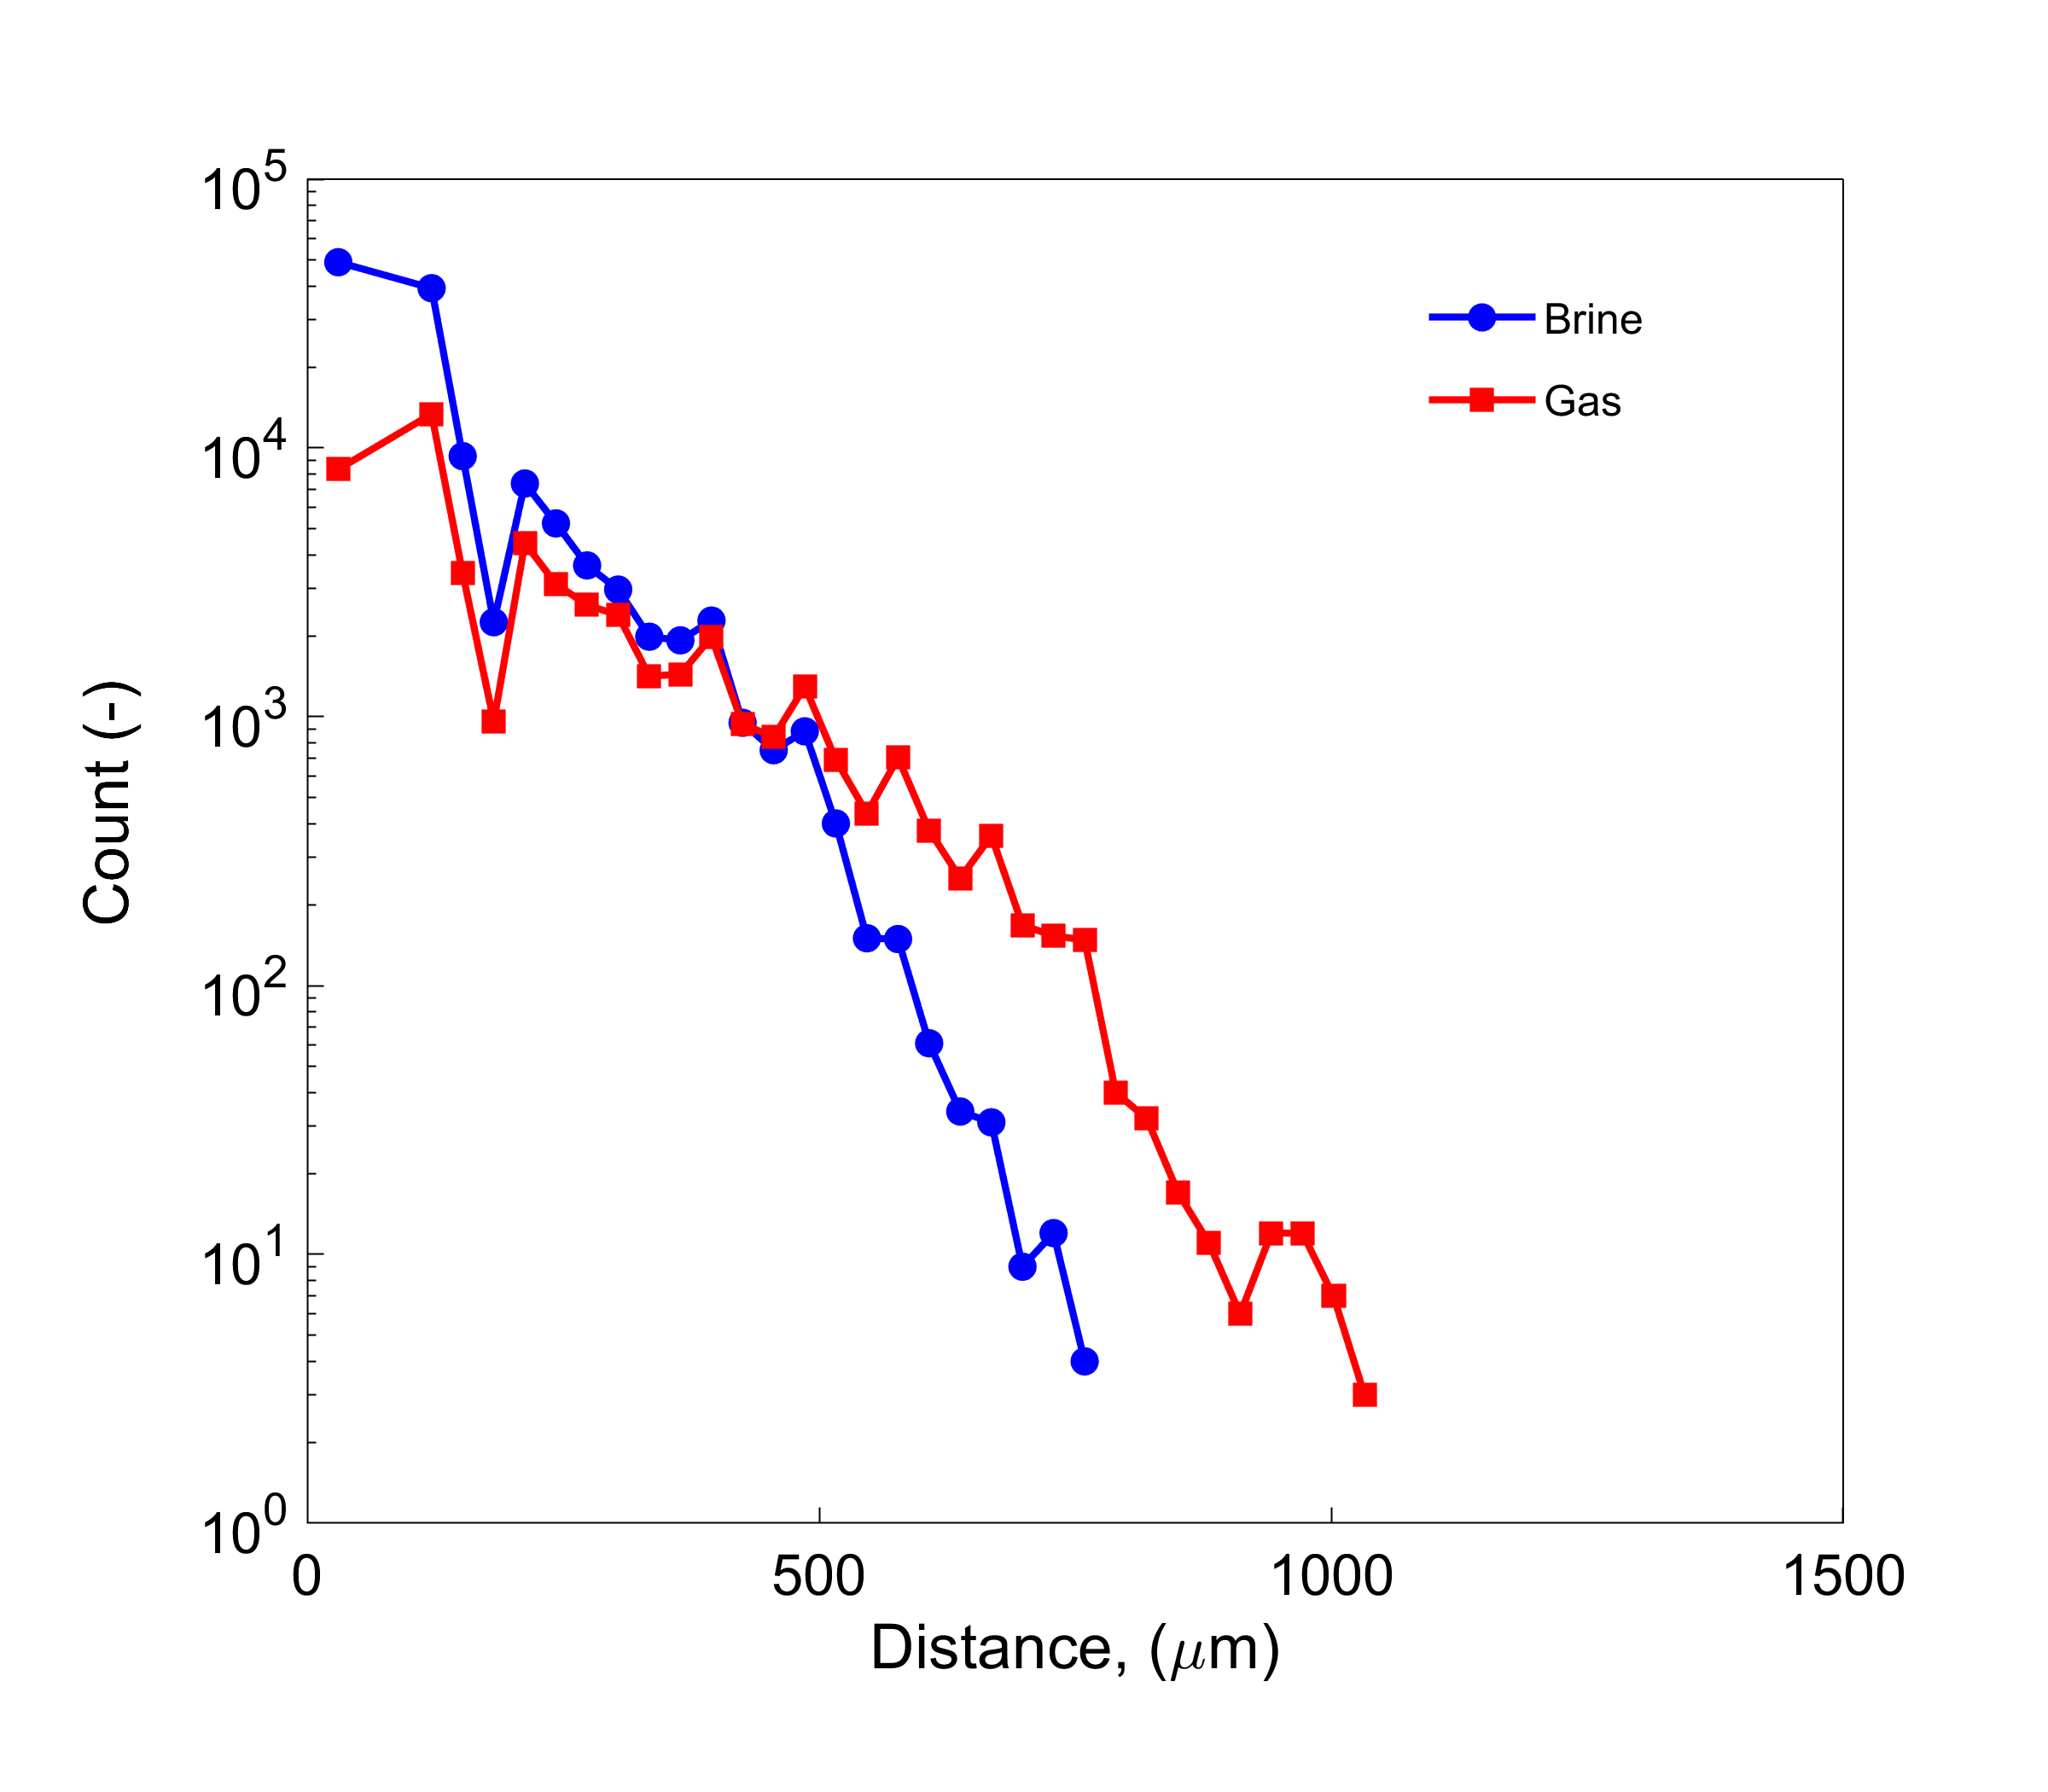
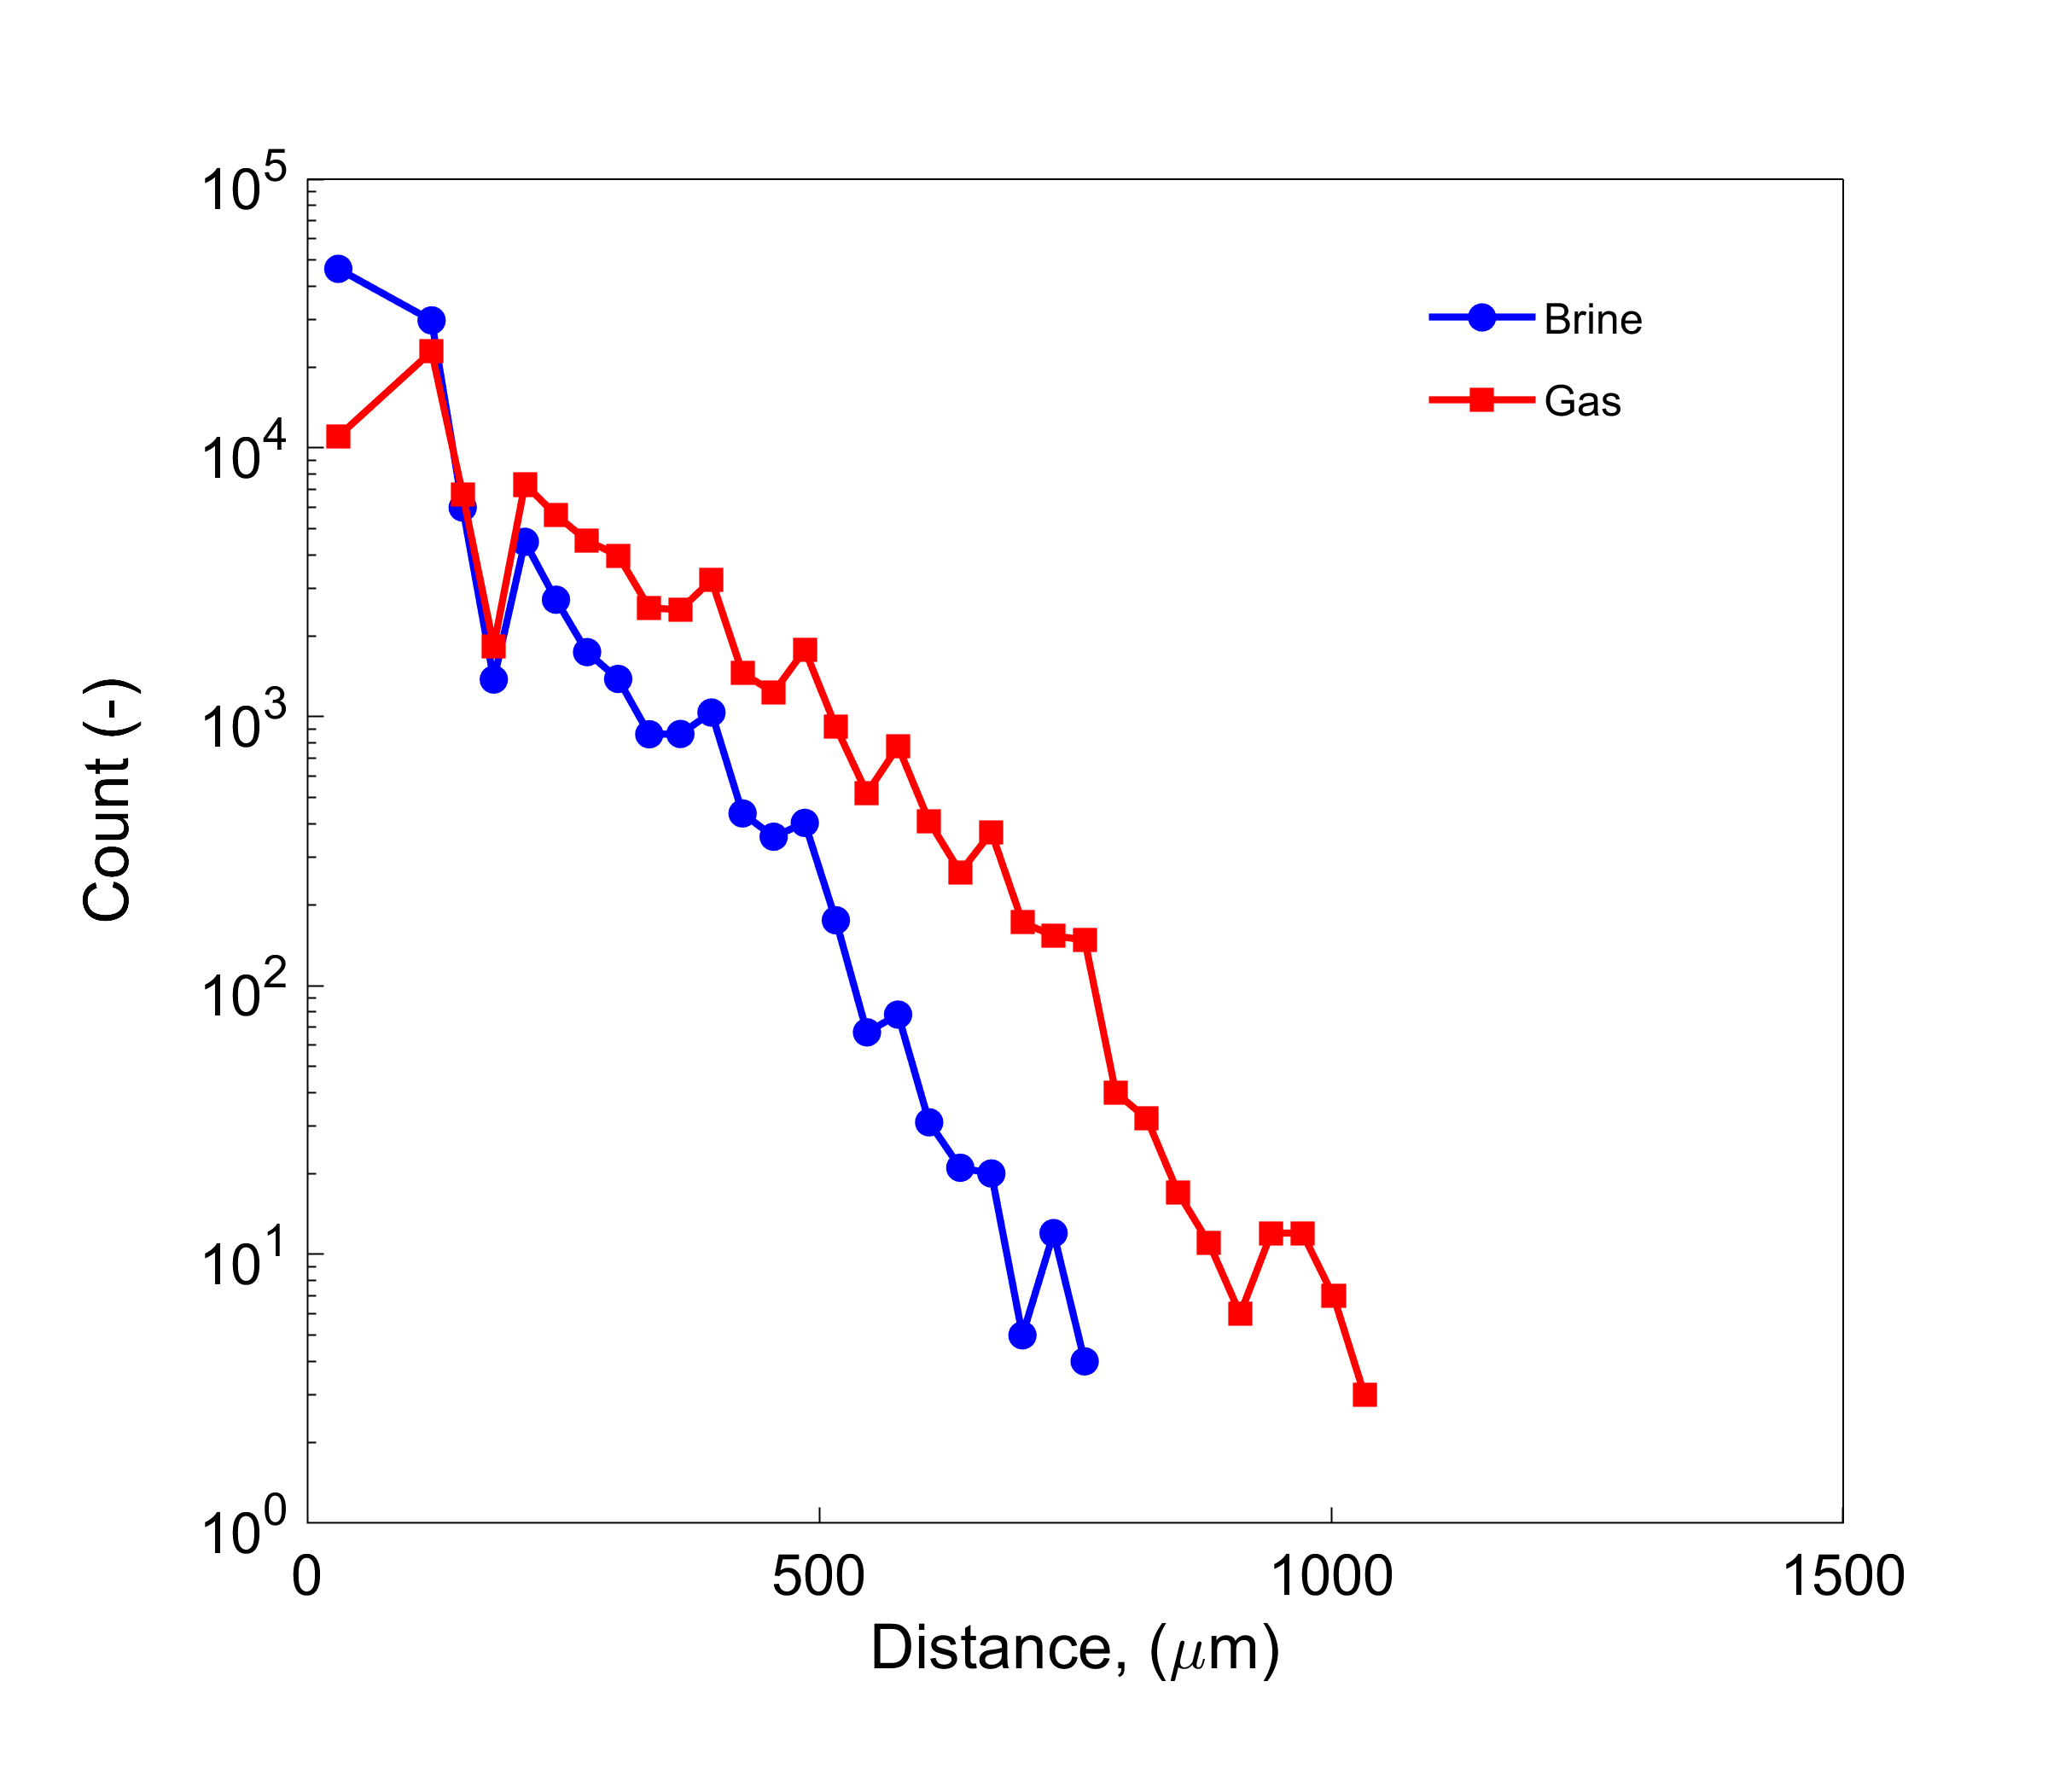
1 S1: Fluid occupancy for fractional flows
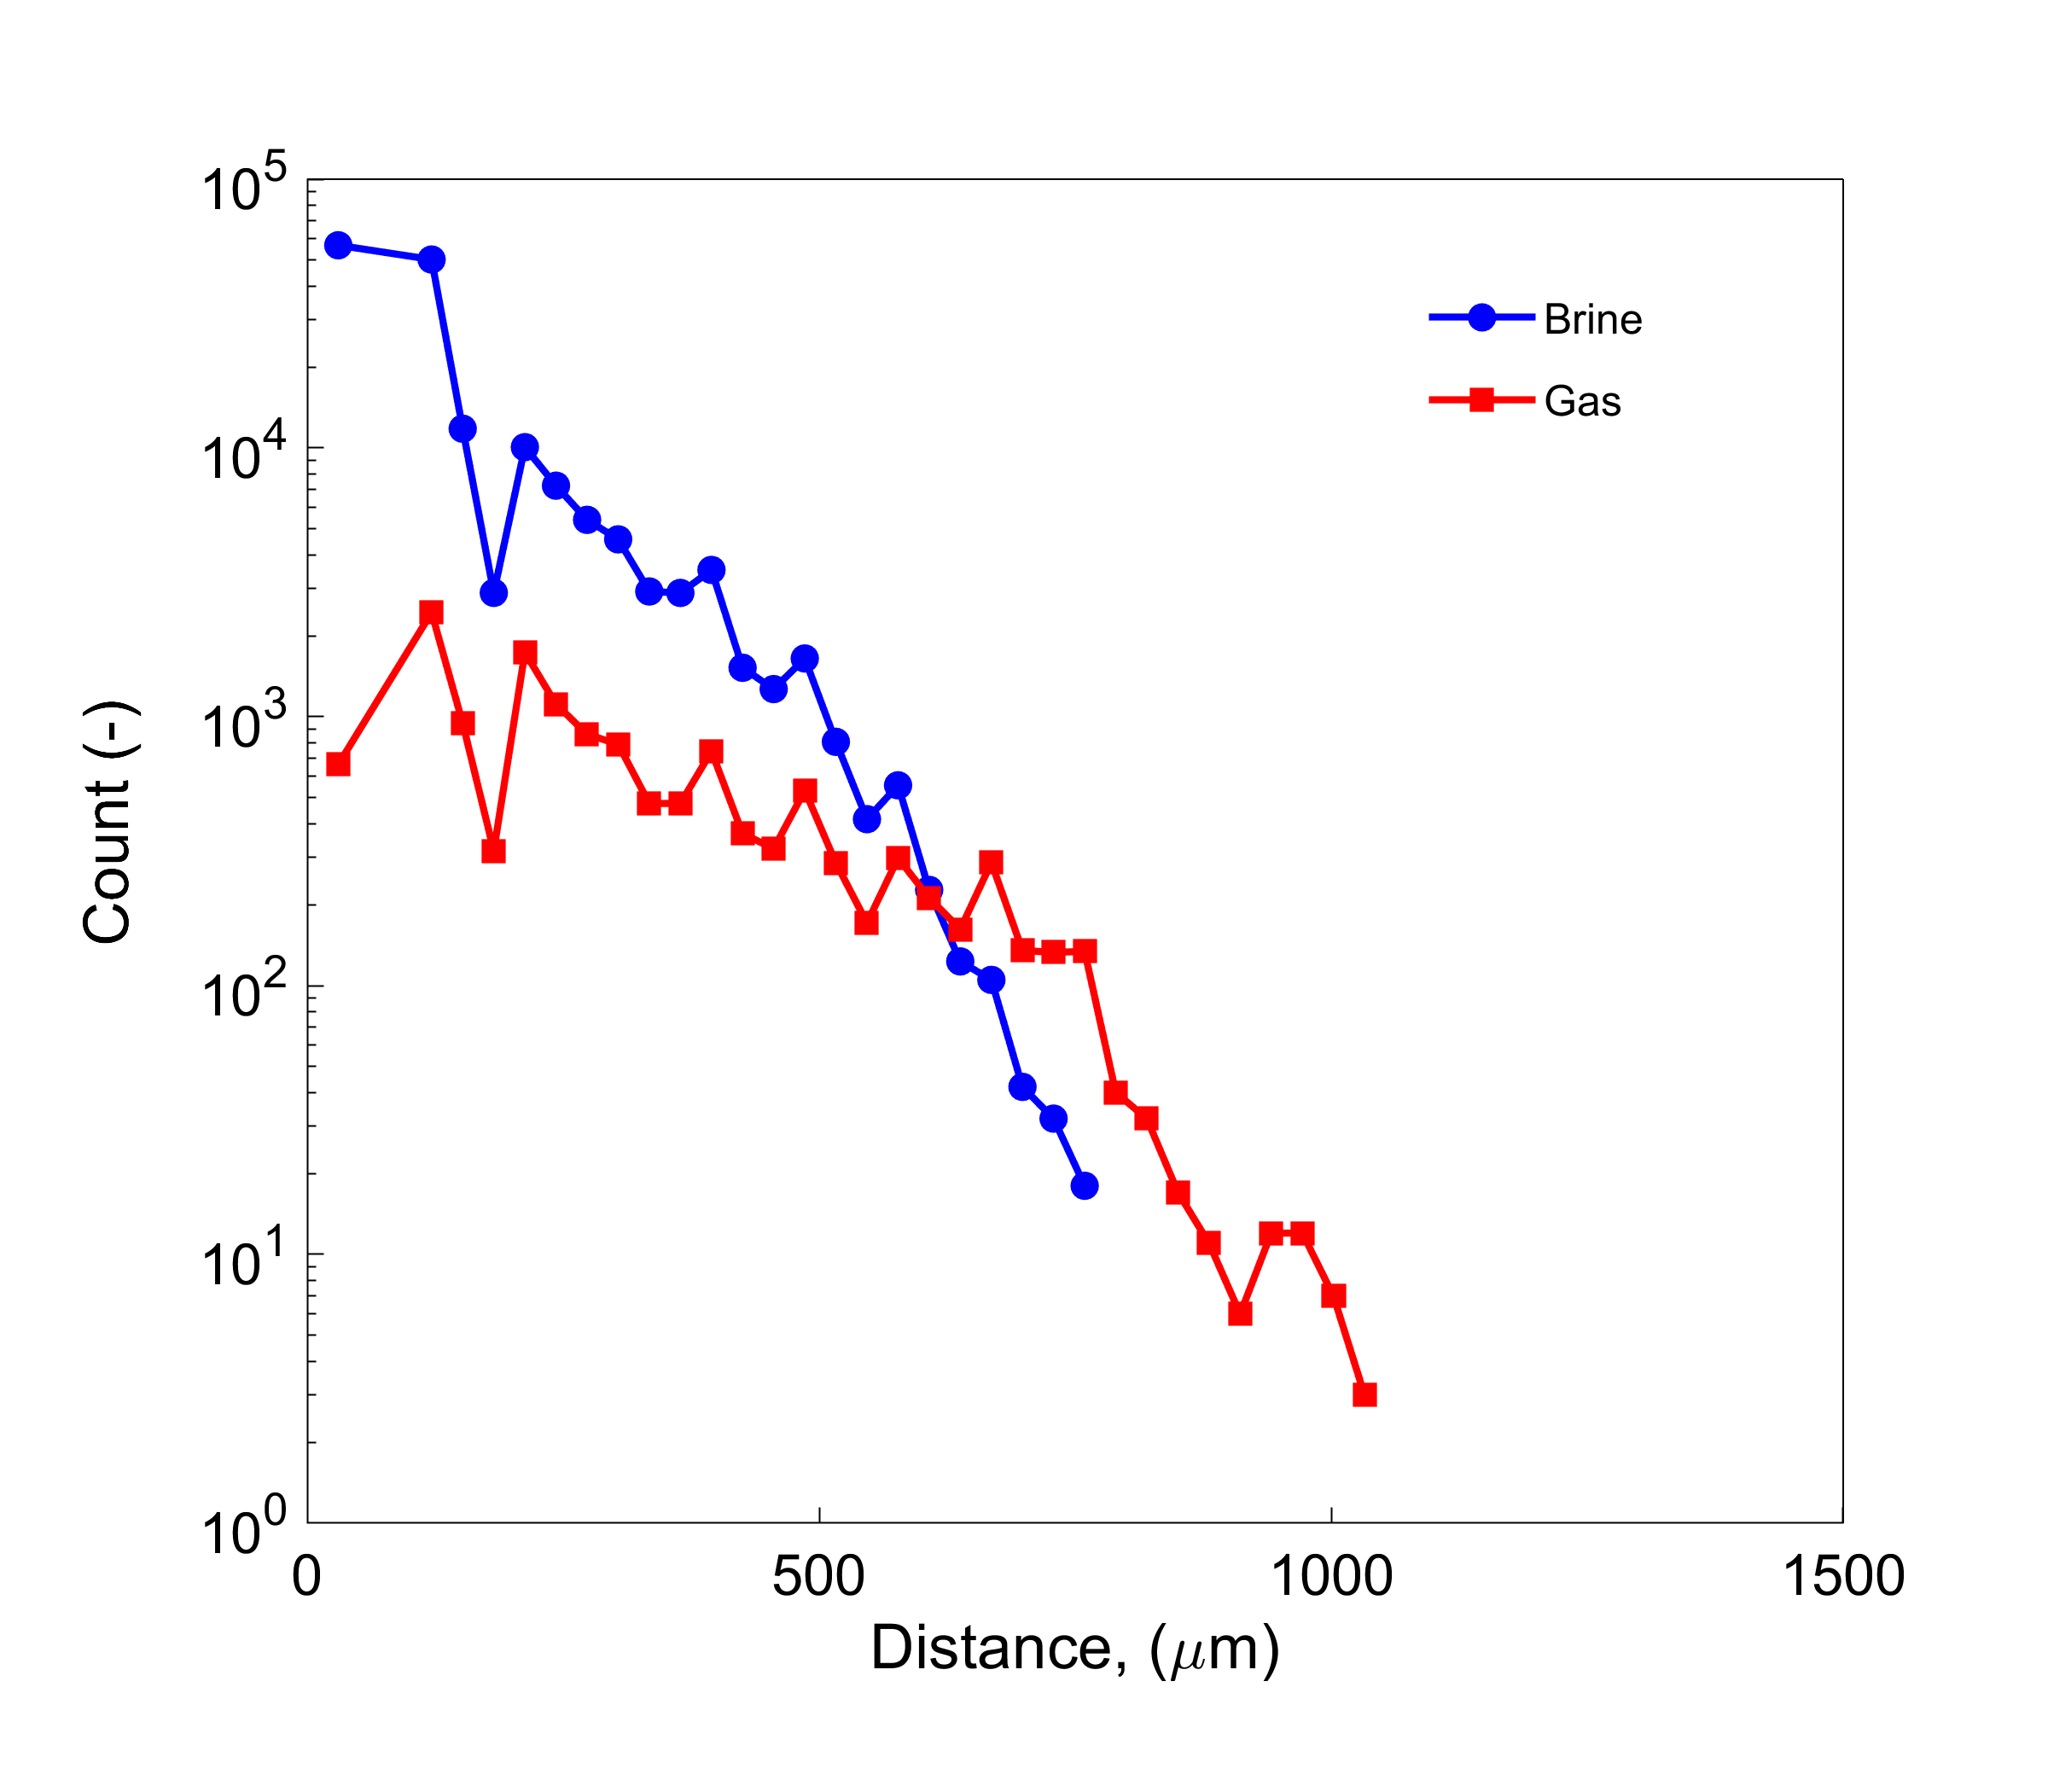
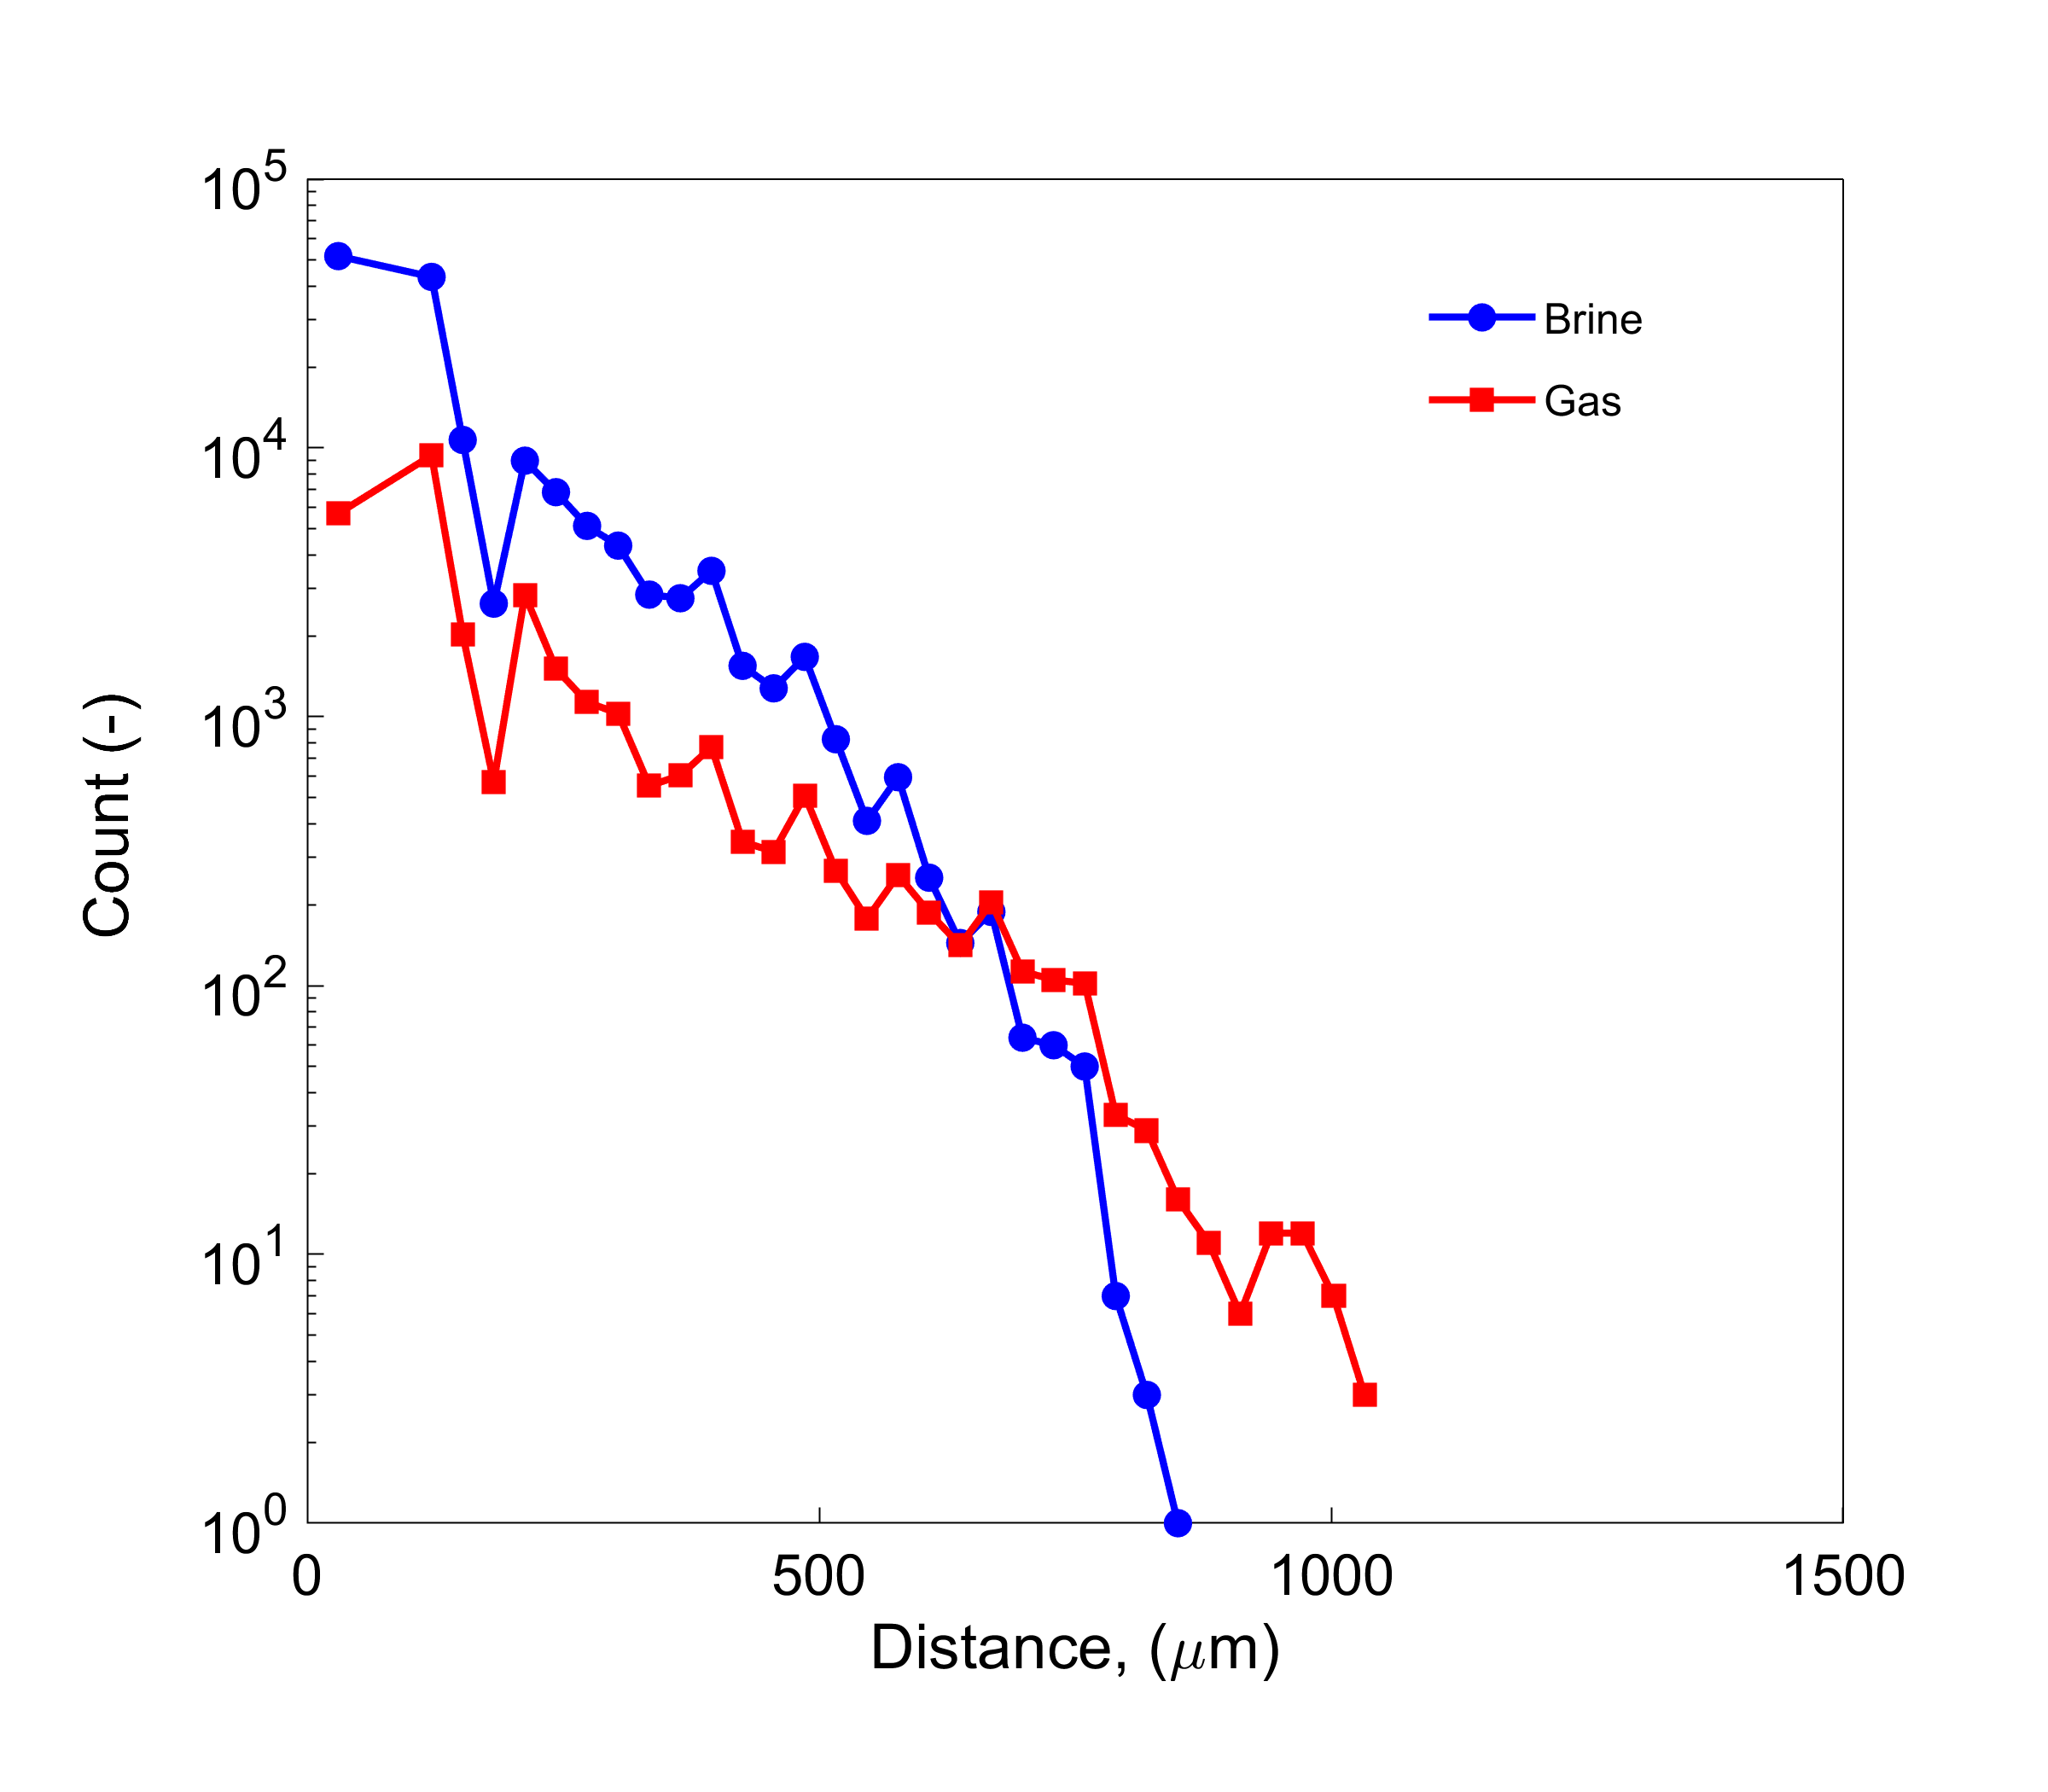
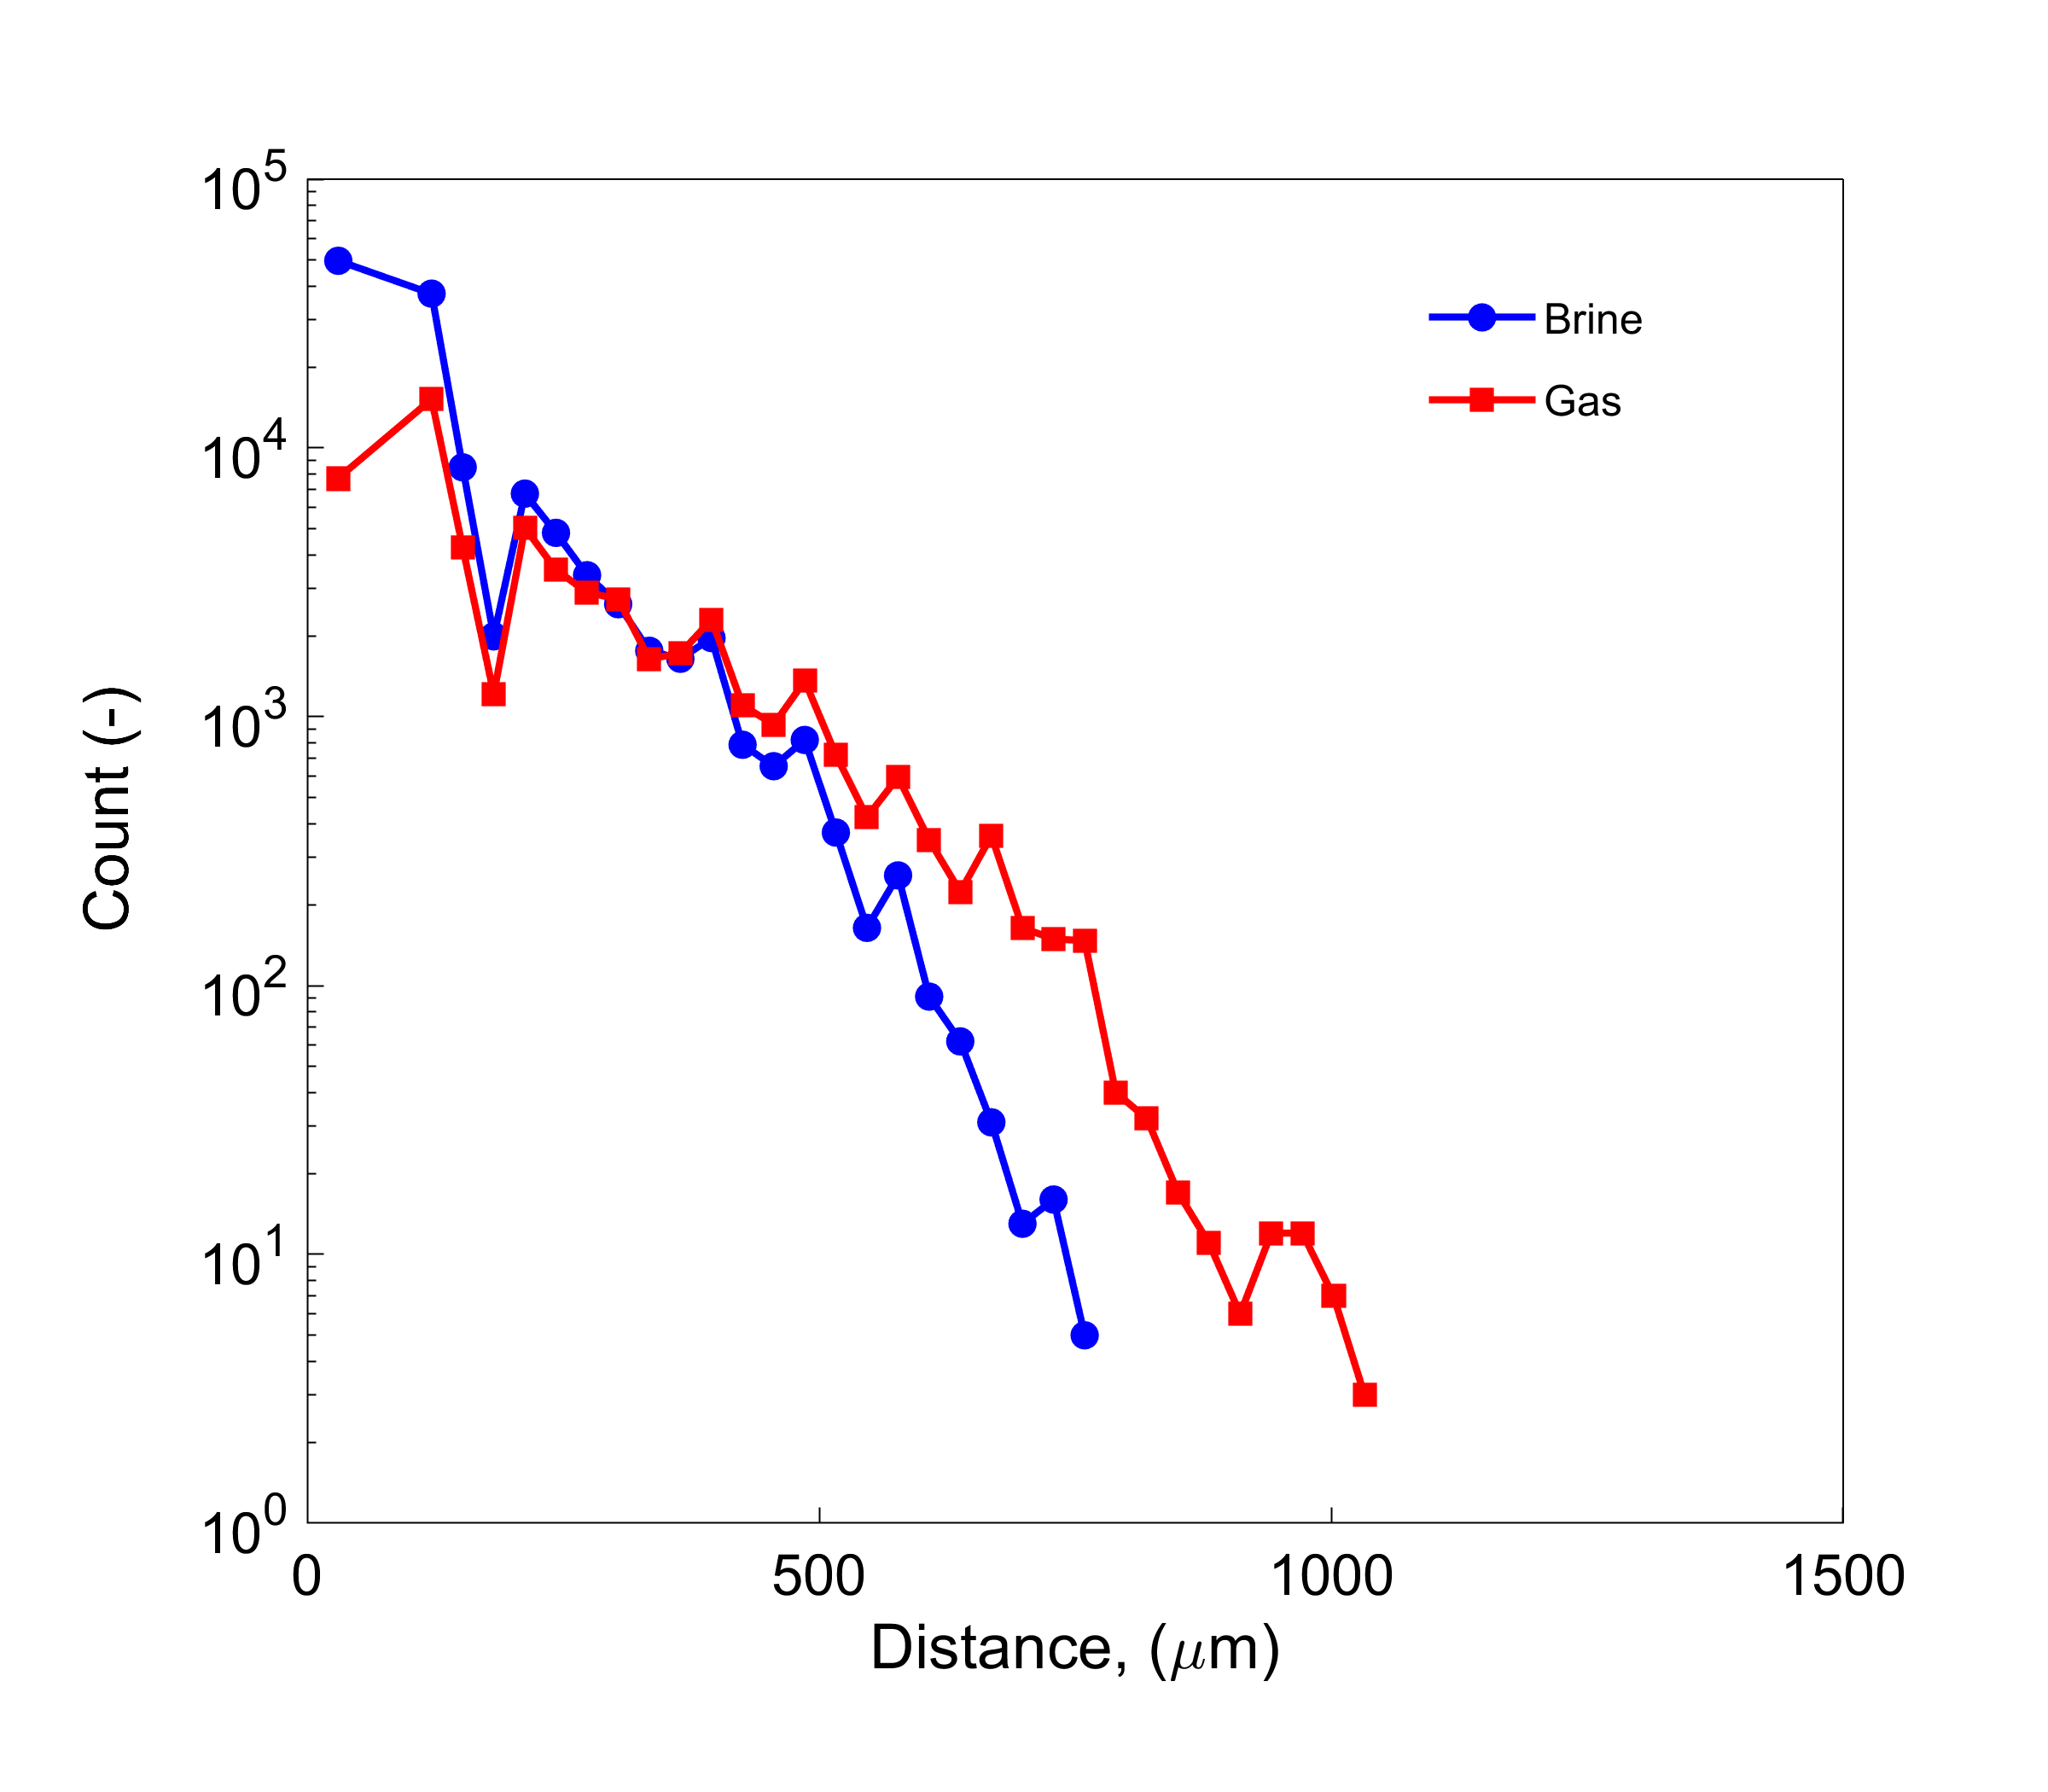
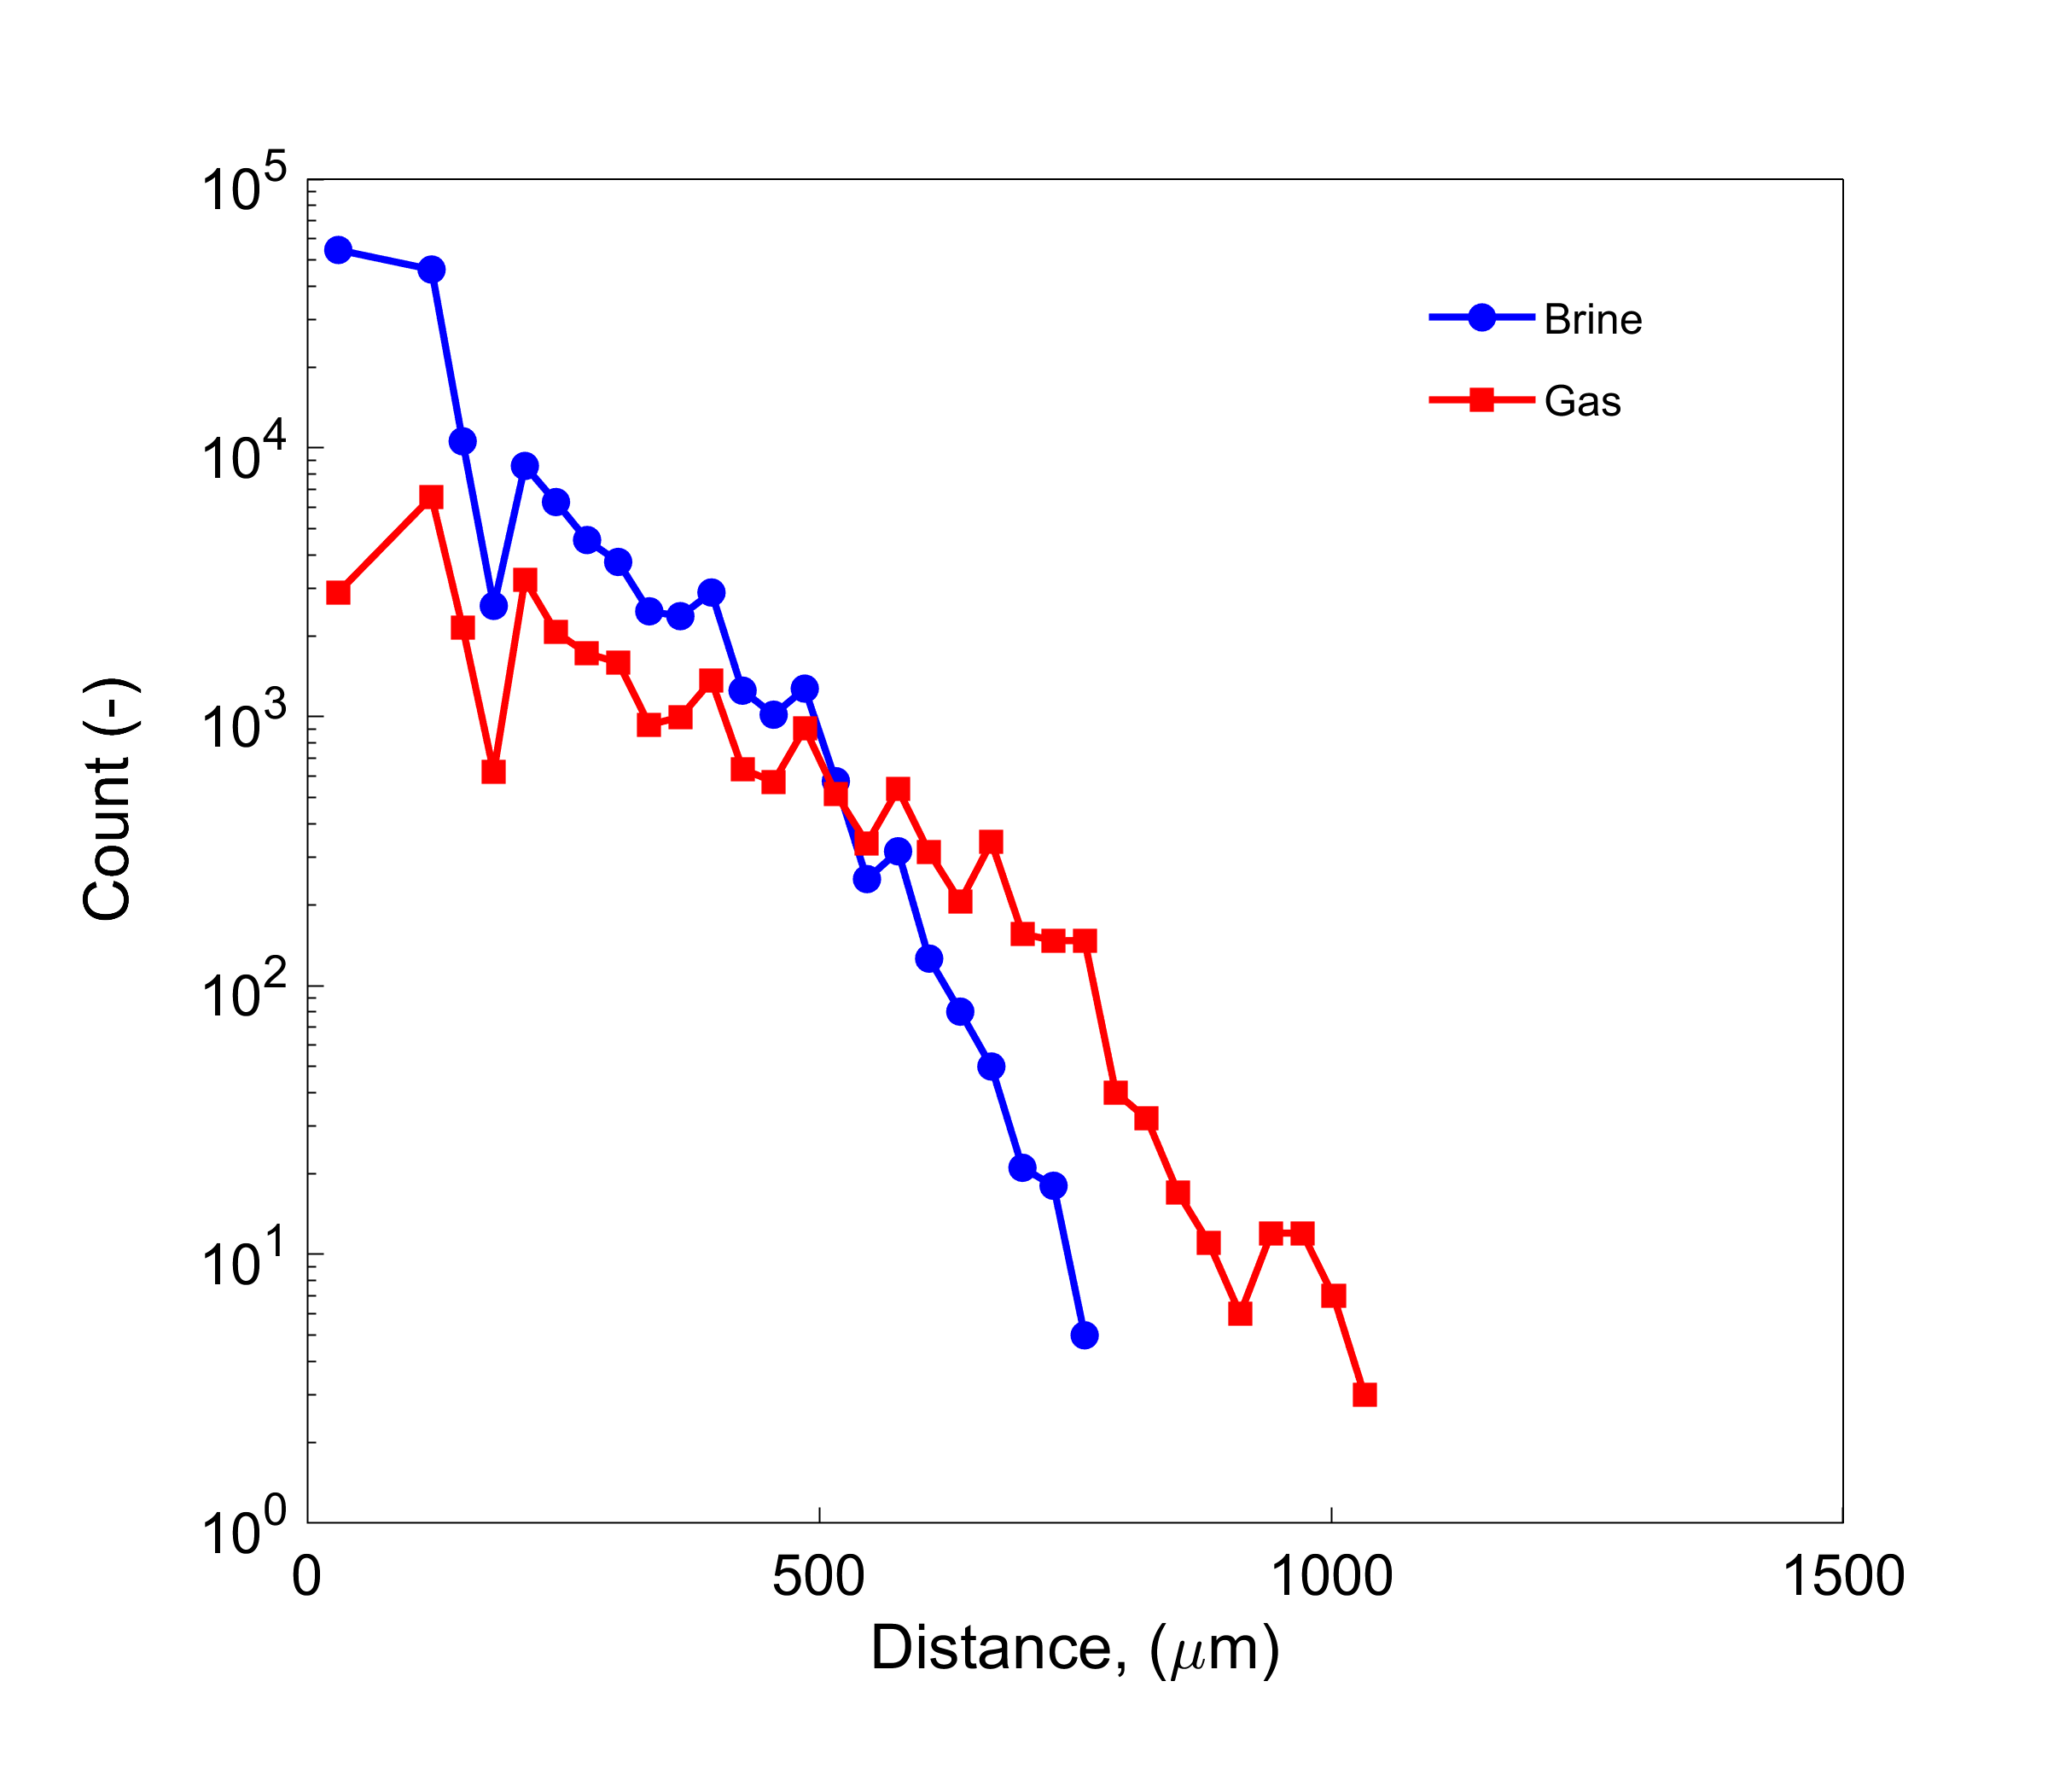
The skeleton derived from the distance map of the segmented dry fracture was utilized to generate these graphs. The segmented oil and brine phases were analyzed based on their proximity to the fracture walls. If the center of a fracture location was occupied by a specific fluid, that location was assigned to the corresponding fluid phase in the analysis. The fluid occupancy of brine and gas as a function of distance for varying fractional flows is presented in Figures 1, 2, and 3 for the hydrogen-brine, methane-brine, and nitrogen-brine experiments, respectively.


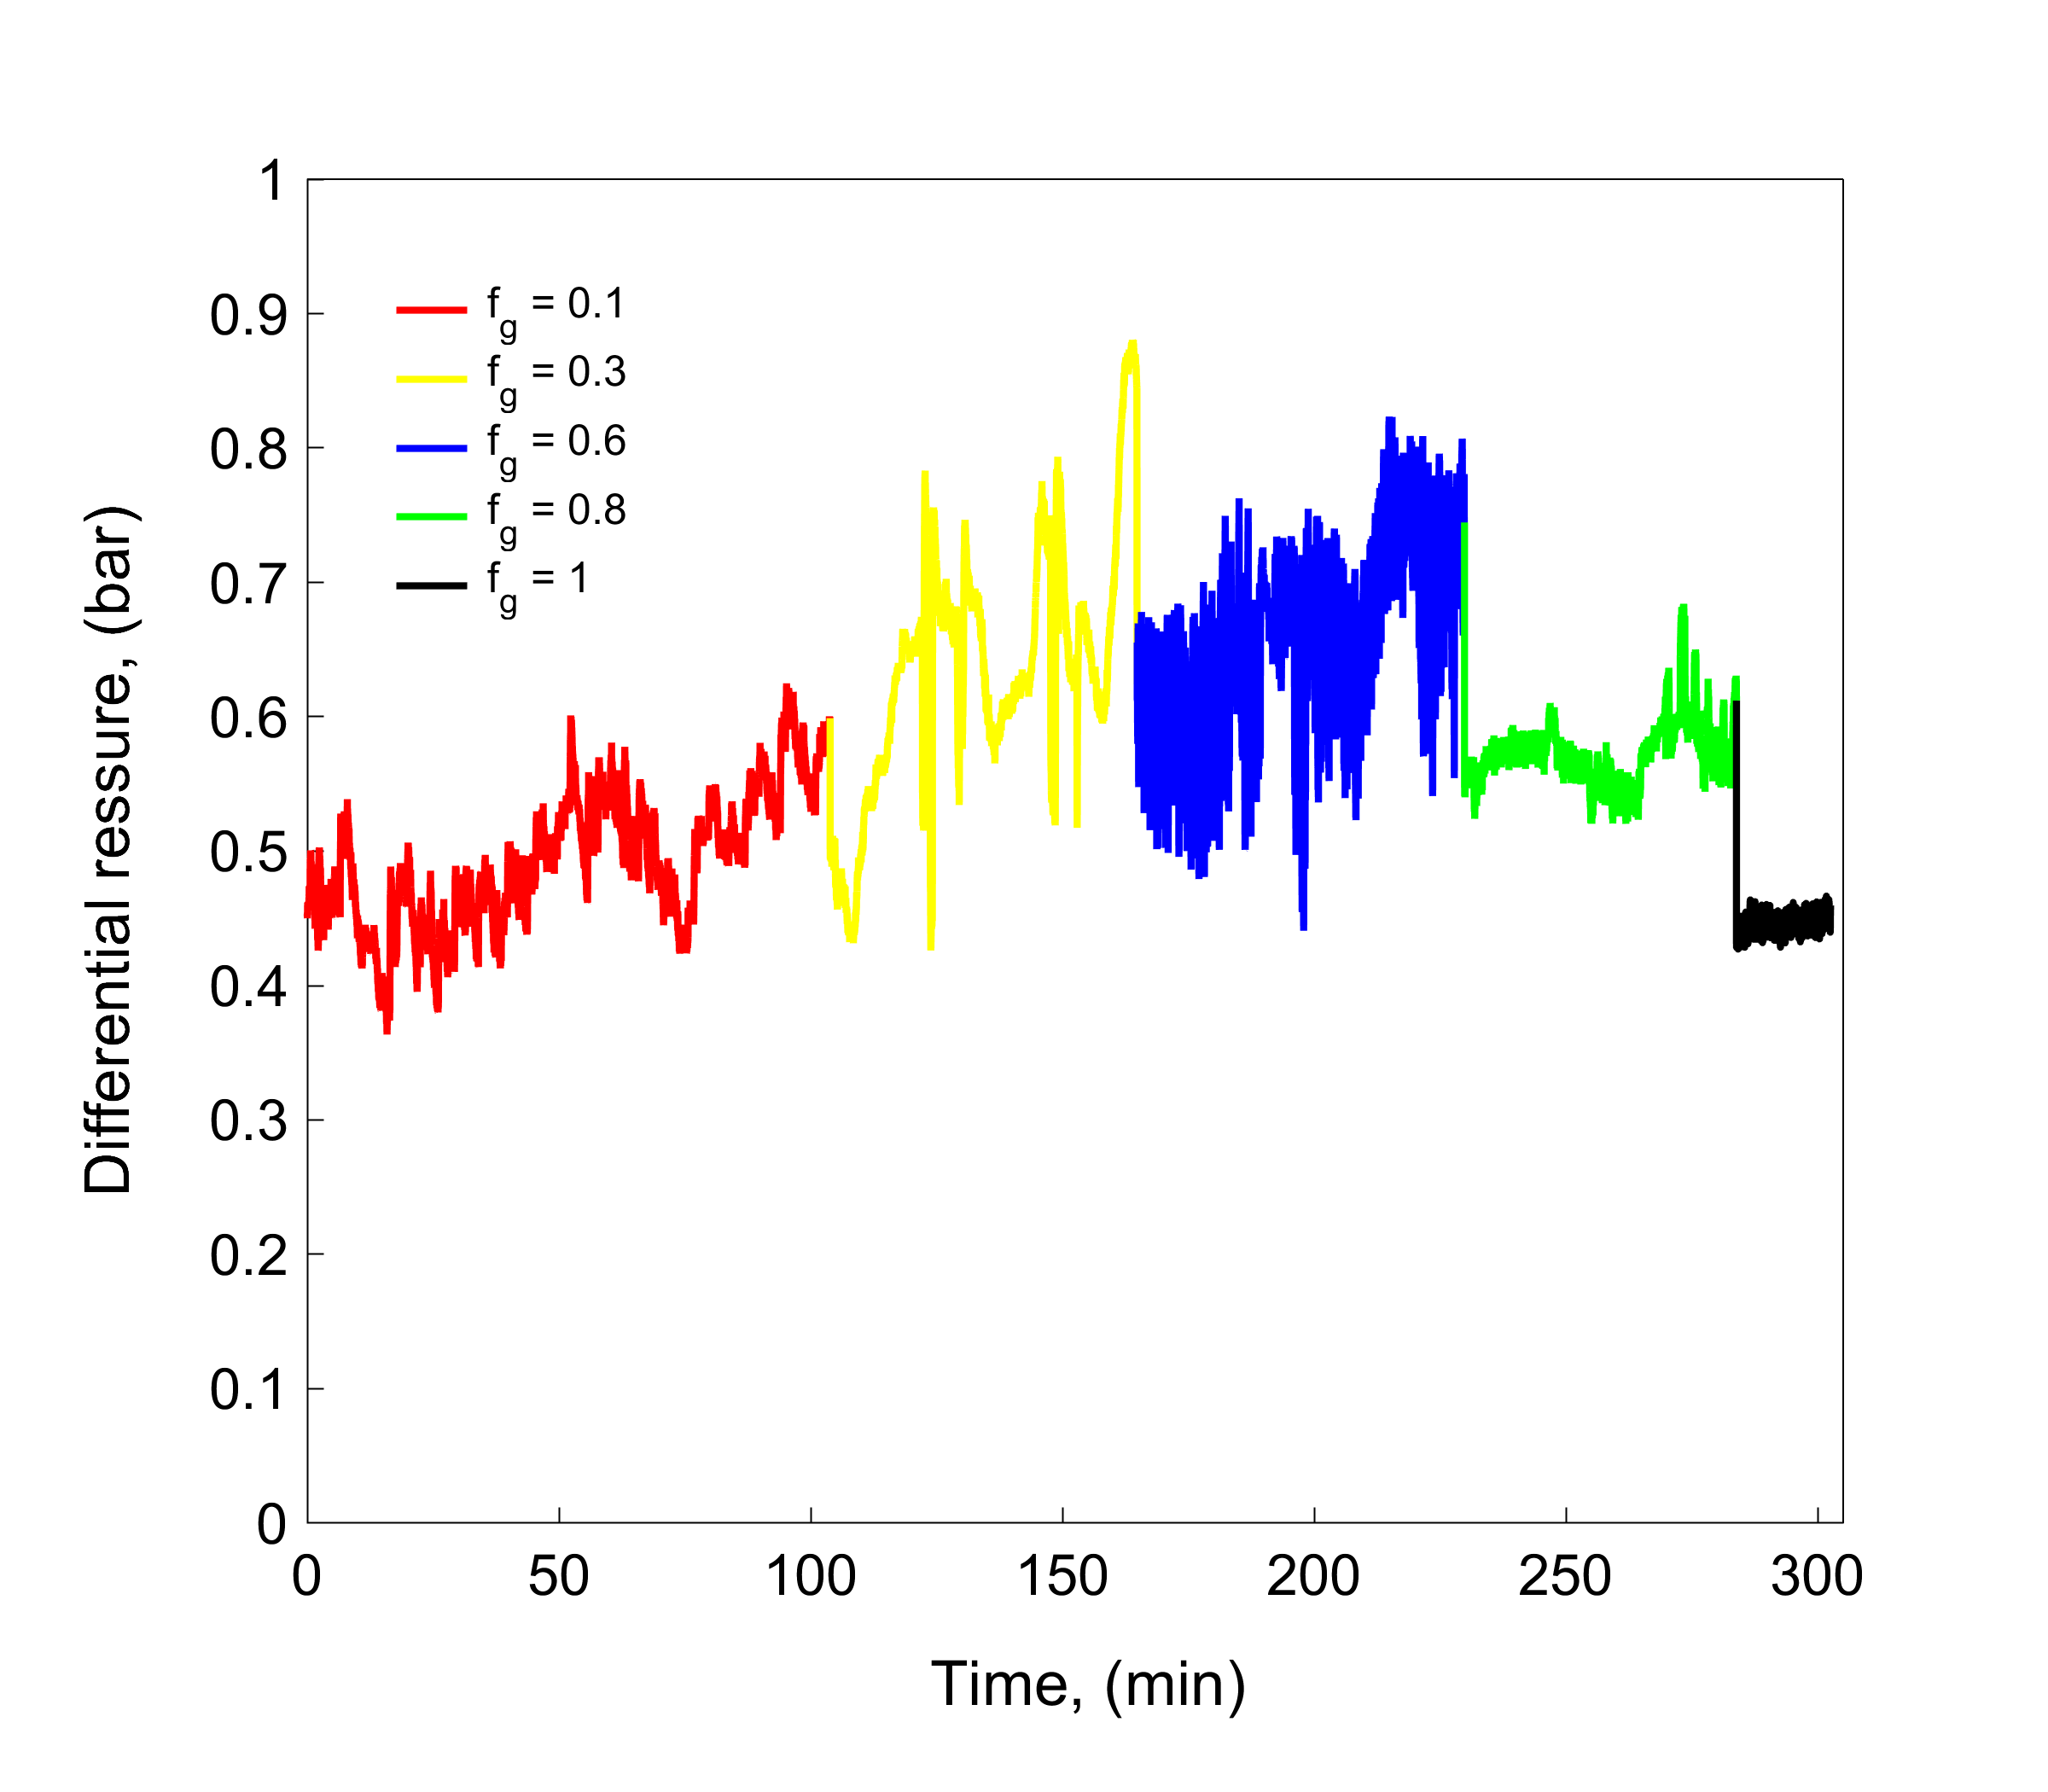
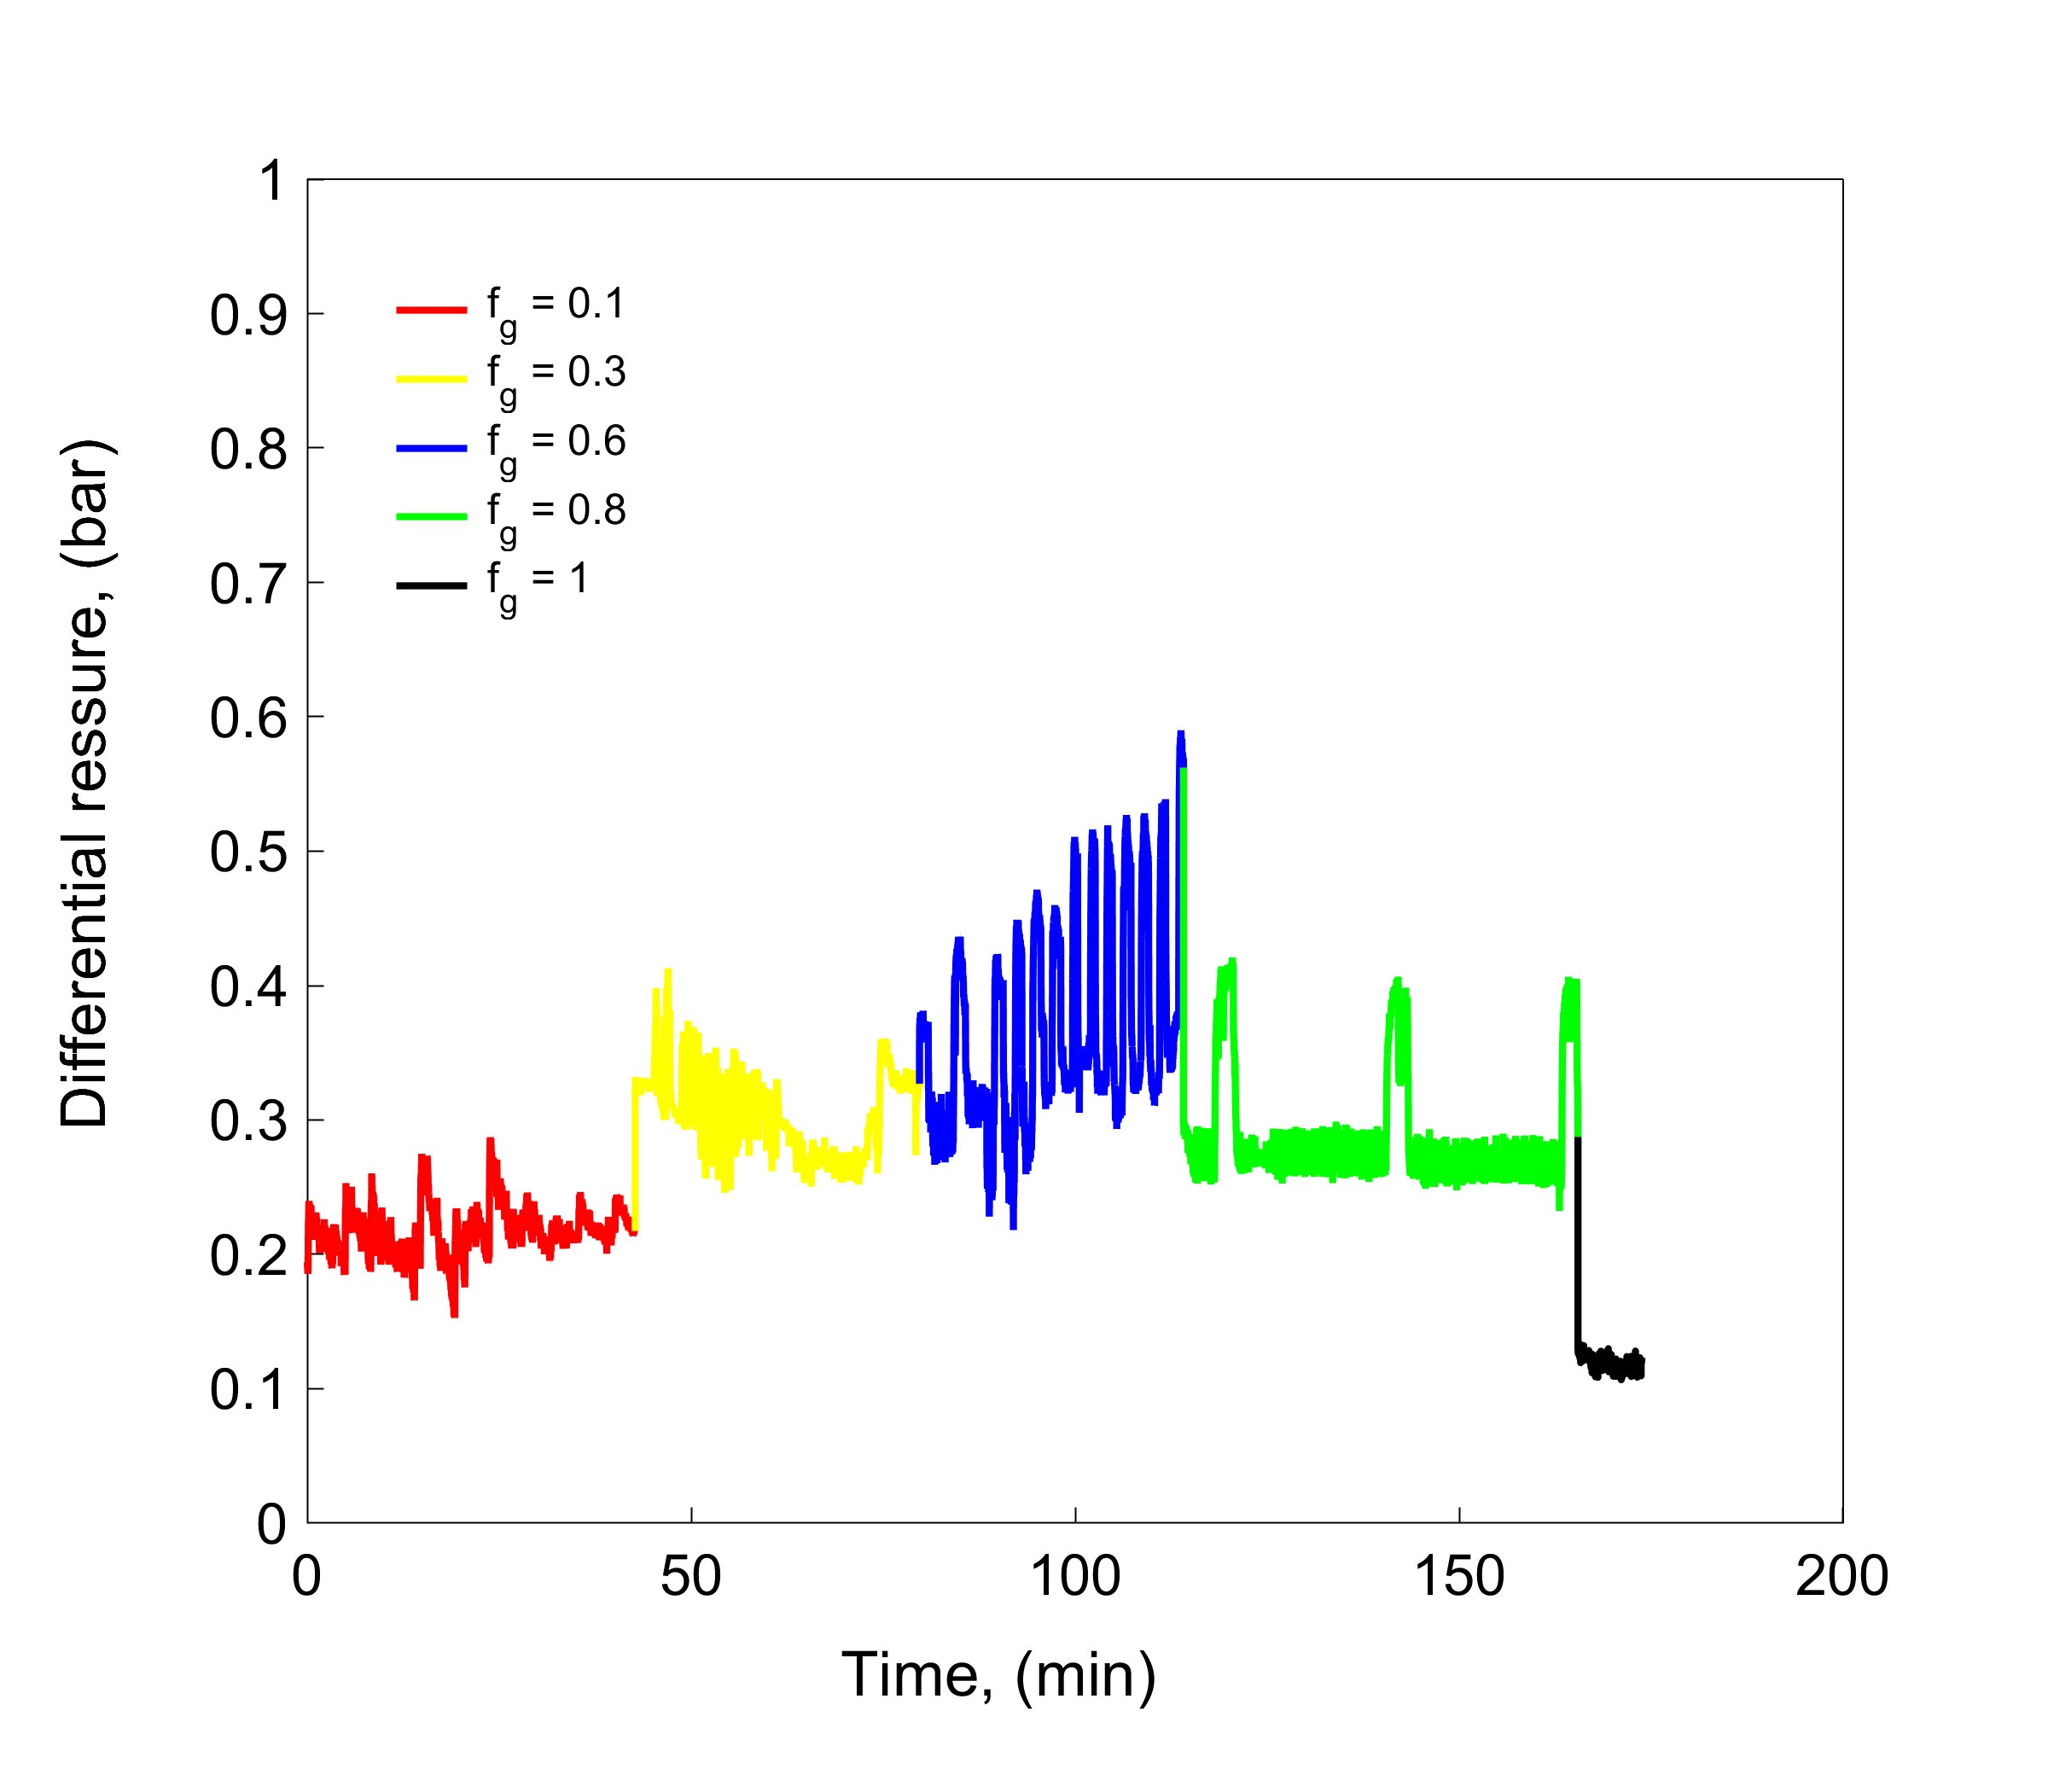
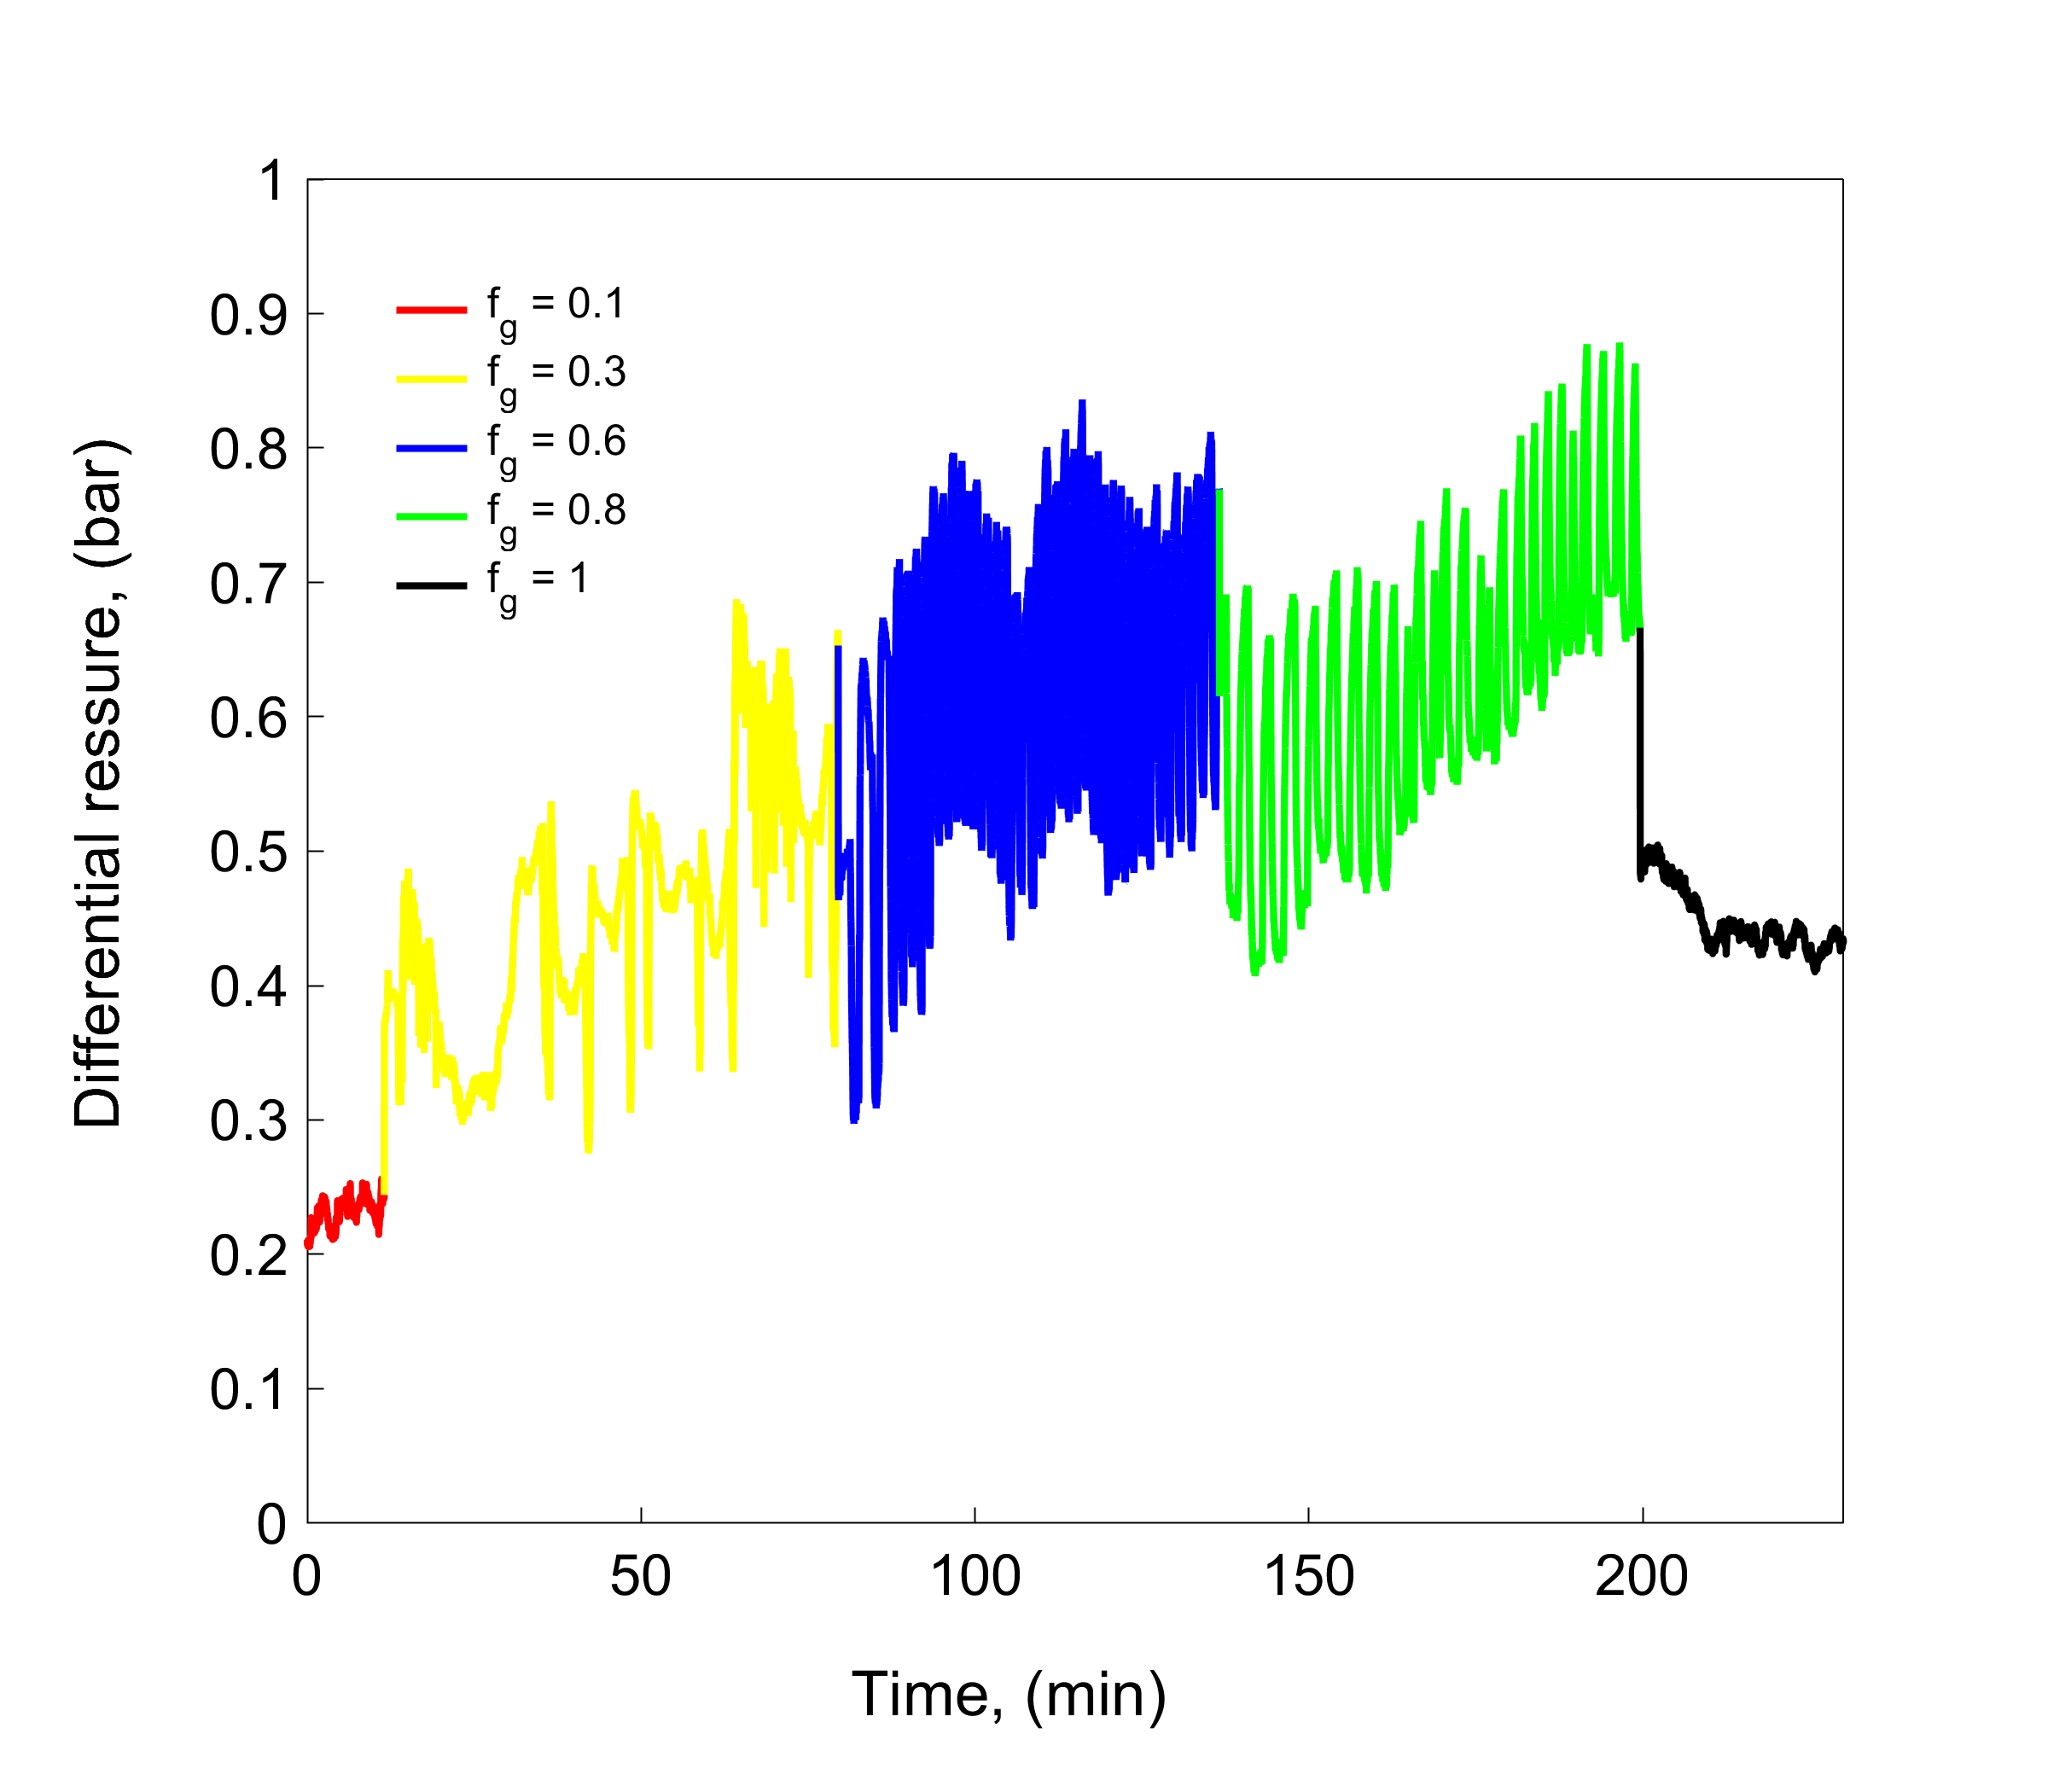
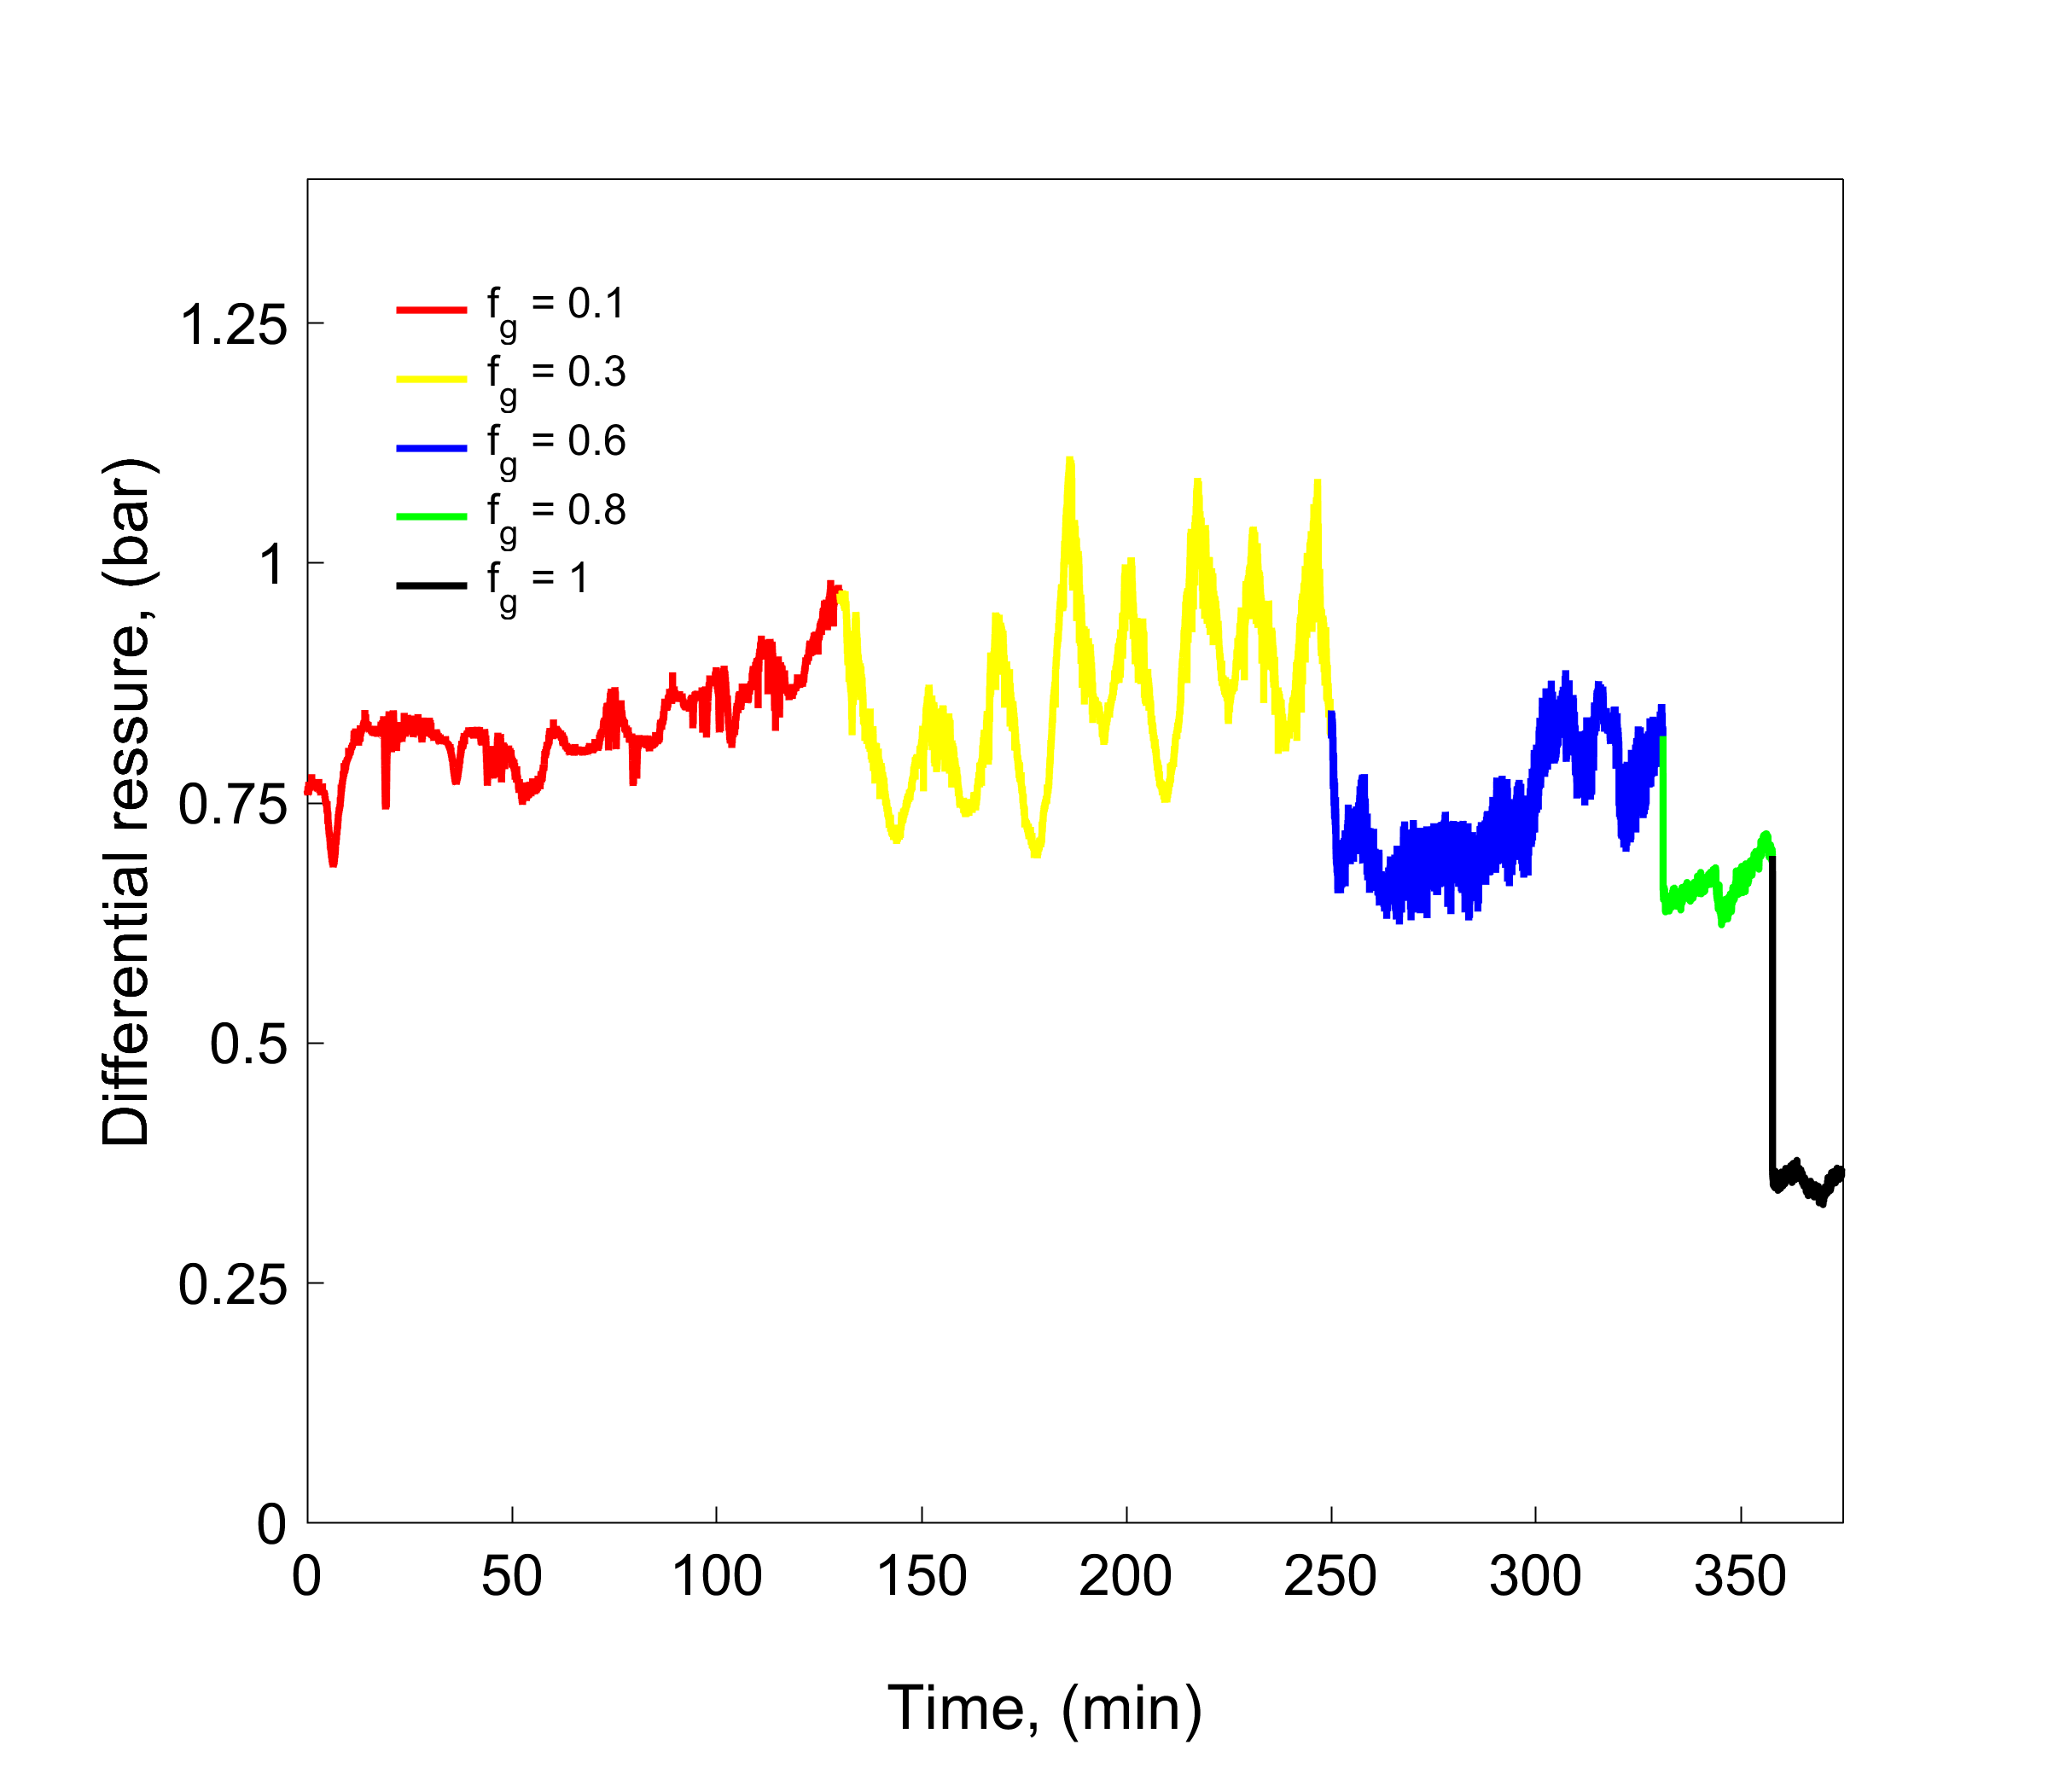
2 S2: Differential pressure
The steady-state pressures for different fractional flows were measured using a differential pressure transducer (PD-33X) and are presented in Figures 4, 5(a), and 5(b) for two runs each of the hydrogen, methane, and nitrogen experiments, respectively. Steady-state was achieved within 3 hours for the initial fractional flow, while subsequent fractional flows reached steady-state within 2 hours. This equilibration time is significantly shorter compared to traditional core-flood experiments in porous media.
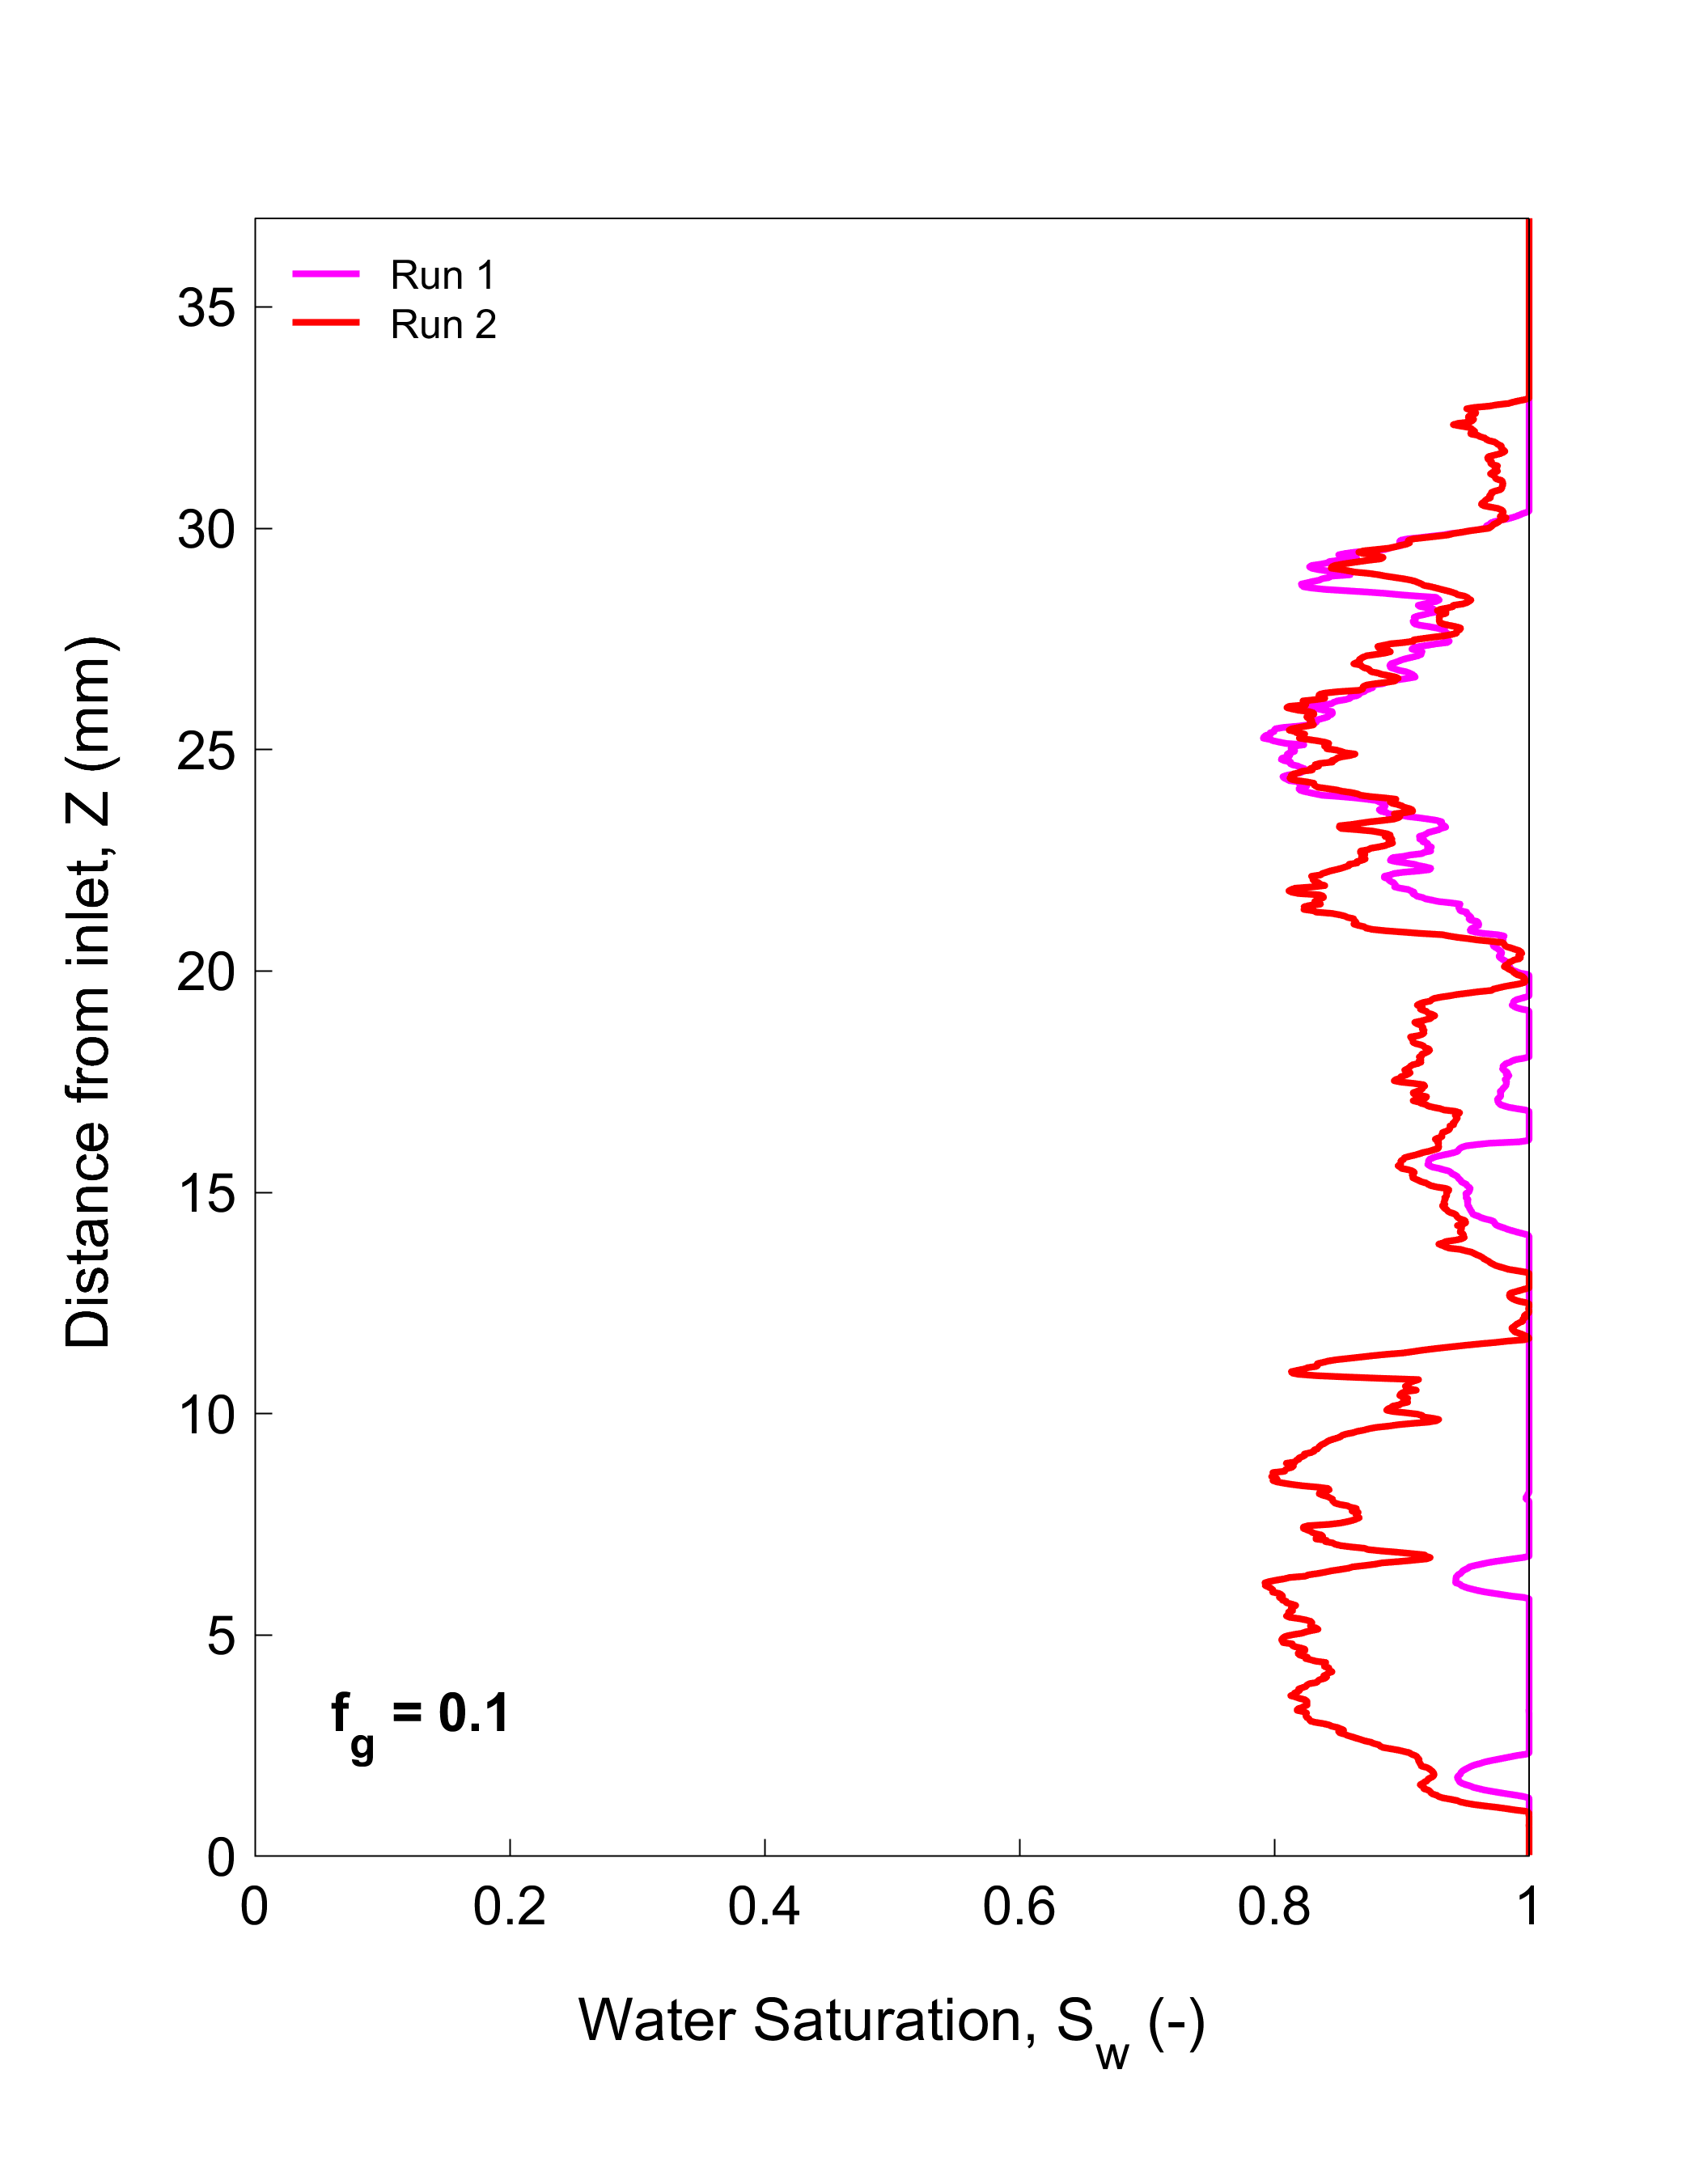
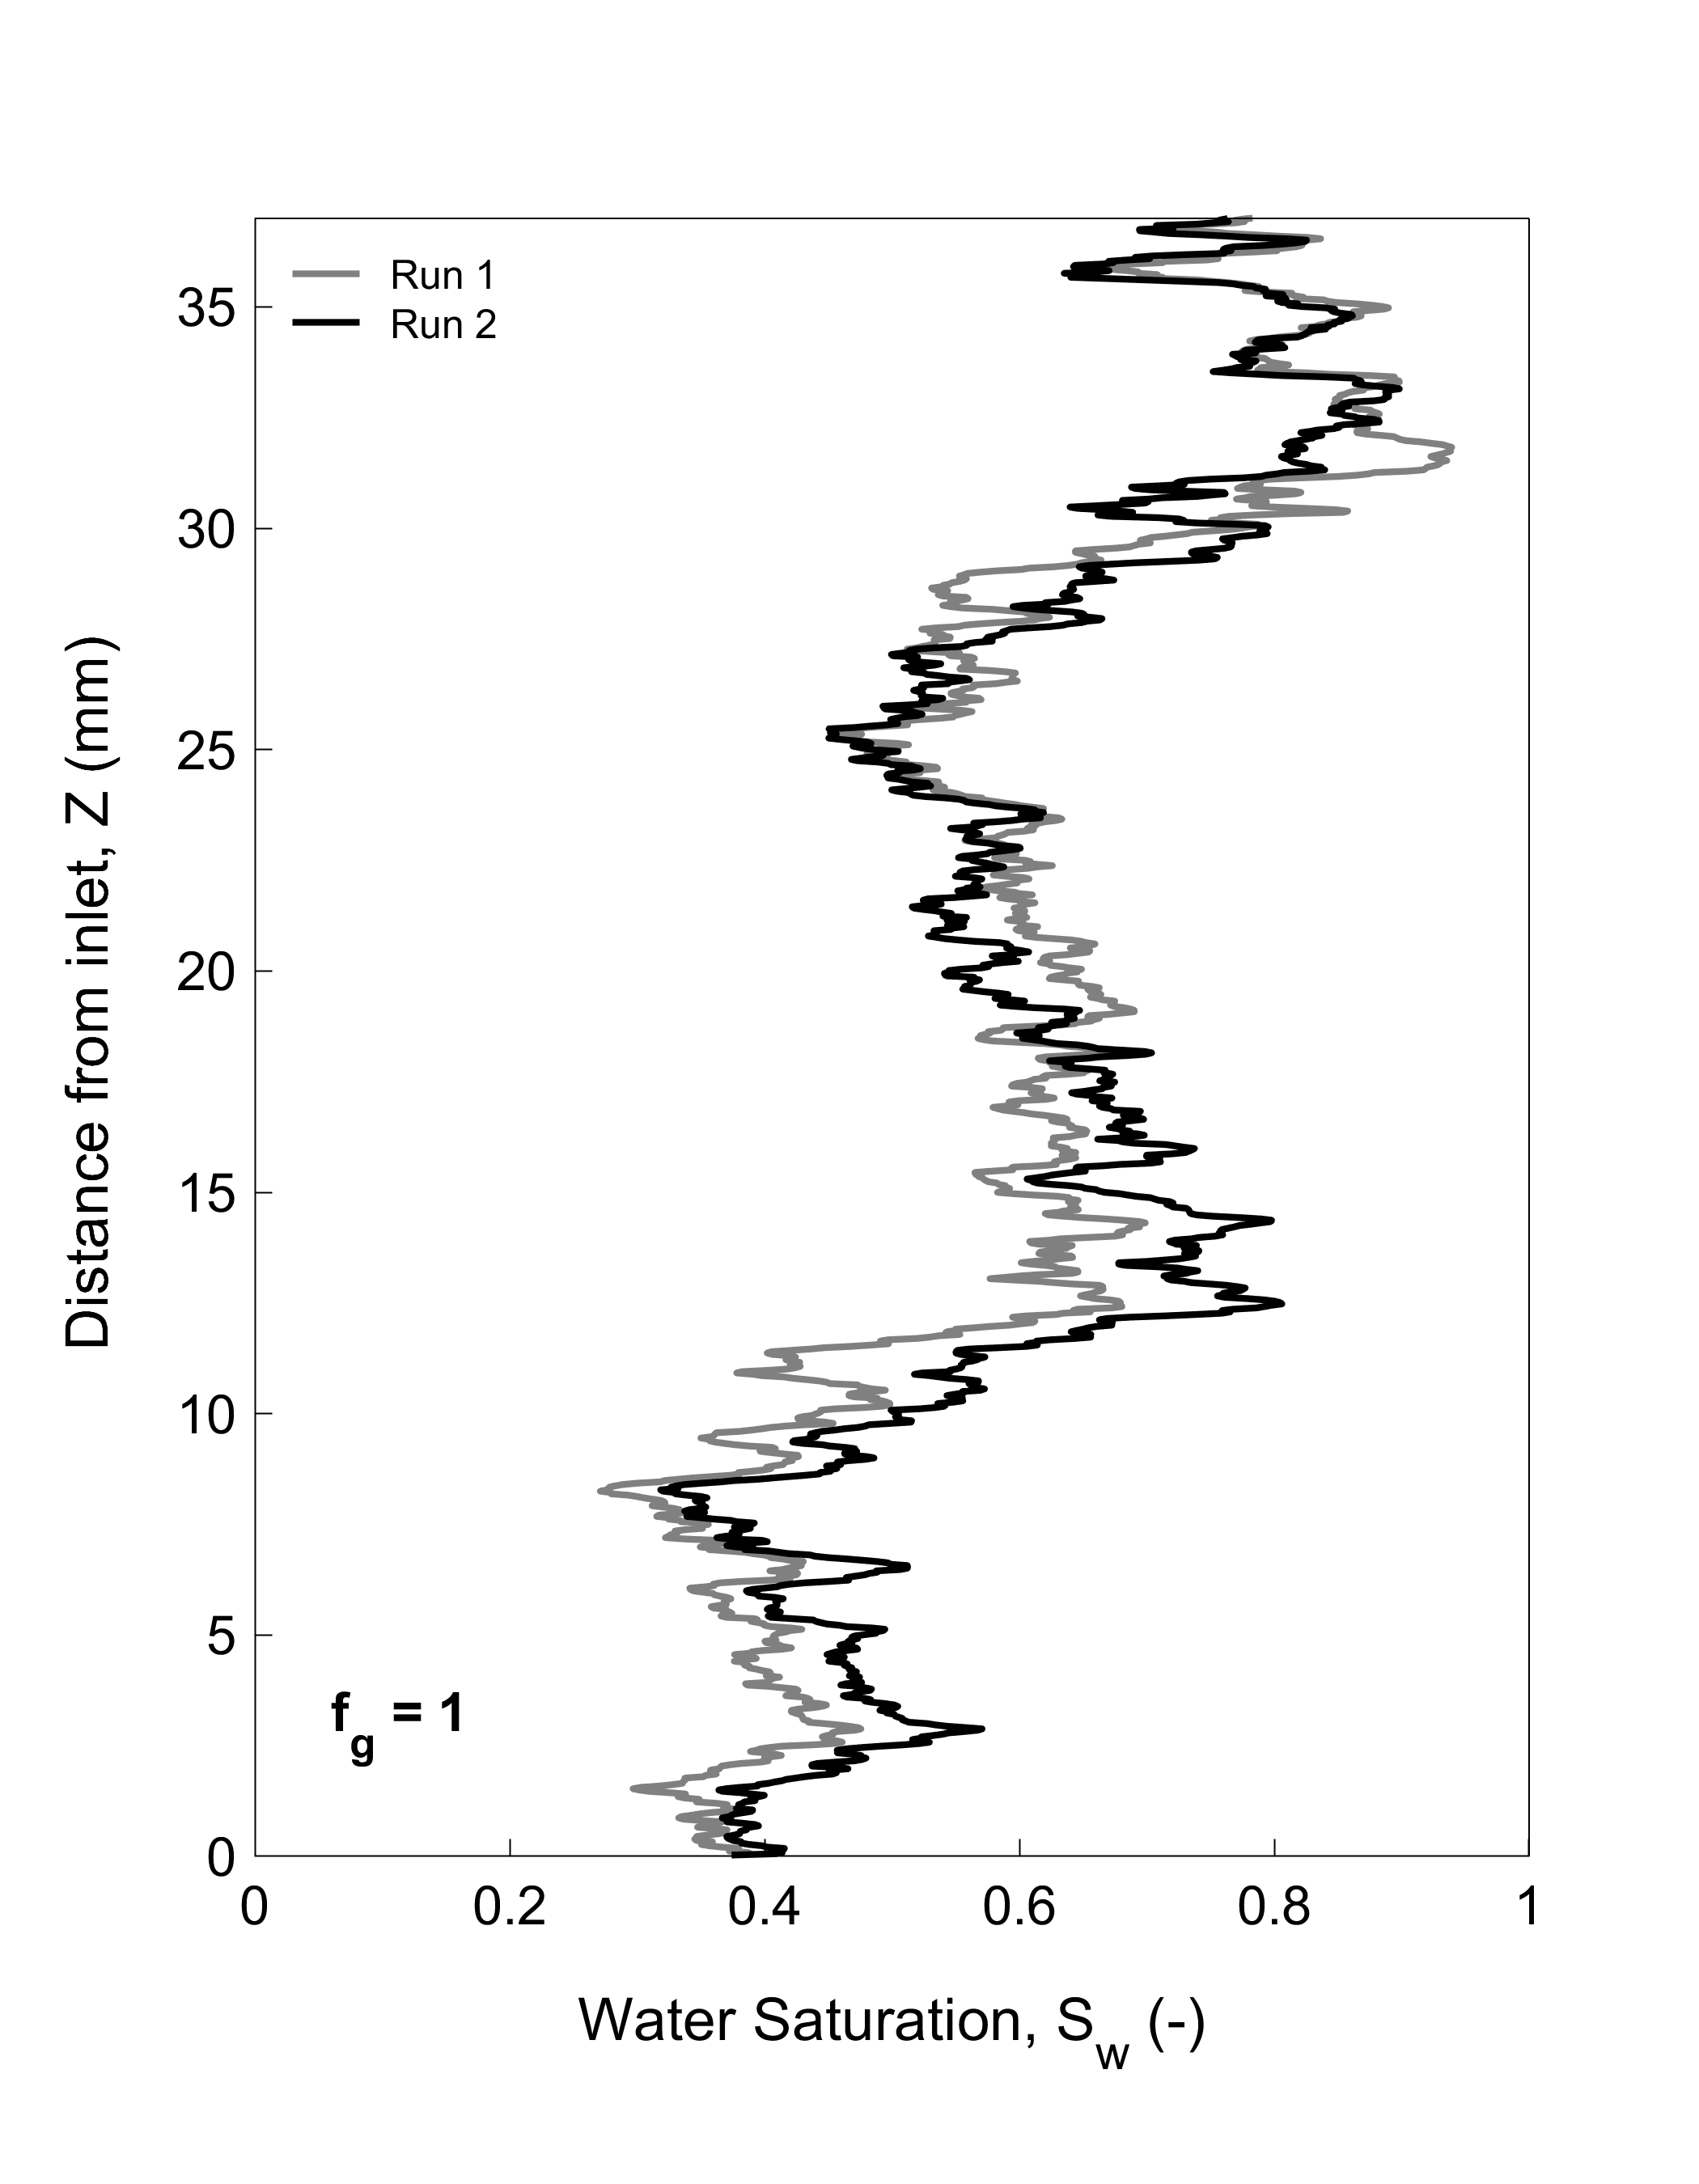
3 S3: Sensitivity analysis : saturation
Figure 6 shows saturation profiles from two experimental runs at two different gas fractional flows. At a lower fractional flow (fg = 0.1), the saturation profiles exhibited significant variation, indicating greater intermittency in fluid distribution. With an increase in fractional flow to = 1, the saturation profiles became more consistent, as illustrated in Figure 6(b). The average saturation variation between the two runs was 6% for = 0.1 and 3% for = 1. These observations suggest that the two-phase hydrogen-brine flow system is more susceptible to fluctuations at lower capillary numbers, where capillary forces strongly influence the flow. Despite these slight variations, the overall behavior remains consistent across both experimental runs, confirming that our workflow is robust and validating the results presented in this study.
4 S4: Nitrogen relative permeability : comparison to literature
The nitrogen-brine relative permeability is compared with experimental and numerical data from the literature for fractured media. The gas permeability for the nitrogen-brine system closely aligns with predictions by Gong et al. [1] for water-oil system, whereas the water permeability is lower than the model’s prediction at the same water saturation.
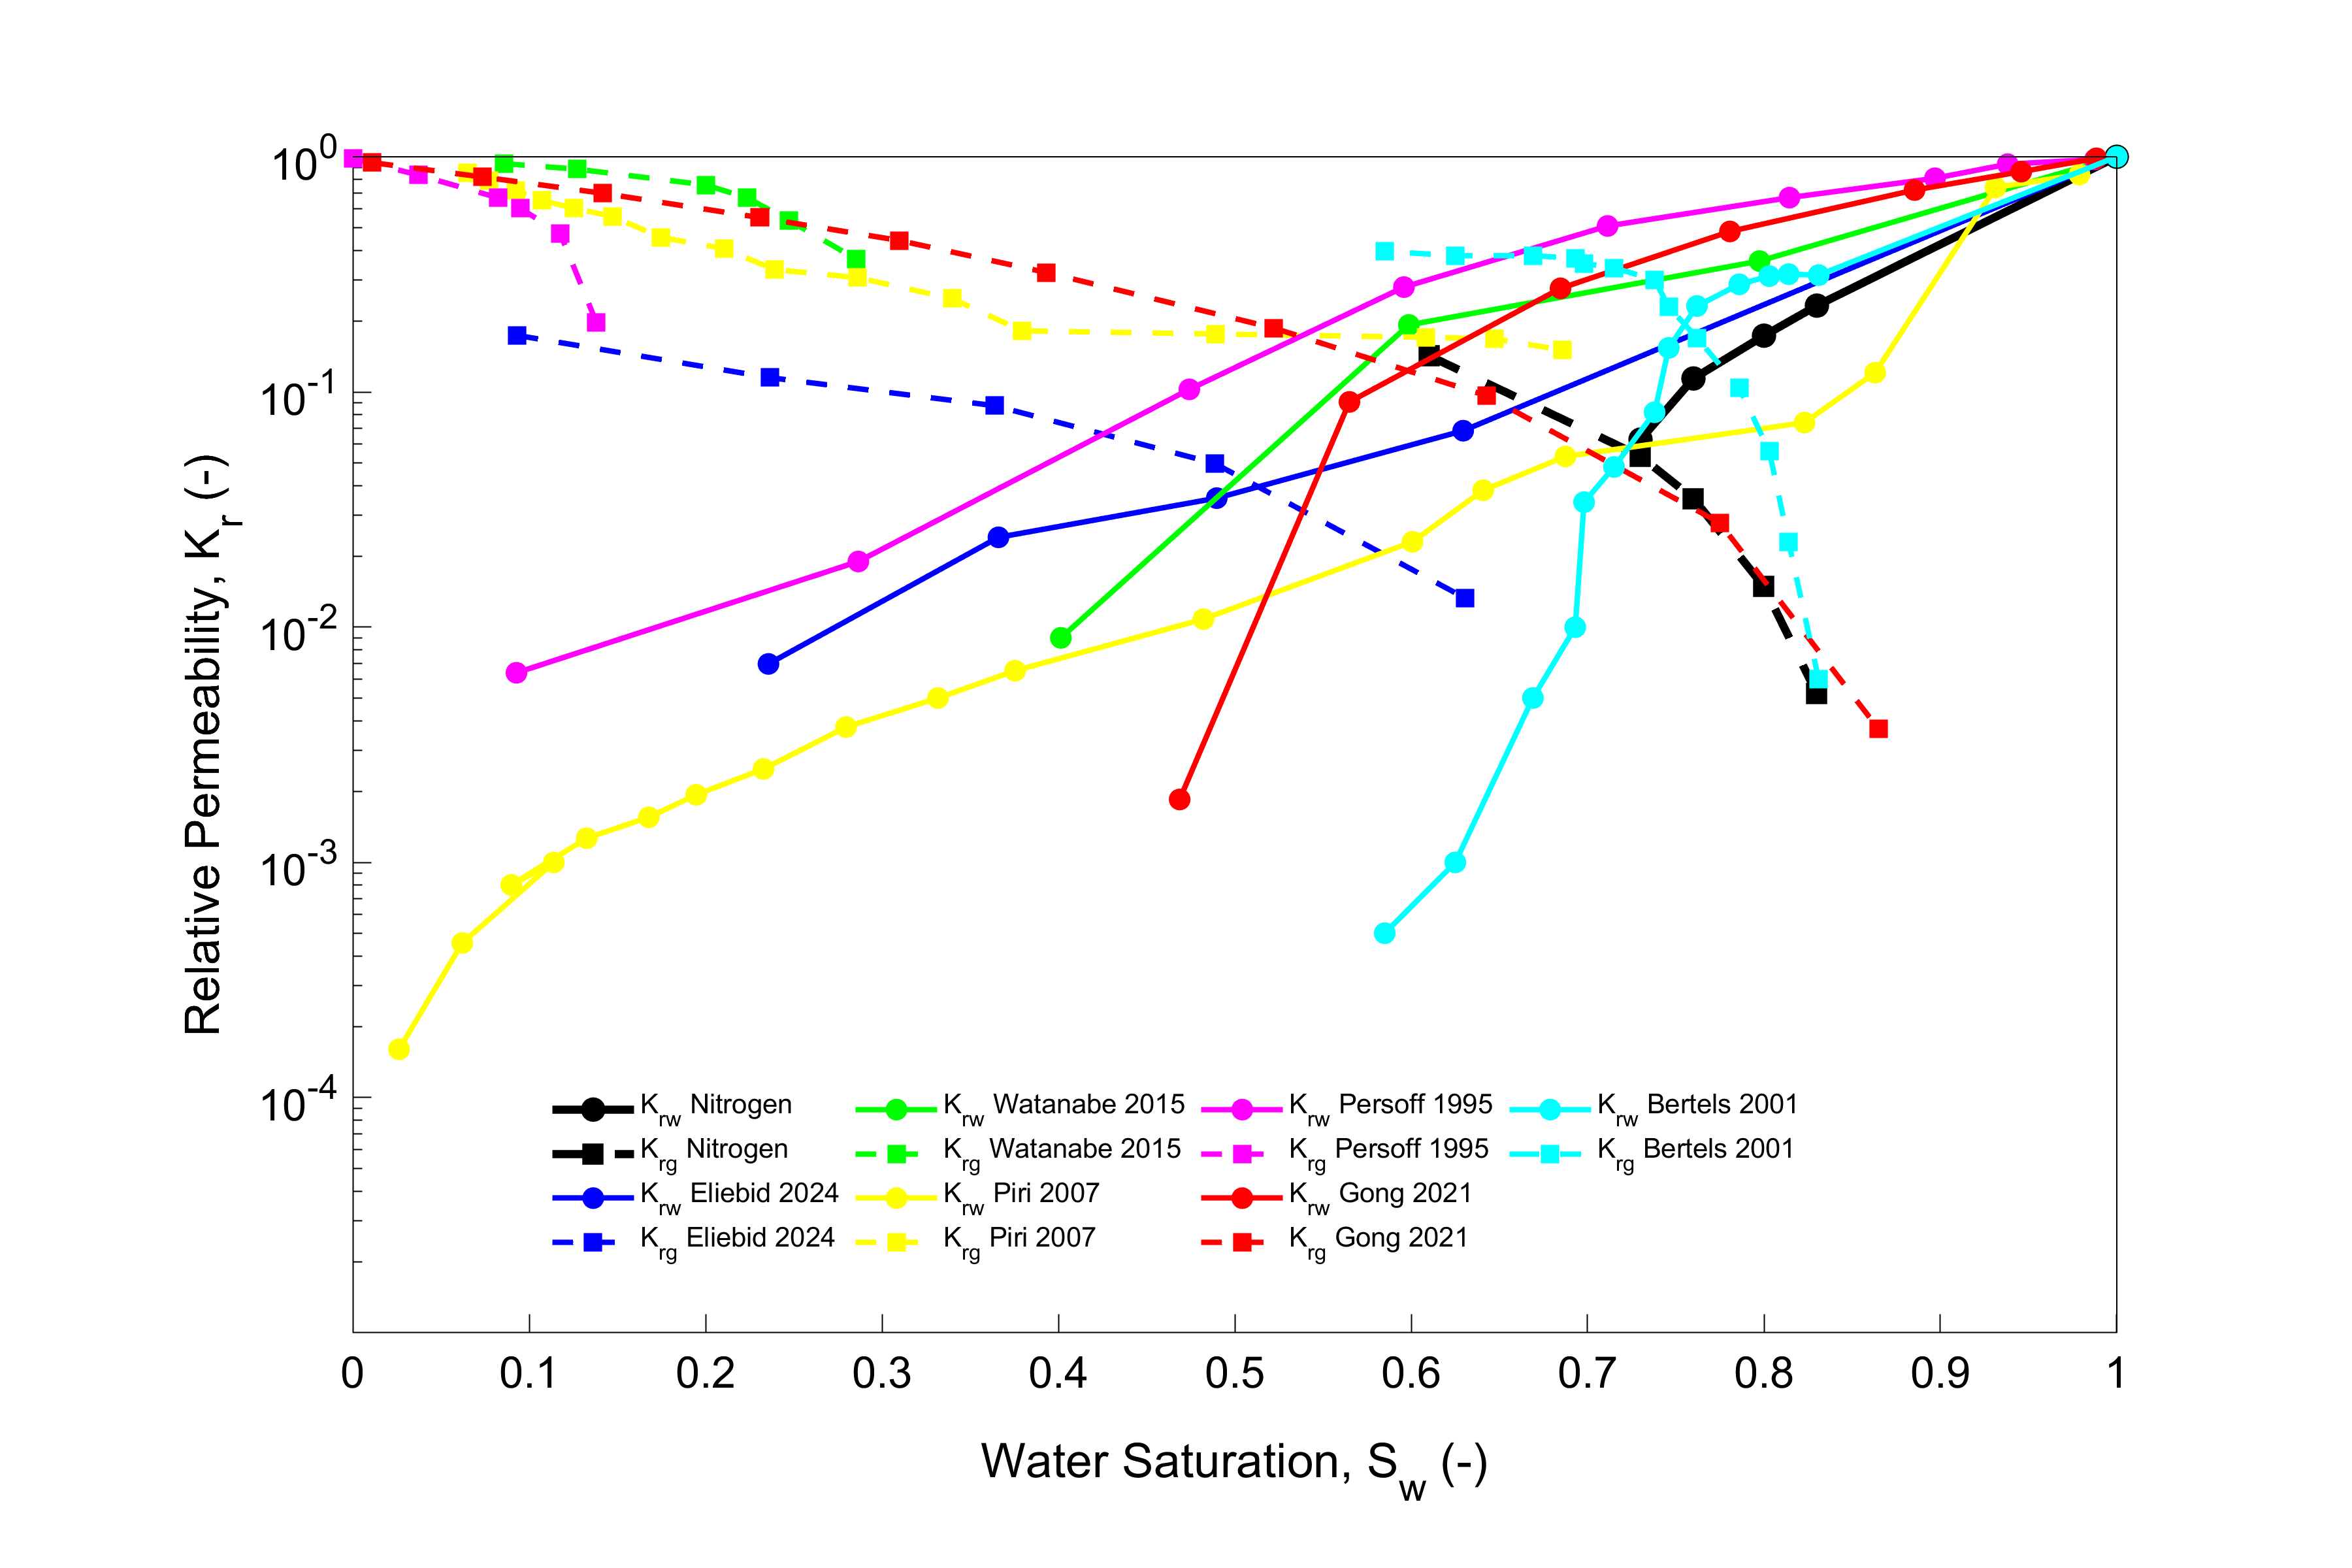
Table LABEL:Fluid_systems lists the different fluid pairs used in this study and those from the literature for comparison.
| Paper | Wetting phase | Non-wetting phase |
|---|---|---|
| Eliebid et al. [2] | 1 wt% KCl | filtered Soltrol 170 mineral oil |
| Gong et al. [1] | water | oil |
| Watanabe et al. [3] | water | decane/nitrogen |
| Piri and Karpyn [4] | water | decane |
| Bertels et al. [5] | water | nitrogen |
| Persoff and Pruess [6] | water | air |
References
- Gong et al. [2021] Yanbin Gong, Mohammad Sedghi, and Mohammad Piri. Two-Phase Relative Permeability of Rough-Walled Fractures: A Dynamic Pore-Scale Modeling of the Effects of Aperture Geometry. Water Resources Research, 57(12), 2021. doi: https://doi.org/10.1029/2021WR030104.
- Eliebid et al. [2024] Mohammed Eliebid, Abdelhalim Mohamed, Maziar Arshadi, Yanbin Gong, and Mohammad Piri. Relative permeability hysteresis and residual trapping in rough-walled fractures: An experimental investigation of the effects of flow rate and saturation history using the steady-state approach. Advances in Water Resources, 189:104729, 2024. doi: https://doi.org/10.1016/j.advwatres.2024.104729.
- Watanabe et al. [2015] Noriaki Watanabe, Keisuke Sakurai, Takuya Ishibash, Yutaka Ohsaki, Tetsuya Tamagawa, Masahiko Yagi, and Noriyoshi Tsuchiya. New m-type relative permeability curves for two-phase flows through subsurface fractures. JAWRA Journal of the American Water Resources Association, 51(4):2807–2824, 2015. doi: https://doi.org/10.1002/2014WR016515.
- Piri and Karpyn [2007] Mohammad Piri and Zuleima T. Karpyn. Prediction of fluid occupancy in fractures using network modeling and x-ray microtomography. II: Results. Physical Review E - Statistical, Nonlinear, and Soft Matter Physics, 76(1):016316, 2007. doi: https://doi.org/10.1103/PhysRevE.76.016316.
- Bertels et al. [2001] Stephanie P. Bertels, David A. DiCarlo, and Martin J. Blunt. Measurement of aperture distribution, capillary pressure, relative permeability, and in situ saturation in a rock fracture using computed tomography scanning. Water Resources Research, 37(3):649–662, 2001. doi: https://doi.org/10.1029/2000WR900316.
- Persoff and Pruess [1995] P. Persoff and K. Pruess. Two-Phase Flow Visualization and Relative Permeability Measurement in Natural Rough-Walled Rock Fractures. Water Resources Research, 31(5):1175–1186, 1995. doi: https://doi.org/10.1029/95WR00171.