Accelerating UMAP for Large-Scale Datasets Through Spectral Coarsening
††preprint: APS/123-QEDThis paper introduces an innovative approach to dramatically accelerate UMAP using spectral data compression. The proposed method significantly reduces the size of the dataset, preserving its essential manifold structure through an advanced spectral compression technique. This allows UMAP to perform much faster while maintaining the quality of its embeddings. Experiments on real-world datasets, such as USPS, demonstrate the method’s ability to achieve substantial data reduction without compromising embedding fidelity.
I Introduction
Uniform Manifold Approximation and Projection (UMAP) [1] has emerged as a powerful tool for dimensionality reduction and data visualization, particularly for uncovering complex manifold structures in high-dimensional data. Unlike traditional methods such as PCA, which rely on linear transformations, UMAP preserves both local and global relationships by constructing a high-dimensional graph representation of the data and optimizing its embedding in a lower-dimensional space. This ability to maintain intricate relationships while providing high-quality visualizations has made UMAP a popular choice in fields ranging from bioinformatics to natural language processing.
Despite its effectiveness, UMAP faces significant computational challenges when applied to large-scale datasets. Specifically, the graph construction and optimization steps of UMAP involve neighbor searches and iterative optimization, resulting in a time complexity of for approximate nearest neighbor searches and up to for the full graph construction in dense data [1]. This complexity becomes a bottleneck in big data scenarios, where the sheer volume of data points leads to a rapid increase in computation time. Additionally, UMAP’s performance can degrade in high-dimensional spaces due to the curse of dimensionality, where distances lose interpretability, further impacting both speed and embedding quality. These limitations restrict UMAP’s scalability and applicability in emerging data-intensive tasks, highlighting the need for an optimized approach to enhance its efficiency.
Inspired by [2], in this paper, we propose a novel spectrum-preserving data compression method to address UMAP’s efficiency and scalability challenges. Our approach first generates a significantly smaller, compressed dataset while preserving the essential manifold structure of the original data, utilizing a nearly-linear time spectral data compression technique. This compressed representation substantially reduces the computational burden of neighbor searches and graph construction, enabling UMAP to handle large-scale datasets more efficiently. The compressed data is then processed by the standard UMAP algorithm, preserving the quality of the low-dimensional embeddings without sacrificing interpretability. An additional advantage of the proposed method is its flexibility, allowing users to specify the desired compression ratio based on computational constraints or quality requirements.
II Preliminary
II.1 UMAP
Uniform Manifold Approximation and Projection (UMAP) [1] is a state-of-the-art dimensionality reduction algorithm designed for both visualization and preserving the manifold structure of high-dimensional data. UMAP builds upon concepts from manifold learning and topological data analysis, making it highly effective for uncovering the intrinsic geometry of complex datasets. It operates through two main phases: graph construction and low-dimensional embedding optimization.
In the graph construction phase, UMAP builds a weighted -nearest neighbor (k-NN) graph to represent the local neighborhood relationships in the high-dimensional space. For each data point , the algorithm identifies its nearest neighbors based on a user-defined distance metric (e.g., Euclidean or cosine distance). A local connectivity structure is then formed by assigning weights to edges in the graph, reflecting the probability that two points are connected based on their distance. This weighted graph preserves the local density and proximity relationships within the data.
In the embedding optimization phase, UMAP optimizes a low-dimensional representation of the data that approximates the high-dimensional graph. The algorithm minimizes the divergence between the high-dimensional and low-dimensional representations by treating them as probabilistic graphs. Specifically, it applies stochastic gradient descent (SGD) to optimize the embedding, preserving both local and global structures. The result is a lower-dimensional projection of the data that retains key topological properties.
Formally, the UMAP algorithm can be summarized in the following steps:
-
1.
Graph Construction:
-
(a)
For each point , compute the -nearest neighbors based on the chosen distance metric.
-
(b)
Construct a weighted -NN graph with edge weights determined by local distance probabilities.
-
(a)
-
2.
Embedding Optimization:
-
(a)
Initialize a low-dimensional embedding of the data.
-
(b)
Use stochastic gradient descent to minimize the difference between the high-dimensional and low-dimensional graph structures.
-
(a)
UMAP’s strengths lie in its ability to preserve local and global relationships, handle datasets of varying complexity, and produce meaningful embeddings in both 2D and 3D spaces. However, UMAP’s computational efficiency can be a challenge for large-scale datasets. The graph construction phase involves computing pairwise distances and building a -nearest neighbor graph, which has a worst-case complexity of . While approximate nearest neighbor methods reduce this complexity to , the embedding optimization phase remains computationally intensive, requiring iterative updates that scale with the size of the dataset.
These challenges highlight the need for methods to improve UMAP’s scalability. In particular, large datasets and high-dimensional spaces exacerbate the computational burden, motivating the development of techniques such as data compression to reduce the input size while preserving essential manifold properties.
II.2 Graph Laplacian Matrices
A graph consists of a vertex set , an edge set , and a weight function that assigns positive weights to the edges. The Laplacian matrix of , denoted as , is a symmetric diagonally dominant (SDD) matrix defined as:
| (1) |
In spectral graph theory [3], the eigenvalues and eigenvectors of the graph Laplacian encode valuable information about the graph’s structure, particularly its clustering properties. By leveraging this spectral information, one can uncover latent relationships in the data that are not evident in the original feature space. For instance, in synthetic datasets such as two-moons and two-circles, applying -means directly in the original feature space often leads to incorrect clustering due to the algorithm’s dependence on Euclidean distance. However, transforming the data into the spectral embedding space using the graph Laplacian aligns the feature space with the intrinsic geometry of the data, enabling -means to accurately identify clusters and reflect the true underlying structure.
III Methods
III.1 Algorithmic Framework
Given a dataset of samples, we first construct a -nearest neighbors (k-NN) graph to capture the underlying manifold structure of the dataset. From , the corresponding graph Laplacian matrix is derived. The spectral similarity between data points is computed using the following procedure:
-
Extract the bottom nontrivial eigenvectors of the graph Laplacian;
-
Organize these eigenvectors as column vectors to form a matrix ;
-
Represent each data point as a low-dimensional feature vector corresponding to a row of ;
-
Define the spectral similarity between two points and as follows [4]:
| (2) |
Here, and represent the feature vectors of points and in the spectral embedding space. Statistically, quantifies the proportion of variance explained by the linear relationship between and in the spectral domain. A larger value indicates a stronger spectral connection between the points. To reduce the computational cost of eigen-decomposition, Gauss-Seidel relaxation can be used to generate smoothed embedding vectors, achieving linear time complexity [4].
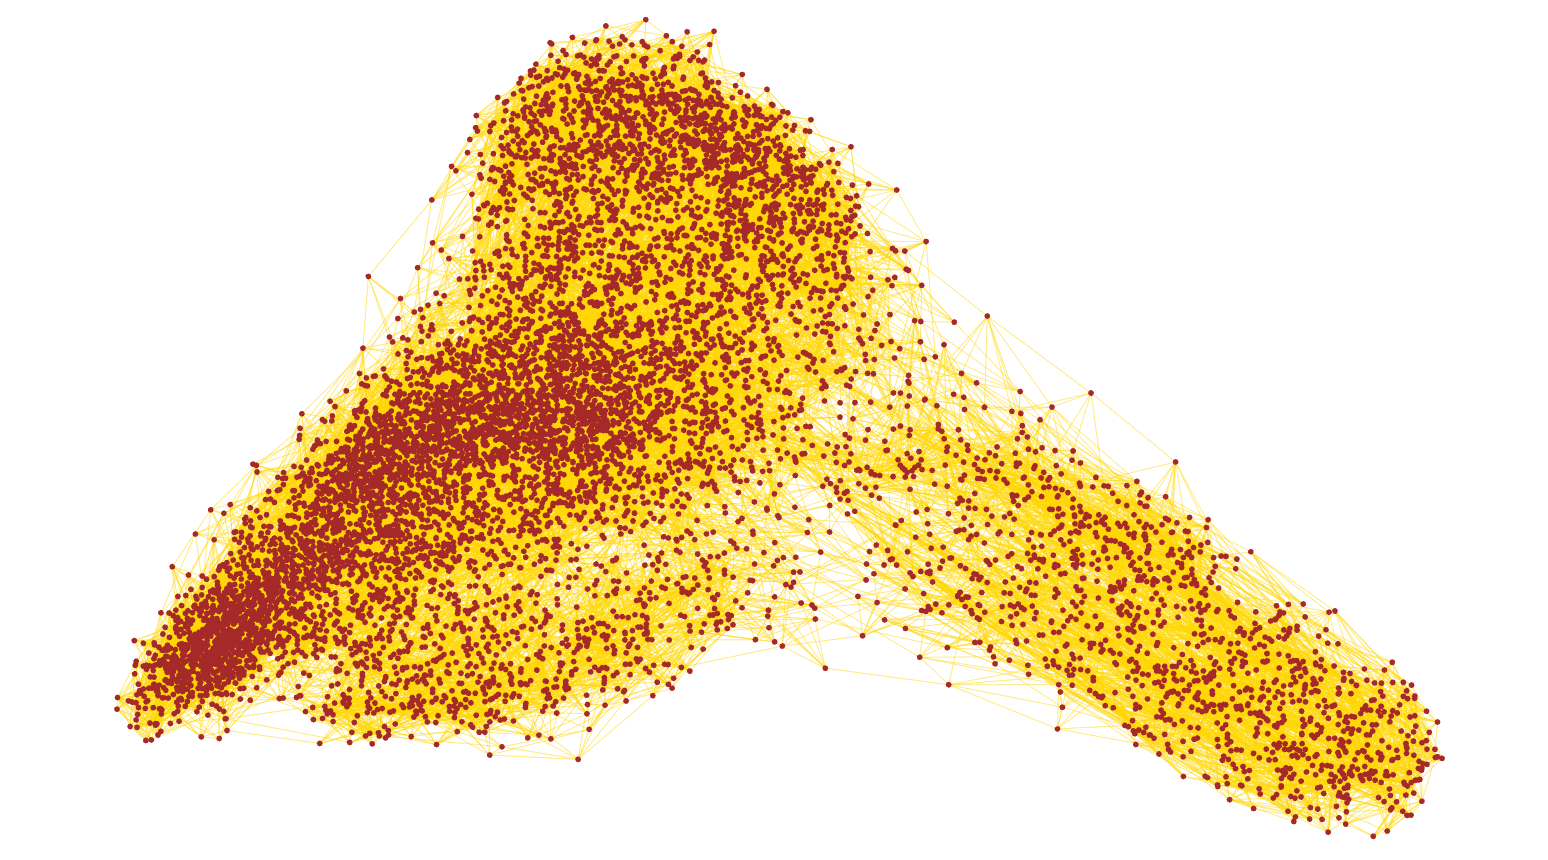
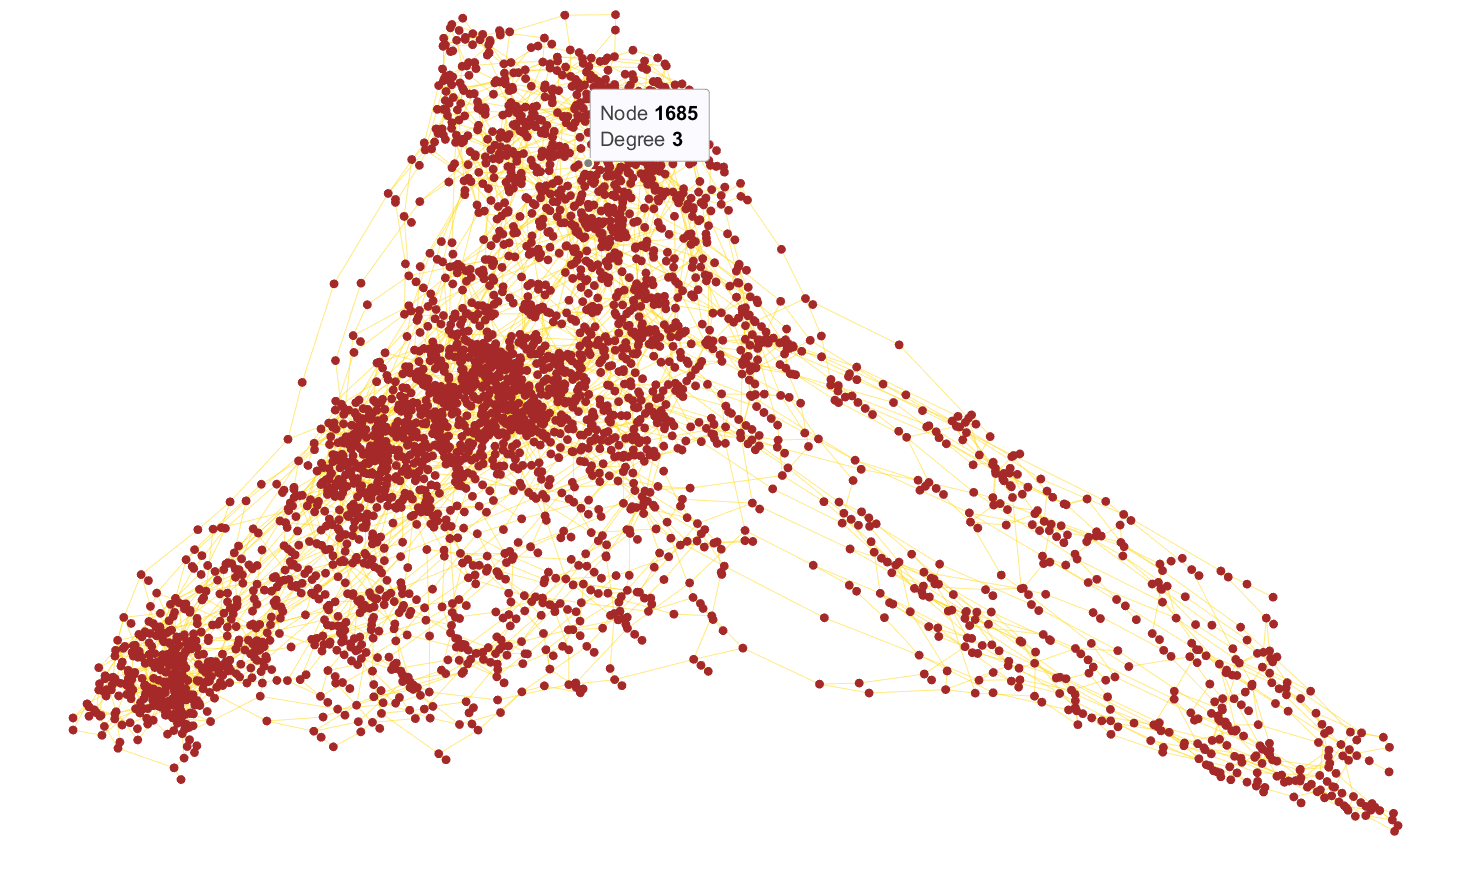
Using spectral similarity, the dataset is partitioned into subsets where points within the same subset exhibit high spectral correlation. For each subset, the mean of its feature vectors is computed to produce a spectrally representative pseudo-sample. These pseudo-samples collectively form a compressed version of the dataset. If further compression is required, this process can be repeated iteratively. Fig. 3 and Fig. 4 compare the -NN graphs of the original and compressed USPS datasets projected into 2D, illustrating that the compressed dataset successfully retains the manifold structure of the original data.
Then, the UMAP process can be applied on the compressed data points to generate a low-dimensional embedding that preserves the manifold structure of the original dataset.
Input: A dataset with samples .
Output: A low-dimensional embedding (e.g., or ).
III.2 Algorithm Complexity
The spectrum-preserving data compression requires time, where denotes the number of edges in the original graph, and represents the number of data points. Applying UMAP on the compressed dataset has a complexity of , where is the number of compressed points, reflecting the approximate nearest neighbor search and optimization steps.
IV Experiment
We use USPS data set to evaluate the method. The UMAP visualization results of the original USPS dataset and the dataset compressed by a factor of five are shown in Fig. 3 and Fig. 3, respectively. As observed, even after a five-fold compression, the compressed dataset effectively preserves the structure of the ten clusters in USPS, demonstrating its ability to maintain the underlying clustering characteristics.


V Conclusion
To address the computational challenges of UMAP, this study introduces a novel spectral data compression approach that generates a substantially smaller dataset while retaining the essential spectral properties necessary for manifold preservation. Experiments on large-scale, real-world datasets demonstrate that the proposed method significantly accelerates the UMAP algorithm without compromising embedding quality.
References
- [1] L. McInnes, J. Healy, and J. Melville, “Umap: Uniform manifold approximation and projection for dimension reduction,” arXiv preprint arXiv:1802.03426, 2018.
- [2] Y. Wang and Y. Song, “Accelerate support vector clustering via spectral data compression,” in International Conference on Neural Information Processing. Springer, 2023, pp. 88–97.
- [3] F. R. Chung, Spectral graph theory. American Mathematical Soc., 1997, vol. 92.
- [4] O. E. Livne and A. Brandt, “Lean algebraic multigrid (lamg): Fast graph laplacian linear solver,” SIAM Journal on Scientific Computing, vol. 34, no. 4, pp. B499–B522, 2012.