BAO vs. SN evidence for evolving dark energy
Alessio Notaria,b, Michele Redic, Andrea Tesic
a Departament de Física Quàntica i Astrofisíca & Institut de Cìencies del Cosmos (ICCUB),
Universitat de Barcelona, Martí i Franquès 1, 08028 Barcelona, Spain
b Galileo Galilei Institute for theoretical physics, Centro Nazionale INFN di Studi Avanzati
Largo Enrico Fermi 2, I-50125, Firenze, Italy
cINFN Sezione di Firenze, Via G. Sansone 1, I-50019 Sesto Fiorentino, Italy
Department of Physics and Astronomy, University of Florence, Italy
Abstract
We critically review the evidence for time-varying dark energy from recent Baryon Acoustic Oscillations (BAO) and Supernova (SN) observations. First, we show that such evidence is present at the 3 level, even without the new BAO data from the dark energy Spectroscopic Instrument (DESI), by instead using BAO data from the dark energy Survey (DES), combined with the DES5Y supernovae and Planck CMB data. Next, we examine the role of the DES5Y supernova dataset, showing that the preference for time-varying dark energy is driven by the low redshift supernovae common to both the DES5Y and Pantheon+ compilations. We find that combining Pantheon+ and DES5Y supernovae by removing the common supernovae leads to two different results, depending on whether they are removed from the DES5Y or the Pantheon+ catalog, leading to stronger or weaker exclusion of CDM, at the (3.8) and (2.5) level, respectively. These common supernovae have smaller error bars in DES5Y compared to Pantheon+, and, as recently pointed out, there is an offset in magnitude in DES5Y between supernovae at (), where almost all the measurements taken during the full five years of DES are, and the low-redshift ones (), where all the historical set of nearby supernovae lies. We show that marginalizing over such an offset in DES5Y would lead to significantly weaker evidence for evolving dark energy.
1 Introduction and status
Learning that dark energy (DE) changes in time would be the greatest scientific result since the discovery of the accelerated expansion of the Universe itself, and it would have implications for fundamental physics both at the phenomenological and theoretical level. For this reason testing if DE is just a cosmological constant () or if it possibly has a time evolution is a very active experimental and observational field as it will establish the range of validity of the CDM model.
Since the Universe has just “recently” entered its accelerated expansion phase, the search for time dependencies of dark energy has to rely on observables that are sensitive to the scale factor, , of the Friedmann-Robertson-Walker (FRW) metric background, at relatively recent cosmic times , or redshifts , on the possible largest scales.
It turns out that a very useful quantity is the so-called transverse diameter distance , defined – for a spatially flat universe – as the integral of the inverse Hubble parameter
| (1) |
The Hubble scale is determined by the total energy density of the Universe at each redshift, through the Friedmann equation, and therefore is sensitive to a possible time evolution of DE, which at late time dominates the budget, . Luckily, such a quantity is directly related to two of the main observables available in the late universe: the luminosity flux from supernovae (SN), and the angle related to the so-called Baryon Acoustic Oscillations (BAO). It comes with no surprise that these two have received great attention in recent times.
In particular, the recent determination of the BAO at different redshift bins by the dark energy Spectroscopic Instrument (DESI) [1] has sparked an intense debate on the nature of DE (see for example [2, 3]). The claim can be quickly summarized by saying that the collaboration found significant evidence for an evolving DE component.
This conclusion has been reached thanks to two main steps. First, the collaboration has tested the hypothesis that DE is parametrized as a fluid with a time-dependent equation of state ,
| (2) |
following the Chevallier-Polarski-Linder parametrization [4, 5]. Second, the final result has been reached – crucially – by combining the DESI BAO measurements with Planck CMB data in combination with a SN dataset. This leads to CDM favoured compared to CDM at the and level depending on the SN dataset considered, i.e. Pantheon+ [6, 7], DES5Y [8] or Union3 [9] SN datasets respectively.
Both steps can be reconsidered in a more complete analysis.
However, despite the fact that the best-fit values for the new parameters and correspond to a fluid with a pathological equation of state at early times (), we will not reconsider here the theoretical model, and we will use the same parametrization of (2). Let us notice, however, that consistent models (which can be realized with a simple and healthy quintessence scalar field) in agreement with the claim of [1] have already been presented in the literature [10, 11, 12, 13, 14, 15, 16]. We refer to those papers for all the theoretical considerations, and we will leave the discussion aside in this work.
Instead, the primary focus of our work is to carefully re-examine the claims in [1] from the point of view of data analysis, taking inspiration by the already known fact that, when the combination of DESI BAO is done with different SN datasets, the evidence for evolving DE diminishes. For example, while the evidence is sizable using DES5Y or the Union3 datasets, milder evidence comes from using the Pantheon+ [17] SN dataset. It is of primary importance to understand whether the evidence is driven by one particular dataset, or if it supported by several of them. We will review thus the role of BAO itself and of SN datasets, to better understand how solid is the evidence coming from each of them.
The aim of our data analysis is actually two-fold.
First, we will show that the DESI BAO data can be replaced by another recent measurement, namely the year-6 BAO measurement from the dark energy Survey (DES) [18], which consists of a single bin with precision at . Combining this measurement with Planck and DES5Y SN we will compare to the fit that includes the DESI BAO data, with respect to the preference for evolving dark energy against CDM.
Second, we will analyze the difference between SN datasets used in the analysis. In particular we look for evidence of evolving DE when combining together DES5Y with Pantheon+, by removing the common dataset. We will show, however, that this procedure is not unique, due to discrepancies in such a common dataset between the two catalogs. Indeed it has been recently pointed out [19] that in the DES5Y catalog the common SN have a rather different trend as a function of , compared to the same SN in Pantheon+. In particular it has been claimed that such a common dataset in DES5Y has a 0.04 offset in magnitude between the low and high-redshift SN, which was not present in Pantheon+, and that once this offset is removed DES5Y leads to SN fits which are fully consistent with Pantheon+. For this reason we further explore the role of the common SN dataset in a more general analysis, leaving a free relative offset in magnitude between low and high redshift SN, and fitting to the full CMB+BAO+SN dataset.
The paper is organized as follows. In the next section we summarize the observables and the datasets used in the analysis. In section 3 we show the results by varying different BAO datasets. Later, in section 4 we fix the BAO from DESI and explore the impact of different SN catalogs, by carefully treating SN common to both DES5Y and Pantheon+ datasets. We summarize our findings in section 5. In appendix A we report the best fit parameters, mean and confidence intervals, based on the CDM parametrization determined through the Markov-Chain-Monte-Carlo for different datasets. Technical details of the SN datasets can be found in appendix B.
| Category | Name | Description | Ref. |
| CMB | P18 | Planck 2018 high- TT, TE, EE ; low- TT ; low- EE likelihoods; Planck 2018 lensing data. | [20] |
| SN | Pantheon+ | Pantheon+ supernovae compilation. | [6, 7] |
| DES5Y | DES5Y supernovae compilation. The likelihood has been derived by us using data and covariance found in [21], and it has been already used in [10] and cross-checked against the likelihood given in [22]. | [23]. | |
| BAO | DESIBAO | DESI 2024 BAO measurements. Redshift bins: | [1] |
| DESBAO | DES BAO measurement at effective redshift | [18] | |
| BOSSBAO | BAO measurements from 6dFGS at [24], SDSS MGS at [25] (BAO smallz), and CMASS and LOWZ galaxy samples of BOSS DR12 at [26] | [24, 25, 26] |
2 Observables and data
Our analysis depends on the cosmological model under consideration. As stated in the introductory section, we only consider two models: CDM vs CDM. The latter refers to a DE component with equation of state phenomenologically parametrized in (2), which implies that its energy density evolves as,
| (3) |
Here is the critical density and we assume a spatially flat universe so that the energy densities of DE, matter and radiation satisfy , where . Notice that for and one recovers the cosmological constant.
CMB observables (meaning TT, TE, EE spectra and lensing) are important to the discussion because they constrain the input cosmological parameters, and they are always included in our analysis. Also, although the fluctuations of the CDM component have a limited impact on the CMB (see however [10] for more details), we always include them in our numerical computations following the prescription of [27] when the equation of state crosses the ‘phantom’ divide, i.e. .
Of more direct connection with the focus of the paper are the observables of the BAO scales and SN luminosity fluxes.
BAO
The BAO ruler is the sound horizon at the epoch of baryon drag , at redshift , which is computed by an integral
| (4) |
where is the sound speed of the photon-baryon fluid. The measurements of the BAO scale are reported as dimensionless ratios, i.e. the angular scale for the transverse direction, although different quantities and combinations are also used [1].
SN fluxes
Calibration of SN fluxes can be more subtle. The observed flux of a Supernova with intrinsic luminosity is a function of , since , where the luminosity distance turns out to be , i.e. the “distance duality” relation [28, 29]. It is common to report the magnitude:
| (5) |
For our analysis here is simply a nuisance parameter 111We note that Pantheon+ and DES5Y catalogs have different conventions, and their has a relative offset ., since it depends both on and on the present-day Hubble rate 222Fixing this by the “distance ladder” method, as done by [30] would lead to a severe “Hubble tension” in both CDM and CDM models. See instead [31] for a recent analysis with DESI data that can address the Hubble tension, by considering dark radiation models that modify in the early Universe.. The SN datasets report the mean value and error of per each observation and their correlations via the covariance matrix.
2.1 Datasets used in this work
All the above observables are computed with the CLASS [32] Boltzmann solver. Our aim is to perform a Bayesian analysis to infer the posterior distributions of our cosmological parameters, and the Markov Chain Monte Carlo (MCMC) samples are generated through MontePython [33, 34]. The MCMC samples are then analyzed with GetDist [35] to produce all the posterior distributions and all the triangle plots of our paper.
In this work we consider three classes of datasets, corresponding to CMB, BAO and SN samples, as reported in table 1, to which we refer for the names used in the plots and the description of all individual datasets and likelihoods.
3 BAO likelihoods: DES vs DESI
In this section we are going to analyze the CDM model with different combinations of datasets. In particular we are after the impact of the recent DESI and DES measurements of BAO scale. As discussed in the introduction, the recent DESI measurements of the BAO have attracted a lot of attention as they show a preference for evolving dark energy with equation of state . This happens when DESI is combined with CMB and DES5Y supernovae dataset. We refer the reader to [1] for all the details of the experimental analysis.
Here we combine a different BAO dataset to establish whether the evidence against CDM found in [1] is confirmed at similar levels. The focus is to compare two different dataset combinations that only differ by the BAO set used, namely
| (6) |
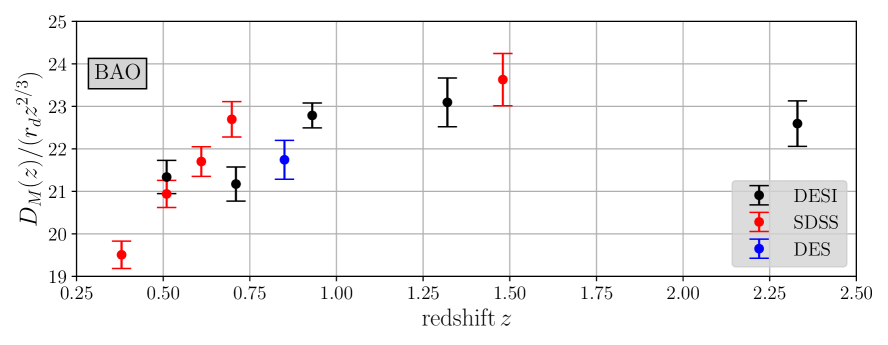
whose likelihoods are listed in table 1. We also compare with previous BAO measurements from BOSS. For a visualization of part of the dataset see figure 1.
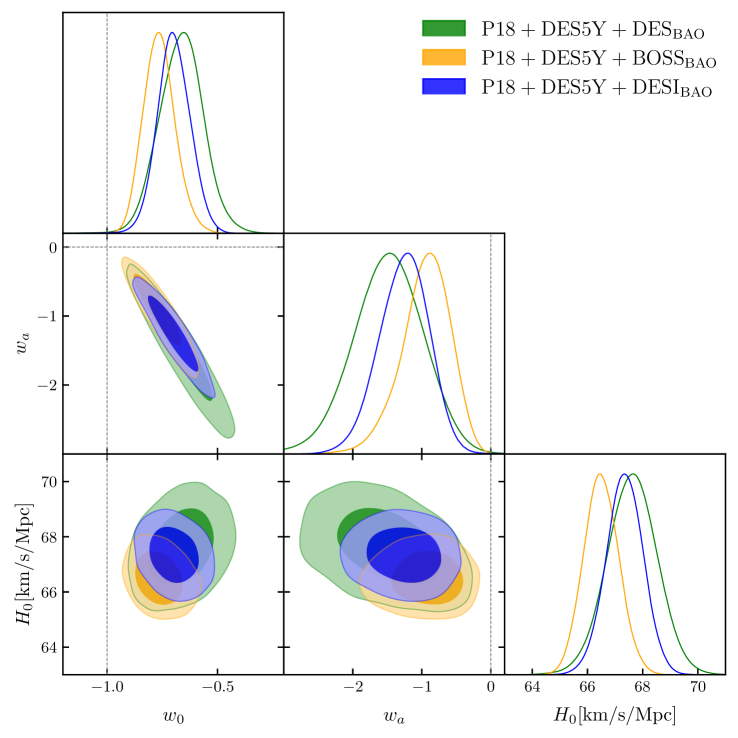
The measurement of the BAO scale in Ref. [18] from the DES collaboration, that appeared before DESI, consists of a single very precise data point at and it also shows a discrepancy with the CDM best fit to the Planck data at . It is thus interesting to consider the impact of this result on the global fit when other measurements are also included. We thus perform a Bayesian analysis of evolving dark energy, replacing the DESIBAO with the DESBAO datapoint in the analysis of Ref. [1].
We show in fig. 2 and Table 9 that DESY5 supernovae + DESBAO (combined with Planck 2018 CMB TT+TE+EE spectra and Planck 2018 lensing data, P18 in short) has evidence against CDM. With such a dataset indeed the best-fit of CDM has a compared to CDM, leading to an exclusion of the latter model with a confidence level of , i.e. , in the same direction of the exclusion obtained when using DESI as a BAO dataset. We have also performed a similar fit adding the DESBAO bin to the DESIBAO dataset, finding negligible differences with respect to the case where the BAO dataset is taken from DESI alone, which shows that there is good agreement between these two BAO datasets, providing a consistent picture (in contrast with previous BOSS data, which lead instead to quite different preferred regions: closer to CDM and with lower , see fig. 2).
4 Supernovae likelihoods: DES5Y vs Pantheon+
In this section we critically review the role of supernovae in providing evidence for evolving DE. Our aim is to assess the role of different SN datasets, focusing on DES5Y and Pantheon+ and their possible combinations (see table 1 for all details). 333A similar analysis was not possible for the Union3 dataset [9], which is not publicly available in unbinned form.
The DES5Y catalog has 1829 SN, including 335 supernovae in common with Pantheon+. The latter catalog has 1701 entries, but there are actually only 1543 supernovae (several SN appear more than once, since they actually are the same SN observed in different surveys). There are 375 entries in common with DES5Y (which correspond to 335 individual supernovae).
A preliminary summary of the composition of the two catalogs is provided in Table 2. We also show the sample resulting in removing from DES5Y the supernovae in common with Pantheon+ (and viceversa). We call such samples, defined by having no supernovae in common between the two, and respectively.
| Catalog | # tot. | # SNe | # tot. (com.) | # SNe (com.) | ||
|---|---|---|---|---|---|---|
| Pantheon+ | 1701 | 741 | 960 | 1543 | 375 (w/DES5Y) | 335 (w/DES5Y) |
| DES5Y | 1829 | 197 | 1632 | 1829 | 335 (w/Pantheon+) | 335 (w/Pantheon+) |
| 1326 | 511 | 815 | 1208 | 0 (w/DES5Y) | 0 (w/DES5Y) | |
| 1494 | 7 | 1487 | 1494 | 0 (w/Pantheon+) | 0 (w/Pantheon+) |
4.1 Combining the Pantheon+ and DES5Y supernovae datasets
Given the relevance of supernovae to establish the evidence for evolving dark energy it is tempting to try to include all the available data to increase the statistical significance. However it turns out that, due to a different treatment of the supernovae in common, such a combination is not univocal. Crucially this can be achieved in two ways: by removing the common dataset from DES5Y (obtaining the dataset) or from Pantheon+ (obtaining the dataset), see table 2 for details. Once the common set is removed from one catalog we then combine with the other. While this procedure does not eliminate all the correlations between the datasets we believe that this first-stage analysis will be useful to determine the constraining power of the precise combination and the consistency of the two datasets.
In order to show the impact of these preliminary combinations we also combine Planck and DESI BAO datasets together with different SN samples. In particular we use the following combinations:
| (7) |
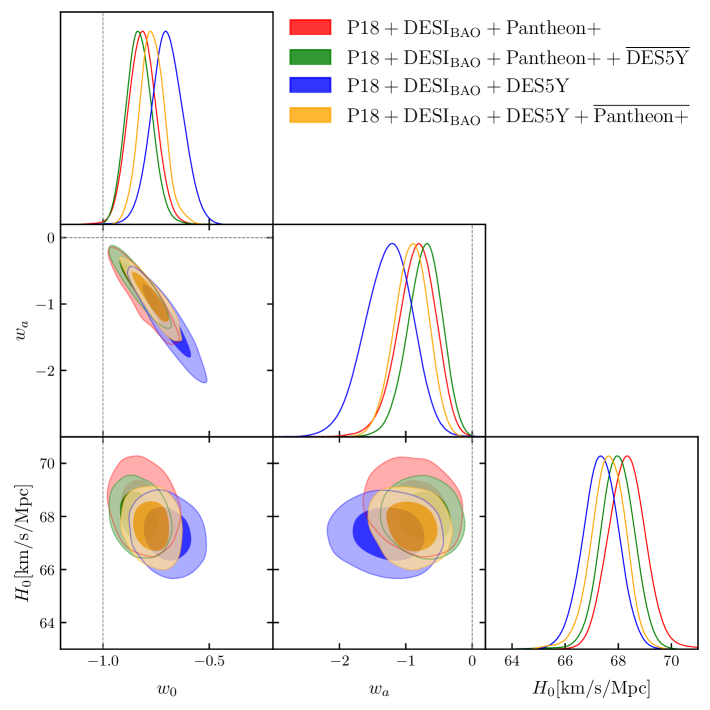
We perform the statistical analysis for CDM and CDM in all four cases. The first two cases are again validated against the analysis of [1].
We find different results depending on which set of supernovae is discarded. The combination 3) where DESY5 common supernovae are discarded leads to results that are close to the case 2) where only the Pantheon+ catalog is included. This case is in milder disagreement with CDM, i.e. disfavored at . This is also consistent with the statement of Ref. [19], as discussed in the next subsection, that the discrepancy with CDM is mostly driven by the common subset in DES5Y. For the combination 4), where Pantheon+ common SNe are discarded we get instead a much stronger exclusion of CDM, at about , similar to the case of DES5Y alone.
The fact that different combinations, that only differ for common SNe, lead to quantitatively different conclusions urges the need for a deeper understanding of the difference between Pantheon+ and DESY5 datasets to which we now turn.
4.2 Splitting the DES5Y supernovae dataset
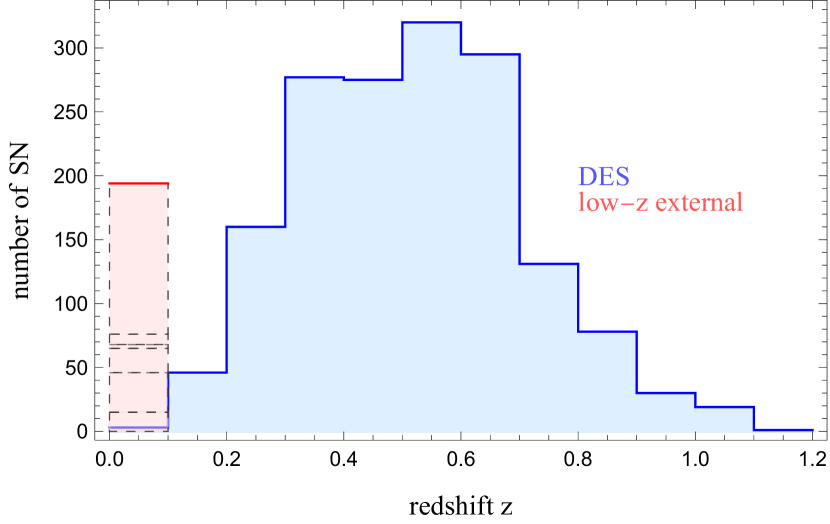
The inspection of the common sample between DES5Y and Pantheon+ can have other implications. Indeed, recently, it has been pointed out in Ref. [19] that the supernovae in common between Pantheon+ and DES5Y appear, in the DES5Y catalog, with an offset between low () and high () redshift magnitudes of about 0.04, due to different bias corrections applied in the DES5Y catalog. Let us comment on the fact that the composition of the DES5Y catalog strongly differs between low- and high- samples. Indeed, all the low- external historical sample from previous surveys is in the first subset (), while the supernovae measured by the full five years of DES are mostly at (with the exception of 3 supernovae). We refer to figure 5 for the composition of DES5Y as inferred from data in [21].
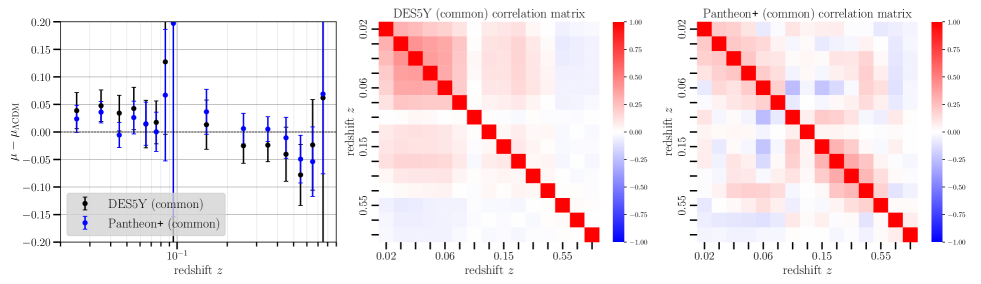
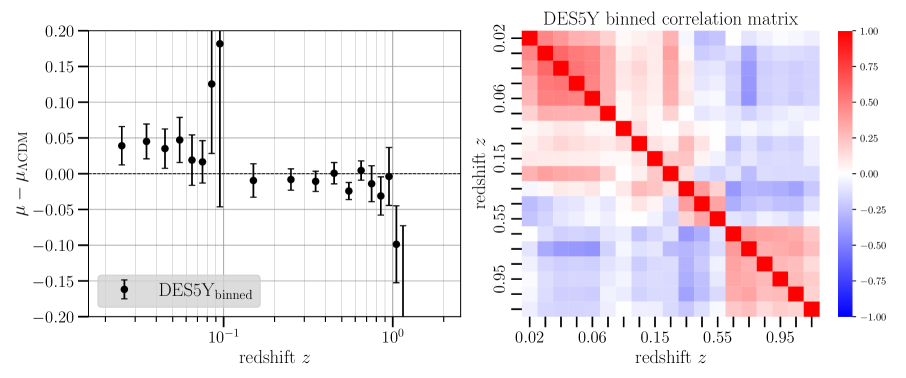
Ref. [19] argues that the larger preference against CDM, compared to Pantheon+, in the analysis of [1] is due to such an offset. Our analysis will be more general, as we will show in the next subsections, but it is interesting to inspect the presence of the offset again simply by studying the magnitudes of the DES5Y sample (for the SNe in common with Pantheon+). As a preliminary step therefore we compare with the magnitudes computed in a flat CDM reference model (with ), defining . We proceed to binning (see appendix) and we report the binned sample in the left panel of figure 4, where the offset is rather visible. Also, by applying a weighted average to the binned in the whole range of redshifts, we find that in the DES5Y sample in common with Pantheon+, . Here the weighted average is done with errors taken from the diagonal of the binned covariance matrix. Moreover, we note that in DES5Y all such common supernovae have smaller error bars than for Pantheon+, by an average overall factor of about 1.15.444Such error bars are the ones that come from the diagonal of the covariance matrix in Pantheon+. Note however that this does not match with the error bars on the distance moduli provided by the collaboration [40], which are even larger, on average by another factor of 1.4. This is most likely due to different light-curve fitting models and, in particular, to the use of different wavelength ranges. 555M.Vincenzi, private communication. In Figure 4, we also observe that the correlation matrix (binned) reveals a significantly different pattern of correlations between the DES5Y and Pantheon datasets (in common). Notably, strong correlations are found among the very low-z sample in the DES5Y dataset, as seen in the center panel of Figure 4.
Finally, before going to the quantitative analysis, we wish to comment on the full DES5Y catalog displayed in figure 5. Also in the full sample, the nature of the low/high- samples is rather different. We again proceed in defining and binning the full sample with the usual weights. From the correlation matrix of the full sample (see figure 5) we again see the strong correlation at low-, and sizable correlation also in the very high- bins, , of the sample. This suggests to split the DES5Y catalog in two samples, also exploiting the not so large correlation between them.
A new split likelihood for DES5Y
Taking inspiration from the discussion so far, we consider the possibility of splitting the DES5Y dataset in two subsets. We introduce a relative offset between low and high SN (we call the resulting modified dataset DES5Ysplit),
| (8) |
In practice, we have added a nuisance parameter to the magnitude of the low- population.
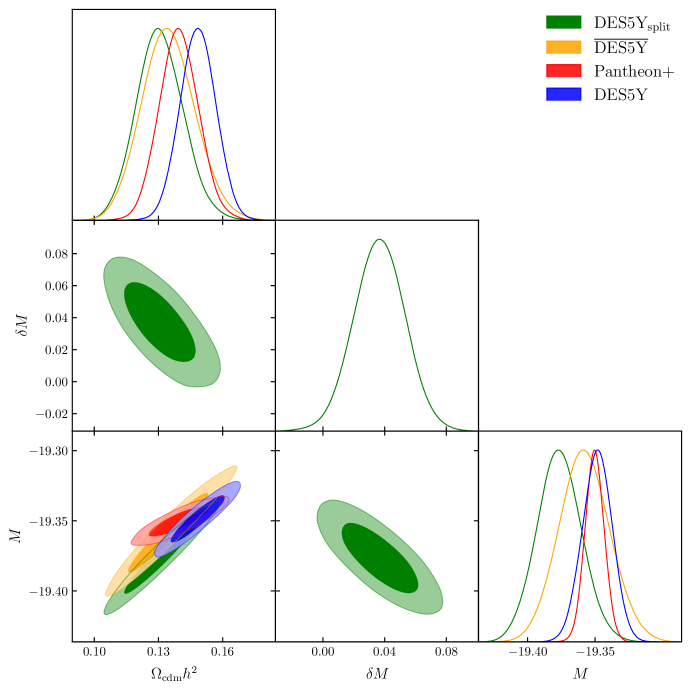
Allowing to vary we first show in a simple CDM fit with DES5Ysplit alone that gets smaller, and actually even smaller than the Pantheon+ value, see figure 6. Note also that a fit with alone yields a result for in the same direction, which is consistent. This is because marginalizing over effectively ignores the overall low- mean magnitude, a procedure similar to discarding the common sample, which contains almost all of the low- data.
We then compare this new dataset with the usual DES5Y, fitting CDM and CDM against the following full data combinations:
| (9) |
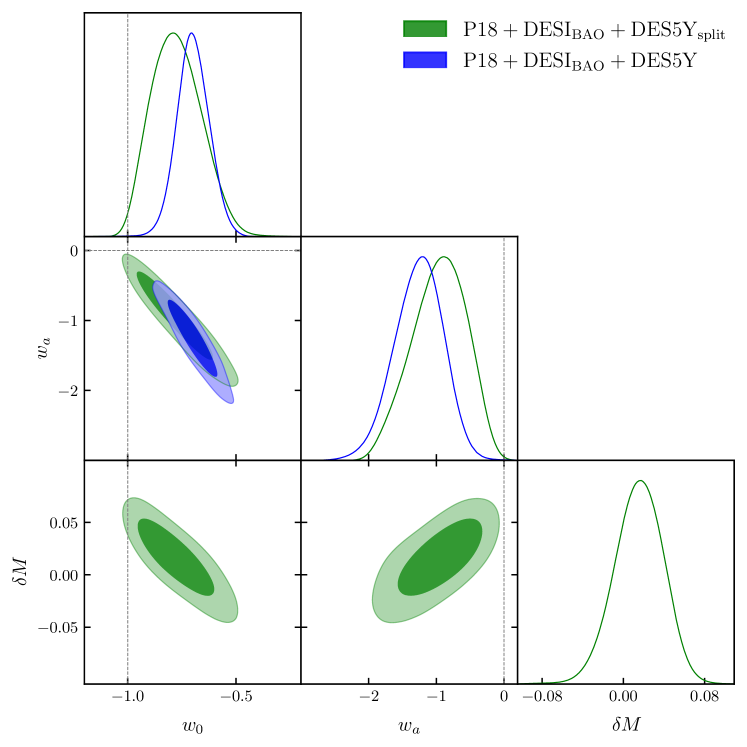
In fig. 7 we show that indeed in the CDM model a nonzero shift is preferred, with , and CDM becomes now disfavored at only.
5 Conclusions
At present, the sensitivity to time variations of dark energy relies on measurements of the BAO peak and spectrum as well as on (luminosity) distances inferred from supernovae observations. In this work, we re-examined the evidence disfavouring the CDM model, showing the impact of slightly different treatments of the datasets. Our conclusions can be summarized in the following table:
| Dataset | CDM exclusion | |
|---|---|---|
| P18+DESIBAO+ | 4431 | 3.9 |
| P18+DESIBAO+ | 4205 | 2.5 |
| P18+DESIBAO+ | 5550 | 2.5 |
| P18+DESIBAO+ | 5569 | 3.8 |
| P18+DESIBAO+ | 4431 | 1.7 |
| P18+DESBAO+ | 4419 | 3 |
First, we have shown that the evidence in favour of a CDM parametrization of dark energy can be determined independently of the DESIBAO sample. To support this we replaced the DESIBAO data with the single BAO data point at measured by DES (combined with DES5Y supernovae and P18 CMB data) finding a 3 exclusion for CDM. This result provides additional independent support for evolving dark energy.
Second, we have considered the possibility of combining different SN catalogs to increase the statistical significance. The combination is non-trivial due to the different treatment of the common SNe contained in Pantheon+ and DES5Y catalogues. In particular, for DES5Y we have shown that the treatment of such common supernovae is crucial: if we remove them from DESY5 and then combine with Pantheon+, we find overall agreement with results obtained using Pantheon+ alone, such that CDM is only mildly disfavoured (at , in combination with P18+DESIBAO). If instead we perform the opposite combination, i.e. remove the common SNe from Pantheon+ and combining with the full DESY5 dataset, we find that CDM is excluded at 3.8 (in combination with P18+DESIBAO), similar to the fit without Pantheon+.
The different result of the SNe combination raises the question of the consistency of the catalogs. We have shown – campatibly with the observation of Ref. [19] – that the disagreement can be accounted for by allowing different offsets in the DES5Y dataset for supernovae at redshifts (where most of the new measurements are) and (where all the old measurements are). Once this adjustment is made, the evidence against CDM weakens to .
To conclude, while the BAO measurement by DES lends support to evolving dark energy, we believe that the consistency of the supernova sample from DES needs to be fully investigated in order to draw firm conclusion disfavouring CDM based on combinations that include such a dataset.
Acknowledgements
We wish to thank Elisabeta Lusso, Guido Risaliti and Marko Simonović for interesting discussions and Maria Vincenzi for feedback on the DES5Y dataset. We acknowledge the use of the computing resources provided by the “PC-Farm” at INFN Florence and by the “Nyx” cluster at ICCUB, Barcelona.
Appendix A Details of MCMC runs
Here we list the outcome of all our MCMCs for the CDM parametrization (CDM model), for all the data combinations. In all our chains we assume uniform priors on the input parameters. We also report the with respect to CDM for the same dataset.
| Parameter | Best-fit | Mean | 95% Lower | 95% Upper |
|---|---|---|---|---|
, minimum ,
| Parameter | Best-fit | Mean | 95% Lower | 95% Upper |
|---|---|---|---|---|
, minimum ,
| Parameter | Best-fit | Mean | 95% Lower | 95% Upper |
|---|---|---|---|---|
, minimum
| Parameter | Best-fit | Mean | 95% Lower | 95% Upper |
|---|---|---|---|---|
, minimum ,
| Parameter | Best-fit | Mean | 95% Lower | 95% Upper |
|---|---|---|---|---|
, minimum ,
| Parameter | Best-fit | Mean | 95% Lower | 95% Upper |
|---|---|---|---|---|
, minimum ,
| Parameter | Best-fit | Mean | 95% Lower | 95% Upper |
|---|---|---|---|---|
, minimum ,
Appendix B Binned data samples
In each SN catalog we have access to the magnitude values and their covariance matrix (including both statistical and systematical uncertainties), where the index runs over the full length of the catalog (see table 2). In all the numerical analysis of our paper we have worked with unbinned data samples, to exploit fully the correlations among different variables. However, in our discussion, we often refer to binned data sample for visualization purposes. We use a weighted binning procedure to define new magnitude variables , where now the greek index runs over the bins
| (10) |
where the rectangular matrix is such that for all the rows (bins) . Here are generic weights that go to zero if the -th variable does not belong to the -th bin. Since our mapping is linear in the original variable, we can easily compute the covariance (and correlation) matrix of the new variables as
| (11) |
In figures 4 and 7 we adopted a weighted binning so defined: The edges of the bins are
| (12) |
and the center of each bin, defined as the average between two consecutive entries in the above list, , is used to plot the corresponding quantities. The weights are chosen to give more importance to the measurements with smaller errors, therefore we use the following expression
| (13) |
References
- [1] DESI Collaboration, A. G. Adame et al., DESI 2024 VI: Cosmological Constraints from the Measurements of Baryon Acoustic Oscillations, arXiv:2404.03002.
- [2] DESI Collaboration, R. Calderon et al., DESI 2024: reconstructing dark energy using crossing statistics with DESI DR1 BAO data, JCAP 10 (2024) 048, [arXiv:2405.04216].
- [3] DESI Collaboration, K. Lodha et al., DESI 2024: Constraints on Physics-Focused Aspects of Dark Energy using DESI DR1 BAO Data, arXiv:2405.13588.
- [4] M. Chevallier and D. Polarski, Accelerating universes with scaling dark matter, Int. J. Mod. Phys. D 10 (2001) 213–224, [gr-qc/0009008].
- [5] E. V. Linder, Exploring the expansion history of the universe, Phys. Rev. Lett. 90 (2003) 091301, [astro-ph/0208512].
- [6] D. Scolnic et al., The Pantheon+ Analysis: The Full Data Set and Light-curve Release, Astrophys. J. 938 (2022), no. 2 113, [arXiv:2112.03863].
- [7] D. Brout et al., The Pantheon+ Analysis: Cosmological Constraints, Astrophys. J. 938 (2022), no. 2 110, [arXiv:2202.04077].
- [8] DES Collaboration, T. M. C. Abbott et al., The Dark Energy Survey: Cosmology Results with 1500 New High-redshift Type Ia Supernovae Using the Full 5 yr Data Set, Astrophys. J. Lett. 973 (2024), no. 1 L14, [arXiv:2401.02929].
- [9] D. Rubin et al., Union Through UNITY: Cosmology with 2,000 SNe Using a Unified Bayesian Framework, arXiv:2311.12098.
- [10] A. Notari, M. Redi, and A. Tesi, Consistent Theories for the DESI dark energy fit, arXiv:2406.08459.
- [11] O. F. Ramadan, J. Sakstein, and D. Rubin, DESI constraints on exponential quintessence, Phys. Rev. D 110 (2024), no. 4 L041303, [arXiv:2405.18747].
- [12] S. Bhattacharya, G. Borghetto, A. Malhotra, S. Parameswaran, G. Tasinato, and I. Zavala, Cosmological constraints on curved quintessence, JCAP 09 (2024) 073, [arXiv:2405.17396].
- [13] D. Andriot, S. Parameswaran, D. Tsimpis, T. Wrase, and I. Zavala, Exponential quintessence: curved, steep and stringy?, JHEP 08 (2024) 117, [arXiv:2405.09323].
- [14] Y. Tada and T. Terada, Quintessential interpretation of the evolving dark energy in light of DESI observations, Phys. Rev. D 109 (2024), no. 12 L121305, [arXiv:2404.05722].
- [15] I. D. Gialamas, G. Hütsi, K. Kannike, A. Racioppi, M. Raidal, M. Vasar, and H. Veermäe, Interpreting DESI 2024 BAO: late-time dynamical dark energy or a local effect?, arXiv:2406.07533.
- [16] W. Giarè, M. Najafi, S. Pan, E. Di Valentino, and J. T. Firouzjaee, Robust preference for Dynamical Dark Energy in DESI BAO and SN measurements, JCAP 10 (2024) 035, [arXiv:2407.16689].
- [17] D. Brout et al., The Pantheon+ Analysis: Cosmological Constraints, Astrophys. J. 938 (2022), no. 2 110, [arXiv:2202.04077].
- [18] DES Collaboration, T. M. C. Abbott et al., Dark Energy Survey: A 2.1% measurement of the angular baryonic acoustic oscillation scale at redshift zeff=0.85 from the final dataset, Phys. Rev. D 110 (2024), no. 6 063515, [arXiv:2402.10696].
- [19] G. Efstathiou, Evolving Dark Energy or Supernovae Systematics?, arXiv:2408.07175.
- [20] Planck Collaboration, N. Aghanim et al., Planck 2018 results. V. CMB power spectra and likelihoods, Astron. Astrophys. 641 (2020) A5, [arXiv:1907.12875].
- [21] DES collaboration, “DES-SN 5YR Data Release.” https://github.com/des-science/DES-SN5YR,.
- [22] Cobaya sampler, “DES5Y data.” https://github.com/CobayaSampler/sn_data/tree/master/DESY5,.
- [23] DES Collaboration, T. M. C. Abbott et al., The Dark Energy Survey: Cosmology Results With ~1500 New High-redshift Type Ia Supernovae Using The Full 5-year Dataset, arXiv:2401.02929.
- [24] F. Beutler, C. Blake, M. Colless, D. H. Jones, L. Staveley-Smith, L. Campbell, Q. Parker, W. Saunders, and F. Watson, The 6dF Galaxy Survey: Baryon Acoustic Oscillations and the Local Hubble Constant, Mon. Not. Roy. Astron. Soc. 416 (2011) 3017–3032, [arXiv:1106.3366].
- [25] A. J. Ross, L. Samushia, C. Howlett, W. J. Percival, A. Burden, and M. Manera, The clustering of the SDSS DR7 main Galaxy sample – I. A 4 per cent distance measure at , Mon. Not. Roy. Astron. Soc. 449 (2015), no. 1 835–847, [arXiv:1409.3242].
- [26] BOSS Collaboration, S. Alam et al., The clustering of galaxies in the completed SDSS-III Baryon Oscillation Spectroscopic Survey: cosmological analysis of the DR12 galaxy sample, Mon. Not. Roy. Astron. Soc. 470 (2017), no. 3 2617–2652, [arXiv:1607.03155].
- [27] W. Fang, W. Hu, and A. Lewis, Crossing the Phantom Divide with Parameterized Post-Friedmann Dark Energy, Phys. Rev. D 78 (2008) 087303, [arXiv:0808.3125].
- [28] B. A. Bassett and M. Kunz, Cosmic distance-duality as a probe of exotic physics and acceleration, Phys. Rev. D 69 (2004) 101305, [astro-ph/0312443].
- [29] EUCLID Collaboration, M. Martinelli et al., Euclid: Forecast constraints on the cosmic distance duality relation with complementary external probes, Astron. Astrophys. 644 (2020) A80, [arXiv:2007.16153].
- [30] A. G. Riess et al., A Comprehensive Measurement of the Local Value of the Hubble Constant with 1 km s?1 Mpc?1 Uncertainty from the Hubble Space Telescope and the SH0ES Team, Astrophys. J. Lett. 934 (2022), no. 1 L7, [arXiv:2112.04510].
- [31] I. J. Allali, A. Notari, and F. Rompineve, Dark Radiation with Baryon Acoustic Oscillations from DESI 2024 and the tension, arXiv:2404.15220.
- [32] D. Blas, J. Lesgourgues, and T. Tram, The Cosmic Linear Anisotropy Solving System (CLASS) II: Approximation schemes, JCAP 07 (2011) 034, [arXiv:1104.2933].
- [33] B. Audren, J. Lesgourgues, K. Benabed, and S. Prunet, Conservative Constraints on Early Cosmology: an illustration of the Monte Python cosmological parameter inference code, JCAP 1302 (2013) 001, [arXiv:1210.7183].
- [34] T. Brinckmann and J. Lesgourgues, MontePython 3: boosted MCMC sampler and other features, arXiv:1804.07261.
- [35] A. Lewis, GetDist: a Python package for analysing Monte Carlo samples, arXiv:1910.13970.
- [36] M. Hicken, P. Challis, S. Jha, R. P. Kirsher, T. Matheson, M. Modjaz, A. Rest, and W. M. Wood-Vasey, CfA3: 185 Type Ia Supernova Light Curves from the CfA, Astrophys. J. 700 (2009) 331–357, [arXiv:0901.4787].
- [37] M. Hicken et al., CfA4: Light Curves for 94 Type Ia Supernovae, Astrophys. J. Suppl. 200 (2012) 12, [arXiv:1205.4493].
- [38] K. Krisciunas et al., The Carnegie Supernova Project I: Third Photometry Data Release of Low-Redshift Type Ia Supernovae and Other White Dwarf Explosions, Astron. J. 154 (2017), no. 5 211, [arXiv:1709.05146].
- [39] R. J. Foley et al., The Foundation Supernova Survey: Motivation, Design, Implementation, and First Data Release, Mon. Not. Roy. Astron. Soc. 475 (2018), no. 1 193–219, [arXiv:1711.02474].
- [40] Pantheon+, “Pantheon+ dataset.” https://github.com/PantheonPlusSH0ES/DataRelease,.