Collaborative Contrastive Network for Click-Through Rate Prediction
Abstract.
E-commerce platforms provide entrances for customers to enter mini-apps to meet their specific shopping needs. At the entrance of a mini-app, a trigger item recommended based on customers’ historical preferences, is displayed to attract customers to enter the mini-app. Existing Click-Through Rate (CTR) prediction approaches have two significant weaknesses: (i) A portion of customer entries is driven by their interest in the mini-app itself rather than the trigger item. In such cases, approaches highly hinging on the trigger item tend to recommend similar items, thus misunderstanding the customers’ real intention; (ii) Approaches that consider customers’ intention toward mini-apps, require the regular existence of mini-apps for customers to cultivate routine shopping habits, making such approaches less robust for mini-apps that are available for only short periods (1 or 3 days) in Explosive Promotional Scenarios (EPS), such as the Black Friday and China’s Double 11 Shopping Carnival. To address the above-mentioned issues, we introduce a more general and robust CTR prediction approach, dubbed Collaborative Contrastive Network (CCN). Given a user, CCN learns to identify two item clusters that can represent the user’s interests and disinterests, via leveraging the collaborative relationship of co-click/co-non-click111Given a pair of items displayed in the same page, Co-Click means they’re both clicked, Co-Non-Click means they’re both unclicked, Mono-Click means only one is clicked nor the other, Collaborative means they have same click labels, Non-Collaborative means they have different click labels. or the non-collaborative relationship of mono-click as the supervision signal for contrastive learning. This paradigm does not need to explicitly estimate user’s binary entry intention and avoids amplifying the impact of the trigger item. Online A/B testing on large-scale real-world data demonstrates that CCN sets a new state-of-the-art performance on Taobao, boosting CTR by 12.3% and order volume by 12.7%.
††*Sihao Hu is the corresponding authur.1. Introduction
Mini-apps are important channels for selling items with specific features in e-commerce platforms (Xia et al., 2023). For example, the ”Little Black Box” mini-app in Taobao sells only new products, whereas the ”Explosive Promotional Scenario (EPS)” mini-apps during the Taobao Double 11 Shopping Carnival or the Black Friday sell brand-discounted products. To attract customers’ entries, one or two trigger items are displayed at the entrance of a mini-app, recommended based on their historical shopping preferences.

As shown in Figure 1, once a user clicks the entrance icon, they will enter the mini-app’s feeds page where the clicked trigger item is ranked at the top, followed by other items sorted in descending order according to the predicted Click-Through Rate (CTR). In this paper, we focus on recommending items within a mini-app at the moment when a user has already clicked the trigger item and is entering the mini-app, which we refer to as Trigger-Induced Recommendation (TIR). Clearly, the clicked trigger item can reflect user’s instant intention and serves as a guideline for recommending following items. Existing CTR prediction algorithms (Cheng et al., 2016; Zhou et al., 2018, 2019; Feng et al., 2019; Pi et al., 2020; Cao et al., 2022) that do not account for the trigger item are unsuitable for TIR.
Existing trigger-based approaches (Shen et al., 2022; Xia et al., 2023) also have two weaknesses: (1) DIHN (Shen et al., 2022) assumes a strong correlation between the trigger item and user’s entry into the mini-app, which can lead to misunderstandings in cases where user’s entry is driven by their interest in the mini-app itself rather than the trigger item. (2) DIAN is a debiasing approach that initially estimates the user’s intention upon entering, discerning whether the user is directed toward the mini-app or the trigger item. This allows the recommendation strategy to be adjusted accordingly. However, DIAN relies on the long-term existence of the mini-app to accurately predict user intention, which makes it unsuitable for mini-apps that exist for only short periods and exhibit volatile characteristics, such as the EPS mini-app.
Scope and Contributions: We propose Collaborative Contrastive Network (CCN), a general and robust CTR prediction method for TIR that can precisely model user’s interest given the existence of the trigger item. Instead of largely hinging on the trigger item like DIHN or doing binary intention estimation like DIAN, our CCN takes the combination of user id and trigger item id, instead of only user id, as the identifier to divide user’s interest, and then introduces modeling user’s interest with the collaborative relationship of co-click/co-non-click or the non-collaborative relationship of mono-click (one is clicked, but another is not) in the exposure/click logs: Given a user, a target item333Target Item represents a single item to be scored in regular CTR task, and it’s usually the only primary key in one sample. and its context items444Context Items represents other items exposed with the target item in the same page., we not only estimate the click-through probability of the target item, but also learn the proximity between the target item and its context items. As shown in Figure 2, if the target item is clicked, it will be closer to those context items also clicked, and become far away from those context items not clicked. In contrast, if the target item is not clicked, it will become further away from those context items clicked, and become closer to those context items not clicked, dubbed collaborative contrastive learning.
The motivation to do so is straightforward: When a user clicks a trigger item to enter the mini-app, no matter whether the user is attracted by the trigger item or not, user’s interest in items can always be categorized as items that interest him/her or items that do not interest him/her. During offline training, contrastive learning provides a way to separate two item clusters that represent user’s interests and user’s disinterests in the latent space, via utilizing the collaborative relationship of co-click/co-non-click or the non-collaborative relationship of mono-click as the supervision signal, thereby facilitating the learning process of the CTR prediction task. For online serving, CCN can directly predict the CTR of a target item because users’ interests and disinterests are already captured in the latent space.
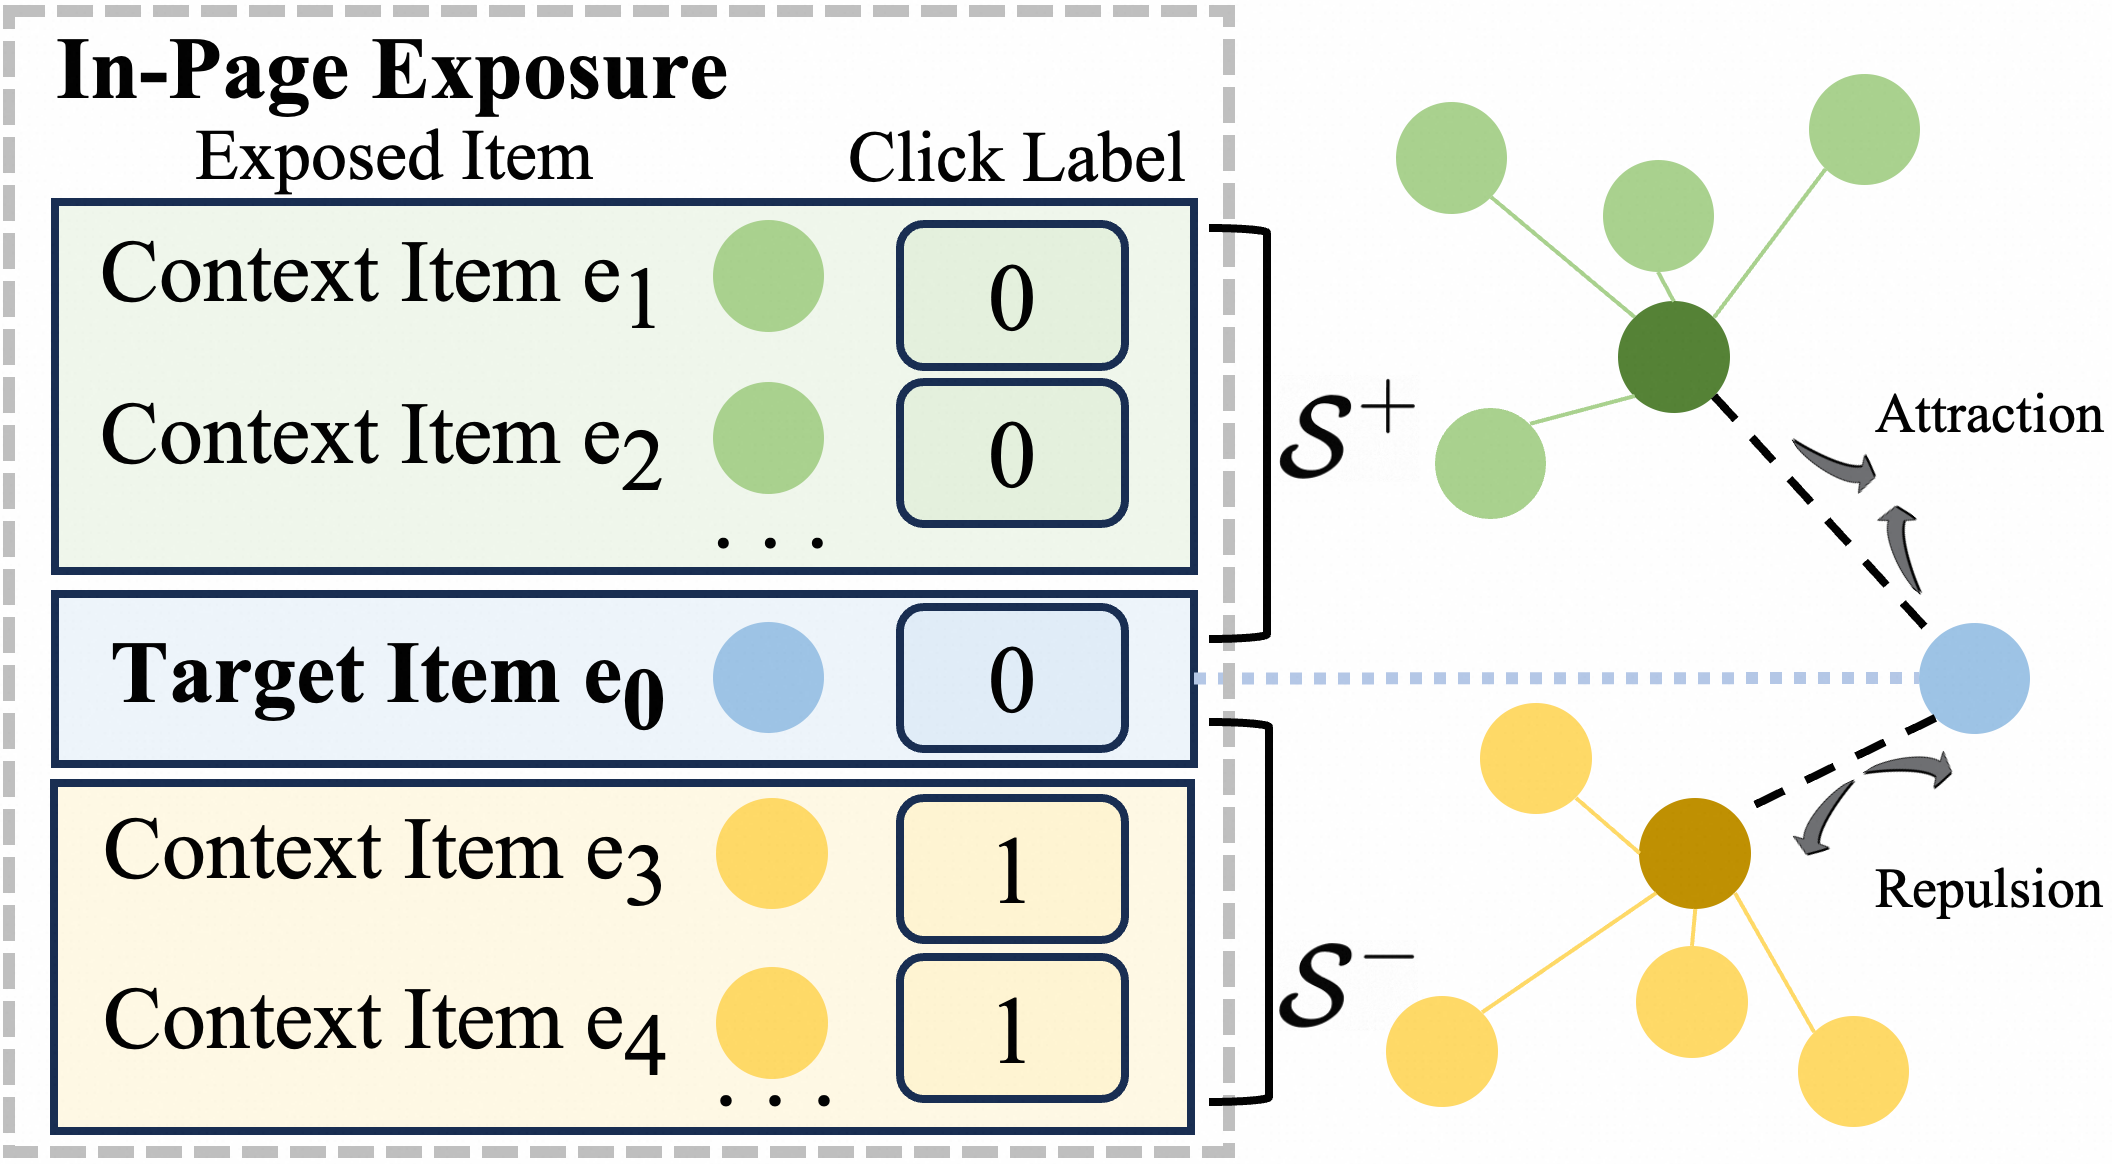
Specifically, we define a positive set of context items that collaboratively share a co-click or co-non-click relationship with the target item, and a negative set of context items that do not share this relationship, namely mono-click. We design an attraction loss to pull the target item and positive set closer, and a repulsion loss to push the target item and negative set apart during contrastive learning. To do so, two challenges are encountered: (1) The total number of context items, for once contrastive loss calculation is not large enough, causing outliers of context items’ embeddings to have a greater impact and make training unstable. Thus we introduce the importance sampling strategy to normalize these outliers, in both the InfoNCE (Oord et al., 2018) based repulsion loss and the cosine similarity based attraction loss. (2) Due to the sparsity of clicks, most of the target-context item pairs are co-non-clicked, which means a user has no behavior on any item of the pair. Item pairs of this kind lack real supervision knowledge but significantly increase the cardinality of positive set. Thus we appropriately reduce the proportion of attraction loss between target item and positive set.
To summarize, the main contributions of this work are as follows:
-
•
We propose Collaborative Contrastive Network (CCN), a more general and robust CTR prediction framework for Trigger-Induced Recommendation (TIR).
-
•
We implement a collaborative contrastive learning module in CCN to precisely model user’s interest through collaborative relationship (co-click/co-non-click) and non-collaborative relationship (mono-click) revealed in the exposure/click logs.
-
•
Extensive experiments are conducted to verify the efficacy of CCN. Online A/B testing demonstrates that CCN sets a new state-of-the-art performance in Taobao, boosting CTR by 12.3% and order volume by 12.7%.
2. Proposed Method
2.1. Overview
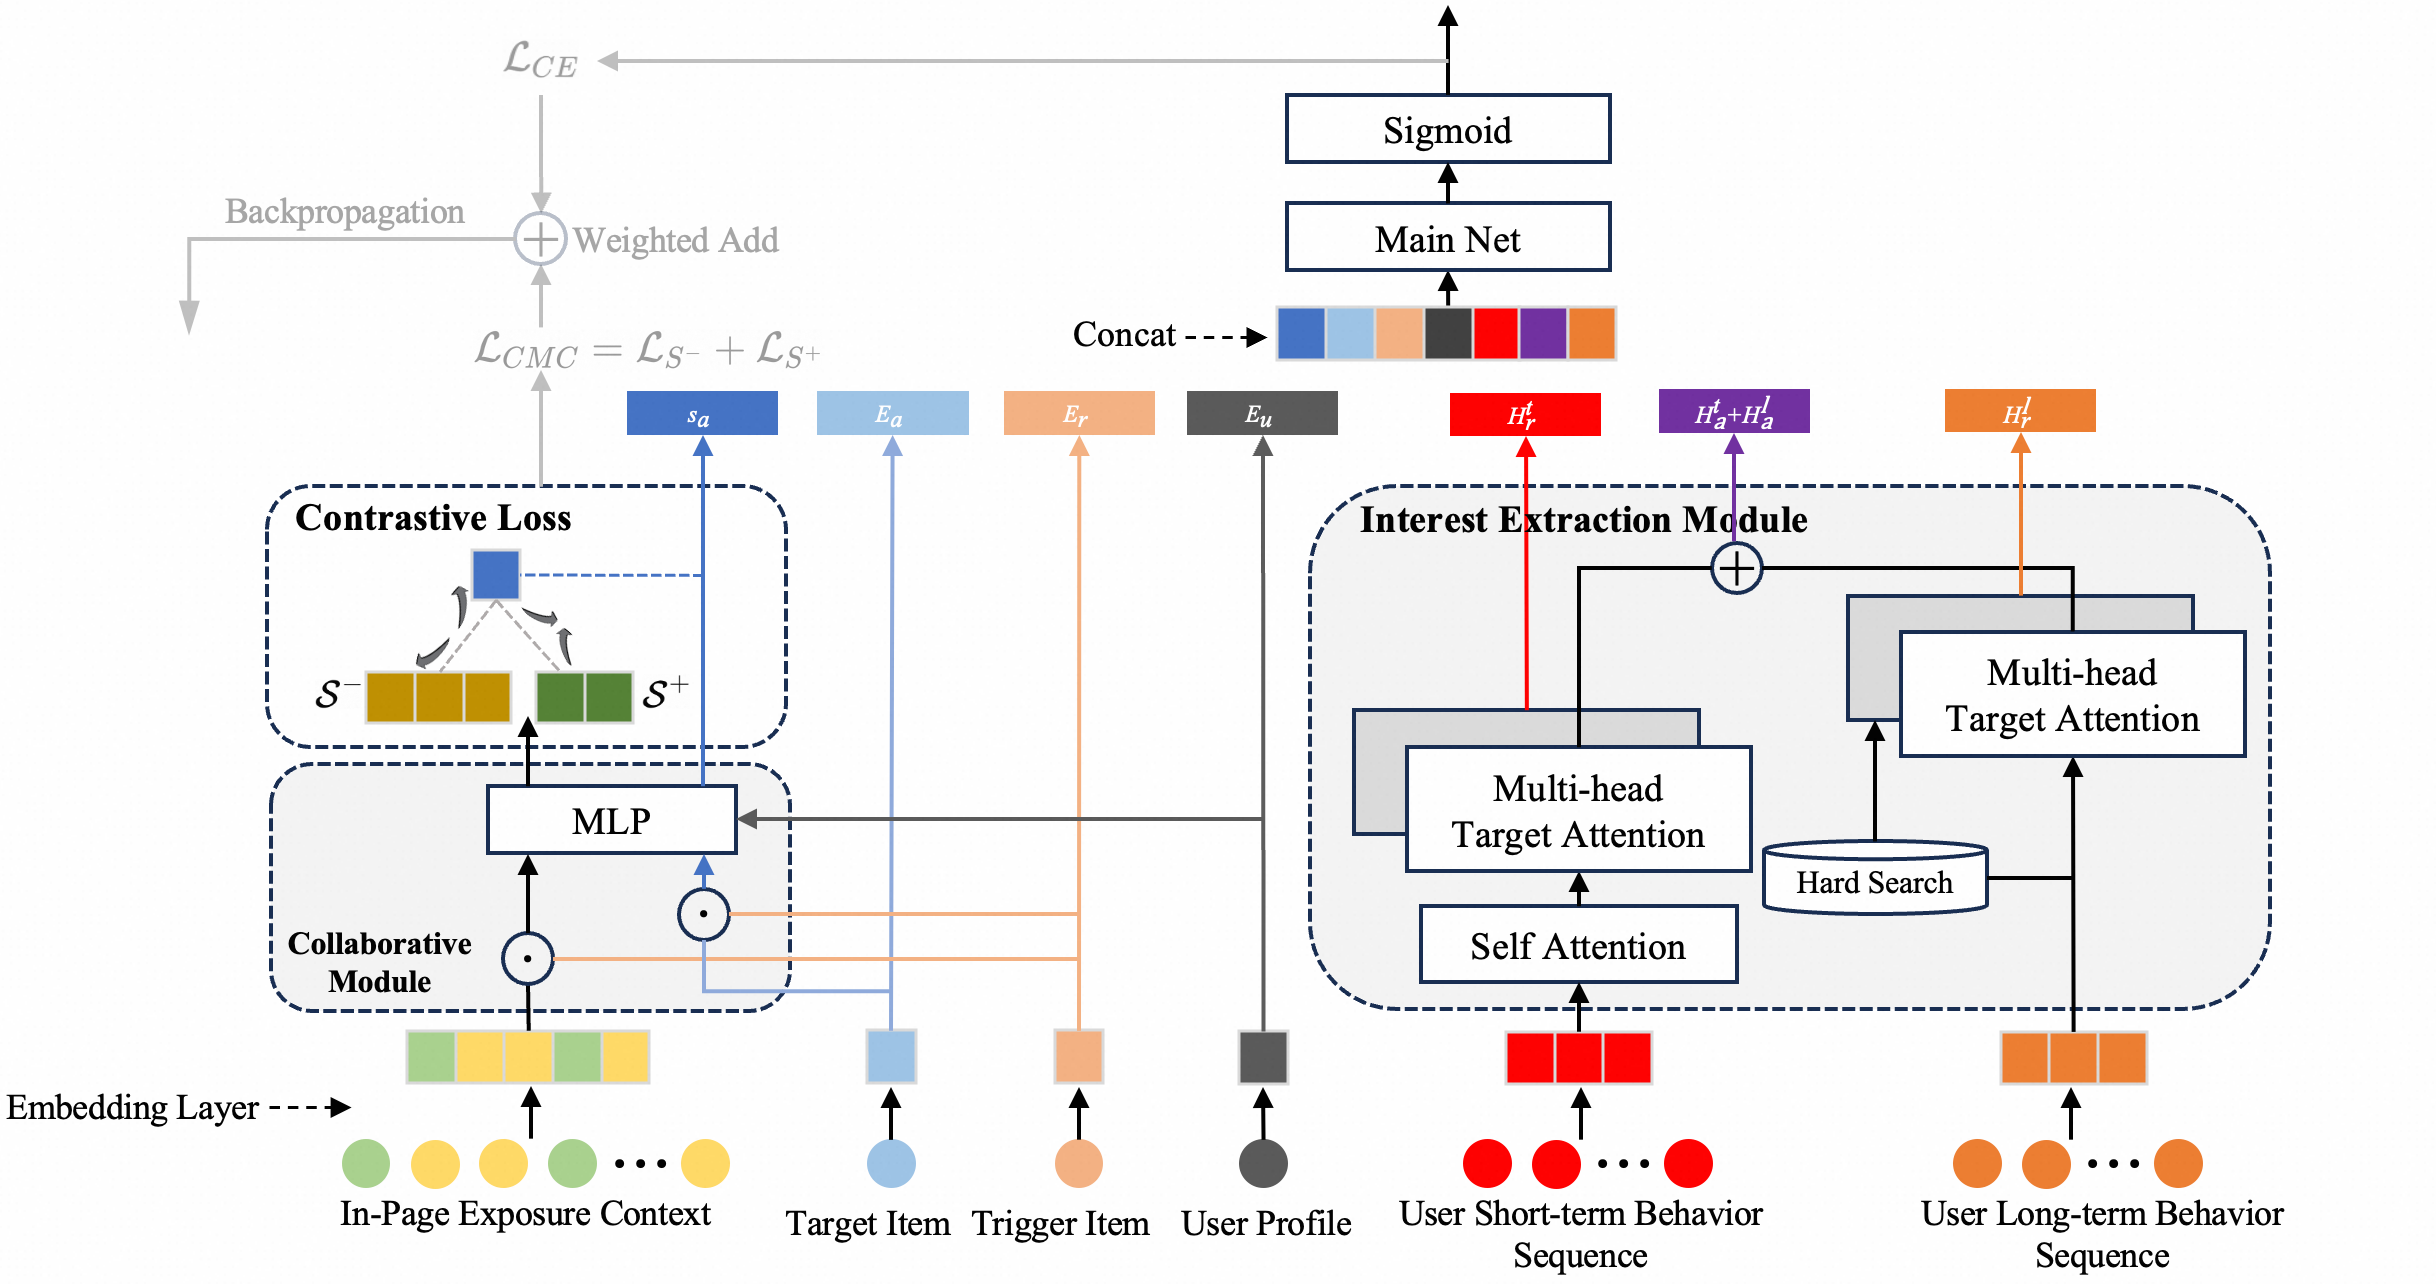
As shown in Figure 3, the proposed CCN consists of two modules: the CTR prediction module and the collaborative module. Given a pair of user and trigger item, the CTR prediction module aims to accurately estimate a click-through probability for a target item, and the collaborative module aims to generate item embeddings that represent user’s interest and disinterest, facilitating the learning of the CTR prediction task.
2.2. CTR Prediction
Embedding Layer. This module respectively projects raw input categorical or numerical features as embeddings for tensor calculation. The features are as follows: 1) User Profile ; 2) Target Item ; 3) Trigger Item ; 4) User Short-term Behavior Sequence ; 5) User Long-term Behavior Sequence ; 6) Collaborative Degree of the target item and context items .
Interest Extraction Module. This module extracts user’s interest by applying Multi-head Target Attention (MHTA) (Zhou et al., 2018) between an item to be scored and the user’s historical behavior item sequence. Since this part is not the core of our method, we will provide an example of how MHTA is computed and then briefly summarize the representation of all sequence interactions to simplify understanding. The MHTA between the target item and the user’s short-term behavior sequence is calculated as follows:
| (1) |
| (2) |
where is the dimension of hidden space, is the number of attention heads, are learnable parameters. Similarly, the MHTA between the trigger item and user’s short-term sequence is calculated.
We follow the search-based method proposed in SIM (Pi et al., 2020) to extract from user’s long-term sequence the sub-sequence by distinguishing whether sequence item has the same category with the trigger/target item. And then we respectively calculate the corresponding MHTA. We briefly summarize the representation of all sequence interactions as .
Prediction Output. Finally, the outputs of all sub-structures are concatenated and fed into a feed-forward neural network. This network then passes the combined inputs through a sigmoid activation function to predict the final click-through rate:
| (3) |
2.3. Collaborative Contrastive Learning
During offline training, we collect users’ historical exposure and click logs for collaborative contrastive learning, which can adjust two item clusters in the latent space, representing the user’s interests and disinterests.
Collaborative Module. This module represents the target item or context items as projection embeddings called collaborative degrees. The collaborative degrees capture user’s interests and disinterests, allowing for distinction among different user-trigger combinations. The inputs consist of the target/context item , the trigger item , and the user profile . To reduce computational and storage overhead, we use streamlined features such as item id, category id and seller id to represent items. The collaborative degree can be formalized as follows, where denotes the concatenation operator and denotes the Hadamard product operator:
| (4) |
The core of our method is the collaborative contrastive learning within the in-page exposure context. As illustrated in Figure 2, we divide the context items based on their click-through labels compared to the target item: those with the same labels form the positive set , while those with different labels form the negative set . Using the collaborative degree as the representation for items in the distance calculation in collaborative contrastive learning, we design both the attraction loss and the repulsion loss.
Repulsion Loss. The target item is not collaborative with the negative set , so we apply the repulsion loss to maximize the distance between them on dataset :
| (5) |
| (6) |
where is the temperature coefficient, is the cardinality of the negative set , and is the importance sampling weight. The additional term in the denominator serves to constrain the value of the fraction within the range of . The repulsion loss can be viewed as a variant of the InfoNCE (Oord et al., 2018). The key difference is that we apply importance sampling to introduce inter-negative-sample mutual information, which effectively lowers the proportion of items with high collaborative degrees in , making the model more discerning regarding these items.
As the temperature coefficient increases, the entropy of the relative penalty intensity for negative samples increases (Wang and Liu, 2021), which causes the loss function to pay less attention to items with higher collaborative degrees. Although importance sampling has a similar effect in decreasing attention to items with higher collaborative degrees, it specifically refines weight balancing within the same context. In contrast, the temperature coefficient operates from a global perspective.
Attraction Loss. The target item is collaborative with the positive set , so we apply the attraction loss to minimize the distance between them:
| (7) |
| (8) |
where represents the cosine similarity function, is the scaling coefficient. To adapt for the domain of the logarithm function, we adjust the range of from to . Since the function is periodic, we constrain the range of to by adjusting to ensure monotonicity. Similarly, importance sampling introduces inter-positive-sample mutual information, reducing the proportion of items with high collaborative degrees in . This prevents the optimization process from being dominated by the cycle of self-reinforcement of items with high collaborative degrees. We estimate the reduction proportion of attraction loss by counting the average number of clicked items and of unclicked items within a single in-page exposure.
| (9) | |||
| (10) |
the binary-classification cross entropy loss on dataset is:
| (11) |
with as a hyper-parameter, the final training loss is:
| (12) |
3. Inference Deployment
Our model is implemented and deployed on a distributed TensorFlow-based framework with tide-scheduling CPUs. During inference, the model output is computed as shown in Equation 3, where the collaborative module only projects the target item. It is important to note that the collaborative contrastive learning adds an auxiliary loss only during the training process. Context items are gathered and input only during offline training for this collaborative contrastive learning phase. The computational graph associated with these context items is defined within a training-only operator.
4. Experiments
4.1. Dataset and Experimental Setup
Datasets. We conduct extensive experiments on an industrial dataset gathered from Taobao EPS over the span of one year. The features and click labels are accurately restored according to the traffic logs. The training set includes one year’s worth of EPS data, while the test set consists of EPS data from the Taobao Double 11 Shopping Carnival, the largest EPS of the year. The forced top trigger item itself has been excluded from the sample set. The details are presented in Table 1.
| Dataset | #Users | #Items | #Instances |
| Train | 61,585,143 | 19,061,870 | 2,328,932,203 |
| Test | 56,228,079 | 10,025,906 | 536,844,369 |
Experimental Setup. CCN and the competitors are constructed on a unified backbone and feature format. The AdaGrad optimizer is used with an initial learning rate of 0.001, which decays over time as the training progresses. The training batchsize is set to 1024. The number of heads in MHTA is 4. The hyperparameters and are set to 0.5 and 0.8, respectively.
Competitors. We compare three of the most renowned CTR prediction models Wide&Deep (Cheng et al., 2016), DIN (Zhou et al., 2018), SIM (Pi et al., 2020) without specifically modeling the trigger item, and two of the most advanced trigger-based models DIHN (Shen et al., 2022), DIAN (Xia et al., 2023). Notably, SIM serves as the baseline model within Taobao EPS. Despite its age, SIM remains highly robust and effective, supported by related optimizations in algorithm engineering, features, and training samples. Transitioning baseline from SIM to a more recent state-of-the-art model is possible, but such a shift would require significant engineering overhauls. In summary, SIM continues to be the optimal model for Taobao EPS.
4.2. Offline Performance Comparison
We use AUC (Zhou et al., 2018) as the evaluation metric. The experimental results on our industrial EPS dataset are presented in Table 2. Each experiment is repeated independently five times, with the best and worst values removed, and the average of the remaining values is taken. Our experiments reveal that the advanced trigger-based models, DIHN and DIAN, lack sufficient robustness in EPS, leading to decreased performance on our dataset. Specifically, the AUC for the user intention estimation auxiliary task in DIAN is only 0.6 on our EPS dataset, a significant shortfall in effectiveness compared to the 0.943 AUC observed in a normal stable TIR scenario as reported in DIAN (Xia et al., 2023).
| Model | AUC |
| Wide&Deep | 0.6872 |
| DIN | 0.7117 |
| SIM | 0.7276 |
| DIHN | 0.7259 |
| DIAN | 0.7200 |
| TAN (w/o CM & TSI) | 0.7281 |
| TAN | 0.7293 |
| CCN (w/o TSI) | 0.7315 |
| CCN (w/o ) | 0.7312 |
| CCN (w/o ) | 0.7309 |
| CCN | 0.7326 |
-
•
* TAN is the backbone of CCN without contrastive learning. CM is the Collaborative Module, TSI is the Trigger-related Sequence Interaction introduced by Interest Extraction Module. is the attraction loss, is the repulsion loss.
4.3. Ablation Study
We prove the effectiveness of each module and loss function through ablation experiments as shown in Table 2. Compared to SIM (Baseline), TAN (w/o CM & TSI) simply introduces trigger item information and slightly increases AUC by +0.05pt. We introduce CM & TSI in TAN, which increases AUC by +0.12pt. Removing TSI from CCN decreases AUC by -0.11pt, illustrating the effectiveness of TSI. Removing the attraction loss alone from CCN decreases AUC by -0.14pt. Removing the repulsion loss alone from CCN decreases AUC by -0.17pt. Experiments removing one contrastive loss function alone indicate that the combination of attraction loss and repulsion loss is necessary to achieve the observed improvements, neither alone is sufficient. Finally, our method CCN advances AUC +0.5pt compared to baseline SIM.
4.4. Online A/B Testing
We apply online A/B testing during the Taobao Double 11 Shopping Carnival, the largest EPS of Taobao APP. As shown in Table 3, our method advances both click-related indicators and purchase-related indicators. Here we show the results for purchase-related indicators because increasing the performance of CTR can often negatively affect the performance of CVR, and our method overcomes this multi-objective seesaw effect and results in a net improvement.
| Model | CTR | Clicks/User | CVR | Orders/User |
| DIHN | -7.3% | -9.3% | -1.5% | -3.1% |
| DIAN | -5.6% | -6.0% | -0.9% | -1.5% |
| CCN | +12.3% | +7.4% | +0.9% | +12.7% |
-
•
* The value in table indicates the Lift Rate compared to the baseline. CTR here refers to the scenario-guided click probability of a daily user view. Clicks/User refers to the average click times contributed per daily user view. CVR here refers to the scenario-guided purchase probability of a daily user click. Orders/User refers to the average number of orders contributed per daily user view.
We further apply online A/B testing on Taobao EPS. The experiment was conducted over a different time period compared to the experiments in Table 3, but the amount of test data and the duration of the experiment are sufficiently ensured. As shown in Table 4, our method demonstrates significant advancements over TAN in an online serving environment.
| Model | CTR | CVR | Visit Purchase Rate |
| TAN | +2.21% | +6.37% | +8.85% |
| CCN | +17.48% | +10.06% | +29.38% |
-
•
* The value in table indicates the Lift Rate compared to the baseline. Visit Purchase Rate here refers to the scenario-guided purchase probability of a daily user view.
5. Conclusion
This paper demonstrates the Collaborative Contrastive Network (CCN), a more general and robust CTR prediction framework for Trigger-Induced Recommendation (TIR). It precisely models user’s interest by leveraging the collaborative relationship of co-click/co-non-click or the non-collaborative relationship of mono-click in exposure/click logs, acknowledging the presence of a trigger item. Experimental results demonstrate that CCN sets a new state-of-the-art performance in Taobao, boosting CTR by 12.3% and order volume by 12.7%. CCN has been fully deployed across all Taobao EPS, including the Taobao Double 11 Shopping Carnival.
References
- (1)
- Cao et al. (2022) Yi Cao, Sihao Hu, Yu Gong, Zhao Li, Yazheng Yang, Qingwen Liu, and Shouling Ji. 2022. Gift: Graph-guided feature transfer for cold-start video click-through rate prediction. In Proceedings of the 31st ACM International Conference on Information & Knowledge Management. 2964–2973.
- Cheng et al. (2016) Heng-Tze Cheng, Levent Koc, Jeremiah Harmsen, Tal Shaked, Tushar Chandra, Hrishi Aradhye, Glen Anderson, Greg Corrado, Wei Chai, Mustafa Ispir, et al. 2016. Wide & deep learning for recommender systems. In Proceedings of the 1st workshop on deep learning for recommender systems. 7–10.
- Feng et al. (2019) Yufei Feng, Fuyu Lv, Weichen Shen, Menghan Wang, Fei Sun, Yu Zhu, and Keping Yang. 2019. Deep session interest network for click-through rate prediction. arXiv preprint arXiv:1905.06482 (2019).
- Oord et al. (2018) Aaron van den Oord, Yazhe Li, and Oriol Vinyals. 2018. Representation learning with contrastive predictive coding. arXiv preprint arXiv:1807.03748 (2018).
- Pi et al. (2020) Qi Pi, Xiaoqiang Zhu, Guorui Zhou, Yujing Zhang, Zhe Wang, Lejian Ren, Ying Fan, and Kun Gai. 2020. Search-based User Interest Modeling with Lifelong Sequential Behavior Data for Click-Through Rate Prediction. CoRR abs/2006.05639 (2020). arXiv:2006.05639 https://arxiv.org/abs/2006.05639
- Shen et al. (2022) Qijie Shen, Hong Wen, Wanjie Tao, Jing Zhang, Fuyu Lv, Zulong Chen, and Zhao Li. 2022. Deep interest highlight network for click-through rate prediction in trigger-induced recommendation. In Proceedings of the ACM Web Conference 2022. 422–430.
- Wang and Liu (2021) Feng Wang and Huaping Liu. 2021. Understanding the behaviour of contrastive loss. In Proceedings of the IEEE/CVF conference on computer vision and pattern recognition. 2495–2504.
- Xia et al. (2023) Yaxian Xia, Yi Cao, Sihao Hu, Tong Liu, and Lingling Lu. 2023. Deep Intention-Aware Network for Click-Through Rate Prediction. In Companion Proceedings of the ACM Web Conference 2023. 533–537.
- Zhou et al. (2019) Guorui Zhou, Na Mou, Ying Fan, Qi Pi, Weijie Bian, Chang Zhou, Xiaoqiang Zhu, and Kun Gai. 2019. Deep Interest Evolution Network for Click-Through Rate Prediction. Proceedings of the AAAI Conference on Artificial Intelligence 33 (Jul 2019), 5941–5948. https://doi.org/10.1609/aaai.v33i01.33015941
- Zhou et al. (2018) Guorui Zhou, Xiaoqiang Zhu, Chenru Song, Ying Fan, Han Zhu, Xiao Ma, Yanghui Yan, Junqi Jin, Han Li, and Kun Gai. 2018. Deep Interest Network for Click-Through Rate Prediction. Proceedings of the 24th ACM SIGKDD International Conference on Knowledge Discovery & Data Mining (Jul 2018). https://doi.org/10.1145/3219819.3219823