Computational study of active polar polymer melts: from active reptation to activity induced local alignment
Abstract
This work investigates the effects of tangent polar activity on the conformational and dynamic properties of entangled polymer melts through Langevin molecular dynamics simulations. We examine systems composed of all self-propelled, monodisperse linear chains, so that constraint release is considered. The range of activities explored here includes values where the active reptation theory is applicable, as well as higher activities that challenge the validity of the theory. Chain conformations exhibit a moderate increase in coil size increase, which becomes more pronounced at higher activity levels. Under these conditions, a local bond alignment along the chain contour appears together with a non-homogeneous segmental stretching, and orientation and stretching of the tube. Dynamically, polar activity induces a molecular-weight-independent diffusion coefficient, a transient superdiffusive behavior, and an end-to-end relaxation time inversely proportional to the molecular weight. Finally, our results are summarized in a diagram that classifies the various regimes of behavior observed in the simulations. Overall, these findings provide valuable insights into the complex interplay between activity and entanglements, advancing our understanding of active polymer systems and their potential applications across various fields.
keywords:
Active matter , Entangled polymers , Active polymers , Reptation[inst2]organization=Department of Chemical Engineering, Universidad Politécnica de Madrid,addressline=Jose Gutierrez Abascal 2, city=Madrid, postcode=28006, state=, country=Spain \affiliation[inst1]organization=Yusuf Hamied Department of Chemistry, University of Cambridge, addressline=Lensfield Road, city=Cambridge, postcode=CB2 1EW, state=England, country=United Kingdom \affiliation[inst3]organization=Theoretical Physics of Living Matter, Institute for Advanced Simulation, Forschungszentrum Jülich, addressline=52425 Jülich, country=Germany. ∗These authors contributed equally.
![[Uncaptioned image]](/html/2411.11472/assets/x1.png)
Langevin molecular dynamics simulations of entangled polymers melts with polar activity
Verification of the existing theory predictions and analysis of the impact of constraint release
Non-homogeneous activity-induced deformations and bond alignment along the chain contour
Tube alignment and stretching at high activities
Overall dynamical and conformational behavior summarized in a phase diagram
1 Introduction
Active matter comprises individual elements capable of consuming internal energy or drawing energy from their environment to perform mechanical work [1, 2], leading to non-equilibrium collective behaviors not typically observed in equilibrium systems [3, 4, 5, 6]. There are many examples of active matter both in biological [7, 8, 9] and synthetic systems [10, 11, 12]. Active polymers arise from the collective behavior of covalently bonded active agents [13], exhibiting unique and complex dynamics that distinguish them from passive polymers. Activity in polymers can take various forms, including monomer self-propulsion [14], the action of molecular motors [15, 16], or interactions with external fields [17] and local gradients [18]. The complex interplay between the magnitude and orientation of active forces and the internal degrees of freedom of the polymer significantly affects its conformation, relaxation time, and diffusion. Of the diverse types of active forces that can be found in polymers, polar active forces — characterized by a tangential force that induces directed motion along the polymer chain — have attracted significant interest for their role in biological systems like microtubules and actin molecules driven by molecular motors [19, 20, 9]. These type of active forces also hold promise for synthetic biology and materials science applications due to their unique properties [21, 22, 23, 24].
Most previous theoretical studies on active polar polymers have focused on dilute conditions [25, 26, 27, 28]. Polar activity in single chains has shown to either increase or decrease overall polymer size, depending on polymer length, activity strength [28, 29, 30, 31, 32], hydrodynamic interactions [33, 34], the position of the active monomer block along the chain [35], and the relevance of inertia [26, 36]. In all cases, polar activity may induce a progressive deformation where the head is generally more collapsed than the tail [26]. These findings contrast with the predictions of simulations and analytical theories for polar active Rouse chains [37, 22], which suggest that chain conformations remain independent of activity. This contrast underscores the importance of model details, such as excluded volume interaction and the form of bonded potentials, which can significantly impact system properties. Both simulations and theory predict a superdiffusive regime for the center-of-mass mean-square displacement, followed by an enhanced diffusive regime at longer times, similar to the behavior of active Brownian particles (ABP) [38].
Previous studies have also investigated two-dimensional active polar polymer melts under dense conditions [16, 39, 40], revealing complex phase behaviors and non-equilibrium steady states. Ubertini et al. [41] recently examined the conformation and dynamics of polar active polymers in dense three-dimensional conditions, concluding that chain conformations and dynamics display universal characteristics, independent of whether chains are in dilute solutions or melts. Miranda et al. [42] explored active flexible rings in bulk and with lateral confinement, observing the emergence of self-organized complex dynamical states. Notably, the extension to three-dimensional systems adds significant complexity — not only computationally but also through the critical role of entanglements, which are absent in dilute conditions and less prominent in two-dimensional systems. Unraveling the interplay between activity, entanglement, and spatial dimensionality is essential for a comprehensive understanding of polar active polymers.
In equilibrium melts, the motion of linear polymer chains with molecular weight (expressed as the number of monomers) beyond a threshold is constrained by the inability to cross neighboring molecules [43]. These topological constraints, or entanglements, profoundly alter the dynamics of equilibrium polymers: relaxation times and viscosities shift from scaling linearly with molecular weight for to scaling as for linear polymers, and even exponentially for branched polymers [44, 45]. The tube theory, the gold standard model for understanding entangled polymer dynamics [46, 47], suggests that neighboring chains confine a probe chain within a tube-like region, constraining lateral motion beyond a lengthscale (the tube diameter), while allowing free diffusion along the axis of the tube (the primitive path) [47]. Over recent decades, the tube theory has been enhanced to incorporate additional mechanisms such as contour length fluctuations [48, 49], constraint release [50, 51] or tube dilation [52, 53]. This refined framework has successfully explained results from experiments on linear rheology [54], dielectric relaxation [55, 56], and neutron spin-echo [57], both in equilibrium and under non-linear deformation [58]. Ultimately, the tube theory provides a conceptual basis for understanding how surrounding chains constrain the motion of a single polymer chain, a framework that can also be extended to active polar systems, where active forces and tube confinement yield novel dynamics.
Building on the tube model, we recently developed an analytical theory to describe the behavior of entangled polar active chains [59, 60]. For a broad range of small activities that do not disrupt chain conformations or the entanglement network, this theory predicts a linear dependence of the viscosity on molecular weight and a diffusion coefficient that is independent of the molecular weight. These predictions were confirmed through Langevin molecular dynamics simulations of active polar entangled chains diluted in a mesh of long passive entangled chains with exceedingly long relaxation times [61]. These simulations also naturally accounted for contour length fluctuations (CLF), i.e. the variations in the length of a polymer chain due to thermal motion and segmental dynamics.
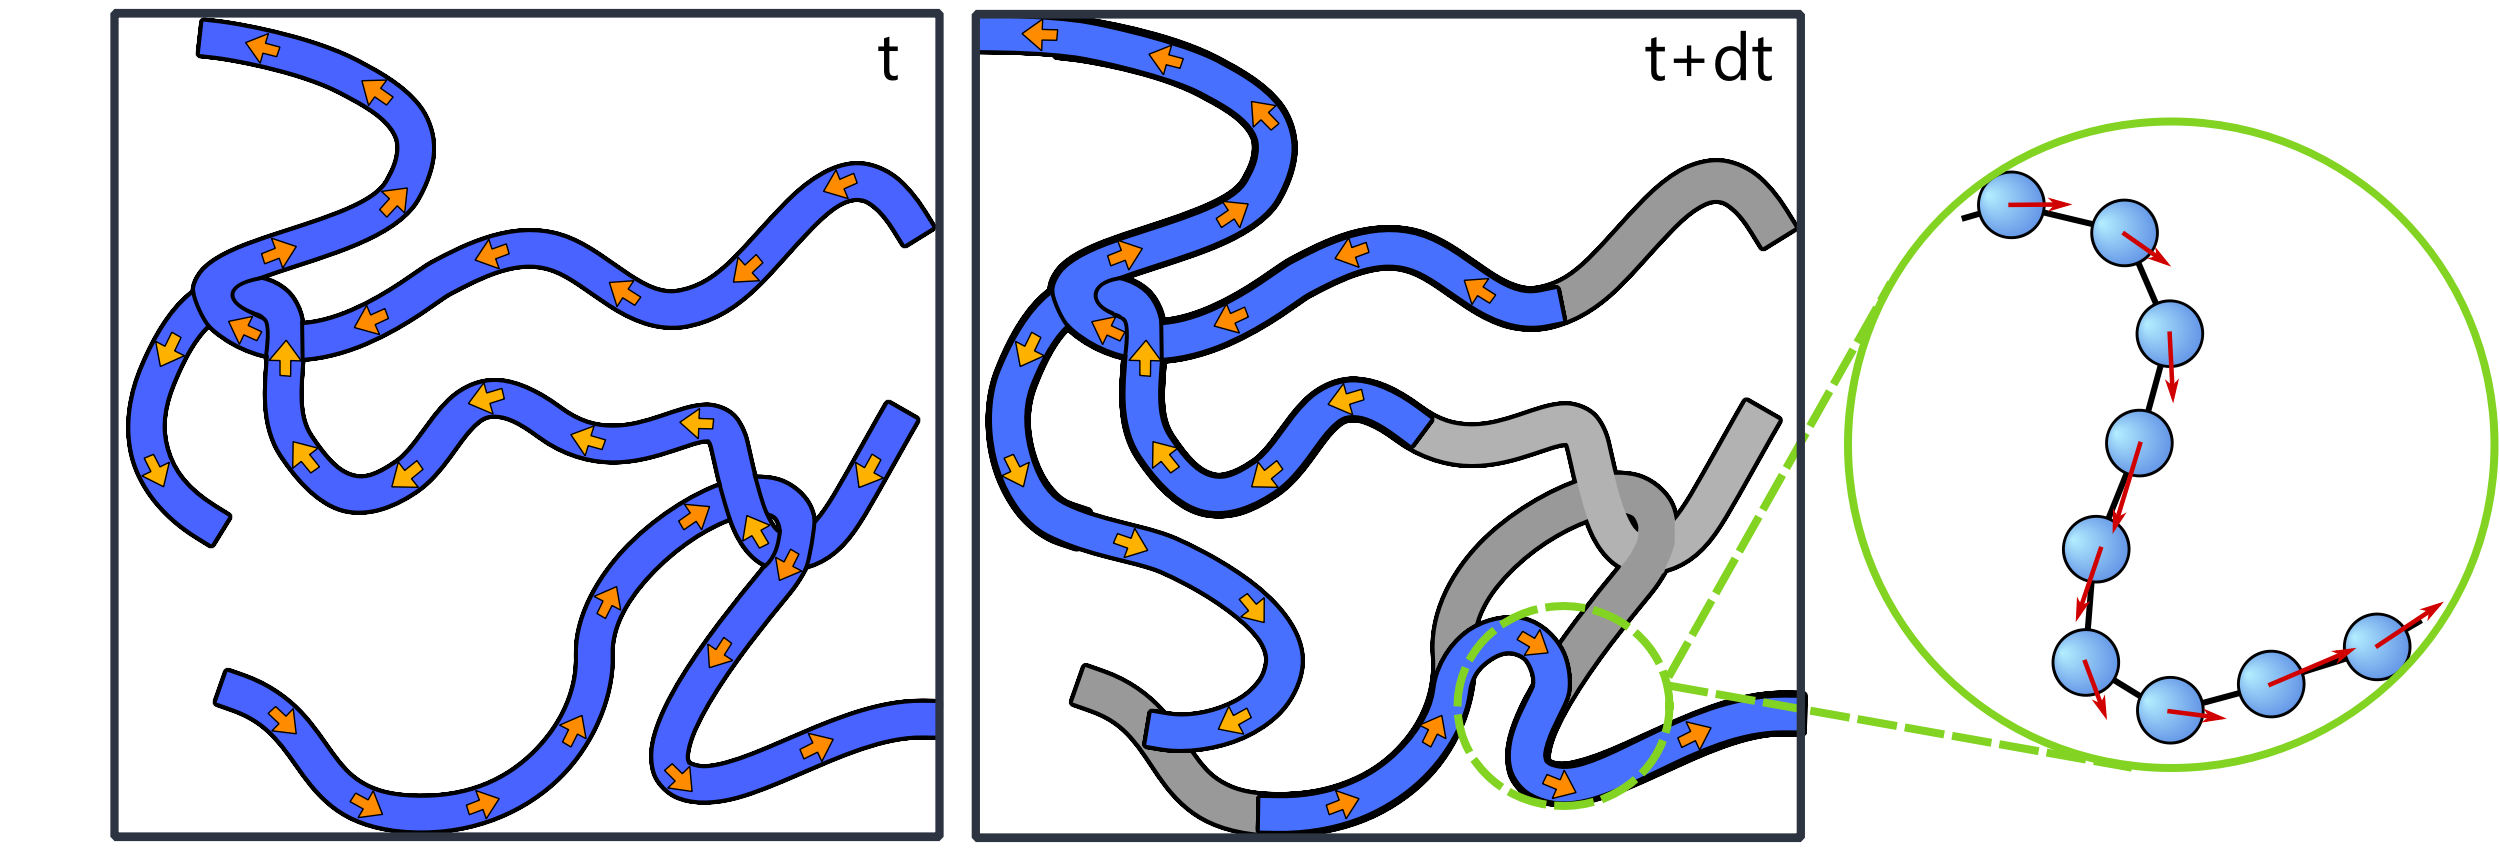
Constraint release (CR) introduces an additional relaxation mechanism, as the confining tube around a polymer chain is not static but composed of neighboring chains that also move within their own tubes. As a result, the expected lifetime of entanglements becomes comparable to the disengagement time due to active reptation. For a given probe chain, the tube can be destroyed by reptation — when a chain end reaches any point along the tube — or modified by the ongoing renewal of the tubes formed by the surrounding chains with which it is entangled (see Fig. 1). In a melt of polar active polymers where all chains are active, this CR effect significantly accelerates the overall system relaxation. Since CR is an intrinsically multi-body effect, multi-chain Molecular dynamics simulations provide and ideal framework for exploring its impact [62].
In this work, we investigate the effect of CR on the dynamics of active polar polymers in the melt through Langevin molecular Dynamics simulations of a coarse-grained model, with polar activity uniformly applied across all polymer chains in the system. In Section 2, we describe the coarse-grained model and the method for implementing the polar activity in our simulations. Section 3 presents an analysis of the impact of polar activity on the conformation and dynamics of these polymers, with comparisons to theoretical predictions [60] and results from previous studies on active diluted chains [26] or active melts without CR [61]. This section concludes with a phase diagram summarizing the distinct qualitative behaviors of active polar chains as a function of Péclet and molecular weight. Finally, in Section 4, we highlight the key findings of this study. By extending the theoretical framework to multi-chain simulations and examining the resulting dynamics, we aim to offer new insights into active polymer systems.
2 Simulation method
We carry out Langevin molecular dynamics (MD) simulations to study the dynamics and conformations of linear active entangled polymers. Polymers are modelled by the the Kremer-Grest (KG) model [63] —a standard coarse-grained model for investigating the universal properties of entangled polymer melts. This model incorporates all the essential physical features, including chain connectivity, chain uncrossability (entanglements), contour-length fluctuations (breathing modes) and constraint release. The KG model describes the polymer chains as a linear sequence of purely repulsive beads connected by non-linear springs. Non-bonded interactions are modelled by the Weeks-Chandler-Andersen (WCA) potential [64], given by
| (1) |
where is the distance between two interacting beads, the bead diameter, and the interaction strength. Neighbour beads along a polymer chain are connected by FENE springs [65], whose potential energy is given by
| (2) |
where is the strength of the spring, and the maximum extensibility of the spring.
The activity is introduced as an additional force acting on each monomer, tangent to the polymer contour, as shown in Fig. 1. The force on each monomer is determined by the position of its two nearest connected neighbours as:
| (3) |
where is the magnitude of the active force and is the equilibrium value of the bond length. For the end monomers, the active force acts along the bond direction. Consequently, the active tangent force establishes a well defined direction along each polymer, allowing the ends to be identified as the head — the leading end — and the tail — the trailing end. Discretization of the tangent force chosen in Eq. (3) implies that the modulus of the force acting on each monomer varies with the local chain conformation, being maximum when neighbour bonds are aligned and minimum when they adopt an anti-parallel conformation (see the right panel in Fig. 1).
The evolution of the system is determined by the Langevin equations of motion for all the beads in the system, that referred to the position of particle can be expressed as
| (4) |
where is the mass of the bead, is total potential energy, is the friction coefficient, is Boltzmann’s constant, is the temperature and is a Gaussian distributed random force process [66] that satisfies the fluctuation-dissipation theorem [67], i.e. it has mean and variance , with . All simulations in this work have been run using the LAMMPS software [68] (version 21 Jul 2020) modified to introduce the tangent active force.
In the following, we use Lennard-Jones units, so that the fundamental quantities , , and are all equal to 1, and the derived characteristic time is taken as the unit of time. Furthermore, as in the original work of the KG model [63], we use the parameters , , , , and overall monomeric density . We study systems consisting of KG polymers with lengths varying from 50 to 800 monomers per chain. For each molecular weight , the cubic simulation box side is set to ensure a minimun length of at least twice the root mean squared equilibrium end-to-end distance , where , and the characteristic ratio as known for the Kremer-Grest model [69]. More details about the systems set up and equilibration are provided in the Supplementary Material.
To quantify the effect of activity we define the microscopic or monomeric Péclet number (Pem) defined as a the ratio of the local active and thermal forces, i.e. [28, 26, 29]. In this work, values of Pem spanning 4 orders of magnitude are studied. Furthermore, since the motion of a polymer chain is governed by different length scales, it is useful to additionally consider a global Péclet number, defined as PePem, which depends on the polymer molecular weight [26, 39]. Hydrodynamic interactions are not considered here since they are not expected to play an important role at the monomer densities studied in this work.
3 Results and discussion
3.1 Conformation and static properties
3.1.1 Coil average size
The effect of the polar activity on the coil characteristic size is calculated by averaging the end-to-end distance of all polymers and normalizing it by the corresponding value at equilibrium as shown in Fig. 2. Overall, polymer conformations are only slightly stretched by activity, with a relative growth of the end-to-end distance is up to 14% for the highest values of the activity here studied. Qualitatively, this behavior has an opposite trend to that in the dilute regime, where both in the presence and absence of inertia, the coil size of long chains decreases by up to 30% [26, 28] in a similar range of activities. The collapse occurring for the same chains in dilute conditions is prevented by the large confinement effects provided by the high density of monomers in the melt. Beyond , entanglements have a significant effect and seem to slow down the growth of the coil with activity. Recently reported simulations of the same system with a higher friction coefficient report a decrease of the coil size with activity [41], which indicates that inertia might affect the static properties (see discussion in Section 3.3).
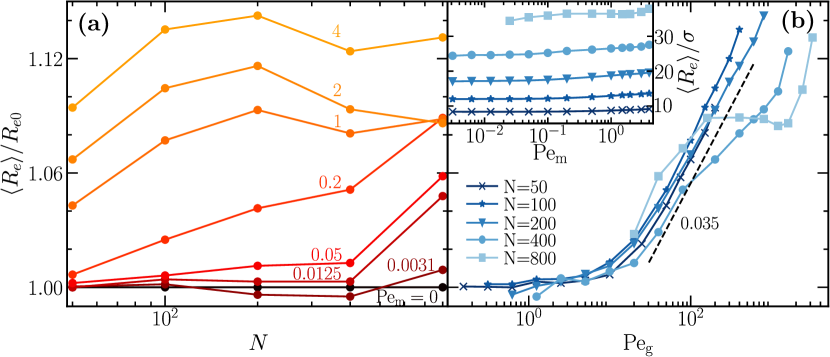
The increase of coil size as a function of activity is shown in Fig. 2(b), where the coil size shows to be almost unperturbed up to a critical value of the Péclet number, Pe. For activities larger than this critical value, a behavior close to universal is found, similar to that observed in diluted polar active chains [26], including the logarithmic dependence of the coil size with the activity above the threshold Peg, as depicted by the scaling line shown in Fig. 2(b). Since Peg is a function of the molecular weight, this collapse implies that the critical value of the monomeric activity Pem is smaller for longer chains. Long chains at high activities show a non-monotonic growth as a function of the activity, which is most likely related to the later discussed emergence of local order. Note that although measurable, the elongation is relatively small for the studied Pem values.
3.1.2 Coil progressive deformation
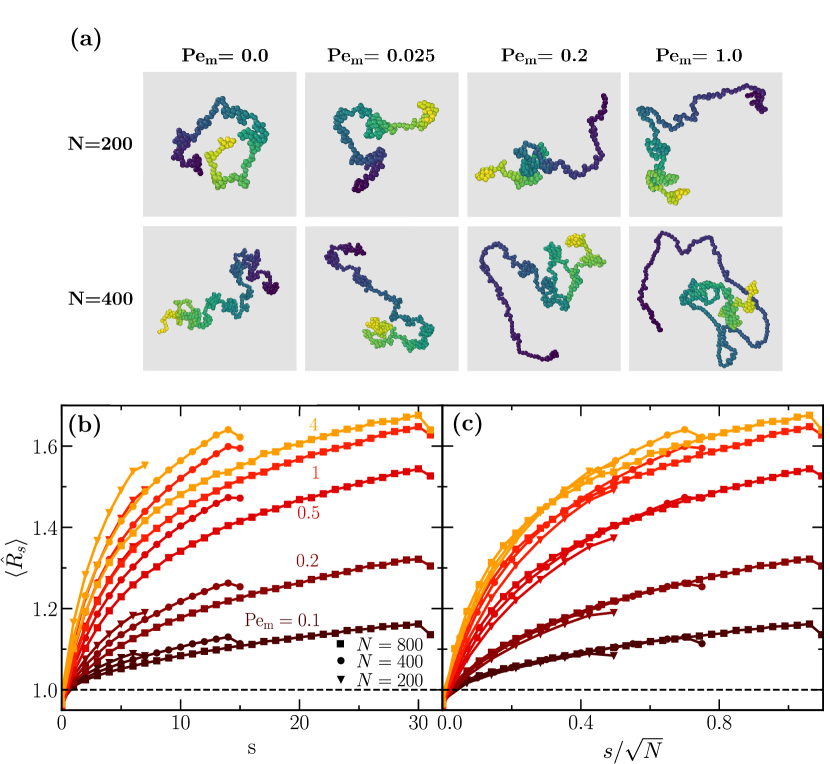
While activity only slightly stretches the overall coil size, a visual inspection of the chain snapshots in Fig. 3(a) reveals that the heads are significantly more compact and the tails more elongated, similar to the dilute case [26]. We quantify this effect by , the mean end-to-end distance of chain segments of length , which are calculated along the chain contour and normalized by the size of strands of the same size at equilibrium. Fig. 3(b) shows as a function of the segment position along the chain, with representing the head and the tail of the chain. All curves show an important increase of the segments elongation towards the tail, which already means that polar active force is breaking the self-similarity of the polymer chains in the melt. Besides the very last dangling segment, the local stretching increases with applied activity, reaching values of above 60 for the parameters here investigated. Increasing polymer length shows to decrease the elongation of the segments, which is in contrast to the dilute case where the progressive elongation depends on Pem and is independent of . This universality was attributed to the balance between the tension transmitted and accumulated by the polar activity along the backbone from the head to the segment located at position , and the frictional resistance of the remaining strand between and the tail. In the case of the melt, segments at position belonging to shorter chains elongate more than segments at the same position of longer chains (see Fig. 3(a), indicating that the tension is transmitted differently along the chain backbone when the polymer is in an active melt, due to the confinement provided by the neighboring polymers. This means that, given a certain segment , the tension necessary to stretch it is larger the longer the polymer, or similarly, that the stiffness of the confining network is larger the longer the building polymers are.
Figure 3(c) shows a reasonable overlap of the curves corresponding to different molecular weights onto a universal shape when the axis is rescaled by . To get some insight on this scaling, we recall that the end-to-end distance of a polymer in equilibrium is proportional to , and this scaling is not significantly modified by the activity (see Fig. 2). The fact that the same deformation is obtained for segments located at position in chains of different lengths suggests that the same average force-drag balance is obtained when the relative location of the projected position of segment onto the end-to-end vector is also the same (see a sketch in Fig. S1(a) in the Supplementary Material).
3.1.3 Mesh architecture
In the context of reptation, it is crucial to test whether activity modifies the underlying entanglement network. For that purpose, we performed a primitive path analysis (PPA) [70, 71] on steady-state snapshots of all simulated systems, using a modified version of LAMMPS [72]. From this analysis, we can extract the average length of the primitive path and, assuming random walk statistics, relate it to the diameter of the tube as, , where is the mean-square end-to-end distance of the chains.
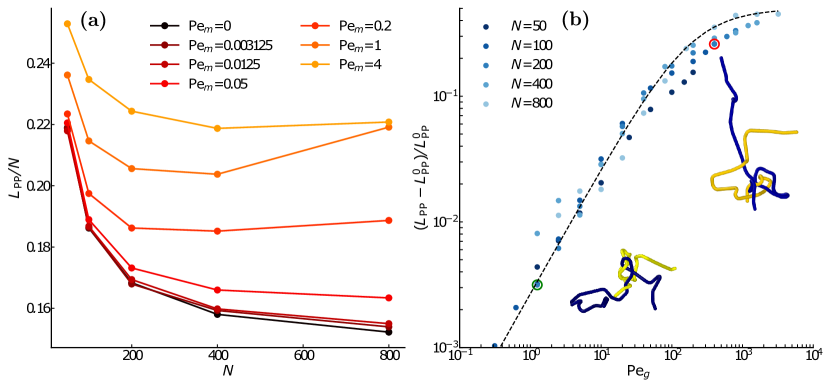
In Fig. 4(a), the average length of the primitive path , normalized by the molecular weight , is plotted versus the molecular weight for different values of activity. For reference, the value of the polymer melt in equilibrium is also displayed, showing the usual overestimation of the tube length by PPA when the polymer chains are short. For small values of the activity, Pe, the tube length is almost indistinguishable with respect to the equilibrium primitive path. With increasing activities, the primitive path gets progressively more elongated. In Fig. S2 of the Supplementary Material, example snapshots of primitive path networks after PPA are represented, showing clear signs of tube elongation at high activities.
To better understand the increase in tube length with activity, Fig. 4(b) shows the relative increase in the length of the primitive path with respect to the obtained equilibrium length , plotted as a function of the global Péclet PePe. The data reveals a seemingly universal linear increase at low to moderate activities, followed by saturation at very high values of Peg. In the inset of Fig. 4(b), two snapshots of a representative primitive path configurations are shown at low and high activities, revealing the tube elongation due to the activity. This data also shows that the primitive paths extend up to 50% of their size in equilibrium. This is much more that the average elongation of the end-to-end distance of the individual polymers which increase a maximum of 10% for the ranges here investigated (see Fig. 2). This difference suggests that the chains are forming an inward-folded structure, as evidenced by the snapshots in Fig. 3.
In order to provide an estimation of the length of the tube we assume that it results from balancing the elongation force of the active term, , with the elastic retraction of the polymer confined within the tube, . The total active tension accumulated in the chain is
| (5) |
and tends to stretch the chain inside the tube. The resistance to such stretching comes from the entropic elasticity of the polymer chain within the tube, which can be assumed to have a similar nature to the FENE force that governs the bonded forces, that is,
| (6) |
Here is the elastic constant, and the equilibrium contour length of the primitive path which, according to the tube theory, is , being the tube diameter, and is the maximum length of the tube, which we take here as . Considering now that we have that
| (7) |
Dividing on both sides by , replacing with the expression for Péclet number and simplifying we get:
| (8) |
which shows that the relative growth of the tube length depends only on the global Péclet number . Active tension acts along the contour of the chain and not on the primitive path of the tube. The projection of the active tension on the tube axis is expected to be much smaller than the one provided along the polymer contour by , such that we can consider a fit parameter resulting into
| (9) |
The black dashed line shown on Fig. 4(b) has been obtained with . More details about the derivation of Eq. (9) can be found in Section SIII of the Supplementary Material.
3.1.4 Limits of validity of the active reptation theory
A theory to predict the influence of polar active in the reptation properties of a polymer melt has been recently developed in the limit of small activities [59, 60]. This theory builds upon a basic tube theory assumption, that the chain ends can explore all possible orientations before creating new tube segments, so that the tube maintains the fractal structure of a random walk. This assumption implies that the maximum drift velocity of the primitive path along the tube needs to smaller than the ratio of the tube diameter and the entanglement time , as . This means that the chain end can relax its orientation (in a time of the order of ) before the primitive path moves by the activity-induced drift a distance of the order of the tube diameter . An estimation of considers the values obtained for the standard KG model, and [73], resulting into , which is very small. In addition, constraint release is not considered by the theory, so tubes are described as static objects, an assumption which is expected to breakdown when all chains are active, as explained already in Fig. 1. If the tube is static, the correlation of the tube segment orientation is expected to simply decay exponentially with distance.
To precisely quantify this effect, we here consider the unit vector of the bonds along the primitive path, , and calculate their mean correlation. In Fig. 5, is shown as a function of , the monomeric distance (as obtained from PPA) from the head along the primitive path, for different activities. The passive case shows an exponential decay with monomers. This number can be compared with the typical number of monomers in between entanglements, , which for the Kremer-Grest model is , as determined by Likhtman from the plateau modulus [73]. At very small activities, Pe, the correlation is almost identical to the equilibrium case, indicating that the orientational properties of the entanglement network are not being perturbed by the activity. However, at slightly larger activities Pe, the correlation deviates from the equilibrium decay at monomeric distances above , which is a sign that orientational correlation between tube segments is appearing beyond the entanglement molecular weight. This already indicates that the main assumption in the active reptation theory at these still relatively small activities already fails. For a bit larger activities (Pe), a stronger decay appears at very small monomeric distances , which does not occur when plotting the orientation correlation as a function of the contour length distance along the primitive path (see inset in Fig. 5). This suggests that the tube remains unperturbed next to the head, while the chain inside is getting stretched (see Fig. S1(b) in the Supplementary Material), and that the correlation very clearly deviates from the exponentially one at distances beyond the equilibrium tube diameter .
Although CR effects were not included in the active reptation theory [59, 60], some predictions remain valid for low activity levels. However, for activities above Pe, we expect deviations, given the elongation and orientational correlation observed in tube segments. In molecular dynamics simulations of active chains moving within a network of long passive polymers [61], where CR was intentionally disabled, no tube deformation was observed up to Pe. This suggests that CR, by softening the tubes, amplifies the impact of activity on both the chain conformations and the overall entanglement network.
3.1.5 Activity-induced bond alignment
When polymers are subjected an external flow, chain segments typically orient in the flow direction. In melts, this orientation occurs when the flow rate exceeds the inverse of the disengagement time , and before any signs of elongation appear, which arises only when the flow rate exceeds the inverse of the Rouse time [74]. However, in polar active polymer melts, no flow field is present, so there is no preferred orientation, and the overall orientation distribution of remains isotropic. Nonetheless, it is not immediately clear whether polar activity might still lead to some degree of local alignment.
We calculate then the order parameter to determine whether alignment precedes, or drives chain stretching. To quantify the degree of alignment and orientation of the polymer segments, we first compute, for each monomer , the unit vector pointing from the previous monomer to the next along the chain contour. Then, we calculate the angle between this vector and the unit vectors associated with all monomers surrounding monomer . Finally, we determine the second-order Legendre polynomial parameter for each monomer (except for the ends), defined as:
| (10) |
where the average runs over all monomers within a cut-off distance of monomer (in this case, ). The order parameter is commonly used to detect nematic alignment with indicating perfect alignment and a random distribution of orientations. In our simulations, is computed for each monomer and is averaged over monomers and steady state snapshots.
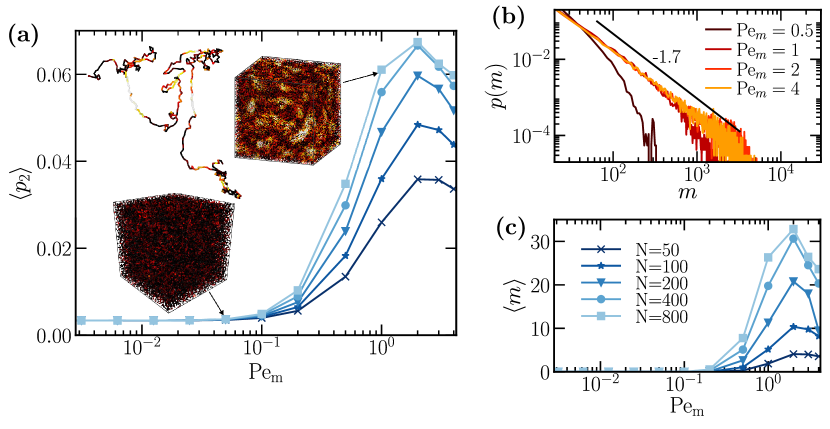
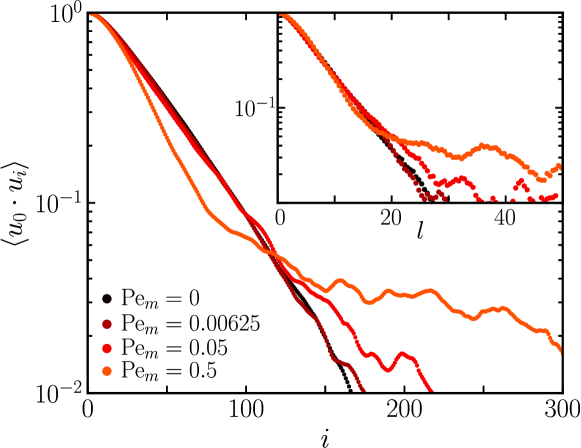
In Fig. 6(a), the mean value of the order parameter is shown as a function of Pem, for different molecular weights. In equilibrium, has a non-vanishing value related to some local alignment due to excluded volume effects. Increasing the activity level to Pe does not result in any noticeable increase in . However, beyond this threshold, activity clearly makes local bond alignment to increase, effect which is stronger for longer polymers. All curves exhibit a peak alignment at Pe, with the maximum value increasing with molecular weight, followed by decrease at higher Pem values. The mean values of remain relatively low due to the inhomogeneous bond alignment within the simulation box (see snapshots in Fig. 6(a). At low , the simulation box appears mostly dark, indicating a lack of nematic order. At higher activities, bright regions emerge, indicating local clusters of aligned segments. The snapshot of a single molecule nicely illustrates how varies along the chain contour, and that straight segments more frequently correspond to higher As with segmental stretching (see Fig. 3), nematic order is higher in segments closer to the tail (see Fig. S4 in the Supplementary Material).
The clusters of aligned bonds are reminiscent of nematic tactoids [75, 76], and in order to characterize their average size we first define a threshold value , above which a monomer is considered to be ordered. We then identify clusters of ordered monomers based on a distance criterion: ordered monomers within a maximum distance of are considered part of the same cluster. Figs. 6(b) and 6(c) show the cluster size distribution and mean value of the size of the clusters of aligned bonds, respectively. Below a threshold of Pe, decays exponentially, broadening as activity increases. At higher activities, the distribution adopts a power-law shape with , resembling scale-free networks. Similar cluster size distributions have been observed in other active matter models, such as the Vicsek model [77], self-propelled hard disks [78], self-propelled rods [79], and active Brownian particles with polar alignment [27]. These distributions typically precede percolation and eventually also the emergence of a giant cluster.
By closely inspecting the curves in Fig. 6(c), a maximum cluster size is observed at Pe, followed by a slight decrease at Pe. This peak in cluster size aligns with the maximum values of (Fig. 6(a)), suggesting that activity promotes bond alignment and cluster growth up to a threshold Pe. Beyond this point, higher activity disrupts further alignment and the formation of larger clusters. Interestingly, polar activity still generates clusters of several thousand aligned bonds (Fig. 6(b), with longer chains forming larger clusters (Fig. 6(c)). However, these clusters exhibit highly dynamic behavior, continuously dissolving and reforming at distant, seemingly uncorrelated regions of the simulation box. This rapid fluctuation prevents the formation of distinct ordered and disordered regions, and no phase separation is observed in our simulations.
3.2 Dynamical properties
As in the case of dilute polymers with polar activity, the total active force acting on each polymer center of mass is proportional to its end-to-end vector. However, in a melt, chains are constrained and must slither along their primitive paths rather than move freely in the direction of the force, as they do in dilute conditions. Despite this constraint, activity is expected to significantly impact the dynamical properties of the melt. To investigate this, we examine the center-of-mass and segmental mean-square displacement, end-to-end vector relaxation, and tangent-tangent correlation function. All these dynamical observables have been calculated using an efficient multiple tau correlator technique [80].
3.2.1 Center of mass MSD and diffusion coefficient
The mean square displacements (MSD) of the centers of mass of chains with different molecular weights at various Pem are presented in Fig. 7(a). In the passive case, the expected long subdiffusive behavior is observed, which at longer times transitions into a molecular weight-dependent Fickian regime at the disengagement time [47], appearing as a plateau with the chosen normalization. In the case of activity governing the dynamics over reptation, two key phenomena emerge: (i) the terminal Fickian regime, observed at times , where is the disengagement time due to activity, is preceded by a superdiffusive regime, which can persist for over a decade in logarithmic time at high activities, and (ii) the diffusivity becomes independent of molecular weight, depending solely on Pem. Both observations align with the active reptation theory predictions [59], suggesting that CR does not significantly influence the qualitative behavior of the MSD of the center of mass.
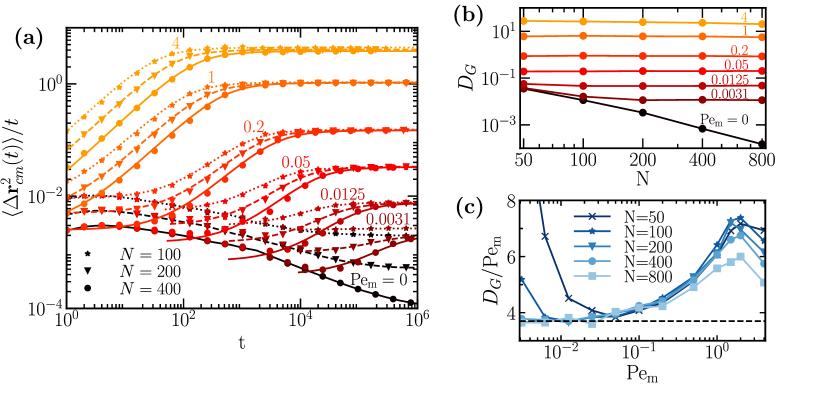
Interestingly, when the activity dominates the dynamics, the diffusion of the center of mass can be accurately described by the MSD of an active Brownian particle (ABP) [38]. The fits to the simulation results are shown as lines in Fig. 7(a) for Pe (details provided in the Supplementary Material). The fits do not reproduce the behavior at very short times, since the equation for an ABP does not consider any of the internal degrees of freedom that are characteristic of the motion of polymer chains, but work very well from times almost two decades smaller than . A similar near-quantitative agreement was found in the MSD of dilute active polar polymers [26], which is attributed to the total active force on the center of mass being proportional to the end-to-end vector, whose orientation relaxes almost as a single exponential.
From the Fickian regime in Fig. 7(a), the self-diffusion constant can be extracted as , as shown in Fig. 7(b), where it can again be confirmed that becomes independent of molecular weight when the activity dominates the dynamics and depends only on Pem. In the passive case, follows a power-law dependence on molecular weight, scaling roughly as for (with deviations from the expected Rouse scaling of already reported in unentangled melts [81]), and transitions to for , which is characteristic of reptation with contour-length fluctuations [82]. Since in the KG model [73], the transition from Rouse to reptation regimes occurs around to .
To gain a deeper understanding of the diffusion behavior, Fig. 7(c) depicts , revealing three distinct regimes. At very low activities, diffusive reptation dominates with a constant diffusion, which makes diverge. This can be seen in Fig. 7(c) for shorter chains (). The threshold Pe, above which active forces overtake reptation, is expected to scale as Pe [59], implying that longer polymers will also show such divergence at even smaller values of the activity. For intermediate values of the activity, below a threshold Pe, polar activity dominates over the diffusive reptation motion, and the diffusion coefficient shows to be proportional to the Péclet number, particularly for entangled polymers (). In this regime, the total active force applied along the chain contour in Eq. (5) increases with molecular weight as . Simultaneously, the friction coefficient for the chain slithering motion along the primitive path increases as , where is the monomeric friction coefficient, not necessarily equal to the friction coefficient in the Langevin Eq.(4) (see Section 3.3). The drift velocity of the chain in its slithering motion is therefore independent of , since . Since the length the chain must travel to escape the tube grows linearly with (i.e. ), the time required for the chain to escape the tube due to active slithering motion scales as . Assuming that active chains approximately maintain Gaussian statistics, each time a chain escapes its tube, it must have traveled a distance on the order of the mean squared end-to-end distance, . Therefore, the diffusion coefficient can be estimated as , which agrees with simulation results shown in Fig. 7(c).
Finally, at larger values of the activity, grows faster than linearly with respect to Pem, reaching a peak at Pe, before decreasing again. This enhanced diffusion correlates with the emergence of nematic bond alignment, which also peaks at Pe, as shown in Fig. 6. Alignment is likely to reduce the local friction coefficient for monomer sliding, thereby enhancing the overall chain motion along the tube. Interestingly, though alignment is more pronounced in longer chains, the diffusivity increase is less pronounced. This may result from the combination of reduced friction and increased tube stretching, which is more significant for longer chains, as seen in Fig. 4(b). Consequently, while friction decreases due to alignment, longer chains must still reptate over greater distances under strong activity. As Pem increases further, alignment decreases, but tube stretching persists, leading to a decline in the diffusion coefficient .
3.2.2 Monomeric MSD
In Fig. 8(a), the time-normalized MSD for selected monomers of chains with at various Pem values are shown. In the passive case, the MSD follows the classical power laws predicted by Doi and Edwards for a Rouse chain reptating inside a random-walk-like tube [47], with the middle monomer moving the slowest, while the head and tail, having identical MSD, move the fastest. Given that the activity disrupts the conformational symmetry between the head and tail of the chain, it is interesting to explore whether this symmetry breaking also affects their dynamics. It is worth noting that, according to the analytical theory of active reptation [60] and previous simulations that include consider CLF [60, 61], even though the activity induces a clear polarity along the chain, the dynamical symmetry between head and tail in terms of monomeric MSD is preserved. The same symmetry holds for the melts of polar active chains studied here, up to a moderate Péclet number, Pe (see Fig. 8(a).
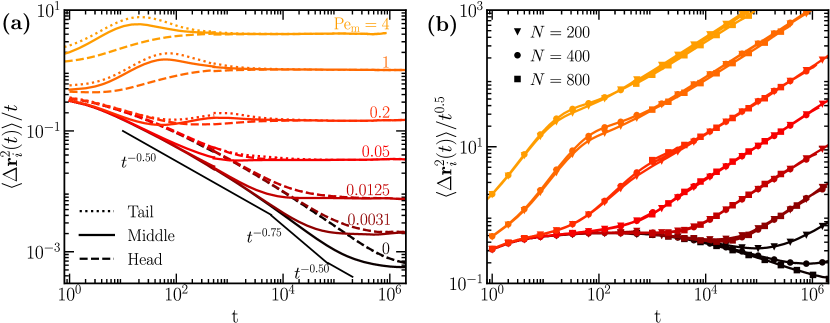
However, for higher activities, a clear dynamical asymmetry emerges, with the head monomer moving more slowly than the tail. This asymmetry becomes more pronounced with increasing Pem, and for Pe, the head monomer becomes the slowest along the entire chain, even slower than the middle monomer. These dynamics are reminiscent of those observed in active polar diluted chains [26], where the asymmetry was attributed to the tail loosely following the head, diffusing over a longer path, and exhibiting lateral fluctuations that increase with activity.
In the current study, however, since the chains are in a dense, entangled melt, they are constrained to move along a tube. To accommodate the greater lateral fluctuations of the tail, properties of the tube segments. such as step length and radius, must change between the time the head creates the tube segment and the moment the tail passes through and destroys it. This effect may be driven by CR, potentially inducing an activity-enhanced dynamic tube dilation effect [83] during the lifetime of each tube segment.
Interestingly, at very high activities (Pe), all monomers exhibit a superdiffusive regime in their MSD. This phenomenon is not predicted by the analytical theory of active reptation, as the Pem values required to observe superdiffusion fall outside the validity range of the theory [60].
In Fig. 8(b), the MSDs of the middle monomer for chains of different molecular weights are compared. The MSD is divided by to highlight two of the classical power-law regimes predicted by Doi and Edwards [47]. In the passive case, the motion of the middle monomer of chains of and 800 is nearly indistinguishable, up until disengagement time, which depends on the molecular weight . Interestingly, when the activity dominates the dynamics, the MSDs of the middle monomer for all molecular weights nearly overlap across the entire time range. As Pem increases, the chain can escape the tube at a time , which may be shorter than the disengagement time , the Rouse time of the chain (both of which depend on molecular weight), or the Rouse time of an entanglement (which is independent of molecular weight). Depending on the the strength of the activity, this may causes the loss of the corresponding power-law regimes predicted by the tube theory. As long as the power-law regime is observed in the monomeric MSD, the tube is successfully imposing a lateral constraint on the free three-dimensional motion of the chain. However, at high activity levels (Pe) this characteristic power-law disappears, as the chain escapes the tube before . In this case, the tube no longer fully restricts the motion of the chain, and key assumptions of the tube theory, such as the isotropic orientation of new tube segments at the ends, no longer hold [59].
3.2.3 End-to-end relaxation
Relaxation of the end-to-end vector is one of the slowest dynamical processes in linear polymers, and it can be experimentally measured by means of dielectric spectroscopy [84, 85] Here, the end-to-end relaxation is measured through the auto-correlation function of the end-to-end vector, , where the average is taken over all chains and time origins , and results are shown in Fig. 9(a) for chains with molecular weight of and various activities. The passive case exhibits the slowest relaxation, following a nearly single-exponential behavior dominated by the slowest mode, as predicted by the tube theory [47]. As polar activity increases, the chain drift along the tube accelerates, shortening the escape time, which explains that the end-to-end vector relaxes earlier the larger the activity. At higher activity values, the relative contribution of diffusion to reptation along the tube diminishes, causing a much sharper terminal region in the relaxation, as nearly all chains fully relax their orientation at the terminal time dictated by the drift.
To quantify the transition from diffusion-dominated to drift-dominated motion along the primitive path, we fit the end-to-end relaxation to a stretched exponential,
| (11) |
where the fitting parameters (stretching exponent) and (relaxation time) are shown for different molecular weights and activities in Figs. 9(b) and (c), respectively. For the passive case, , and when the activity dominates over reptation, (a comparison between the terminal times, as obtained from the center-of-mass MSD and the end-to-end relaxation, is shown in Fig. S3 of the Supplementary Material). For a single exponential relaxation process, should be equal to 1. In the passive case, since although the end-to-end relaxation is dominated by the first mode, higher odd modes also contribute [47]. As the activity increases, grows to a value greater than 1, indicating a sharper relaxation process, as also shown in Fig. 9(a). The relaxation time remains independent of activity for very small , when the diffusive reptation dominates over the minor drift caused by the activity. When activity overtakes reptation, the terminal time becomes inversely proportional to , consistent with expected scaling arguments [60, 26]. Between Pe and Pe, activity-induced bond alignment (see section 3.1.5) reduces the effective monomeric friction coefficient, enhancing diffusion as shown in Fig. 7(c), and slightly reducing the relaxation time of the end-to-end.
3.2.4 Tube tangent correlation function and tube survival
A central quantity in the development of tube theories is the tube tangent correlation function , which quantifies the correlation between the orientations of different primitive path segments located at positions and along the tube, at different times. In Molecular Dynamics (MD) simulations, directly accessing the primitive path location is challenging, as it requires Primitive Path Analysis, a computationally intensive task if done frequently, and the tangent vectors of the atomistic chain exhibit significant fluctuations. To address this, we define a coarse-grained version of the tangent-tangent correlation function as:
| (12) |
where the coarse-grained tangent vectors are calculated by considering monomers spaced by 4 bonds (any number of bonds is expected to work). This method helps mitigate the fast decorrelation of the bond vectors due to CLF and lateral fluctuations within the tube:
| (13) |
where , is the coarse grained tangent vector at equilibrium, and the average is taken over all the active chains in the system and across all possible time origins.
The primitive path can be viewed as a random walk, meaning that the tube-tangent correlation function at zero lag time corresponds to the equilibrium conformation of the tube and is expected to be nearly delta correlated, i.e. . Due to the slithering motion along the tube, a segment at time may adopt an orientation similar to that of another segment at time . In pure reptation, the initially delta-correlated tangent-tangent function decays slowly by diffusion, while maintaining symmetry around the diagonals and . Understanding the tube tangent correlation function enables the calculation of other critical observables, such as the stress tensor, structure factor, or tube survival function [74]. In this work, we examine the impact of polar activity on the shape and decay of the tube tangent correlation function.
First, we focus on a range of small activities, Pe, where the theory of active reptation holds. In Fig. 10 the tangent-tangent correlation function is shown for at three different activities and various lag-times. At very early times, the function is nearly zero everywhere except along the diagonal. In the passive case (top row in Fig. 10), the function remains symmetric and decays slowly, with maximum values consistently aligned with the diagonal, as predicted by the tube theory. As approaches the terminal time , the function decays to zero. For small activities (bottom rows in Fig. 10), diffusion-like reptation motion dominates at early times, and the tangent-tangent function remains symmetric. However, as time progresses, the function shifts diagonally toward the upper-left corner, and the maximum values are no longer located along the diagonal, breaking the head-tail symmetry. Polar activity induces a systematic drift along the tube, where the orientation of tail segments (position 0 on both axes) at time correlates with head segments (position on both axes) from an earlier time. This occurs because the tail segments at time pass through tube segments previously occupied by the head at time 0. As activity increases, this diagonal shift becomes more pronounced, and the decay of the tangent-tangent function accelerates, indicating that the chain is escaping the tube much faster than by reptation alone.
As discussed in previous sections, when the activity exceeds the range of validity of the active reptation theory, additional effects such as segmental and tube elongation, orientational correlation of tube segments, or bond alignment emerge. This is reflected in the shape of the tube-tangent function, as shown in Fig. 11. The tube conformation is no longer at equilibrium, and the tube-tangent function is not delta-correlated at time 0. exhibits a halo that intensifies as the segment approaches the tail, indicating stronger correlation between segments due to activity-induced tail alignment. Additionally, the values along the diagonal exceed 1, signaling segment elongation with respect to equilibrium. In contrast, head segments remain nearly delta-correlated. As time progresses, the tangent-tangent function decays rapidly as the chain relaxes and loses memory of its previous orientation.
The tube segment survival function is another key component of the tube theory, representing the probability that a segment along the tube has not yet been visited by either end of the chain at time . The function is calculated by integrating the tube-tangent correlation function with respect to either index or , due to the symmetry of the function along the secondary diagonal. In equilibrium, the tube theory predicts that exhibits head-tail symmetry and decays slowly at both ends, since both the head and the tail can destroy the tube through reptation. According to the theory of active reptation [59, 60], the activity-induced drift introduces an asymmetry in , with tube segments being renewed more quickly by the tail than by the head, as well as a much faster decay of the tube survival function. These predictions have been confirmed through single-chain Brownian Dynamics simulations [60] and multichain MD simulations of active chains in a mesh of passive long chains [61], considering CLF. Here, we test whether the predictions hold when the effect of CR is significant. As shown in Fig. 12, at low activity levels, the MD simulation results align with theoretical predictions. As the activity increases, the effects of reptation and CLF diminish, and the decay of is primarily driven by the polar drift motion of the chain along the tube and towards the head. At low values of the activity this results in a sharp decay of the tube survival function at the tail and, as shown in Fig. 12, shifts to the right as time proceeds. At high Pem, due to the stretching of tail segments, exceeds the value 1 at positions near the tail, and these maxima are dampened and shifted to towards the head as chain drifts along the tube.
3.3 Effect of Inertia
In polymer melts at equilibrium, inertia effects are generally negligible, but the introduction of activity may alter this. To better understand the influence of inertia, we conduct additional simulations using Langevin dynamics as in Eq. (4), using a higher friction value to reduce the eventual relevance of inertia.
We first estimate the effective equilibrium monomer friction , which may differ from the input friction coefficient specified in Eq. (4). While and should be equivalent in dilute systems, collisions between nearby monomers in dense systems can alter the effective friction. Long simulations for chains are conducted, and the diffusion coefficient is measured via the center of mass MSD; values are shown in Table 1. Although chains of this length have only 3-4 entanglements, we estimate the monomeric friction coefficient using the Rouse expression . Acknowledging that this approach may slightly overestimate friction due to the presence of entanglements, the results in Table 1 suggest that the effective monomer friction increases roughly five times less than the input friction , likely due to increased monomer collisions at lower values.
| 0.5 | 5.5e-4 | 9.1 |
|---|---|---|
| 20 | 7.2e-5 | 69.4 |
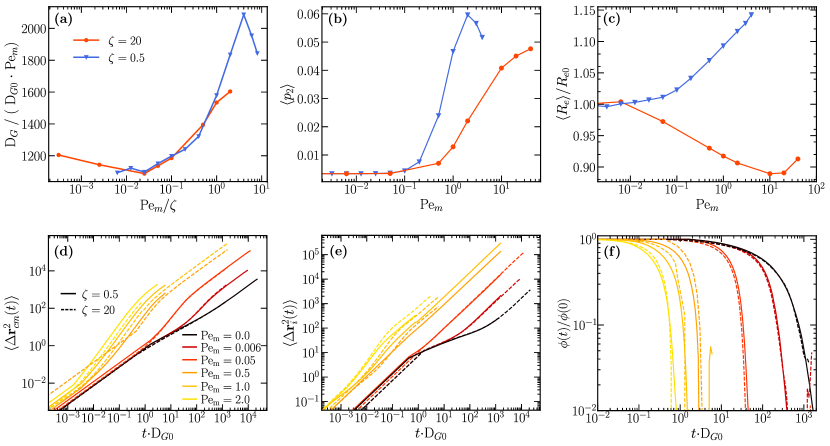
When polar activity dominates, according to theoretical predictions [59], the diffusion coefficient should be proportional to the drift velocity along the primitive path, , which is inversely proportional to the monomeric friction coefficient . Therefore, in the presence of activity, the ratio of the diffusion coefficients should be inversely proportional to the ratio of the monomeric frictions. Fig. 13(a) shows the diffusion coefficient , normalized by its equilibrium value and the activity, plotted against Pem scaled by . Both curves agree at low activities, supporting the proportionality between and Pem [59]. At high activities, both curves exhibit a similar upturn, likely due to activity-induced bond alignment (see Sec. 3.1.5). Fig. 13(b) compares bond alignment for both frictions, showing a qualitatively similar increase in both cases, although alignment occurs at a higher activities as increases.
The evaluation of coil size as a function of of Pem is shown in Fig. 13(c) for the two investigated values of , revealing notable qualitative differences. For higher friction, coil size decreases with Pem, consistent with recent results obtained for the same system [41]. In contrast, for lower friction, chains expand monotonically with activity, as discussed in Sec. 3.1.1. Similar to the behavior observed in dilute chains [26], coil size shows a clear upturn at activities beyond Pe, where chain size trends change. In simulations with smaller friction, coil size does not initially decrease, but instead increases at activities above Pe
To evaluate the impact of friction on system dynamics, Figs. 13(d), (e) and (f) show the mean-square displacements of the center-of-mass and middle monomer, as well as the end-to-end vector relaxation, respectively, all plotted against time normalized by , the time required for the chain to move a distance on the order of the bead size at equilibrium. Dynamic properties are nearly independent of , showing that both systems exhibit similar behavior, with differences emerging primarily from time shifts based on . Discrepancies appear only at high Pem, where bond alignment becomes more pronounced at lower friction, reducing the effective monomeric friction and thereby enhancing relaxation and diffusion. Bond deformation due to activity, as shown in Fig. S5 of the Supplementary Material is also notable: bonds deform significantly at Pe for and Pe for . Thus, at high Pem, our results should be interpreted with caution, as the uncrossability of the chains might be compromised. However, the extent of bond stretching (10%) remains limited enough to preserve the validity of our results at high Pem.
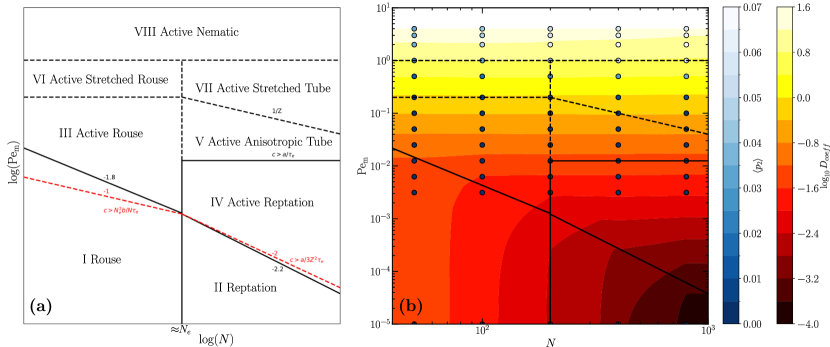
3.4 Phase Diagram
The complex dynamical and conformational behavior of active polar polymer chains in the melt can be summarized in the phase diagram shown schematically in Fig. 14(a), and particularized for the Kremer-Grest model in Fig. 14(b). The diagram is expressed as a function of molecular weight and Péclet number Pem. In this diagram, eight distinct regions can be identified, considering the relative effects of molecular weight, entanglement, activity, anisotropy, chain and tube stretching, and bond alignment. The transitions between adjacent regions are not sharp and may occur over a broad crossover; however, points well within each region should exhibit representative behavior characteristic of that region. Using the scaling behaviors previously discussed, the positions of each boundary line separating the regions are determined as follows:
-
1.
The vertical line at delineates the boundary between unentangled (region I) and entangled (region II) chains. This transition is typically observed at 2-4 times . This line is continuous up to , where is the drift velocity along the primitive path imparted by the tangent polar activity (which is proportional to Pem) [59]. Beyond this line, the assumptions of the tube theory no longer apply, and at even higher activities, it becomes uncertain whether surrounding chains continue to constrain the probe chain.
-
2.
The line separating reptation (II) from active reptation (IV) follows from theoretical predictions [59], which indicate a critical activity that scales as , where is the number of entanglements. Above this threshold, the activity-induced drift dominates over the diffusive reptation motion. In our simulation results, we identify the threshold when the activity-enhanced diffusion coefficient is 1.5 greater than the equilibrium value due to pure reptation and CLF (see Fig. 7). The resulting slope is -2.2, rather than the predicted -2, likely due to the influence of CLF on diffusion.
-
3.
The limit of validity of the active reptation theory separates regions IV and V and is reached when , a condition that is independent of molecular weight. When the drift velocity surpasses , new tube segments are created by the head without permitting the exploration of all possible orientations. Beyond this threshold, the isotropy of newly created tube segments can no longer be assured, leading to correlated orientation among tube segments (see Fig. 5).
-
4.
The line separating the Rouse regime(I) from the Active Rouse regime (III) can be determined by comparing the time it takes for the tail monomer to drift over the whole chain contour () with the Rouse time for a chain of molecular weight , . When , the activity dominates over Rouse relaxation, which translates to . This line intersects both the boundary between unentangled (I) and entangled (II) polymers and the boundary separating pure reptation (II) from active reptation (IV) at a single point. The slope of this line is -1.8 rather than -1, attributed to the dependence of the diffusion coefficient on molecular weight in simulations of unentangled polymers (see Section 3.2.1).
-
5.
As discussed in section 3.1.3, high activity levels may cause tube stretching. The line separating active anisotropic reptation (V) from the active stretched tube (VII) can be derived from Fig. 4 by establishing a threshold elongation of the tube at 10%. The global Péclet number corresponding to this relative elongation of the tube is Pe. Consequently, this leads to the relationship Pe.
-
6.
Similarly, there is a critical activity above which unentangled chains also experience elongation (region IV). The limiting Péclet number corresponding to this transition can be extracted from Fig. 2 as Pe. This transition line is likely dependent on molecular weight and should intersect the line separating unentangled (I) from entangled (III) chains, as well as the line that separating anisotropic (V) from stretched (VII) tube at a single point.
-
7.
The line separating regions VI and VII from region VIII is independent of molecular weight and can be extracted from Fig. 6. In region VIII, the activity induces nematic bond alignment.
In Fig. 14(b), the diffusion coefficient (depicted as a background color field) and the mean value of the nematic order parameter (represented by the intensity of the colored symbols, ranging from black to white) are presented to support the description in terms of a phase diagram. For instance, the color bands are vertical in regions I and II, indicating that the diffusion coefficient depends solely on the molecular weight of the polymer. However, this bands become horizontal in the rest of the phase diagram, reflecting the dependence of diffusion on activity. The nematic order is nearly negligible below the line Pem=1, and it becomes maximum at the top of the diagram. Other quantities examined in this work, such as chain stretch and orientation correlation, exhibit distinct behaviors accross different regions of the phase diagram.
4 Summary and Conclusions
In this work, we investigated the effect of tangent polar activity on the conformational and dynamical behavior of linear polymer melts through Langevin dynamics, using the Kremer-Grest model. The fact that all chains in the system are active allows us to explore the effects of constraint release (CR), which were not explored in our previous work [61]. The main findings of our study can be summarized as follows:
-
1.
The overall polymer conformation, as represented by the end-to-end vector, is slightly stretched due to the activity, which contrasts with the trend observed for the same active model in dilute conditions [26]. Simulations using a higher friction coefficient also show a more compact structure, in accordance to recent results [41]. This difference can therefore be attributed to inertia effects, which become significant at high activity levels.
-
2.
The change in conformation shows a universal behavior across different molecular weights when plotted as a function of the global Péclet number, up to a high threshold activity, where deviations begin to occur.
-
3.
Similar to dilute chains, the deformation is not homogeneous along the chain contour, with heads being more compact and tails more elongated, though different molecular weights do not follow a universal trend.
-
4.
The entanglement network remains unperturbed up to a threshold Pe, beyond which, orientational correlation between entanglements appear, and the primitive path becomes elongated.
-
5.
Above Pe, activity-induced bond alignment is observed, growing to a maximum at Pe and decays at larger activity levels. Large dynamic clusters of aligned bonds emerge within the system, but rapid fluctuations prevent phase separation.
-
6.
The monomeric and center-of-mass diffusion can be well described by the theory of active reptation up to a limiting activity of Pe, beyond which the assumptions of reptation no longer apply.
-
7.
In the range of validity of the theory, the center of mass MSD shows superdiffusive behavior, with the diffusion coefficient becoming independent of molecular weight and scaling linearly with Pem. At higher activity, the diffusion coefficient grows more rapidly due to bond alignment, which reduces friction. As in dilute chains, the center of mass MSD can be described accurately by the equation proposed for the MSD of ABPs.
-
8.
Polar activity breaks the dynamical symmetry between the head and tail, with the head monomer becoming the slowest, while the tail becomes the fastest monomer of the chain. At high activities, the monomeric MSD also shows a superdiffusive regime.
-
9.
As activity increases, the end-to-end relaxation occurs more rapidly, and the decay becomes shaper, with the relaxation time scaling as Pem.
-
10.
The tube tangent correlation function and tube survival function align with the predictions of the active reptation theory up to Pe. At higher activities, the stretching and orientation correlation of the tube segments cause the simulation results to diverge from the theoretical predictions.
-
11.
The overall complex dynamical and conformational behaviour can be summarized in a phase diagram as a function of Pem and .
Our work contributes to the development of a robust theoretical framework to investigate the dynamics of active polar polymers, which will be invaluable for advancing both experimental research and theoretical models in the field. The findings of this study can serve as a foundation for exploring active biomolecules and guiding the design of new macromolecular materials with enriched and enhanced dynamical properties.
Acknowledgements
The authors acknowledge funding from the Spanish Ministry of Economy and Competitivity (PID2019-105898GA-C22 and PID2022-136919NB-C32) and the Madrid Government (Comunidad de Madrid-Spain) under the Multiannual Agreement with Universidad Politécnica de Madrid in the line Excellence Programme for University Professors, in the context of the V PRICIT (Regional Programme of Research and Technological Innovation). A.R.T. acknowledges funding from EMBO scientific exchange grants and EBSA bursary. The authors gratefully acknowledge the Universidad Politécnica de Madrid (www.upm.es) for providing computing resources on Magerit Supercomputer. The authors gratefully acknowledge the computing time granted by the JARA Vergabegremium and provided on the JARA Partition part of the supercomputer JURECA at Forschungszentrum Jülich [86].
References
- [1] C. Bechinger, R. Di Leonardo, H. Löwen, C. Reichhardt, G. Volpe, G. Volpe, Active particles in complex and crowded environments, Rev. Mod. Phys. 88 (4) (2016) 045006.
- [2] G. Gompper, R. G. Winkler, T. Speck, A. Solon, C. Nardini, F. Peruani, H. Löwen, R. Golestanian, U. B. Kaupp, L. Alvarez, et al., The 2020 motile active matter roadmap, Journal of Physics: Condensed Matter 32 (19) (2020) 193001.
- [3] S. Roca-Bonet, M. Wagner, M. Ripoll, Clustering of self-thermophilic asymmetric dimers: the relevance of hydrodynamics, Soft Matter (2022). doi:https://doi.org/10.1039/D2SM00523A.
- [4] A. Zöttl, H. Stark, Emergent behavior in active colloids, Journal of Physics: Condensed Matter 28 (25) (2016) 253001.
- [5] R. S. Negi, R. G. Winkler, G. Gompper, Emergent collective behavior of active brownian particles with visual perception, Soft Matter 18 (33) (2022) 6167–6178.
- [6] M. F. Hagan, A. Baskaran, Emergent self-organization in active materials, Current opinion in cell biology 38 (2016) 74–80.
-
[7]
T. Vicsek, A. Zafeiris,
Collective motion,
Physics Reports 517 (3-4) (2012) 71–140.
doi:10.1016/j.physrep.2012.03.004.
URL https://doi.org/10.1016%2Fj.physrep.2012.03.004 - [8] A. Yildiz, M. Tomishige, R. D. Vale, P. R. Selvin, Kinesin walks hand-over-hand, Science 303 (5658) (2004) 676–678.
- [9] T. Butt, T. Mufti, A. Humayun, P. B. Rosenthal, S. Khan, S. Khan, J. E. Molloy, Myosin motors drive long range alignment of actin filaments 2, Journal of Biological Chemistry 285 (7) (2010) 4964–4974.
-
[10]
P. Xu, S. Duan, Z. Xiao, Z. Yang, W. Wang,
Light-powered active colloids
from monodisperse and highly tunable microspheres with a thin
shell, Soft Matter 16 (26) (2020) 6082–6090.
doi:10.1039/d0sm00719f.
URL https://doi.org/10.1039%2Fd0sm00719f - [11] A. Ghosh, P. Fischer, Controlled Propulsion of Artificial Magnetic Nanostructured Propellers, Nano Lett. 9 (6) (2009) 2243–2245. doi:10.1021/nl900186w.
- [12] H.-R. Jiang, N. Yoshinaga, M. Sano, Active Motion of a Janus Particle by Self-Thermophoresis in a Defocused Laser Beam, Phys. Rev. Lett. 105 (26) (2010) 268302. doi:10.1103/PhysRevLett.105.268302.
- [13] R. G. Winkler, G. Gompper, The physics of active polymers and filaments, The Journal of Chemical Physics 153 (4) (2020) 040901.
- [14] D. Nishiguchi, J. Iwasawa, H.-R. Jiang, M. Sano, Flagellar dynamics of chains of active Janus particles fueled by an AC electric field, New J. Phys. 20 (1) (2018) 015002. doi:10.1088/1367-2630/aa9b48.
- [15] G. Duclos, R. Adkins, D. Banerjee, M. S. E. Peterson, M. Varghese, I. Kolvin, A. Baskaran, R. A. Pelcovits, T. R. Powers, A. Baskaran, F. Toschi, M. F. Hagan, S. J. Streichan, V. Vitelli, D. A. Beller, Z. Dogic, Topological structure and dynamics of three-dimensional active nematics, Science 367 (2020) 1120–1124. doi:10.1126/science.aaz4547.
- [16] G. A. Vliegenthart, A. Ravichandran, M. Ripoll, T. Auth, G. Gompper, Filamentous active matter: Band formation, bending, buckling, and defects, Science advances 6 (30) (2020) eaaw9975. doi:10.1126/sciadv.aaw997.
- [17] F. Martinez-Pedrero, A. Ortiz-Ambriz, I. Pagonabarraga, P. Tierno, Colloidal Microworms Propelling via a Cooperative Hydrodynamic Conveyor Belt, Phys. Rev. Lett. 115 (13) (2015) 138301. doi:10.1103/PhysRevLett.115.138301.
- [18] S. Jaiswal, M. Ripoll, S. Thakur, Diffusiophoretic Brownian Dynamics: Characterization of Hydrodynamic Effects for an Active Chemoattractive Polymer, Macromolecules 57 (15) (2024) 6968–6978. doi:10.1021/acs.macromol.4c00720.
- [19] F. J. Nédélec, T. Surrey, A. C. Maggs, S. Leibler, Self-organization of microtubules and motors, Nature 389 (6648) (1997) 305–308. doi:10.1038/38532.
- [20] N. Hirokawa, Y. Noda, Y. Tanaka, S. Niwa, Kinesin superfamily motor proteins and intracellular transport, Nature reviews Molecular cell biology 10 (10) (2009) 682–696.
- [21] V. Schaller, C. Weber, C. Semmrich, E. Frey, A. R. Bausch, Polar patterns of driven filaments, Nature 467 (7311) (2010) 73–77.
- [22] C. A. Philipps, G. Gompper, R. G. Winkler, Tangentially driven active polar linear polymers-an analytical study, The Journal of Chemical Physics (2022).
- [23] S. Brahmachari, T. Markovich, F. C. MacKintosh, J. N. Onuchic, Temporally Correlated Active Forces Drive Segregation and Enhanced Dynamics in Chromosome Polymers, PRX Life 2 (3) (2024) 033003. doi:10.1103/PRXLife.2.033003.
- [24] A. Goychuk, D. Kannan, A. K. Chakraborty, M. Kardar, Polymer folding through active processes recreates features of genome organization, Proceedings of the National Academy of Sciences 120 (20) (2023) e2221726120. doi:10.1073/pnas.2221726120.
- [25] S. K. Anand, S. P. Singh, Conformation and dynamics of a self-avoiding active flexible polymer, Physical Review E 101 (3) (2020) 030501.
- [26] A. R. Tejedor, J. Ramírez, M. Ripoll, Progressive polymer deformation induced by polar activity and the influence of inertia, Phys. Rev. Research 6 (3) (2024) L032002. doi:10.1103/PhysRevResearch.6.L032002.
- [27] A. Martín-Gómez, D. Levis, A. Díaz-Guilera, I. Pagonabarraga, Collective motion of active Brownian particles with polar alignment, Soft Matter 14 (14) (2018) 2610–2618. doi:10.1039/C8SM00020D.
- [28] V. Bianco, E. Locatelli, P. Malgaretti, Globulelike conformation and enhanced diffusion of active polymers, Physical Review Letters 121 (21) (2018).
- [29] S. K. Anand, S. P. Singh, Structure and dynamics of a self-propelled semiflexible filament, Physical Review E 98 (4) (2018) 042501.
- [30] S. Kumar, S. Thakur, Local Polar and Long-Range Isotropic Activity Assisted Swelling and Collapse Dynamics of an Active Ring Polymer, Macromolecules 56 (14) (2023) 5229–5236. doi:10.1021/acs.macromol.3c00384.
- [31] A. Lamura, Excluded volume effects on tangentially driven active ring polymers, Phys. Rev. E 109 (5) (2024) 054611. doi:10.1103/PhysRevE.109.054611.
- [32] C. A. Philipps, G. Gompper, R. G. Winkler, Dynamics of active polar ring polymers, Physical Review E 105 (6) (2022) L062501.
- [33] L. van Steijn, M. Fazelzadeh, S. Jabbari-Farouji, Conformation and dynamics of wet tangentially-driven active filaments (2024). arXiv:2407.17602, doi:10.48550/arXiv.2407.17602.
- [34] A. Martín-Gómez, G. Gompper, R. G. Winkler, Active brownian filamentous polymers under shear flow, Polymers 10 (8) (2018) 837.
- [35] M. Vatin, S. Kundu, E. Locatelli, Conformation and dynamics of partially active linear polymers, Soft Matter 20 (8) (2024) 1892–1904. doi:10.1039/D3SM01162C.
- [36] M. Fazelzadeh, E. Irani, Z. Mokhtari, S. Jabbari-Farouji, Effects of inertia on conformation and dynamics of tangentially driven active filaments, Physical Review E 108 (2) (2023) 024606.
- [37] M. S. E. Peterson, M. F. Hagan, A. Baskaran, Statistical properties of a tangentially driven active filament, J. Stat. Mech. 2020 (1) (2020) 013216. doi:10.1088/1742-5468/ab6097.
- [38] J. R. Howse, R. A. Jones, A. J. Ryan, T. Gough, R. Vafabakhsh, R. Golestanian, Self-motile colloidal particles: from directed propulsion to random walk, Physical review letters 99 (4) (2007) 048102.
- [39] R. E. Isele-Holder, J. Elgeti, G. Gompper, Self-propelled worm-like filaments: spontaneous spiral formation, structure, and dynamics, Soft matter 11 (36) (2015) 7181–7190.
- [40] Ö. Duman, R. E. Isele-Holder, J. Elgeti, G. Gompper, Collective dynamics of self-propelled semiflexible filaments, Soft matter 14 (22) (2018) 4483–4494.
- [41] M. A. Ubertini, E. Locatelli, A. Rosa, Universal Time and Length Scales of Polar Active Polymer Melts, ACS Macro Lett. (2024) 1204–1210doi:10.1021/acsmacrolett.4c00423.
- [42] J. P. Miranda, E. Locatelli, C. Valeriani, Self-Organized States from Solutions of Active Ring Polymers in Bulk and under Confinement, J. Chem. Theory Comput. 20 (4) (2024) 1636–1645. doi:10.1021/acs.jctc.3c00818.
- [43] S. F. Edwards, Statistical mechanics with topological constraints: I, Proceedings of the Physical Society 91 (3) (1967) 513.
- [44] H. Watanabe, Viscoelasticity and dynamics of entangled polymers, Progress in Polymer Science 24 (9) (1999) 1253–1403.
- [45] T. McLeish, Tube theory of entangled polymer dynamics, Advances in physics 51 (6) (2002) 1379–1527.
- [46] M. Rubinstein, R. H. Colby, Polymer Physics, Oxford University Press, Oxford, New York, 2003.
- [47] M. Doi, S. F. Edwards, S. F. Edwards, The theory of polymer dynamics, Vol. 73, oxford university press, 1988.
- [48] M. Doi, Explanation for the 3.4-power law for viscosity of polymeric liquids on the basis of the tube model, Journal of Polymer Science: Polymer Physics Edition 21 (5) (1983) 667–684.
- [49] S. T. Milner, T. McLeish, Reptation and Contour-Length Fluctuations in Melts of Linear Polymers, Physical Review Letters 81 (3) (1998) 725–728. doi:10.1103/physrevlett.81.725.
- [50] M. Rubinstein, R. H. Colby, Self-consistent theory of polydisperse entangled polymers: Linear viscoelasticity of binary blends, The Journal of chemical physics 89 (8) (1988) 5291–5306.
- [51] S. T. Milner, T. C. B. McLeish, A. E. Likhtman, Microscopic theory of convective constraint release, Journal of Rheology 45 (2) (2001) 539.
- [52] G. Marrucci, Relaxation by reptation and tube enlargement: A model for polydisperse polymers, J. Polym. Sci. Polym. Phys. Ed. 23 (1) (1985) 159–177. doi:10.1002/pol.1985.180230115.
- [53] S. T. Milner, T. C. B. McLeish, Parameter-Free Theory for Stress Relaxation in Star Polymer Melts, Macromolecules 30 (7) (1997) 2159–2166. doi:10.1021/ma961559f.
- [54] A. E. Likhtman, T. C. McLeish, Quantitative theory for linear dynamics of linear entangled polymers, Macromolecules 35 (16) (2002) 6332–6343.
- [55] H. Watanabe, S. Ishida, Y. Matsumiya, T. Inoue, Viscoelastic and Dielectric Behavior of Entangled Blends of Linear Polyisoprenes Having Widely Separated Molecular Weights: Test of Tube Dilation Picture, Macromolecules 37 (5) (2004) 1937–1951. doi:10.1021/ma030443y.
- [56] H. Watanabe, Y. Matsumiya, T. Inoue, Dielectric and Viscoelastic Relaxation of Highly Entangled Star Polyisoprene: Quantitative Test of Tube Dilation Model, Macromolecules 35 (6) (2002) 2339–2357. doi:10.1021/ma011782z.
- [57] M. Zamponi, A. Wischnewski, M. Monkenbusch, L. Willner, D. Richter, A. E. Likhtman, G. Kali, B. Farago, Molecular Observation of Constraint Release in Polymer Melts, Phys. Rev. Lett. 96 (23) (2006) 238302. doi:10.1103/PhysRevLett.96.238302.
- [58] D. Auhl, J. Ramirez, A. E. Likhtman, P. Chambon, C. Fernyhough, Linear and nonlinear shear flow behavior of monodisperse polyisoprene melts with a large range of molecular weights, Journal of Rheology 52 (3) (2008) 801–835. doi:10.1122/1.2890780.
- [59] A. R. Tejedor, J. Ramírez, Reptation of active entangled polymers, Macromolecules 52 (22) (2019) 8788–8792.
- [60] A. R. Tejedor, J. Ramírez, Dynamics of entangled polymers subjected to reptation and drift, Soft matter 16 (12) (2020) 3154–3168.
- [61] A. R. Tejedor, R. Carracedo, J. Ramírez, Molecular dynamics simulations of active entangled polymers reptating through a passive mesh, Polymer 268 (2023) 125677. doi:10.1016/j.polymer.2023.125677.
- [62] Z. Wang, R. G. Larson, Constraint release in entangled binary blends of linear polymers: A molecular dynamics study, Macromolecules 41 (13) (2008) 4945–4960.
- [63] K. Kremer, G. S. Grest, Dynamics of entangled linear polymer melts: A molecular-dynamics simulation, The Journal of Chemical Physics 92 (8) (1990) 5057–5086.
- [64] J. D. Weeks, D. Chandler, H. C. Andersen, Role of repulsive forces in determining the equilibrium structure of simple liquids, The Journal of chemical physics 54 (12) (1971) 5237–5247.
- [65] R. B. Bird, C. F. Curtiss, R. C. Armstrong, O. Hassager, Dynamics of polymeric liquids, volume 2: Kinetic theory, Wiley, 1987.
- [66] H. C. Öttinger, Stochastic Processes in Polymeric Fluids: Tools and Examples for Developing Simulation Algorithms, Springer Berlin Heidelberg, Berlin, Heidelberg, 1996.
- [67] N. G. Van Kampen, Stochastic processes in physics and chemistry, Vol. 1, Elsevier, 1992.
- [68] A. P. Thompson, H. M. Aktulga, R. Berger, D. S. Bolintineanu, W. M. Brown, P. S. Crozier, P. J. in ’t Veld, A. Kohlmeyer, S. G. Moore, T. D. Nguyen, R. Shan, M. J. Stevens, J. Tranchida, C. Trott, S. J. Plimpton, LAMMPS - a flexible simulation tool for particle-based materials modeling at the atomic, meso, and continuum scales, Comp. Phys. Comm. 271 (2022) 108171. doi:10.1016/j.cpc.2021.108171.
- [69] Y. R. Sliozberg, J. W. Andzelm, Fast protocol for equilibration of entangled and branched polymer chains, Chemical Physics Letters 523 (2012) 139–143.
- [70] S. K. Sukumaran, G. S. Grest, K. Kremer, R. Everaers, Identifying the primitive path mesh in entangled polymer liquids, Journal of Polymer Science Part B: Polymer Physics 43 (8) (2005) 917–933.
- [71] R. Everaers, S. K. Sukumaran, G. S. Grest, C. Svaneborg, A. Sivasubramanian, K. Kremer, Rheology and microscopic topology of entangled polymeric liquids, Science 303 (5659) (2004) 823–826.
- [72] K. Hagita, T. Murashima, Effect of chain-penetration on ring shape for mixtures of rings and linear polymers, Polymer 218 (2021) 123493. doi:10.1016/j.polymer.2021.123493.
- [73] A. E. Likhtman, S. K. Sukumaran, J. Ramirez, Linear viscoelasticity from molecular dynamics simulation of entangled polymers, Macromolecules 40 (18) (2007) 6748–6757.
- [74] R. S. Graham, A. E. Likhtman, T. C. B. McLeish, S. T. Milner, Microscopic theory of linear, entangled polymer chains under rapid deformation including chain stretch and convective constraint release, Journal of Rheology 47 (5) (2003) 1171–1200. doi:10.1122/1.1595099.
- [75] I. C. Gârlea, O. Dammone, J. Alvarado, V. Notenboom, Y. Jia, G. H. Koenderink, D. G. A. L. Aarts, M. P. Lettinga, B. M. Mulder, Colloidal liquid crystals confined to synthetic tactoids. https://doi.org/10.1038/s41598-019-56729-9, Sci. Rep. 9 (2019) 20391. doi:https://doi.org/10.1038/s41598-019-56729-9.
- [76] A. Kuhnhold, P. van der Schoot, Structure of nematic tactoids of hard rods, J. Chem. Phys. 156 (2022) 104501. doi:https://doi.org/10.1063/5.0078056.
- [77] C. Huepe, M. Aldana, Intermittency and Clustering in a System of Self-Driven Particles, Phys. Rev. Lett. 92 (16) (2004) 168701. doi:10.1103/PhysRevLett.92.168701.
- [78] D. Levis, L. Berthier, Clustering and heterogeneous dynamics in a kinetic Monte Carlo model of self-propelled hard disks, Phys. Rev. E 89 (6) (2014) 062301. doi:10.1103/PhysRevE.89.062301.
- [79] F. Peruani, A. Deutsch, M. Bär, Nonequilibrium clustering of self-propelled rods, Phys. Rev. E 74 (3) (2006) 030904. doi:10.1103/PhysRevE.74.030904.
- [80] J. Ramírez, S. K. Sukumaran, B. Vorselaars, A. E. Likhtman, Efficient on the fly calculation of time correlation functions in computer simulations, The Journal of chemical physics 133 (15) (2010) 154103.
- [81] W. Li, P. K. Jana, A. F. Behbahani, G. Kritikos, L. Schneider, P. Polińska, C. Burkhart, V. A. Harmandaris, M. Müller, M. Doxastakis, Dynamics of Long Entangled Polyisoprene Melts via Multiscale Modeling, Macromolecules 54 (18) (2021) 8693–8713. doi:10.1021/acs.macromol.1c01376.
- [82] C. B. Gell, W. W. Graessley, L. J. Fetters, Viscoelasticity and self-diffusion in melts of entangled linear polymers, J. Polym. Sci. B Polym. Phys. 35 (12) (1997) 1933–1942. doi:10.1002/(SICI)1099-0488(19970915)35:12<1933::AID-POLB8>3.0.CO;2-Q.
- [83] E. Van Ruymbeke, Y. Masubuchi, H. Watanabe, Effective Value of the Dynamic Dilution Exponent in Bidisperse Linear Polymers: From 1 to 4/3, Macromolecules 45 (4) (2012) 2085–2098. doi:10.1021/ma202167q.
- [84] H. Watanabe, O. Urakawa, T. Kotaka, Slow dielectric relaxation of entangled linear cis-polyisoprenes with asymmetrically inverted dipoles. 2. behavior in a short matrix, Macromolecules 27 (13) (1994) 3525–3536.
- [85] H. Watanabe, Y. Matsumiya, T. Inoue, Dielectric and viscoelastic study of entanglement dynamics: A review of recent findings, Macromolecular Symposia 228 (1) (2005) 51–70.
- [86] J. S. Centre, Journal of large-scale research facilities 7 (2018) A182. doi:10.17815/jlsrf-7-182.