A Multi-Label EEG Dataset for Mental Attention State Classification in Online Learning
††thanks: #Equal contribution.
††thanks: *Corresponding author.
Abstract
Attention is a vital cognitive process in the learning and memory environment, particularly in the context of online learning. Traditional methods for classifying attention states of online learners based on behavioral signals are prone to distortion, leading to increased interest in using electroencephalography (EEG) signals for authentic and accurate assessment. However, the field of attention state classification based on EEG signals in online learning faces challenges, including the scarcity of publicly available datasets, the lack of standardized data collection paradigms, and the requirement to consider the interplay between attention and other psychological states. In light of this, we present the Multi-label EEG dataset for classifying Mental Attention states (MEMA) in online learning. We meticulously designed a reliable and standard experimental paradigm with three attention states: neutral, relaxing, and concentrating, considering human physiological and psychological characteristics. This paradigm collected EEG signals from 20 subjects, each participating in 12 trials, resulting in 1,060 minutes of data. Emotional state labels, basic personal information, and personality traits were also collected to investigate the relationship between attention and other psychological states. Extensive quantitative and qualitative analysis, including a multi-label correlation study, validated the quality of the EEG attention data. The MEMA dataset and analysis provide valuable insights for advancing research on attention in online learning. The dataset is publicly available at https://github.com/GuanjianLiu/MEMA.
Index Terms:
EEG dataset, Attention classification, Multi-label, Data validationI Introduction
Attention refers to the ability to focus on task-related information stimuli for a relatively long period of time while consciously attempting to ignore other stimuli [1]. It is essentially governed by three networks in the brain: alertness, orientation, and execution [2]. Attention is closely related to a learner’s education quality as a crucial cognitive process in the learning and memory environment. With the rise of online learning, the online learning environment, characterized by a massive number of learners online simultaneously and a lack of supervisors, contrasts sharply with traditional offline learning scenarios. This has made the need for automated assessment of learners’ states more urgent and has also drawn increased research focus to this area.
Traditional methods for classifying the attention states of online learners are based on behavioral signals observed in online videos, including speech, facial expressions, gestures, and body movements [3, 4]. Although these methods can somewhat reflect the learners’ attention states, they are easily influenced by their subjective actions, allowing for the possibility of deliberately deceiving the classification algorithms through active disguises. On the contrary, the classification of online learners’ attention states based on electroencephalography (EEG), a physiological signal, has garnered widespread attention due to its authenticity. Meanwhile, EEG has a high temporal resolution by directly measuring brain activity and has been proven to accurately reflect changes in attention states [5]. With the increasing portability and affordability of EEG devices, the prospects of employing EEG to monitor learners’ attention in online learning scenarios are becoming increasingly promising.
Despite some progress, the field of EEG-based attention state classification in online learning still faces several challenges. Firstly, a significant drawback is the scarcity of publicly available datasets, and those that are available often suffer from inadequate data quality validation. This deficiency severely hampers the reproducibility and comparability of research in the field [6, 7]. Secondly, the lack of standardized or uniform data collection paradigms and arbitrary processes further compounds the challenge. Various stages lack the incorporation of pertinent psychological and physiological knowledge, such as the selection of collection times, the design of collection processes, and the formulation of experimental tasks [8, 9]. Consequently, adhering to a consistent collection paradigm becomes difficult. Thirdly, research about learners’ attention is often overly simplistic and idealized, leading to limited data, labels, and gathered information. It is worth noting that attention is closely intertwined with other psychological states, such as emotional states [10].
The above discussion indicates that this field is still hungry for fundamental data construction research. In light of this, we propose a Multi-label EEG dataset for classifying Mental Attention states (MEMA) in the context of online learning. Specifically, we have meticulously designed a reliable paradigm with three distinct attention states: neutral, relaxing, and concentrating. The details of the paradigm, such as task and duration for each state, have been carefully established, considering human physiological and psychological characteristics to ensure standardization and rationality throughout. Employing this paradigm, we gather EEG signals from a cohort of 20 subjects, each participating in 12 trials, resulting in a total of 1,060 minutes of data. Additionally, to investigate the relationship between attention and other psychological states, we collect emotional state labels [11, 12], basic personal information, and subjects’ personality traits. Furthermore, we conducted extensive quantitative and qualitative analysis involving a multi-label correlation study to validate the quality of the EEG attention data.
The contributions of this study are as follows:
-
•
We have made a fundamental research achievement by constructing a multi-label EEG dataset for classifying mental attention states in the context of online learning.
-
•
We meticulously designed a reliable and standardized paradigm tailored for attention, integrating physiological and psychological principles, acquiring EEG signals from 20 subjects for more than 1,000 minutes.
-
•
We validated the quality of the EEG attention data through extensive quantitative and qualitative analysis, including a multi-label correlation study. The baseline algorithms achieved accuracy rates of up to 85.12% and 64.84% for subject-dependent and cross-subject attention state classification tasks, respectively.
II Related Work
There are already some constructed datasets in the field of EEG-based attention state classification. The creators design various tasks for different attention states, tailored to specific scenarios, to facilitate the collection of EEG signals. For example, Alirezaei et al. [9] design two types of tasks for attention and non-attention states specifically tailored for mental arithmetic scenarios. The task require subjects to perform simple mental arithmetic operations on numbers displayed in random order and different colors on a monitor. Ghasemay et al. [7] focus on sustained auditory attention in students with visual impairment. The experiment is divided into auditory focused stage and auditory inattentive stage, both recorded with open and closed eyes. During the auditory focused stage, each subject is only asked to focus on listening to the lecture. At the end of the stage, subjects are asked if they can maintain focus during the lecture.
Similarly, some studies construct datasets specifically for online learning scenarios. For example, Aggarwal et al. [13] collect EEG data from subjects going through a short lecture in both Massive Open Online Courses (MOOC)/e-learning environments and traditional classroom settings. This allows them to assess the attention levels of learners in MOOC environments and compare these with those in conventional classroom learning using brain signals. Gupta et al. [6] collect EEG data from students while watching online course videos, aiming to measure attention levels by analyzing brain activity, with the goal of enhancing the overall learning experience for users. Ni et al. [14] focus on assessing attention states in mobile learning scenarios within online learning contexts. Researchers aim to explore differences in student attention across various learning media (text, text + graphic, and video) and different learning styles (active and reflective learners). These datasets are not publicly available, except for the last one, which claims that it can be obtained by contacting the author if needed.
In summary, there are currently few EEG datasets for attention in online learning, and they are not publicly available. Additionally, these datasets often suffer from various issues such as non-standardized collection paradigms, lack of data quality validation, and simplistic labeling systems and information. Therefore, our work is committed to addressing these issues by providing a publicly available and high-quality multi-label EEG dataset for classifying mental attention states in the context of online learning.
III Data Acquisition Paradigm
This section introduces the data acquisition paradigm, including the collection procedure, task design, and multi-label information collection.
III-A Overall Collection Procedure
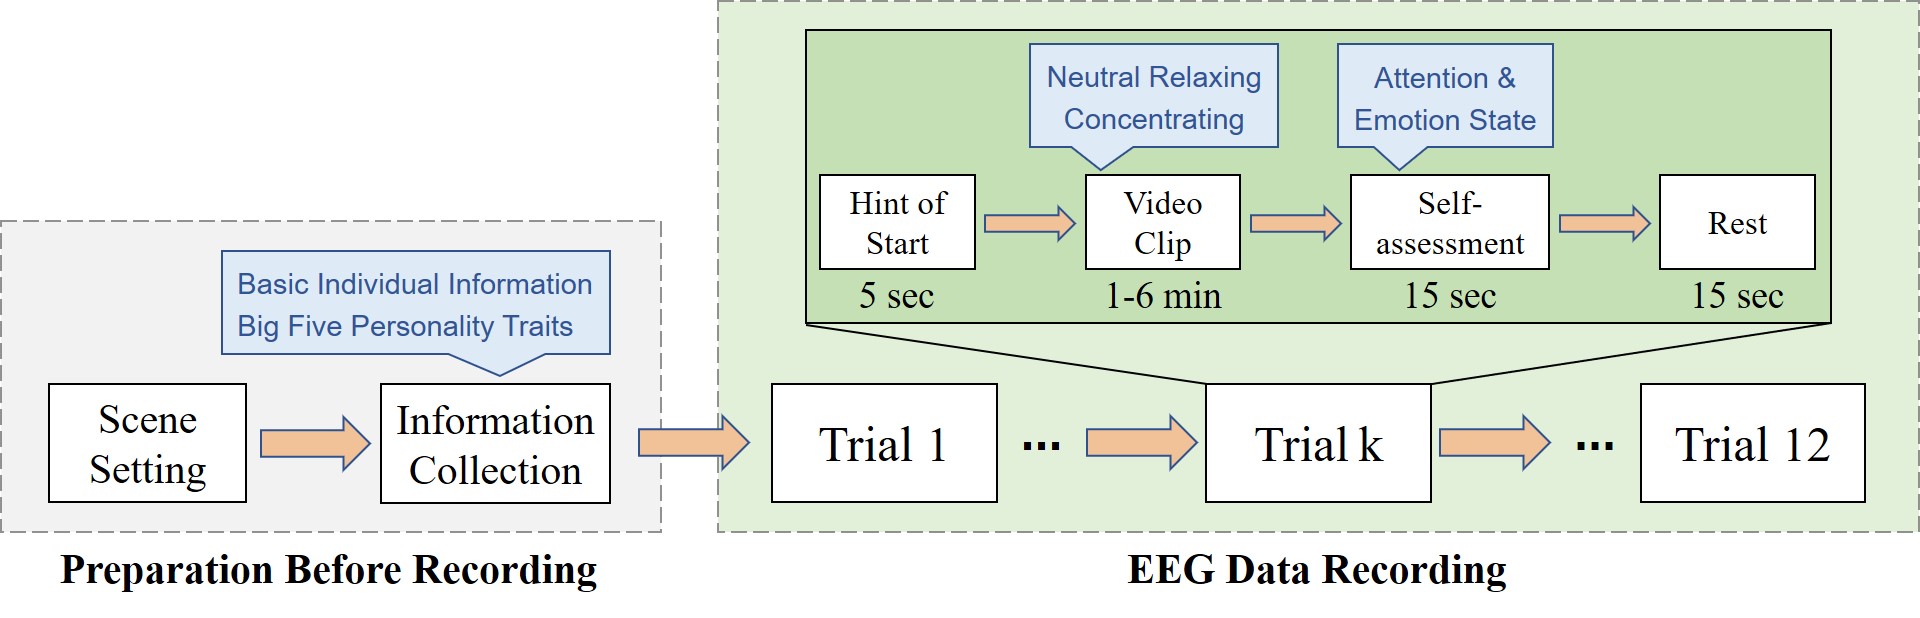
The whole process of acquiring attention EEG signals is shown in Figure 1, with each module to be detailed in the following sections. Each collection session is conducted following the same procedure in a sequential manner.
During the “preparation before recording” phase, the collector prepares the appropriate scene setting, including all questionnaires and equipments needed for the collection process. Subsequently, each subject must complete a personal information questionnaire and a Big Five Inventory (BFI) questionnaire. Afterward, researchers will explain the data collection process in detail to the subjects until they fully understand it. The details of scene setting and information collection will be introduced later.
During the “EEG data recording” phase, each subject will undergo a total of 12 tasks (trials) of three different types. The process is similar for each task or trial, as shown in the right part of Figure 1. It starts with a 5-second hint of start, followed by a video clip that varies in length from 1 to 6 minutes, depending on the type of task. After watching the video, there is a 15-second self-assessment period for subjects to evaluate their attention and emotional states during the video. Detailed task design and assessment methods will be presented subsequently. After that, there is a 15-second rest period. If subjects feel the rest period is insufficient, they can choose to extend it until they are ready. This cycle repeats until all 12 trials are completed.
III-B Preparation before Recording
III-B1 scene setting
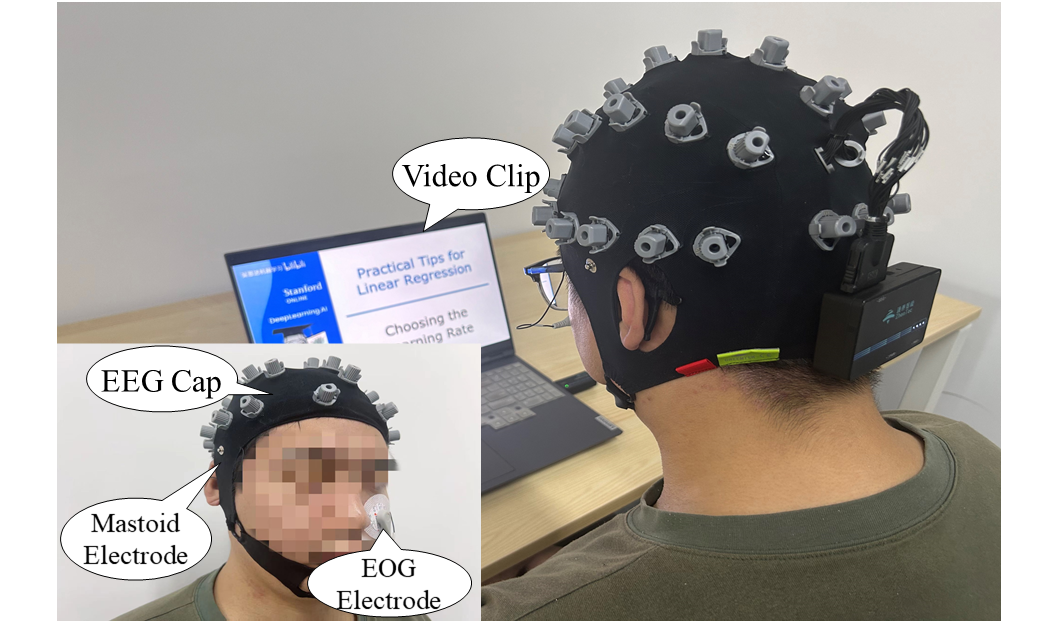
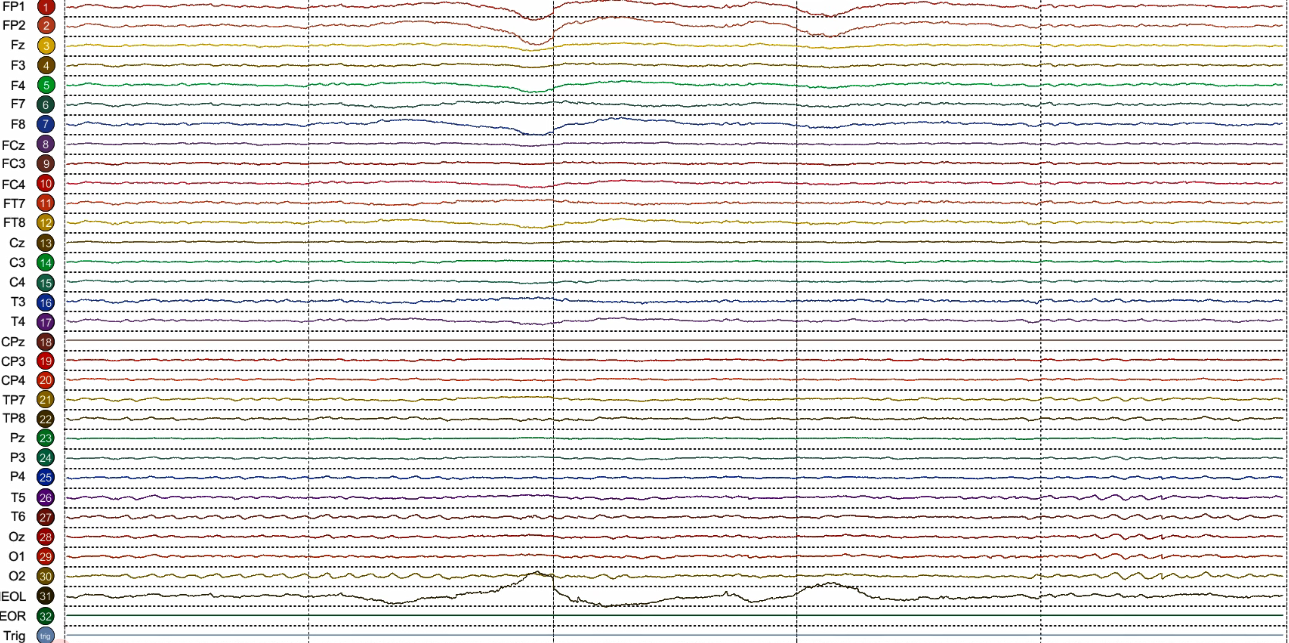
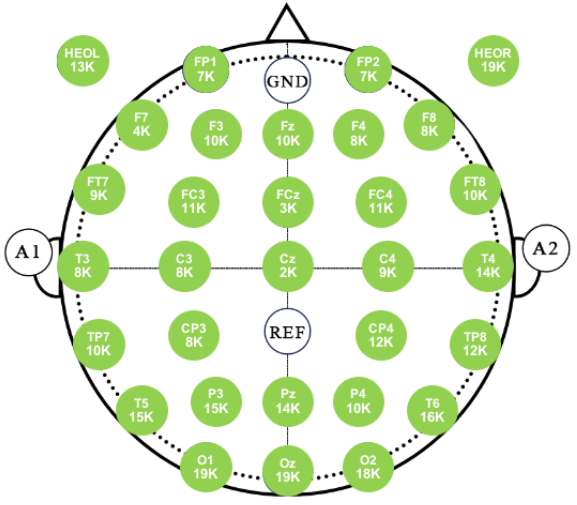
The process is conducted in a well-lit, quiet, and isolated room with only essential equipment to ensure a controlled environment during data collection. This includes computers to deliver stimuli and operate data collection systems and a wireless multichannel EEG acquisition system (ZhenTec-NT1-32, Xi’an ZhenTec Intelligence Technology Co., Ltd., China) to collect EEG data. The EEG cap is fitted with 32 electrodes based on the international 10-10 system. The reference electrode is positioned at CPz, and the ground electrode is positioned at FPz. ALL electrodes are Ag/AgCl semi-dry, made from a highly absorbent sponge wetted with NaCl solution. Additional electrooculography (EOG) and mastoid electrodes collect relevant voltages using Ag/AgCl electrodes and conductive hydrogel. All electrodes maintain an impedance below 20 and sample at 500Hz, with signals amplified and transmitted by an EEG acquisition amplifier and data receiver. Figure 2 presents the illustration of preparation before recording.
III-B2 individual information collection
To enrich the dataset’s data types and labeling system, in addition to EEG signals and corresponding attention state and emotion state labels, we also collect additional auxiliary information, including subjects’ basic individual information and Big Five personality assessment. These information will be beneficial for researchers to explore more complex patterns and tasks.
Basic individual information. EEG data exhibit significant variability among different subjects [15], closely linked to their individual attributes [16]. Additionally, attention levels have been shown to correlate with these basic attributes. Therefore, at the beginning of the experiment, subjects are required to fill out a basic information questionnaire covering the following five aspects: age, gender, handedness, education level, and current emotional state.
Big Five personality assessment. There is no doubt that an individual’s level of attention is also influenced by their personality. Various theories and methods exist for measuring personality, but the Big Five personality traits are the most widely recognized and important in scientific research [17]. Therefore, at the beginning of the experiment, subjects are required to complete the 44-item version of the BFI questionnaire during the information collection phase. This questionnaire consists of 44 statements related to personality traits, and subjects should choose options that best reflect their actual conditions.

| Dataset | Public | Scene | #Subject | #Trial | Total Duration | Validation | Extra Data |
|---|---|---|---|---|---|---|---|
| Toa et al. [18] | No | Unclear | 30 | 40 | 2,400 min | ERP, C | Eye |
| Alirezaei et al. [9] | No | mental arithmetic | 12 | — | 273 min | C | None |
| Ghasemy et al. [7] | No | auditory attention | 10 | 8 | 560 min | S, C | None |
| Gupta et al. [6] | No | online learning | 80 | 1 | 800 min | T, S | None |
| Sethi et al. [19] | No | online learning | 42 | 2 | — | S | None |
| Wang et al. [8] | Yes | Unclear | 1 | 80 | — | S, C | None |
| Ni et al. [14] | Yes | online learning | 28 | 3 | 420 min | S | I |
| MEMA(Ours) | Yes | online learning | 20 | 12 | 1,060 min | B, T, S, C, M | E, I, P |
ERP: event-related potential, C: classification, Eye: eye gaze, S: statistical analysis, T: time-frequency analysis, B: brain electrical activity mapping, M: multi-label correlation study, E: emotion labels, I: individual information, P: personality
III-C Task Design for Each Trail
Taking into account the physiological and psychological characteristics of individuals and drawing upon existing research [9, 7], we categorize attention states into three types: “neutral”, “relaxing”, and “concentrating”, and develop a specific experimental task for each state.
Each subject will undergo four rounds of experiments, each containing one instance of each task type, totaling 12 trials. The order of the tasks within each round is randomized to prevent fixed sequence effects that could bias subjects and thus impact data reliability. We provide a detailed description of each type of task as follows:
-
•
“Neutral” Task: For this task, the computer plays a one-minute blank video, and subjects simply need to maintain a normal state and watch the computer screen. The “Neutral” state falls between “relaxing” and “concentrating”. Subjects are neither actively relaxing nor consciously focusing their attention.
-
•
“Relaxing” Task: For this task, the computer plays a soothing video of beautiful scenery for about 5 minutes to help subjects relax and reduce their focus. Additionally, relaxing music is played alongside the video, which has been proven to aid in physiological and psychological relaxation [20]. This task requires subjects to maintain a relaxed state as much as possible.
-
•
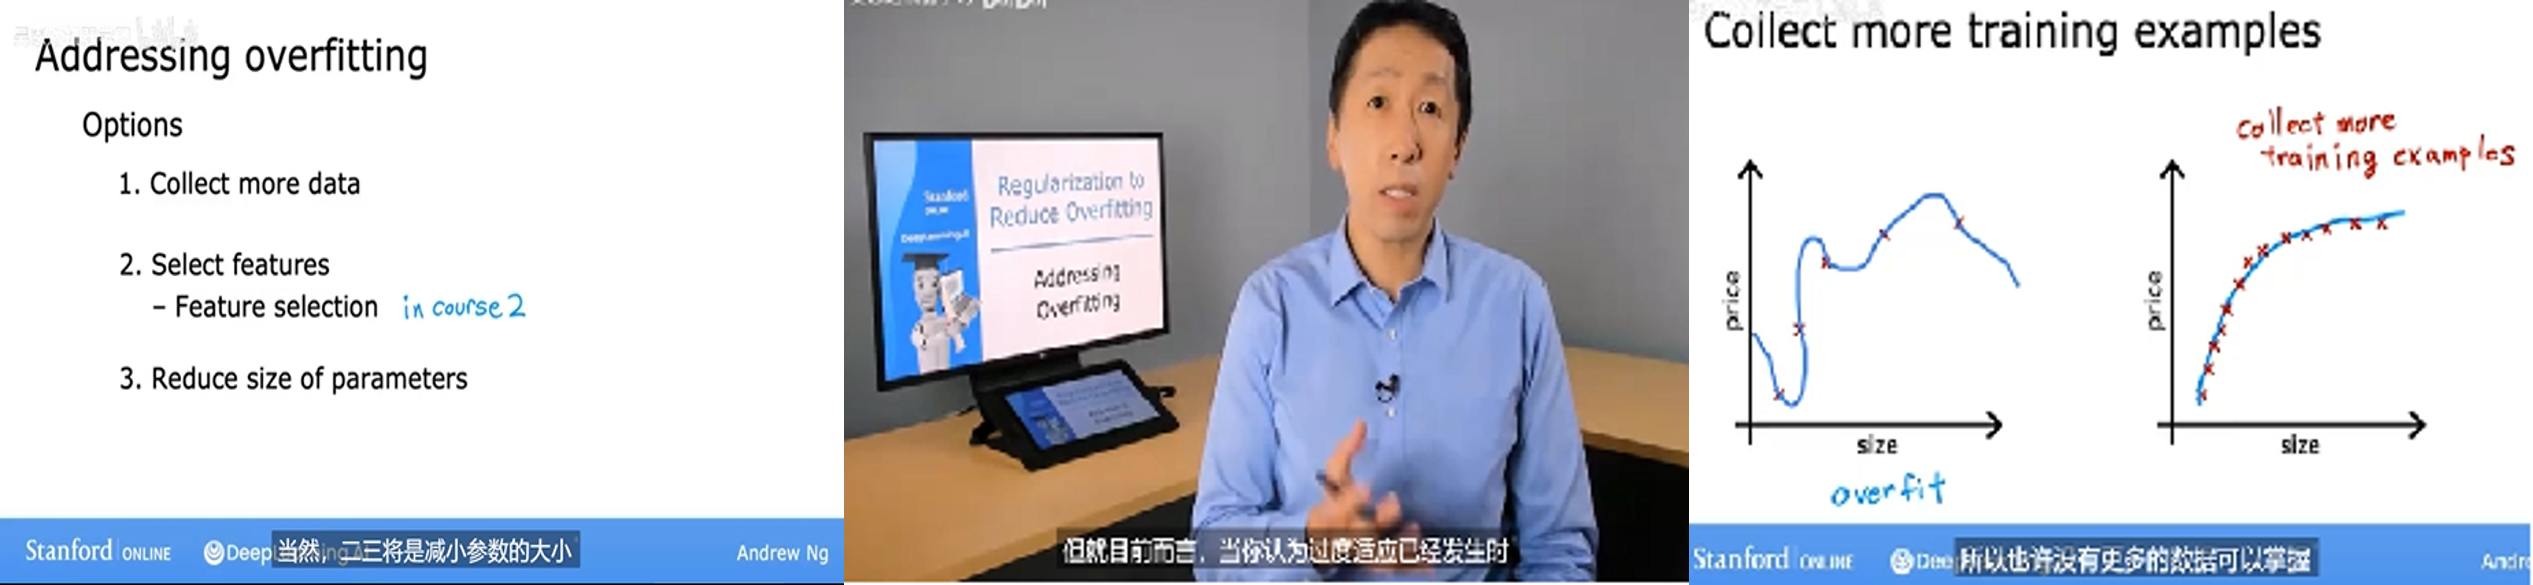
“Concentrating” Task: For this task, the computer plays a video clip from a well-known machine learning course111https://www.coursera.org/specializations/machine-learning-introduction, covering a complete knowledge point. Each clip lasts about 5 minutes, a duration chosen based on research by [21] on the Continuous Performance Test (CPT) task. Subjects are required to concentrate as much as possible on the course content, actively learn, and think about the material. At the end of each video clip, subjects are asked to answer a simple multiple-choice question related to the video content to assess whether they were focused on learning online.
Figure 3 shows some snapshots of video clips for the “Concentrating” and “Relaxing” states.
After watching the video, subjects were asked to perform two different kinds of mental state assessments.
Attention self-assessment. Subjects are required to self-assess their attention state during the viewing period and select the option that best matches their state of attention from “neutral”, “relaxing”, and “concentrating” choices. Although subjects are instructed to maintain a specific attention state while watching the video, there may be instances where the self-assessment of attention state does not match the expected outcomes. Recording data from these instances will be discarded.
Emotion self-assessment. Research indicates that EEG signals can also reflect a person’s emotional state [22, 23], and there is a close relationship between attention and emotion states [24]. Therefore, during each trial’s self-assessment phase, subjects also assess their emotional state using the “Valence-Arousal-Dominance” (VAD) three-dimensional emotional model [25]. Valence describes the degree of positive or negative emotions. Arousal describes the level or intensity of emotional activation, and dominance describes the degree of emotional control or subjective experience. Subjects rate their emotions on these three dimensions using a scale of 1 to 5, where 1 is the lowest and 5 is the highest.
| Method | Subject-dependent | Cross-subject | ||
|---|---|---|---|---|
| ACC(%) | F1(%) | ACC(%) | F1(%) | |
| SVM | 78.71 | 54.82 | 62.28 | 43.35 |
| RF | 80.55 | 59.56 | 56.03 | 45.21 |
| DT | 82.38 | 57.83 | 60.12 | 41.92 |
| EEGNet | 85.12 | 59.64 | 64.84 | 45.13 |
| ACRNN | 82.53 | 57.94 | 63.27 | 43.69 |
| DGCNN | 82.14 | 47.59 | 63.91 | 43.65 |
| Method | Subject-dependent | Cross-subject | ||||||||||
|---|---|---|---|---|---|---|---|---|---|---|---|---|
| Valence | Arousal | Dominance | Valence | Arousal | Dominance | |||||||
| ACC(%) | F1(%) | ACC(%) | F1(%) | ACC(%) | F1(%) | ACC(%) | F1(%) | ACC(%) | F1(%) | ACC(%) | F1(%) | |
| SVM | 77.94 | 43.78 | 78.56 | 56.24 | 64.47 | 47.19 | 65.78 | 33.33 | 61.58 | 25.92 | 50.13 | 48.01 |
| RF | 78.71 | 65.45 | 74.73 | 65.45 | 65.54 | 56.93 | 58.57 | 41.11 | 60.09 | 43.78 | 44.67 | 34.33 |
| DT | 81.92 | 45.00 | 75.95 | 64.85 | 64.77 | 55.56 | 58.12 | 44.44 | 56.96 | 32.03 | 48.42 | 36.67 |
| EEGNet | 82.71 | 63.88 | 81.66 | 65.66 | 71.42 | 56.84 | 65.18 | 31.78 | 65.11 | 39.36 | 51.80 | 22.82 |
| ACRNN | 81.77 | 56.21 | 80.13 | 47.59 | 72.01 | 60.72 | 64.70 | 46.23 | 63.25 | 38.71 | 51.02 | 33.78 |
| DGCNN | 80.92 | 64.73 | 83.54 | 65.45 | 72.65 | 55.24 | 63.58 | 31.86 | 64.03 | 39.00 | 53.70 | 39.33 |
IV Technical Validation
In this section, we present the constructed multi-label EEG dataset MEMA and conduct comprehensive qualitative and quantitative analysis experiments for quality validation.
IV-A Dataset Description and Comparison
As shown in Table I, we summarize our collected dataset and several related datasets to facilitate a comparison from various dimensions, including whether it is publicly available, the application scene, the number of subjects sampled, the number of trials per subject, the total duration of EEG data collected, which kinds of data quality validation have been conducted, and which kinds of data beyond attention states have been collected. The table shows that our dataset is quite extensive, only surpassed by one dataset that is not publicly available. We also conduct quality validation to ensure the integrity of our dataset, a feature lacking in other datasets. Moreover, we collect additional data on emotional labels and subjects’ personality traits, enabling more complex explorations of cognitive mechanisms on our dataset.
IV-B Qualitative Analysis
To reduce the impact of noise in EEG signals [24], we employ some simple and commonly used preprocessing methods on the collected data. First, we use a 50Hz notch filter to eliminate signals of specific frequencies from power line interference or equipment noise. Next, we use a band-pass filter ranging from 8 to 30Hz to extract signals from specific frequency bands. Finally, we utilize Independent Component Analysis (ICA) to remove artifacts from the EEG, thereby obtaining higher quality data.
IV-B1 brain electrical activity mapping
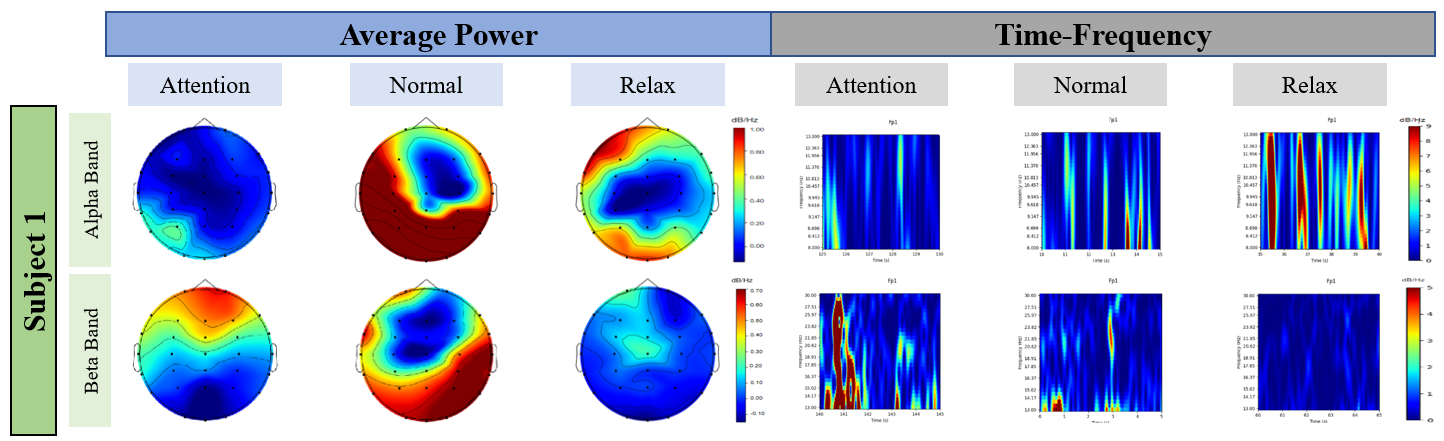
To study the differences in brain region activation under different attention states, we calculate the average power distribution in the band (8-13Hz) and bands (13–30 Hz) for each state respectively, and plot them on topographic maps based on the channel positions. Due to space limitations, we only display partial results for two subjects, as shown on the left side of Figure 4. We focus on the frontal lobe, an area highly related to attention [26]. From the figure, it can be observed that as the level of attention decreases (from concentrating to neutral to relaxing), the power in the band of the frontal lobe region generally shows an increasing trend, while the power in the band of the frontal lobe region generally shows a decreasing trend. This is consistent with previous research and findings [27, 28, 29], demonstrating the reliability of the data we collected.
IV-B2 time-frequency analysis
EEG time-frequency analysis is a method for studying the spectral characteristics of EEG signals over time. This analysis can reveal changes in EEG signals across different time points and frequency ranges, thus helping researchers understand the dynamic features of brain activity. We illustrate the power changes in the and bands at the FP1 channel for two subjects under three attention states by using the Morlet wavelet transform. The right half of Figure 4 shows a 5-second segment of this data. From the figure, observations consistent with the Brain Electrical Activity Mapping (BEAM) results are evident: as attention levels decrease, the power in the band increases, while it decreases in the band.
IV-C Quantitative Analysis
We conduct a series of quantitative analysis experiments on our constructed dataset to further validate its quality. Firstly, we employ several classical machine learning (SVM [30], Decision Tree [31], and Random Forest [32]), and deep learning (EEGNet [33], ACRNN [34], and DGCNN [35]) algorithms of the EEG analysis field to perform our dataset’s attention and emotion classification tasks. Additionally, we conduct multi-label correlation studies, i.e., Chi-squared test and multi-task learning, thereby exploring the association between attention and emotion states.
IV-C1 attention state classification
We adopt two common experimental setups for the attention state classification experiments conducted on our constructed dataset: subject-dependent and cross-subject. In the subject-dependent scenario, both the training and test sets come from the same subject. In the cross-subject scenario, the training and test sets come from different subjects. Specifically, for the subject-dependent setup, the first 9 trials of each subject’s 12 EEG data trials are used as training data, and the last 3 are used as test data, with the average accuracy (ACC) and F1 scores reported. For the cross-subject setup, we use leave-one-out cross-validation. Each fold uses all trials from 19 subjects as the training set, with the remaining subject’s data serving as the test set, reporting the average ACC and F1 scores.
Table II reports the average ACC and F1 scores for six classical methods under two experimental scenarios. The results show that the three deep learning algorithms generally outperform the machine learning algorithms. EEGNet achieves the best performance among all methods. Additionally, most methods achieve accuracies above 80% and 60% in the two scenarios, respectively, which is significantly higher than the 33% expected by random chance in a three-class classification. This validates the effectiveness and reliability of our dataset for attention state classification tasks.
IV-C2 emotion classification
We also conduct emotion classification tasks using six classical models. The experimental setup is identical to that used for the attention state classification tasks, with experiments conducted in both subject-dependent and cross-subject scenarios. Table III reports the average ACC and F1 scores for the six classical methods under the two experimental scenarios with three emotional labels.
Table III shows that deep learning algorithms generally achieve better results than machine learning algorithms. This is due to deep learning models’ powerful discriminative feature extraction capabilities, which allow them to perform well across various tasks. The three deep learning algorithms have their own strengths and weaknesses across different emotional labels. Moreover, all methods consistently achieve accuracies well above 33% across all scenarios, underscoring the EEG and emotional labels’ effectiveness
| Attention State | Valence | Arousal | Dominance |
|---|---|---|---|
| Concentrating | 2.700.66 | 2.301.04 | 2.861.20 |
| Neutral | 2.620.70 | 1.700.60 | 2.761.36 |
| Relaxing | 3.140.87 | 1.300.77 | 2.741.17 |
| 35.29 | 25.10 | 3.51 |
IV-C3 multi-label correlation study
In this section, we perform a multi-label correlation study to explore the connection between attention and emotional states. First, we conduct statistical analyses on both types of labels, including calculating means, standard deviations, and performing chi-square tests. Additionally, through multi-task learning, we combine the emotion classification with the attention state classification task in an attempt to aid the classification of attention states.
Statistical analysis. We calculate the average values and standard deviations for the three types of emotional labels (valence, arousal, dominance) across the three attention states (concentrating, neutral, relaxing) for all subjects, as shown in Table IV. Based on the statistical results, the following conclusions can be drawn. a) In the valence dimension, the difference between the “concentrating” and “neutral” tasks is minimal, while the “relaxing” task scores significantly higher, likely due to the associated reduction in stress and increase in positive emotions. b) Arousal scores decrease from “concentrating” to “relaxing” tasks, reflecting higher alertness and potential stress during concentrated activities. c) The dominance dimension shows no significant differences across the three tasks, suggesting that attention levels do not influence perceived control. d) Variability in arousal scores is greater in the “concentrating” state due to individual differences in emotional and psychological responses. These summarized observations from Table IV align with expected behaviors, confirming the reliability of our dataset’s labels.
To further analyze the relationship between emotional and attention labels, we conducted chi-square tests between the attention labels and each of the three types of emotional labels. Considering the distribution of the emotional label scores, we treat the emotion classification task as a three-class task: one class for scores of 1 or 2, another for scores of 3, and a third class for scores of 4 or 5. The chi-square values for the association between attention labels and the emotional dimensions of valence, arousal, and dominance are shown in the last row of Table IV. The critical value from the chi-square distribution [36], based on the degrees of freedom and the correlation coefficient, is 9.49. The association is considered low if the chi-square value is less than this critical value. Otherwise, the association is considered high. From this, we can conclude that the attention states are more strongly associated with the valence and arousal emotional dimensions, while the association with dominance is weaker.
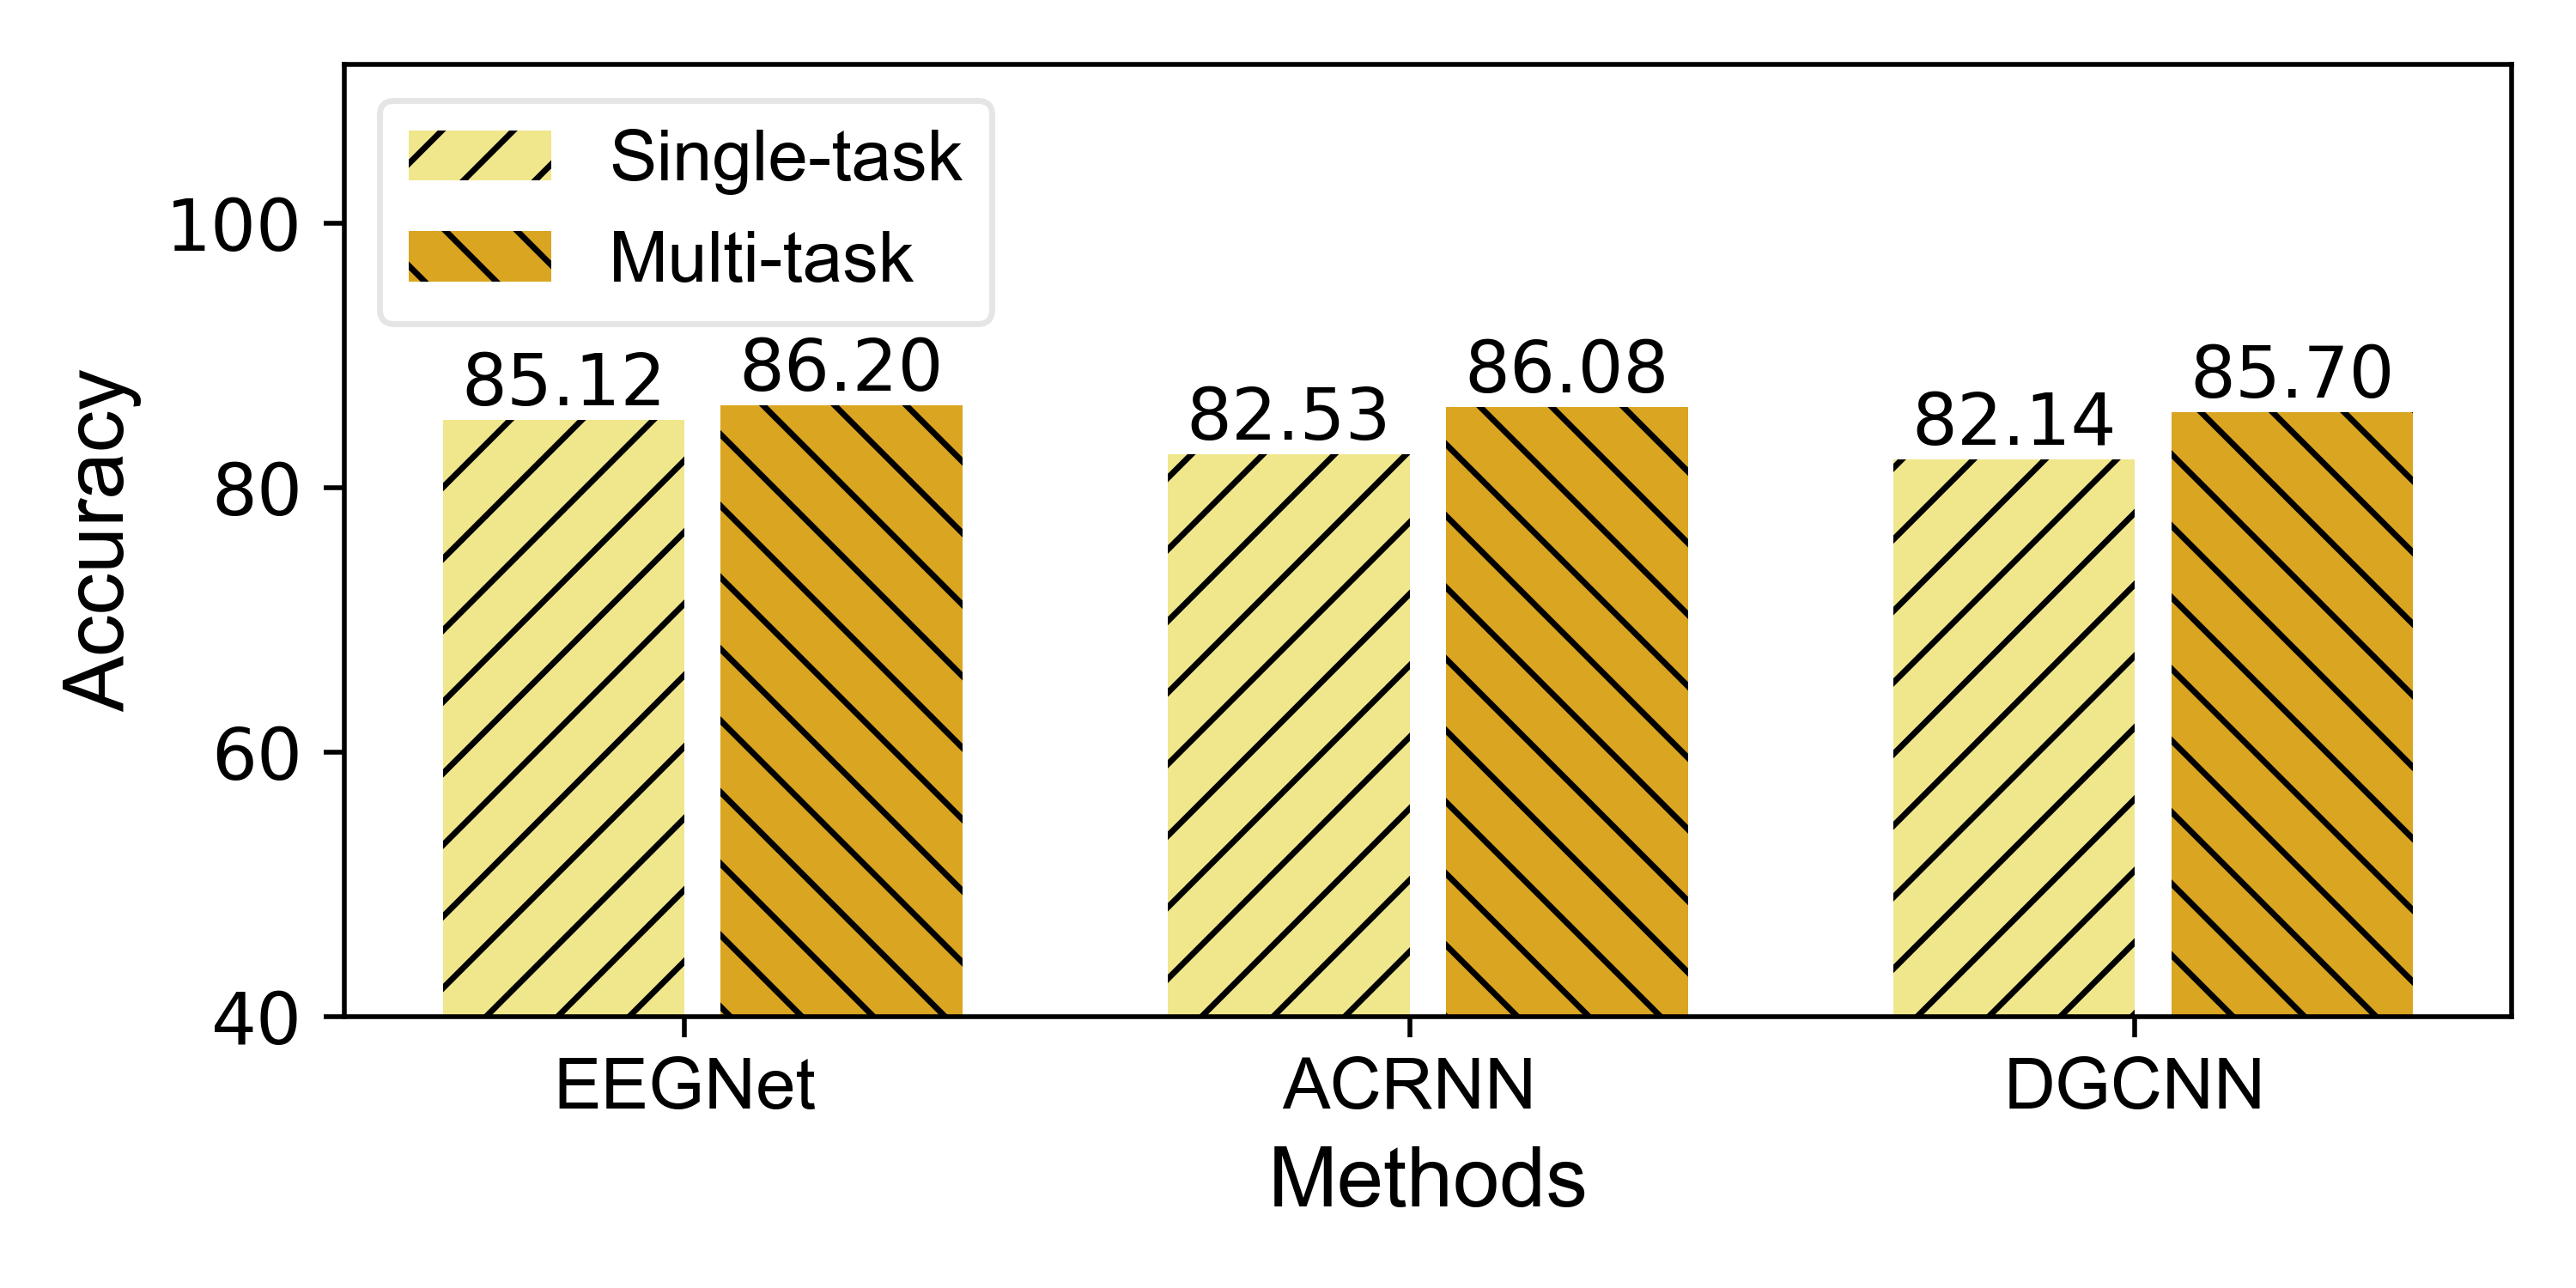
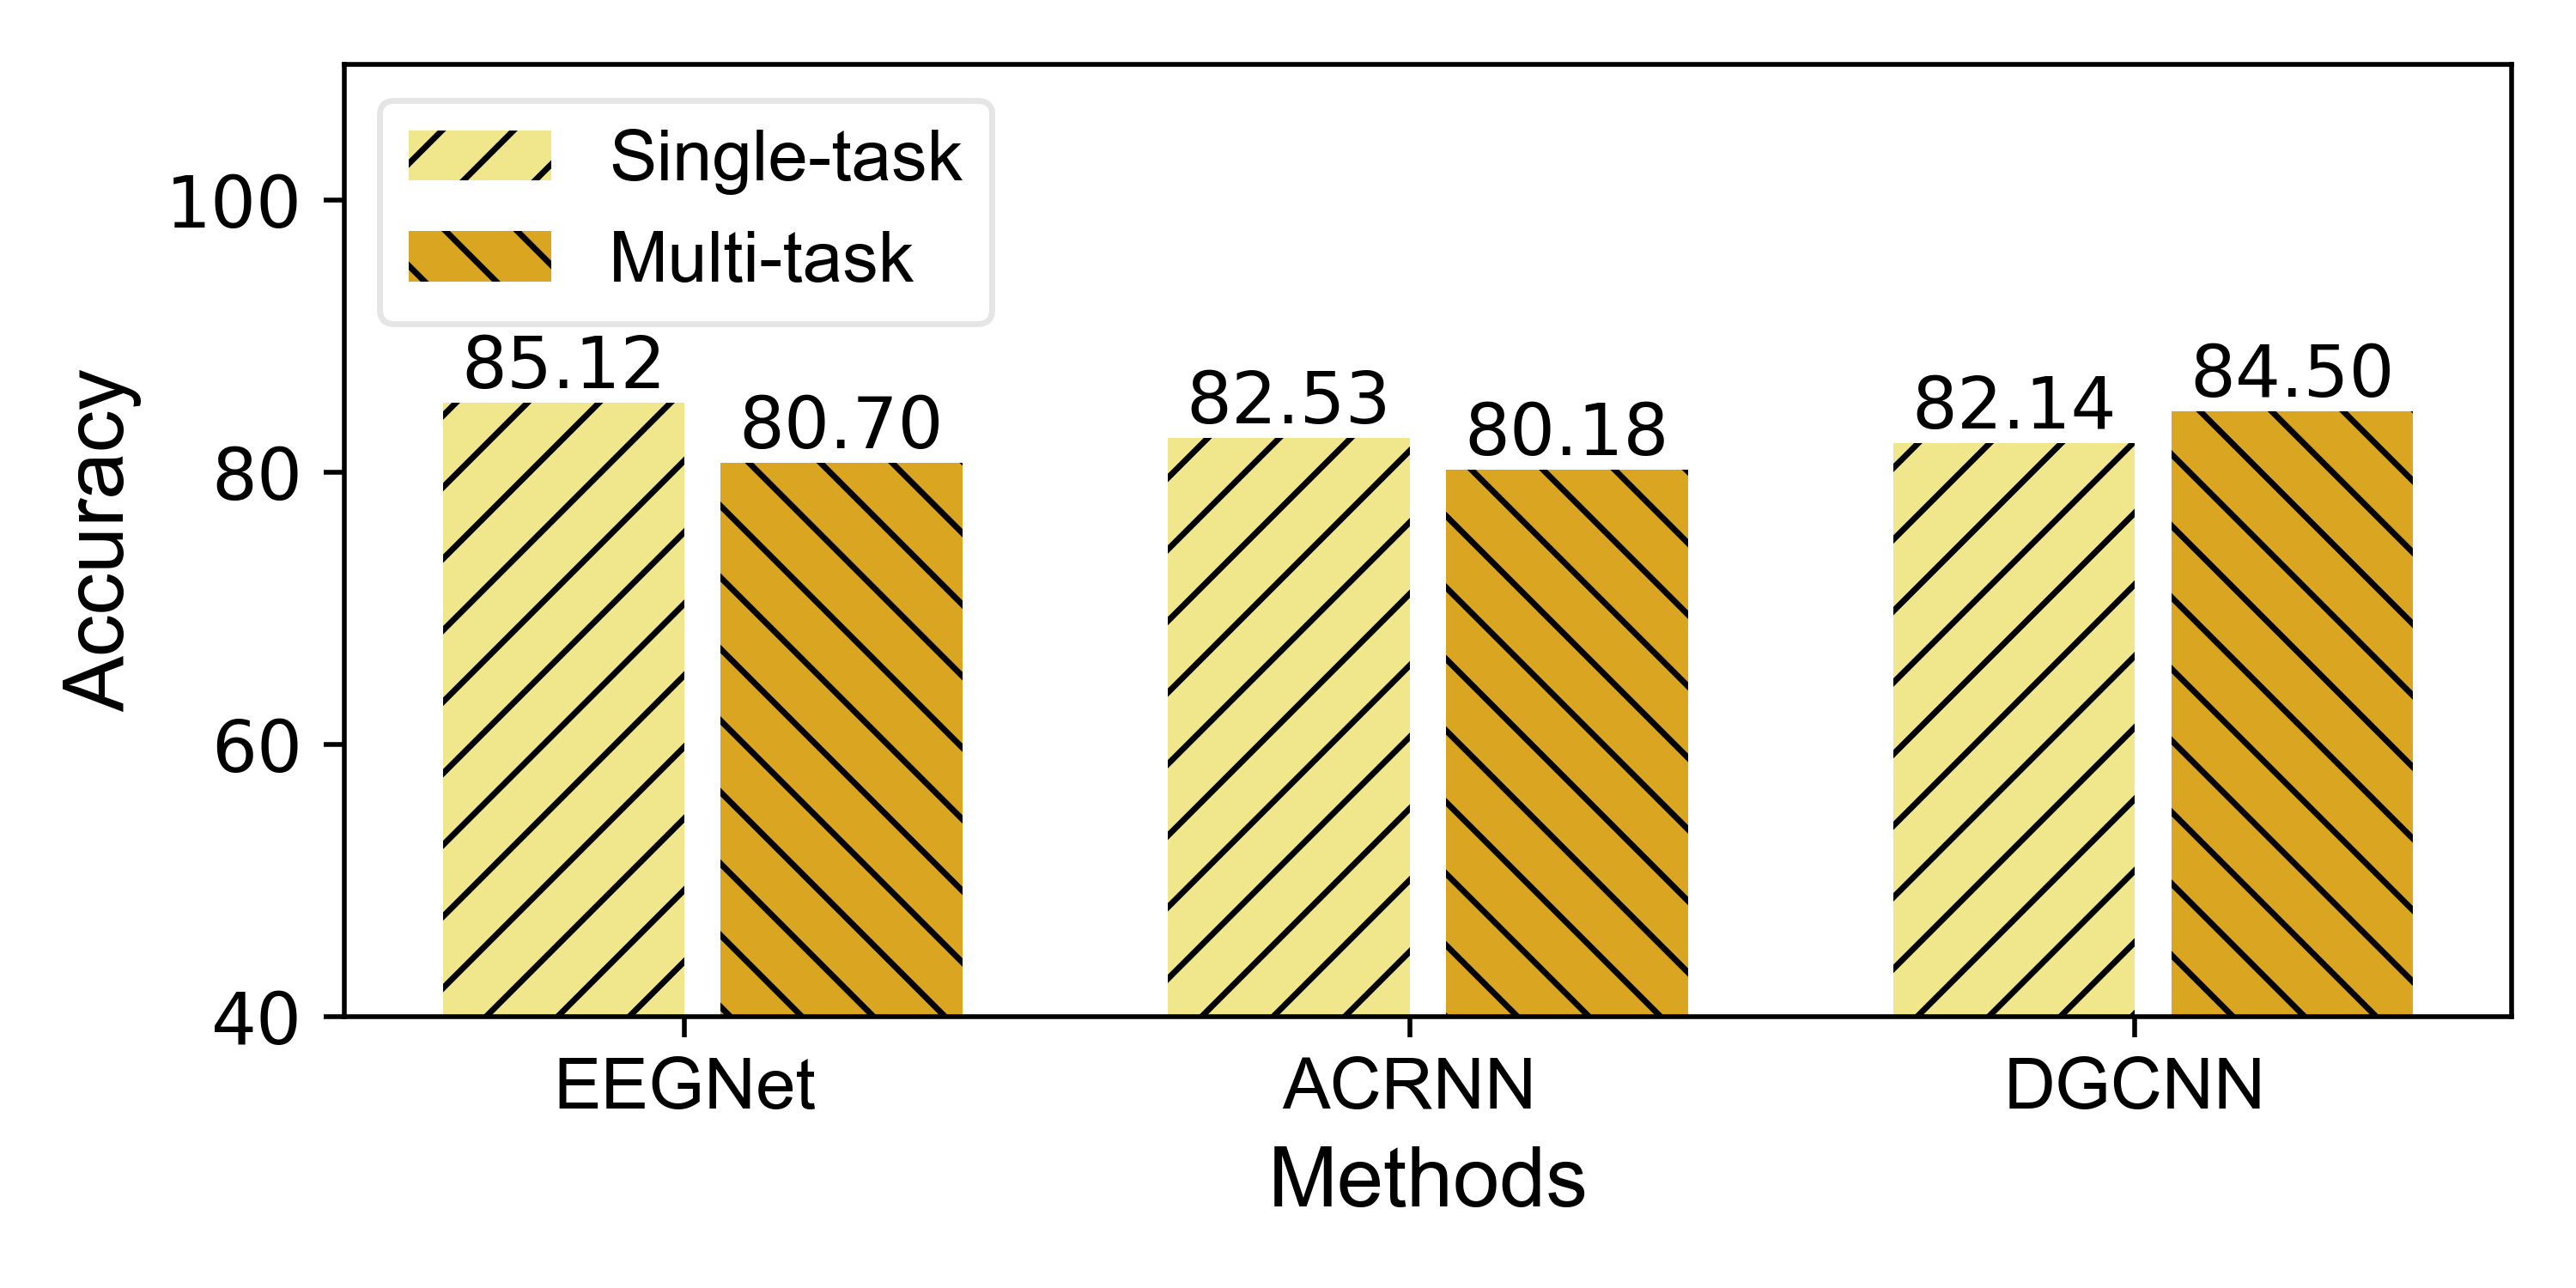
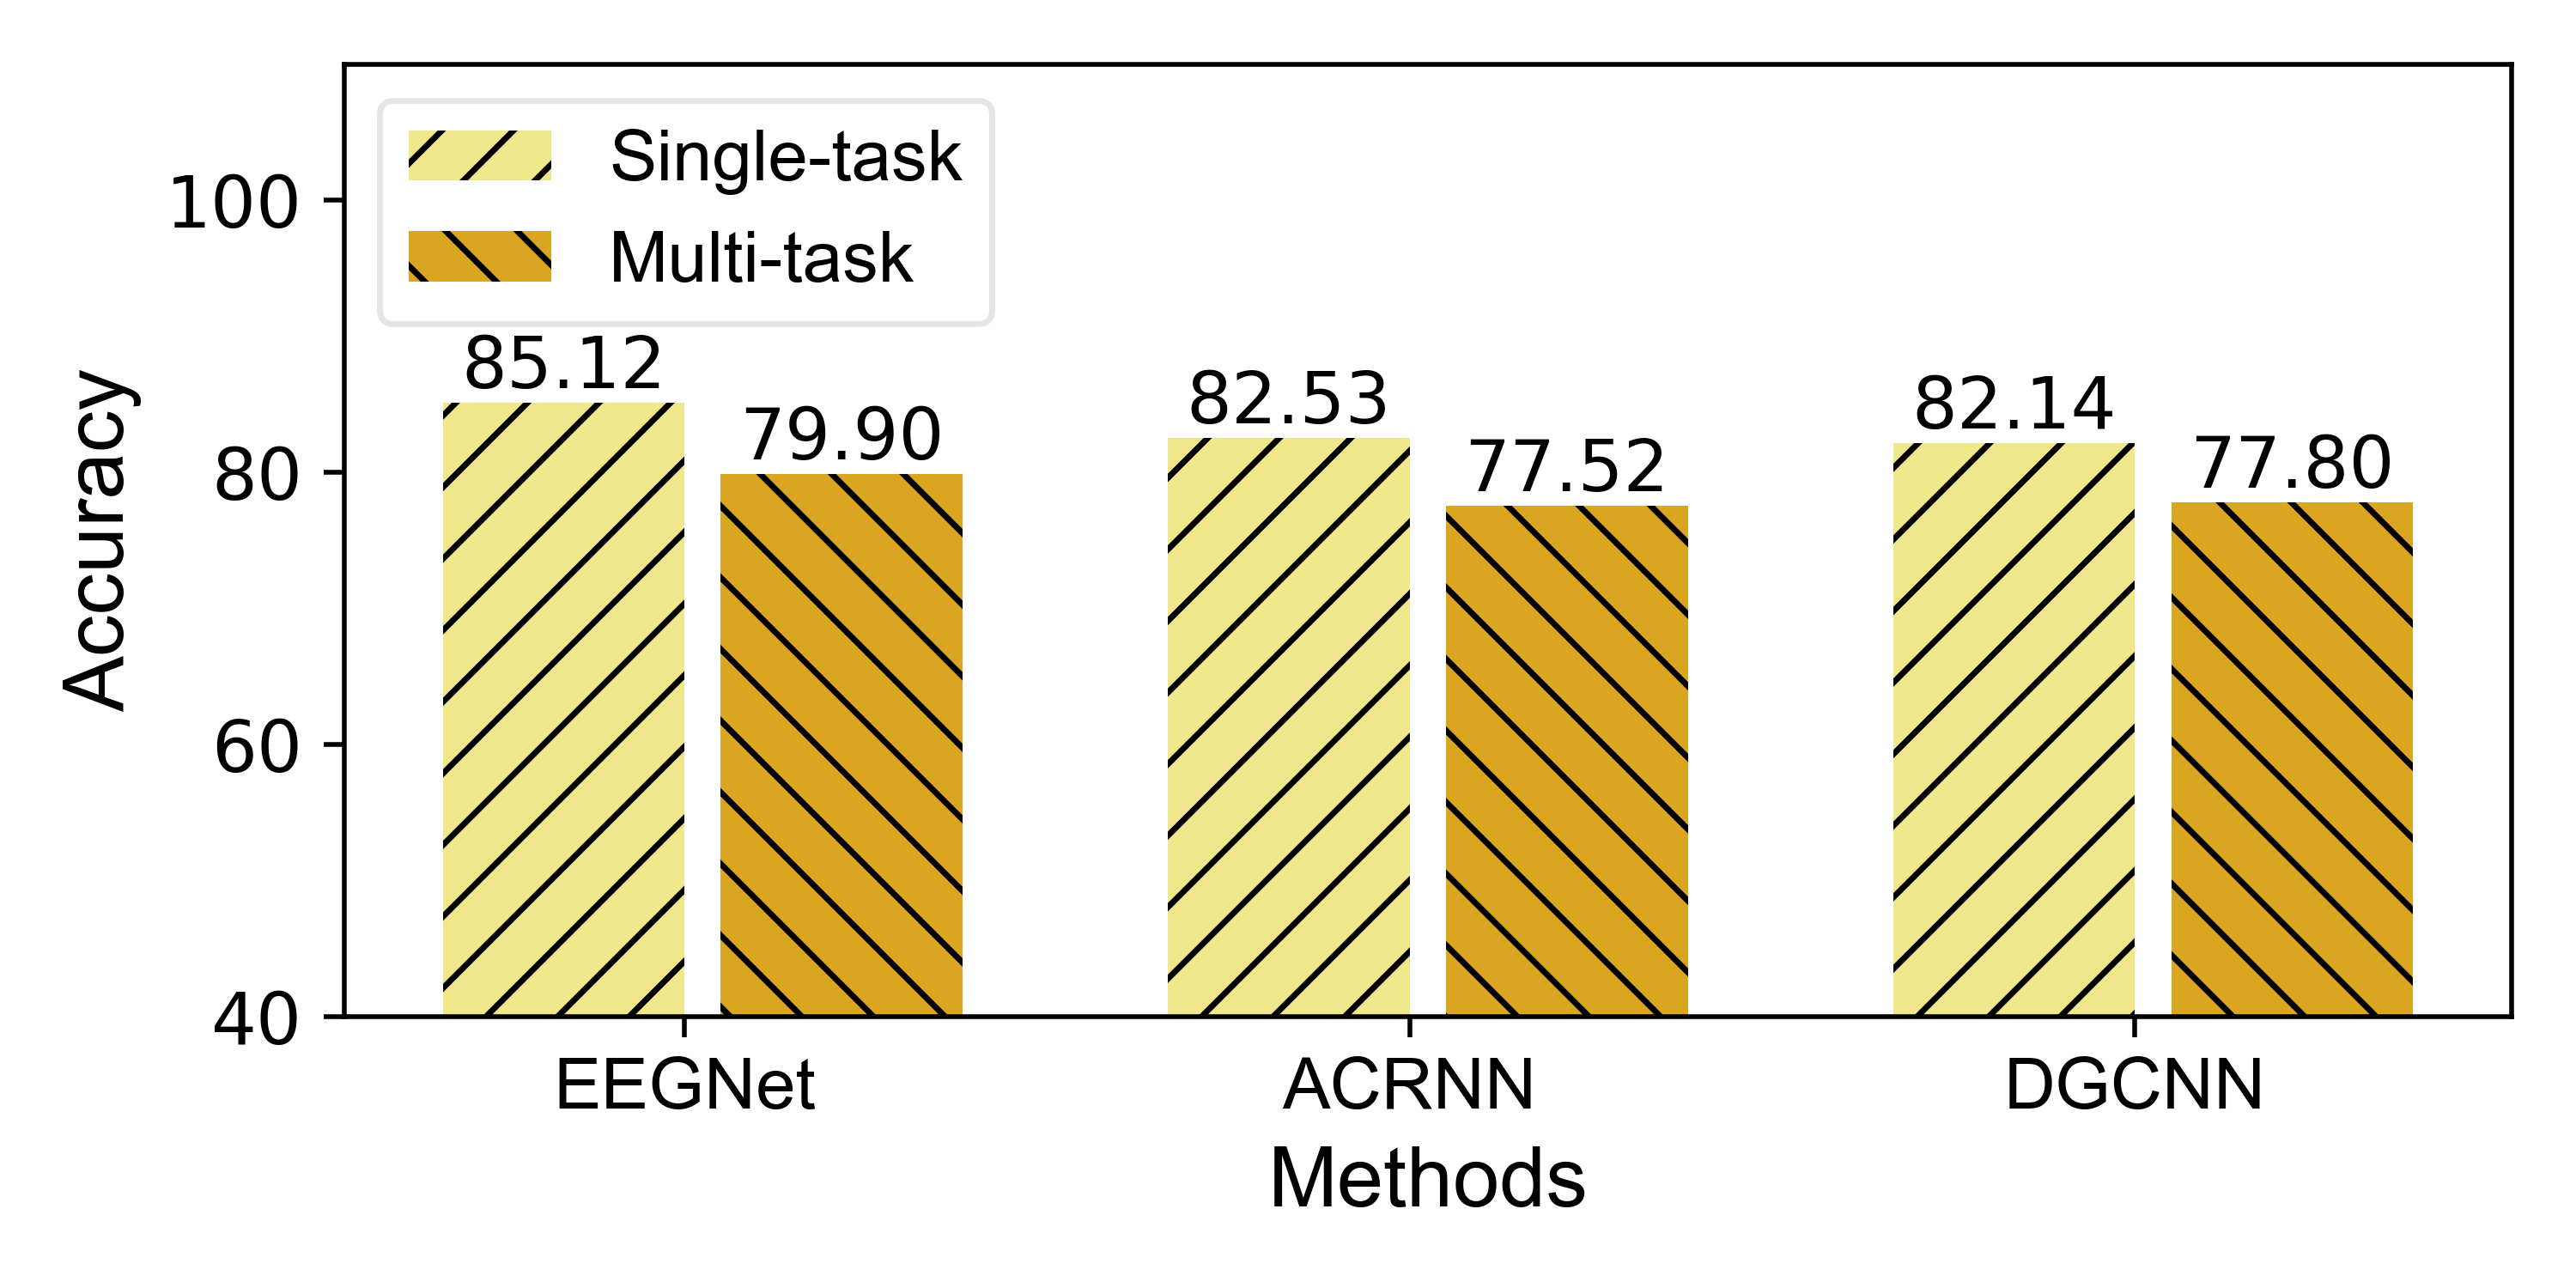
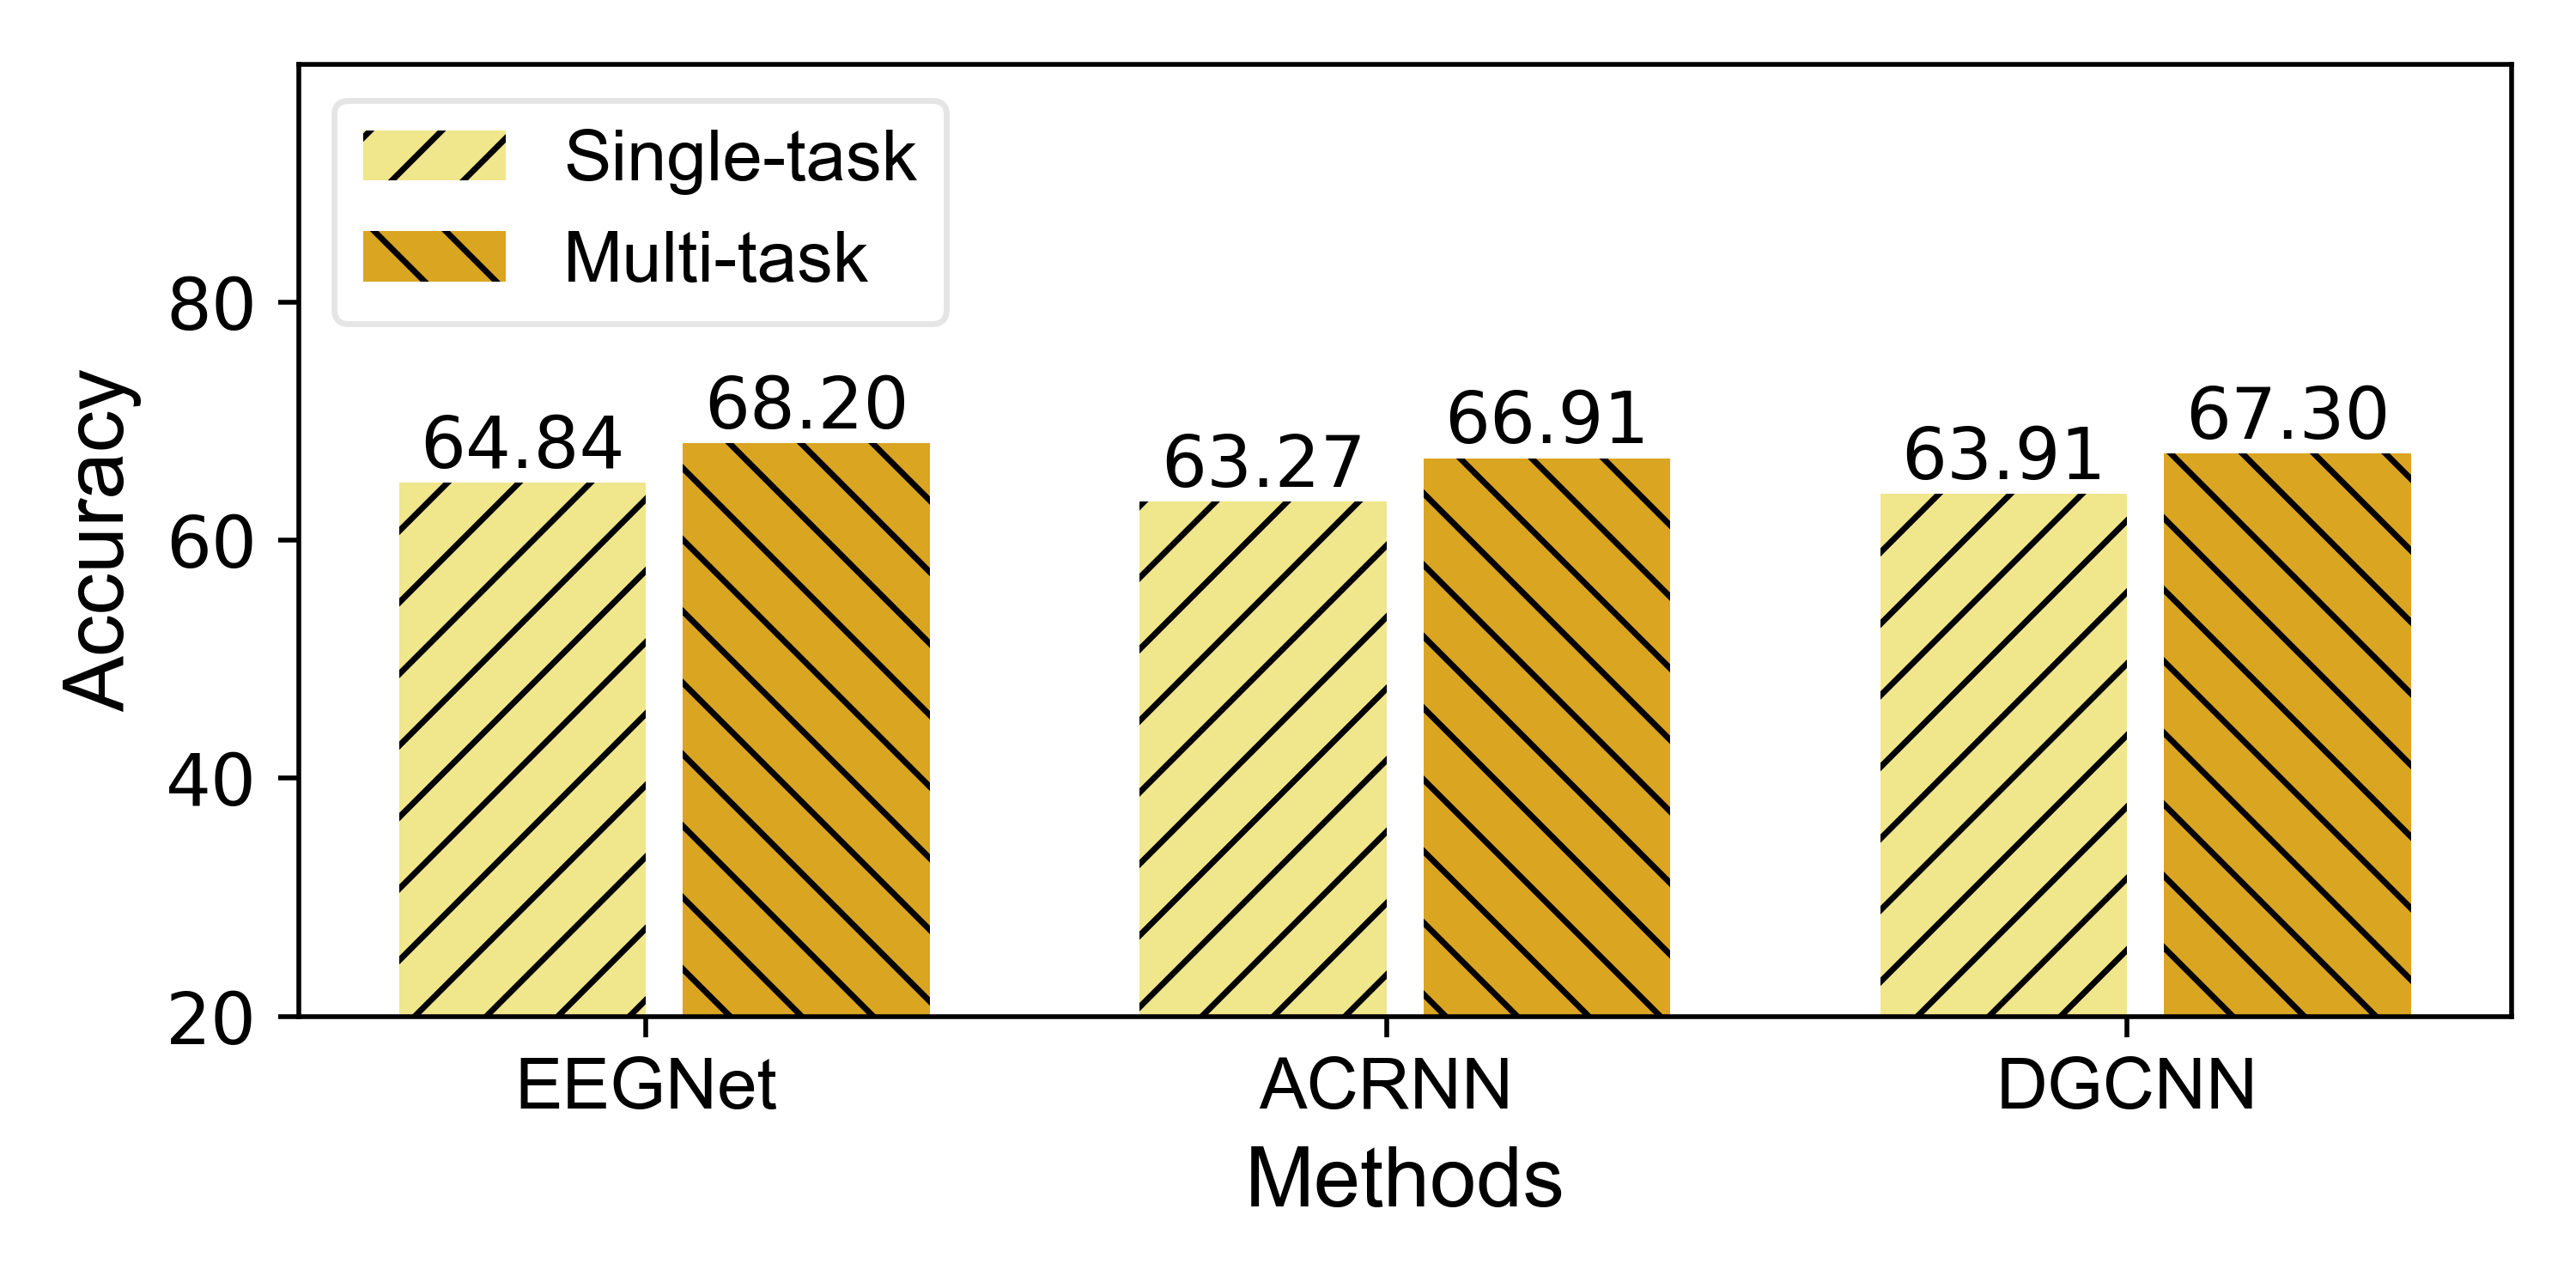
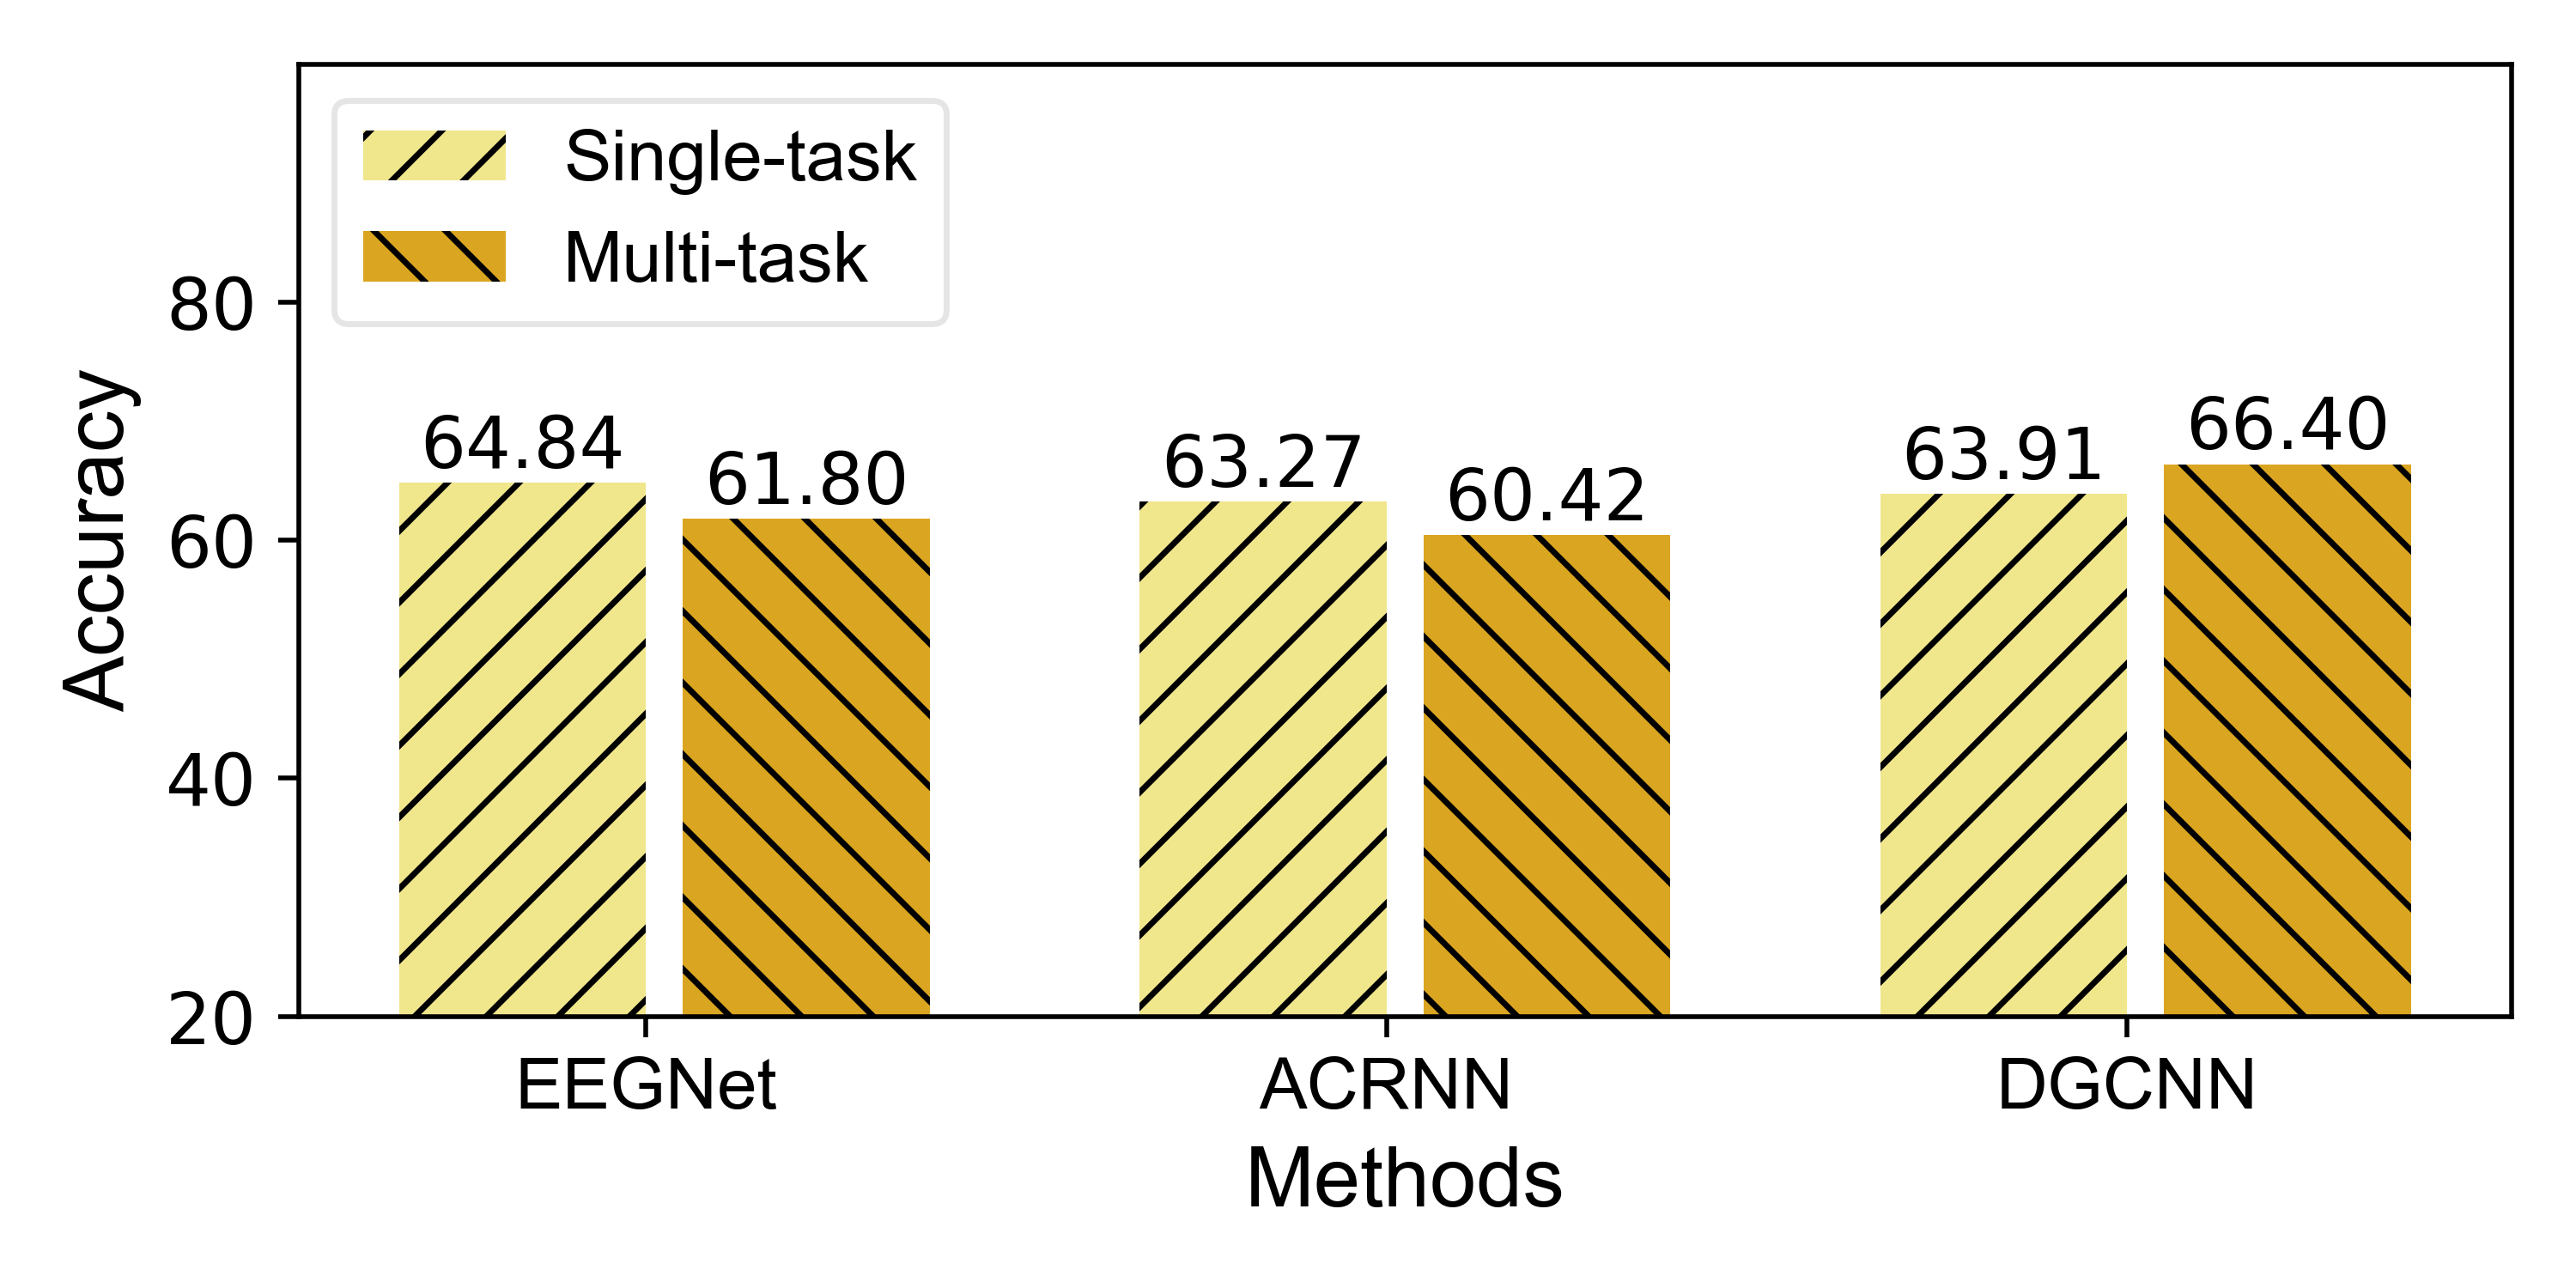
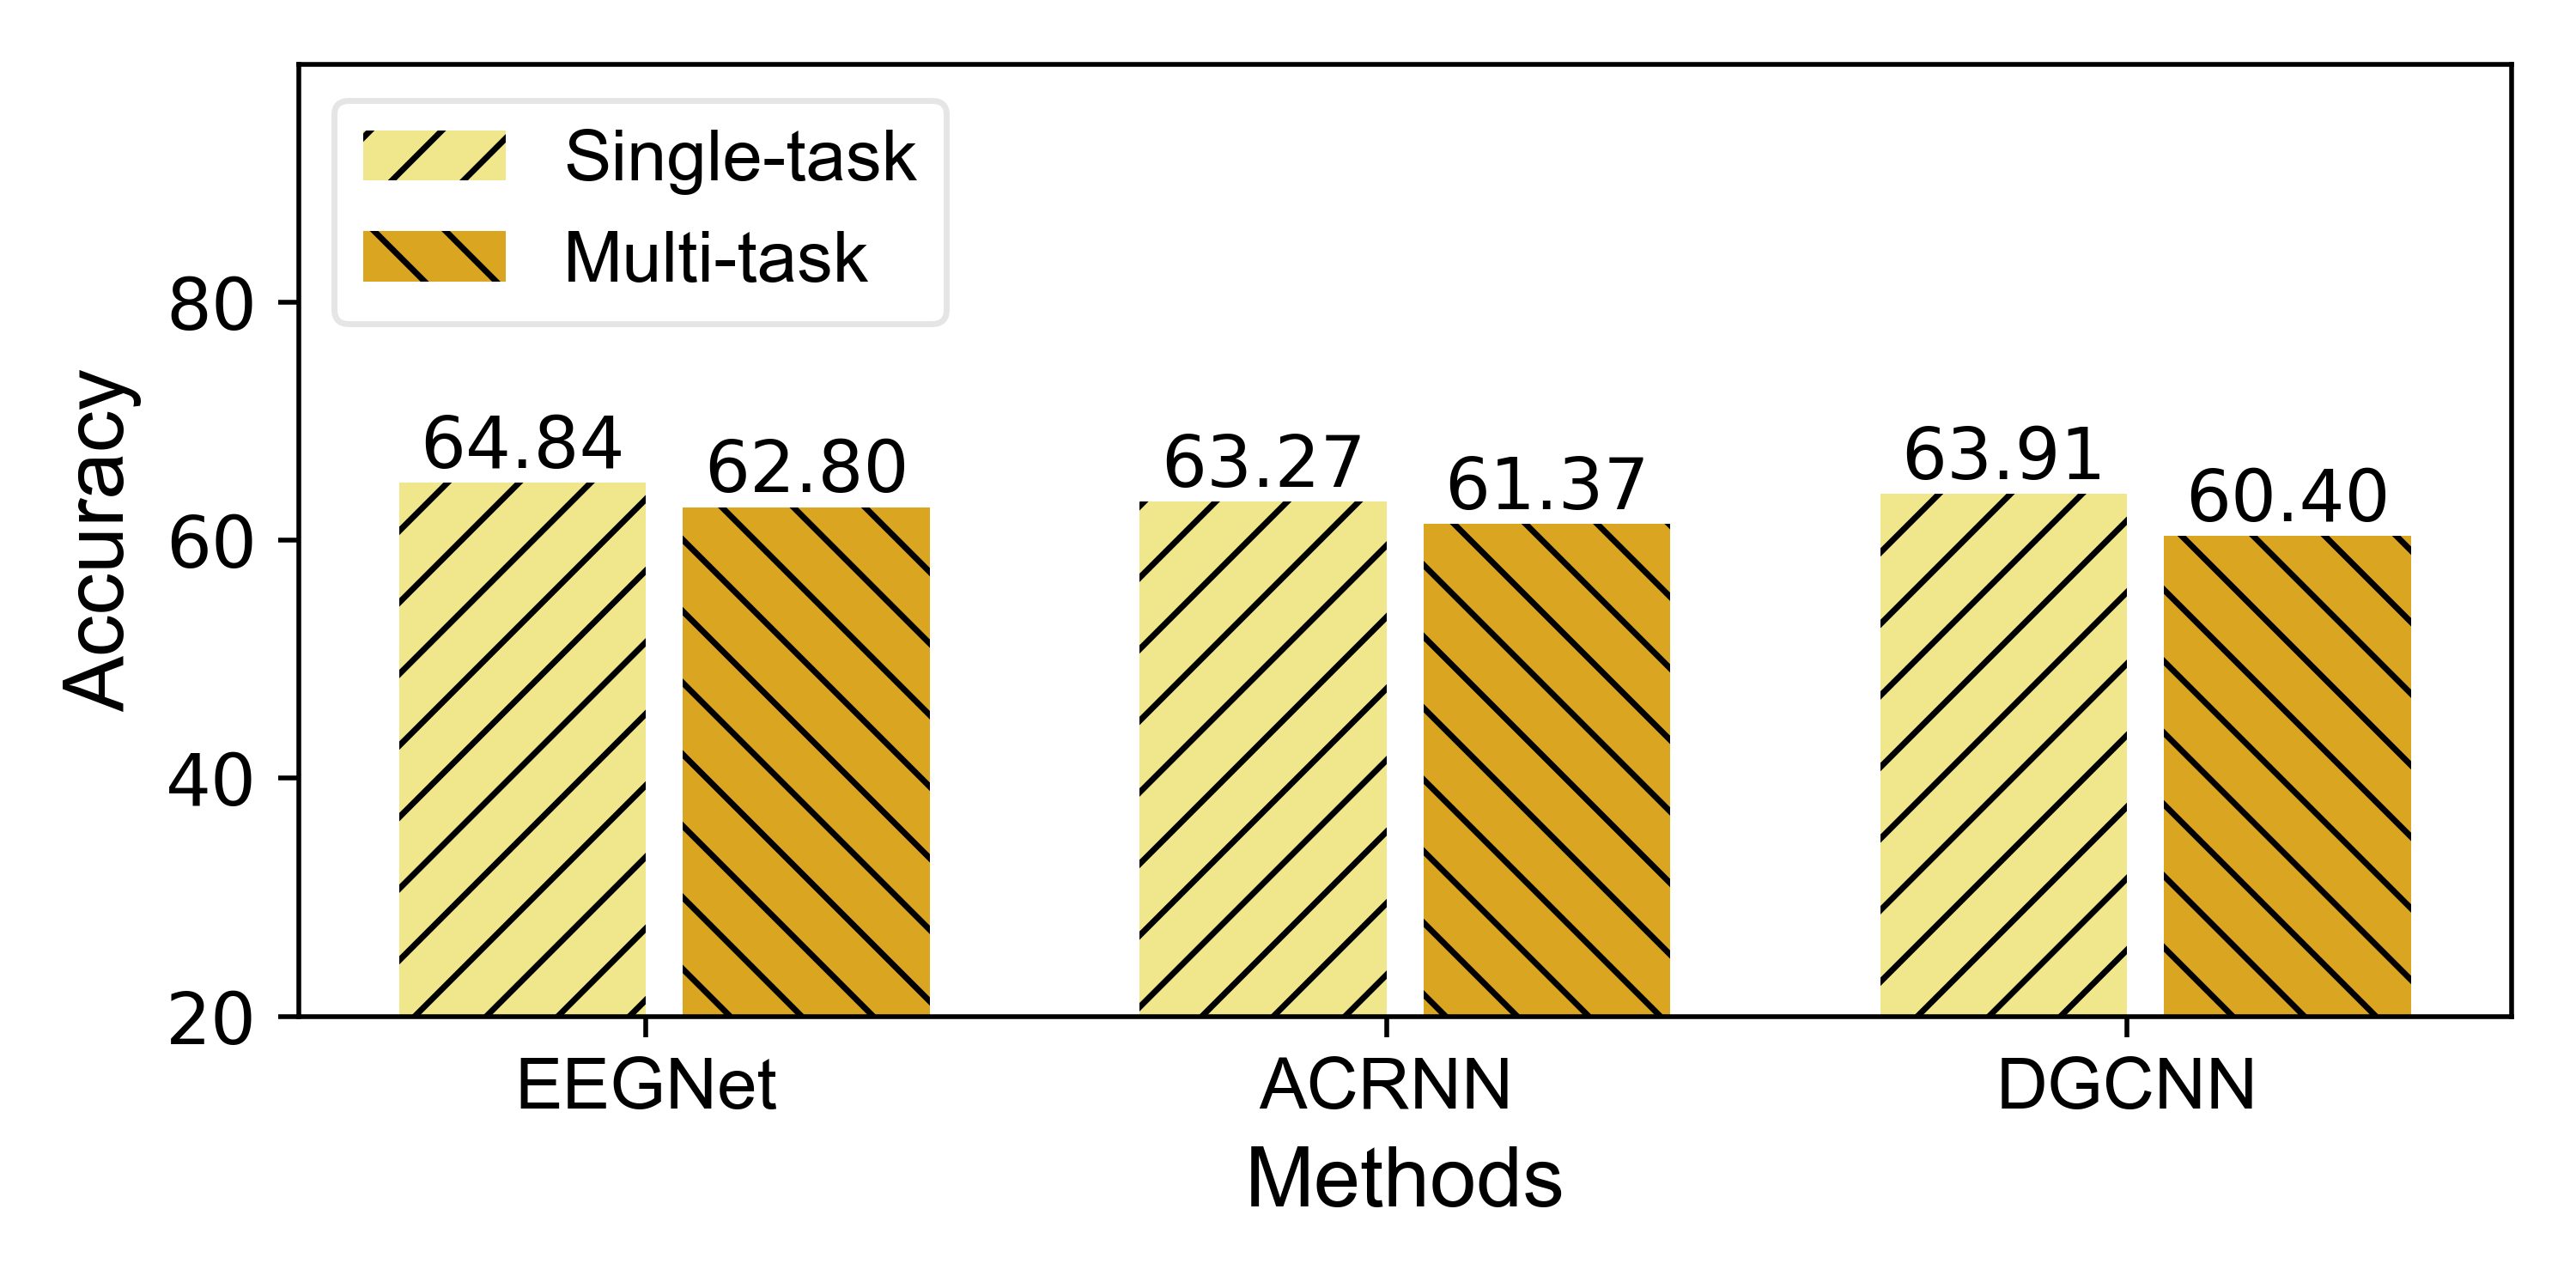
Multi-task learning. This section combines attention and emotion classification tasks using multi-task learning. We employ Hard Parameter Sharing (HPS) [37], a common approach in multi-task learning, using three deep learning models as the base models for experimentation. Figure 5 displays the subject-dependent and cross-subject experimental results. Each figure compares the accuracy of attention state classification when paired with one emotional task against the accuracy of attention state classification performed as a single task.
From the figure, it is evident that in both experimental scenarios, combining the valence dimension of emotion classification with attention state classification in multi-task settings significantly enhances performance across all three models. The arousal and dominance dimensions show improvements in some scenarios but declines in others. Specifically, there is an average increase of 3.10% in the valence dimension, while the arousal and dominance dimensions obtain average reductions of 1.30% and 3.67%, respectively. This is because, in multi-task learning, the correct combination of tasks can enhance performance, while an incorrect combination might lead to stagnation or even deterioration [38, 39]. Existing research suggests that the valence dimension of emotion is indeed most closely related to attention states [10], whereas there is no definitive research proving the correlation of arousal and dominance with attention. Additionally, the quality of labels in different dimensions greatly impacts task performance.
V Conclusion
In this paper, we have developed an experimental paradigm to gather a multi-label EEG dataset for classifying mental attention states in online learning, grounded in physiological and psychological principles. Employing this approach, we have systematically collected EEG data, corresponding labels, and auxiliary information from 20 subjects, spanning over 1,060 minutes of recorded data. Extensive qualitative and quantitative analyses have been executed to evaluate the dataset thoroughly. The findings affirm the high quality and reliability of the data collected. Additionally, our multi-task experiments, which integrate emotional labels, provide deeper insights into the interconnections between attention states and emotions, underscoring the dataset’s capacity to advance research in this domain. In future work, We will further explore the association between attention and the collected personality traits to clearly understand the underlying mechanisms. we will also expand the scale of this dataset by collecting EEG data from more subjects and additional trials.
Acknowledgment
This work was supported by the National Natural Science Foundation of China (62192781, 62202367), Project of China Knowledge Centre for Engineering Science and Technology.
References
- [1] F. C. Fortenbaugh, J. DeGutis, and M. Esterman, “Recent theoretical, neural, and clinical advances in sustained attention research,” Annals of the New York Academy of Sciences, vol. 1396, no. 1, pp. 70–91, 2017.
- [2] S. E. Petersen and M. I. Posner, “The attention system of the human brain: 20 years after,” Annual review of neuroscience, vol. 35, pp. 73–89, 2012.
- [3] V. Krüger, U. Mahlmeister, and G. Sommer, “Attentive face detection and recognition,” in Mustererkennung 1998: 20. DAGM-Symposium Stuttgart, 29. September–1. Oktober 1998. Springer, 1998, pp. 279–286.
- [4] F. Dolcos, P. C. Bogdan, M. O’Brien, A. D. Iordan, A. Madison, S. Buetti, A. Lleras, and S. Dolcos, “The impact of focused attention on emotional evaluation: An eye-tracking investigation.” Emotion, vol. 22, no. 5, p. 1088, 2022.
- [5] X. Du, C. Ma, G. Zhang, J. Li, Y.-K. Lai, G. Zhao, X. Deng, Y.-J. Liu, and H. Wang, “An efficient lstm network for emotion recognition from multichannel eeg signals,” IEEE Transactions on Affective Computing, vol. 13, no. 3, pp. 1528–1540, 2020.
- [6] S. Gupta and P. Kumar, “Attention recognition system in online learning platform using eeg signals,” in Emerging Technologies for Smart Cities: Select Proceedings of EGTET 2020. Springer, 2021, pp. 139–152.
- [7] H. Ghasemy, M. Momtazpour, and S. H. Sardouie, “Detection of sustained auditory attention in students with visual impairment,” in 2019 27th Iranian Conference on Electrical Engineering (ICEE). IEEE, 2019, pp. 1798–1801.
- [8] B. Wang, Z. Xu, T. Luo, and J. Pan, “Eeg-based closed-loop neurofeedback for attention monitoring and training in young adults,” Journal of Healthcare Engineering, vol. 2021, no. 1, p. 5535810, 2021.
- [9] M. Alirezaei and S. H. Sardouie, “Detection of human attention using eeg signals,” in 2017 24th National and 2nd International Iranian Conference on biomedical engineering (ICBME). IEEE, 2017, pp. 1–5.
- [10] B. Hu, X. Li, S. Sun, and M. Ratcliffe, “Attention recognition in eeg-based affective learning research using cfs+ knn algorithm,” IEEE/ACM transactions on computational biology and bioinformatics, vol. 15, no. 1, pp. 38–45, 2016.
- [11] Y. Zhang, H. Liu, D. Wang, D. Zhang, T. Lou, Q. Zheng, and C. Quek, “Cross-modal credibility modelling for eeg-based multimodal emotion recognition,” Journal of Neural Engineering, 2024.
- [12] Y. Wu, H. Liu, D. Zhang, Y. Zhang, T. Lou, and Q. Zheng, “Autoeer: automatic eeg-based emotion recognition with neural architecture search,” Journal of Neural Engineering, vol. 20, no. 4, p. 046029, 2023.
- [13] S. Aggarwal, M. Lamba, K. Verma, S. Khuttan, and H. Gautam, “A preliminary investigation for assessing attention levels for massive online open courses learning environment using eeg signals: An experimental study,” Human Behavior and emerging technologies, vol. 3, no. 5, pp. 933–941, 2021.
- [14] D. Ni, S. Wang, and G. Liu, “The eeg-based attention analysis in multimedia m-learning,” Computational and Mathematical Methods in Medicine, vol. 2020, no. 1, p. 4837291, 2020.
- [15] X. Li, D. Song, P. Zhang, Y. Zhang, Y. Hou, and B. Hu, “Exploring eeg features in cross-subject emotion recognition,” Frontiers in neuroscience, vol. 12, p. 162, 2018.
- [16] A. Wiberg, M. Ng, Y. Al Omran, F. Alfaro-Almagro, P. McCarthy, J. Marchini, D. L. Bennett, S. Smith, G. Douaud, and D. Furniss, “Handedness, language areas and neuropsychiatric diseases: insights from brain imaging and genetics,” Brain, vol. 142, no. 10, pp. 2938–2947, 2019.
- [17] G. Zhao, Y. Ge, B. Shen, X. Wei, and H. Wang, “Emotion analysis for personality inference from eeg signals,” IEEE transactions on affective computing, vol. 9, no. 3, pp. 362–371, 2017.
- [18] C. K. Toa, K. S. Sim, and S. C. Tan, “Electroencephalogram-based attention level classification using convolution attention memory neural network,” IEEE Access, vol. 9, pp. 58 870–58 881, 2021.
- [19] C. Sethi, H. Dabas, C. Dua, M. Dalawat, and D. Sethia, “Eeg-based attention feedback to improve focus in e-learning,” in Proceedings of the 2018 2nd international conference on computer science and artificial intelligence, 2018, pp. 321–326.
- [20] P. A. Hancock, “A dynamic model of stress and sustained attention,” Human factors, vol. 31, no. 5, pp. 519–537, 1989.
- [21] K. H. Nuechterlein, R. Parasuraman, and Q. Jiang, “Visual sustained attention: Image degradation produces rapid sensitivity decrement over time,” Science, vol. 220, no. 4594, pp. 327–329, 1983.
- [22] Y. Zhang, H. Liu, D. Zhang, X. Chen, T. Qin, and Q. Zheng, “Eeg-based emotion recognition with emotion localization via hierarchical self-attention,” IEEE Transactions on Affective Computing, 2022.
- [23] H. Liu, T. Lou, Y. Zhang, Y. Wu, Y. Xiao, C. S. Jensen, and D. Zhang, “Eeg-based multimodal emotion recognition: A machine learning perspective,” IEEE Transactions on Instrumentation and Measurement, 2024.
- [24] H. A. Wadlinger and D. M. Isaacowitz, “Fixing our focus: Training attention to regulate emotion,” Personality and social psychology review, vol. 15, no. 1, pp. 75–102, 2011.
- [25] H. Schlosberg, “Three dimensions of emotion.” Psychological review, vol. 61, no. 2, p. 81, 1954.
- [26] J.-R. Duann, P.-C. Chen, L.-W. Ko, R.-S. Huang, T.-P. Jung, and C.-T. Lin, “Detecting frontal eeg activities with forehead electrodes,” in Foundations of Augmented Cognition. Neuroergonomics and Operational Neuroscience: 5th International Conference, FAC 2009 Held as Part of HCI International 2009 San Diego, CA, USA, July 19-24, 2009 Proceedings 5. Springer, 2009, pp. 373–379.
- [27] A. R. Clarke, R. J. Barry, and S. Johnstone, “Resting state eeg power research in attention-deficit/hyperactivity disorder: A review update,” Clinical Neurophysiology, vol. 131, no. 7, pp. 1463–1479, 2020.
- [28] E. Magosso, F. De Crescenzio, G. Ricci, S. Piastra, and M. Ursino, “Eeg alpha power is modulated by attentional changes during cognitive tasks and virtual reality immersion,” Computational intelligence and neuroscience, vol. 2019, no. 1, p. 7051079, 2019.
- [29] J. Misselhorn, U. Friese, and A. K. Engel, “Frontal and parietal alpha oscillations reflect attentional modulation of cross-modal matching,” Scientific reports, vol. 9, no. 1, p. 5030, 2019.
- [30] J. A. Suykens and J. Vandewalle, “Least squares support vector machine classifiers,” Neural Processing Letters, vol. 9, no. 3, pp. 293–300, 1999.
- [31] J. R. Quinlan, “Induction of decision trees,” Machine learning, vol. 1, pp. 81–106, 1986.
- [32] L. Breiman, “Random forests,” Machine Learning, vol. 45, no. 1, pp. 5–32, 2001.
- [33] V. J. Lawhern, A. J. Solon, N. R. Waytowich, S. M. Gordon, C. P. Hung, and B. J. Lance, “Eegnet: a compact convolutional neural network for eeg-based brain–computer interfaces,” Journal of neural engineering, vol. 15, no. 5, p. 056013, 2018.
- [34] W. Tao, C. Li, R. Song, J. Cheng, Y. Liu, F. Wan, and X. Chen, “Eeg-based emotion recognition via channel-wise attention and self attention,” IEEE Transactions on Affective Computing, vol. 14, no. 1, pp. 382–393, 2020.
- [35] A. V. Phan, M. Le Nguyen, Y. L. H. Nguyen, and L. T. Bui, “Dgcnn: A convolutional neural network over large-scale labeled graphs,” Neural Networks, vol. 108, pp. 533–543, 2018.
- [36] M. L. McHugh, “The chi-square test of independence,” Biochemia medica, vol. 23, no. 2, pp. 143–149, 2013.
- [37] Y. Zhang and Q. Yang, “A survey on multi-task learning,” IEEE Transactions on Knowledge and Data Engineering, vol. 34, no. 12, pp. 5586–5609, 2021.
- [38] R. Caruana, “Multitask learning,” Machine learning, vol. 28, pp. 41–75, 1997.
- [39] A. R. Zamir, A. Sax, W. Shen, L. J. Guibas, J. Malik, and S. Savarese, “Taskonomy: Disentangling task transfer learning,” in Proceedings of the IEEE conference on computer vision and pattern recognition, 2018, pp. 3712–3722.