Can Features for Phishing URL Detection Be Trusted Across Diverse Datasets? A Case Study with Explainable AI
Abstract.
Phishing has been a prevalent cyber threat that manipulates users into revealing sensitive private information through deceptive tactics, designed to masquerade as trustworthy entities. Over the years, proactively detection of phishing URLs (or websites) has been established as an widely-accepted defense approach. In literature, we often find supervised Machine Learning (ML) models with highly competitive performance for detecting phishing websites based on the extracted features from both phishing and benign (i.e., legitimate) websites. However, it is still unclear if these features or indicators are dependent on a particular dataset or they are generalized for overall phishing detection. In this paper, we delve deeper into this issue by analyzing two publicly available phishing URL datasets, where each dataset has its own set of unique and overlapping features related to URL string and website contents. We want to investigate if overlapping features are similar in nature across datasets and how does the model perform when trained on one dataset and tested on the other. We conduct practical experiments and leverage explainable AI (XAI) methods such as SHAP plots to provide insights into different features’ contributions in case of phishing detection to answer our primary question, “Can features for phishing URL detection be trusted across diverse dataset?”. Our case study experiment results show that features for phishing URL detection can often be dataset-dependent and thus may not be trusted across different datasets even though they share same set of feature behaviors.
1. Introduction
Phishing attacks come in various forms, such as deceptive emails or mobile messages attached with fraudulent website URLs, all designed to trick users into revealing sensitive information or click on to malicious attachments (Thomson, 2023). Moreover, the potential abuse of generative AI and large language models may add more stress towards defenders to cope with these attacks (Roy et al., 2024; Gupta et al., 2023; Shibli et al., 2024). According to recent statistics, the United States alone had a total of around phishing victims, with financial losses exceeding $52 million due to these attacks (Main, 2023). Historically, phishing website detection relied on traditional blacklisting where various publicly available blacklists like PhishTank (Group, [n. d.]) and other private blacklists are leveraged. While these black-box detection models may achieve high accuracy, they lack transparency and explainability. Due to this shortcoming, black-box models hinder trust and adoption in practice. Moreover, the dynamic nature of phishing website data involves concept drift (Menon and Gressel, 2021), which describes a situation where the relationship between the input data and the target variable varies over time in an online supervised learning environment. Although detecting the concept drift and retraining the model with newly extracted features (Tan et al., 2018) can partially resolve the issue, the overall feature importance in different deployment scenarios with different schemes of features can still be varied and not generalized.
To bridge this gap, SHAP (SHapley Additive exPlanations), a popular explainable AI (XAI) method, can be used to interpret the individual (i.e., local explanation) and overall model predictions, which can aid in the decision-making process (Lundberg and Lee, 2017). In this paper, we propose to leverage XAI approaches to understand the generalization of phishing URL detection features across datasets. We incorporate XAI as a means to provide insight into the model’s decision-making process, shedding light on features which are more impactful in the classification of an instance as phishing versus benign. Our primary objective is to answer the following question- “Can features’ importance for phishing URL detection be trusted across diverse datasets?”. By answering the question, we want to know if certain set of features are ubiquitous for phishing URLs detection, or if the features are closely tied to a specific dataset.
In addition, we also evaluate the performance of different ML models on multiple datasets to select the best ML model for generating SHAP explanations. Furthermore, we create various experiment scenarios where training and testing portion of one dataset is used with another dataset. This is particularly beneficial when common overlapping features are present in multiple datasets, and training and testing with different datasets can provide insights on their generalizability. We hereby hypothesize that the claimed accuracy of any particular ML model achieved by the researchers on a specific dataset, may get declined while the test environment changes or new data appears. If this is true, then we have got our answer for the primary question and need to be cautious about phishing detection results.
To guide our experiments in this paper, we are driven by the following three research questions (RQs).
RQ1: What are the top impactful overlapping features and their impact distribution for a specific prediction outcome across multiple datasets for phishing detection?
RQ2: When multiple datasets share overlapping features, how do a ML-based phishing detection model perform, when trained on one dataset and tested on another dataset? Does it improve the detection performance if both datasets are merged for training?
RQ3: Are overall features’ contribution ranks for the shared overlapping phishing URL features showing a similar contribution order in different datasets?
In summary, motivated by these above research questions we make the following major contributions in this paper:
-
•
Analyze overlapping features from multiple phishing URL datasets consisting more than unique URLs.
-
•
Answer the RQs with experimental evidences if features for phishing URL detection can be generalized across datasets where training and testing of ML models are conducted on different datasets.
-
•
Use popular XAI SHAP module to provide new insights and find deviations in features’ contribution behaviors for phishing detection when multiple datasets are involved.
The rest of the paper is organized as follows: Section 2 discusses related works on AI based phishing detection. Section 3 presents the methodology and results with data-driven insights from the experiments. Section 4 discuss the current state and limitations in the present study while Section 5 concludes the paper.
2. RELATED WORKS
ML and Deep Learning (DL) based phishing detection research has seen significant progress with the advancement of the Artificial Intelligence. In literature, there are number of studies proposed to incorporate ML for phishing URL, malicious domain or website detection and supporting law-enforcement take-down decisions based on URL features and webpage contents (Karim et al., 2023; Chinnasamy et al., 2022; Bouijij and Berqia, 2021; Zamir et al., 2020; Pritom et al., 2020; Pritom and Xu, 2022; Abdelhamid et al., 2017; Xu et al., 2013; Jain and Gupta, 2018; Gupta et al., 2021; Maroofi et al., 2020; Yilmaz et al., 2020). However, a common limitation across these studies is the lack of interpretability of the underlying decision-making processes of the models used, often referred to as the “black box” problem. Furthermore, there is a scarcity of research that compares the performance and feature importance across diverse datasets. Sarasjati et al. (Sarasjati et al., 2022) and Preeti et al. (Preeti and Sharma, 2023) presented comparison of various ML models across multiple phishing website datasets, and the usage of multiple datasets with varying class labels allows for a more robust analysis. These studies may provide insights about the best available ML models with a given set of features, but they can not provide any insights on the interpretation or explainability of the models. Next, Rugangazi et al. (Rugangazi and Okeyo, 2023) proposed an automated phishing detection strategy that picks important features using the global feature importance method to achieve high accuracy but it is limited to a single dataset and does not discuss model interpretability to assess the features generalizability for phishing detection. In another study, Ali et al. (Aljofey et al., 2020) proposed to rely on URL character sequences using character-level convolutional neural network (CNN) while Tao et al. (Feng and Yue, 2020) proposed character-level recurrent neural network (RNN) for phishing detection. However, these models mostly lack transparency for detection of phishing versus benign URLs, which may be targeted by adversaries by tweaking domain names to avoid detection. Moreover, Youness et al. (Mourtaji et al., 2021) showed CNN outperforming blacklisting, lexical, content-based, and visual & behavioral similarity methods. In literature, we also find articles where natural language processing (NLP) is used with ML to effectively detect phishing attempts (Sahingoz et al., 2019).
In phishing research, there are a number of features explored in literature, but among them lexical features are the ones those are very easily available and used mostly (Verma and Das, 2017; Rao et al., 2020). Other than lexical features, we observe URL statistics, HTML code, webpage javascript, webpage text, website external links, website structure, domain ranking, SSL certificates, TLD reputation, WHOIS data, DNS, and passive DNS based features (Das Guptta et al., 2024; Opara et al., 2024; Aljofey et al., 2022). We also find pre-trained transformer-based models such as BERT for feature extraction from websites (Elsadig et al., 2022), which suffers from dataset-dependency biases.
Furthermore, researchers have proposed benchmark datasets for phishing detection with combination of four categories of features based on URL, website’s contents (HTML and Javascipts), external third-party (WHOIS, Google, OpenPageRank) or visual similarity using common sources (e.g., PhishTank, OpenPhish, Alexa, PhishMonger) (Chiew et al., 2018; Hannousse and Yahiouche, 2021; Zeng et al., 2020; El Aassal et al., 2020). In our case studies, we have analyzed the features that are common within these benchmark datasets. In summary, all the existing approaches either lack transparency (i.e., interoperability) or generalizability (i.e., reproducing results with another dataset context). In this paper, we showcase how XAI can bring transparency of detection models as well as how they can be leveraged to test the generalizability of models across datasets.
3. Experimental Case Studies and Insights
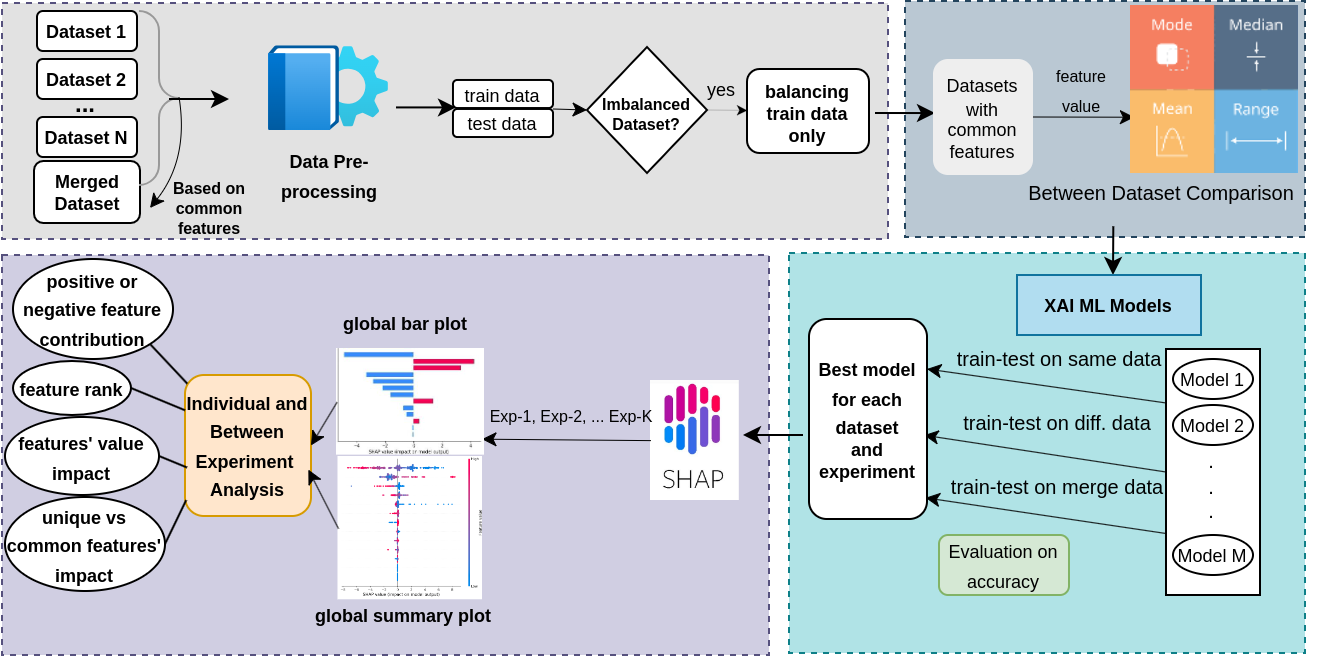
To address the RQs, we propose the methodology highlighted in Fig. 1, which has the following five components– (i) Datasets collection and pre-processing; (ii) Feature analysis; (iii) Train and test XAI models; (iv) Evaluate model performances in various dataset-based experiment scenarios; (v) Generate insights from XAI outputs.
3.1. Data Collection and Data Pre-processing
3.1.1. Dataset-1 ()
This dataset is collected from Vrbančič et al. (Vrbančič et al., 2020) and consists of instances with being benign and being phishing URLs. Additionally, there are features in this dataset taken from URL attributes and web contents. The dataset annotators considered different types of feature columns based on the whole URL, domain name, URL directory, URL file name, URL parameters, resolving URL, and third-party services.
3.1.2. Dataset-2 ()
This dataset is collected from Kaggle (Winson, 2024) that consists of row entries with being benign and being phishing samples. There are total features in this dataset including features extracted from the URL, the HTML content, and the web domain.
3.1.3. Data Pre-processing
By analyzing the above two datasets, and , we find common features between them (while it is important to note that some common features have different names given by the annotators in these datasets, which is addressed by manually looking at the feature definitions of both datasets).
Addressing missing values If there is a null value in any rows for a particular feature (i.e., a column in the dataset), we fill it with the median value of that corresponding feature column.
Removal of features We have removed the columns that have no insights and only provided a single constant value in all rows. The preprocessing steps resulted in dataset being reduced to features, being reduced to usable features.
| Dataset | Train | Test | ||
|---|---|---|---|---|
| Phish | Benign | Phish | Benign | |
| 40,614 | 40,614 | 9,209 | 17,386 | |
| 6,770 | 6,831 | 2,945 | 2,885 | |
| 13,570 | 13,631 | 12,154 | 20,271 | |
3.1.4. Correcting Data Imbalance and Optimizing Data Splitting
Dataset is already balanced for both classes, while we observe imbalance in , with benign and phishing instances (ratio of ). This imbalance can lead to biased models, as they tend to more accurate in predicting the majority class, leading to poor generalization performance when predicting minority class. To address this issue, we adopt the Synthetic Minority Over-sampling Technique (SMOTE) (Chawla et al., 2002), which is a popular oversampling method that generates synthetic instances of the minority class by interpolating between existing minority instances. We apply SMOTE only on the training portion of dataset . This can produce more comparative model outcomes with the already balanced . In this paper, we adopt a split ratio for the train-test data splits. After correcting class imbalance, for some experiment scenarios, we have merged the two datasets and considering the common features (defined in table 2) and created a third dataset, . To maintain the class balance and to generate fair explanation from SHAP, in , we have taken 6,800 random instances for each groups (phishing and benign) in ’s training portion and merged them with the ’s training portion to get a total of phishing instances and benign instances. The test data for the merged dataset is the direct concatenation of the test data for and . Table 1 depicts the distribution of all datasets , , and .
3.2. Feature Analysis
In both datasets and , we have found that the majority of the features are extracted from the URL string (i.e., lexical features). Moreover, dataset does not have any HTML and JavaScript features while those are present in (i.e., existence of login form, iframe, favicon-based external links, and click event). So, between these two datasets, there are differences in the feature list if we consider all features. However, we want to know the impact of unique features () and the common features () as listed in Table 2 on the prediction models. That is why we consider the full feature list () along with only the common ones () to evaluate prediction model performance.
| ID | Feature Name | Feature Definition |
|---|---|---|
| qty_dot_url | Number of dot characters ‘.’ in URL | |
| qty_equal_url | Number of ’=’ character in URL | |
| domain_length | Length of the domain name string | |
| url_google_index | If the URL is indexed by Google | |
| qty_dollar_url | Number of ’$’ character in URL | |
| qty_slash_url | Number of ’/’ character in URL | |
| qty_redirects | Number of redirects for landing page | |
| url_shortened | If the URL is shortened | |
| tld_present _params | If TLD present in the parameters of URL | |
| qty_comma_url | Number of ’,’ character in URL | |
| qty_hyphen_url | Number of ’-’ character in URL | |
| qty_underline_url | Number of ’_’ character in URL | |
| length_url | Length of entire URL | |
| qty_percent_url | Number of ’%’ character in URL | |
| qty_asterisk_url | Number of ’*’ character in URL | |
| qty_questionmark _url | Number of ’?’ characters in URL | |
| qty_tilde_url | Number of ’’ character in URL | |
| qty_at_url | Number of ’@’ character in URL | |
| domain_in_ip | If the domain is an IP address | |
| qty_and_url | Number of ’&’ character in URL |
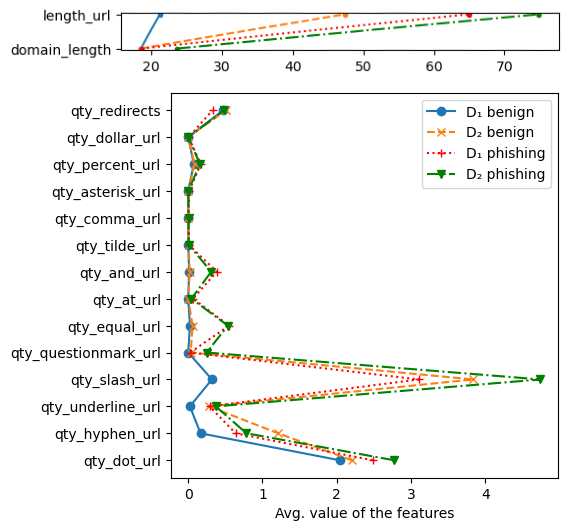
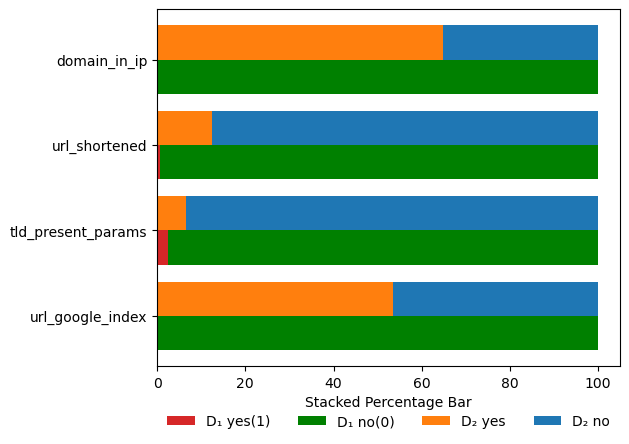
We also provide the basic statistics (i.e., mean values) comparison plot for both datasets in terms of phishing and benign URLs as shown in Fig. 2 and Fig. 3. This analysis is important, because if there exists innate differences in the dataset feature values, then it indicates an obvious difference in the explanations as well. Now, Fig. 2 shows that the mean values for the numerical features are very similar in both the datasets. However, in Fig. 3, the percentages of binary features’ values for doimain_in_ip and url_google_index features are highly deviating between the datasets while the other binary features have very similar distribution. Additionally, we have also checked other statistical values such as min, max, median, and standard deviation for the features and observe a very similar values across the datasets.
3.3. Train and Test with Supervised Models
Next, we experiment with various machine learning models that can be further incorporated with SHAP XAI module. We train and test with different dataset portions in various experiment scenarios leveraging models such as Logistic Regression (LR), Decision Tree (DT), Random Forest (RF), Naive Bayes (NB), Gradient Boosting Machine (GBM), XGBoost (XGB), Explainable Boosting Machine (EBM) and Support Vector Machine (SVM). The performances of these ML models are evaluated using the standard evaluation metrics- Accuracy, Precision, Recall, and F1 Score. Among both the and datasets, XGBoost (XGB) performs the best for the detection of phishing URLs as shown in Table 3 with an accuracy of in dataset and in dataset when considered all features. The XGB model is followed by Random Forest with an accuracy of for and for . Then, in order from highest accuracy to least accuracy we observe Explainable Boosting Machine (EBM), Decision Tree, Gradient Boosting Machine, Logistic Regression, Naive Bayes, and Support Vector Machine models. Thus, we use the XGBoost model to generate SHAP explanation plots for the various experiment scenarios in finding the feature’s contributions.
3.4. Model Evaluation in Different Experiments
To strengthen our hypothesis on declining model accuracy in multiple dataset scenarios, we conduct several experiments with different training and testing data portions. The experiment scenarios include finding features’ contributions when training and testing the model on the same dataset with all features, training and testing the model on the same dataset with only common features, and training the model on one dataset but testing on a different dataset, and finally training and testing on a merged dataset. We use the XGB model in this experiment scenarios to understand the features’ behavior. Table 4 shows that using all features in a train-test scenario on the same dataset (i.e., Exp-1 and Exp-2) provides us with the best accuracy. Also, only using the 20 common features and conducting the train-test on the same dataset (i.e., Exp-3, Exp-4) gives us reasonably good accuracy results. However, when we apply train-test scenarios from different datasets, the accuracy drops drastically to when model trained on and tested on dataset , and when trained on and tested on . In contrast, with the merged dataset in Exp-7, the accuracy is drastically increased to 91%, which can be implemented to get more generalized results.
| Dataset | Metrics | LR | DT | RF | NB | GBM | XGB | EBM | SVM |
|---|---|---|---|---|---|---|---|---|---|
| Acc. | 90.4 | 95.5 | 97.0 | 86.0 | 94.9 | 97.1 | 96.8 | 71.6 | |
| Prec. | 86.0 | 93.1 | 94.5 | 88.1 | 90.5 | 94.9 | 94.8 | 55.8 | |
| Recall | 86.3 | 94.0 | 96.9 | 68.9 | 95.4 | 96.7 | 96.2 | 86.3 | |
| F-1 | 86.2 | 93.6 | 95.7 | 77.3 | 92.9 | 95.8 | 95.5 | 67.7 | |
| Acc. | 80.0 | 97.2 | 98.6 | 74.1 | 96.2 | 99.0 | 98.2 | 60.2 | |
| Prec. | 81.4 | 97.0 | 98.5 | 71.2 | 96.4 | 99.1 | 98.3 | 56.8 | |
| Recall | 78.3 | 97.5 | 98.7 | 81.8 | 96.2 | 98.8 | 98.1 | 88.1 | |
| F-1 | 79.8 | 97.2 | 98.6 | 76.2 | 96.3 | 99.0 | 98.2 | 69.1 |
| Features | ID | Experiment | Acc. | Prec. | Rec. | F1 |
| All (98) | Exp-1 | train on , test on | 97.1 | 94.9 | 96.7 | 95.8 |
| All (79) | Exp-2 | train on , test on | 99.0 | 99.1 | 98.8 | 99.0 |
| Exp-3 | train on , test on | 92.0 | 92.0 | 92.0 | 92.0 | |
| Exp-4 | train on , test on | 93.0 | 93.0 | 93.0 | 93.0 | |
| Common | Exp-5 | train on , test on | 51.0 | 59.0 | 51.0 | 36.0 |
| (20) | Exp-6 | train on , test on | 59.0 | 70.0 | 58.0 | 50.0 |
| Exp-7.1 | train on , test on | 91.0 | 92.0 | 91.0 | 91.0 | |
| Exp-7.2 | train on , test on | 91.0 | 91.0 | 91.0 | 91.0 | |
| Exp-7.3 | train on , test on | 92.0 | 92.0 | 92.0 | 92.0 |
3.5. Insights with XAI Using SHAP Plots
In Explainable AI, feature importance can be classified into two categories: local and global. Local relevance refers to each feature’s contribution to the prediction of a single instance, whereas global importance assesses each feature’s overall impact on all instances. Phishing attempts are ubiquitous and diversified, therefore global importance is necessary to discover features that regularly influence the model’s predictions, providing a more comprehensive view of feature significance. Here we apply the SHAP TreeExplainer object on the XGB model in all 7 experimental scenarios. Then, we have taken an equal number of phishing and legitimate instances from the test data and fed that to the explanation module to generate the corresponding SHAP values and plots. Each bar in the bar plot corresponds to a feature used in the phishing website detection model, where the length of the bar represents the mean absolute SHAP value for that feature - a measure of the impact of the feature on the model’s output. A longer bar indicates a higher average impact, meaning that the feature strongly influences the model’s predictions. This bar plot is also color-coded where the red bar represents the overall positive contribution and the blue bar represents a negative contribution of a specific feature. The summary plot provides us the overall picture of how each feature’s actual value range (high, medium, or low) impacts the prediction for categorical target variable (i.e., phishing and benign in our case). Below, we discuss our findings of the features’ importance for each of the 7 experiment scenarios.
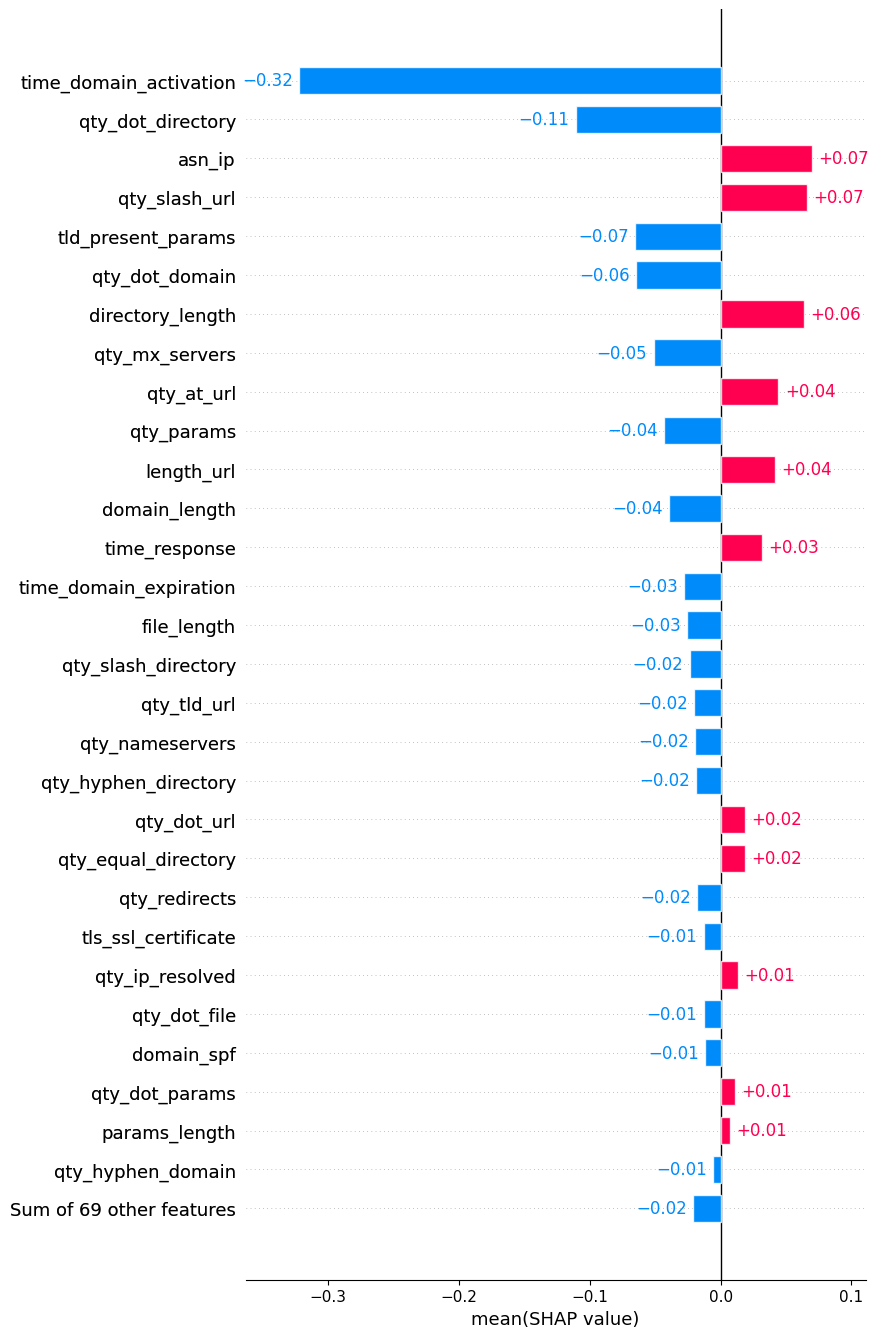
3.5.1. Exp-1 Feature Explanation
Fig. 4 shows the top 30 influential features where we observe that 19 features are contributing negatively (blue bars), meaning on average, these features have contributed towards the benign class. Some of the highlighted negative contributing features are time_domain_activation (), qty_dot_directory (), tld_present _params (), qty _dot_domain (), qty_mx_servers (), etc. From these 19 features, 3 are from the common feature list (, and ). Figure 4 also shows that from the remaining 11 positively contributing features, top 4 are qty_slash_url () (+0.07),qty_at_url () (+0.04), length_url () (+0.04), and qty_dot_url () (+0.02).
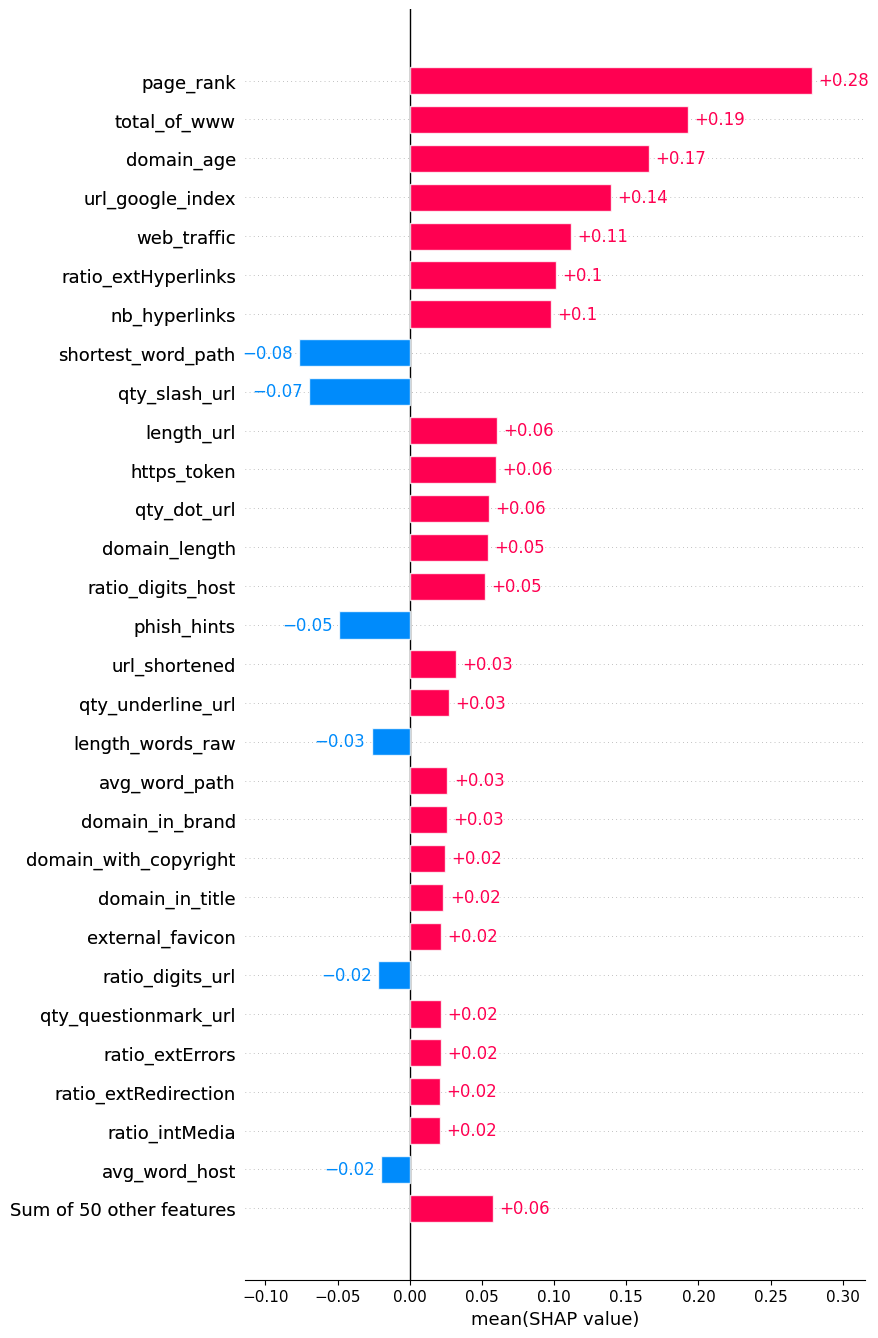
3.5.2. Exp-2 Feature Explanation
Fig. 5 shows that out of the top most influential features are positively contributing (red bars). Some of the notable features are page_rank (), total_of_www (), domain_age (), url_google_index () etc. From these positively contributing features, are in the . Interestingly, we can clearly identify that a particularly common feature domain_length () is contributing positively in this case, which has shown a negative contribution in Exp-1 scenario. From the remaining negatively contributing features, some notable ones are shortest_word_path (), qty_slash_url (), phish_hints (), length_words_raw etc. Here, the contribution direction of feature qty_slash_url (), which is from the common features, is also completely opposite of the observation in Exp-1 scenario. Another interesting insight is that the relative order of the common features based on the most influential contribution is also altered in Exp-2 compared to Exp-1. For example, in Exp-1 feature url_google_index () is not even in the top 30. However, in Exp-2 it is ranked as the -th most contributing feature. From Exp-1 and Exp-2 observations, we have the following insights.
Insight 1: From the top 30 most impactful features, the majority are unique features, meaning they are only present in one dataset, which shows the dataset-dependent features in phishing detection.
Insight 2: Even if common features are present in multiple phishing datasets, these features can contribute for predicting phishing class in one dataset while contribute for predicting benign class in the other dataset context.
Insight 3: A particular feature may contribute positively for phishing detection in one dataset while the same feature may impact negatively in another dataset scenario.
3.5.3. Exp-3 Feature Explanation
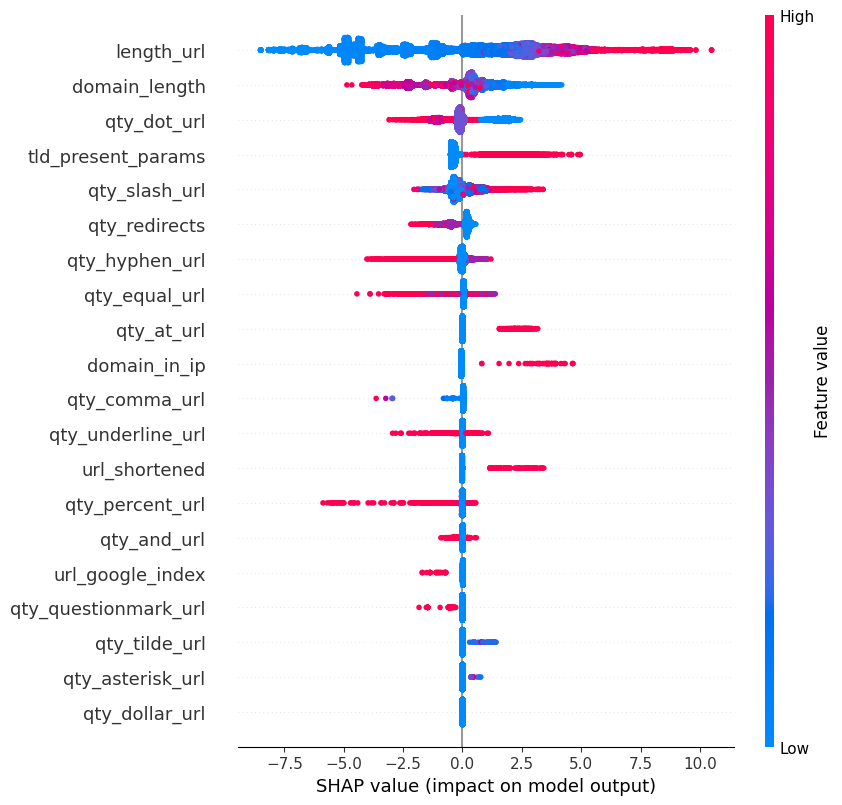
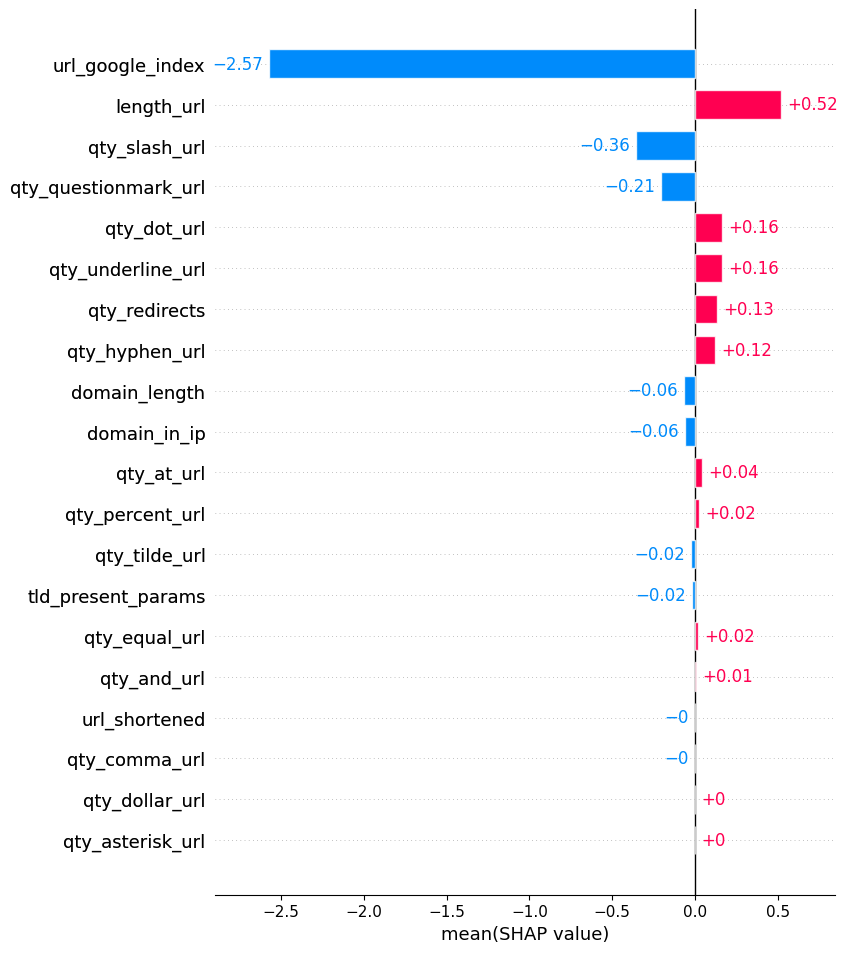
In this experiment scenario, we are using the 20 common features where training and testing are both conducted on dataset . For this and the next experiment, we choose to depict the summary plot as it will show us the deviation in the value ranges for both dtasets.
From the summary plot Fig. 6(a), we can see that higher value of features qty_percent_url, tld_present_params, qty_slash_url, qty_at_url, domain_in_ip,
url_shortened and in addition, lower value of features domain_length, qty_dot_url, qty_redirects, qty_hyphen_url, url_google_index,
qty_questionmark_url are contributing more on phishing prediction.
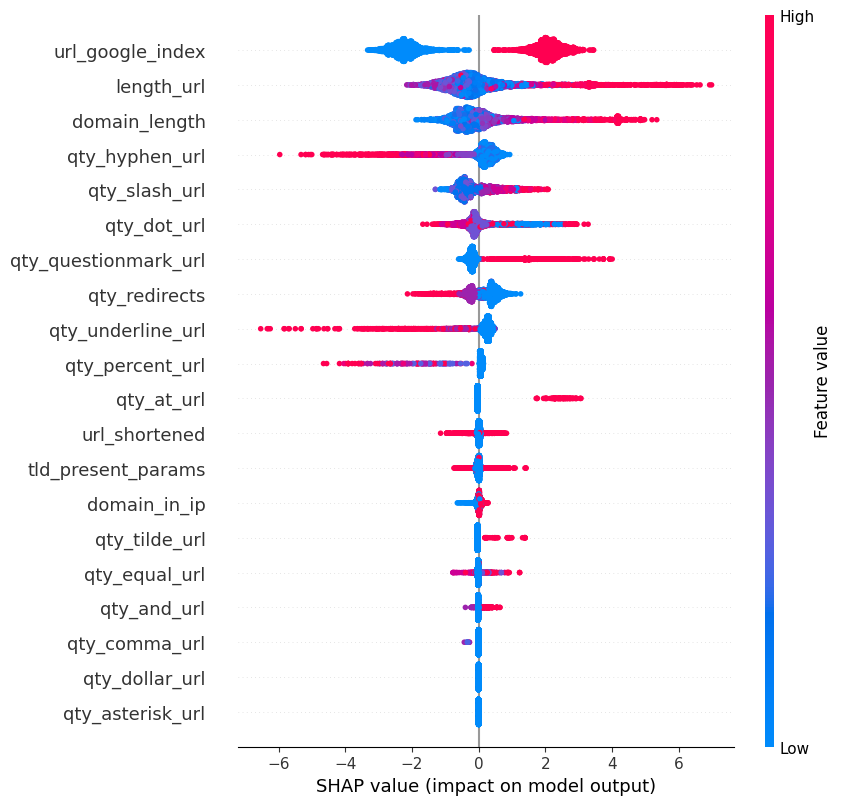
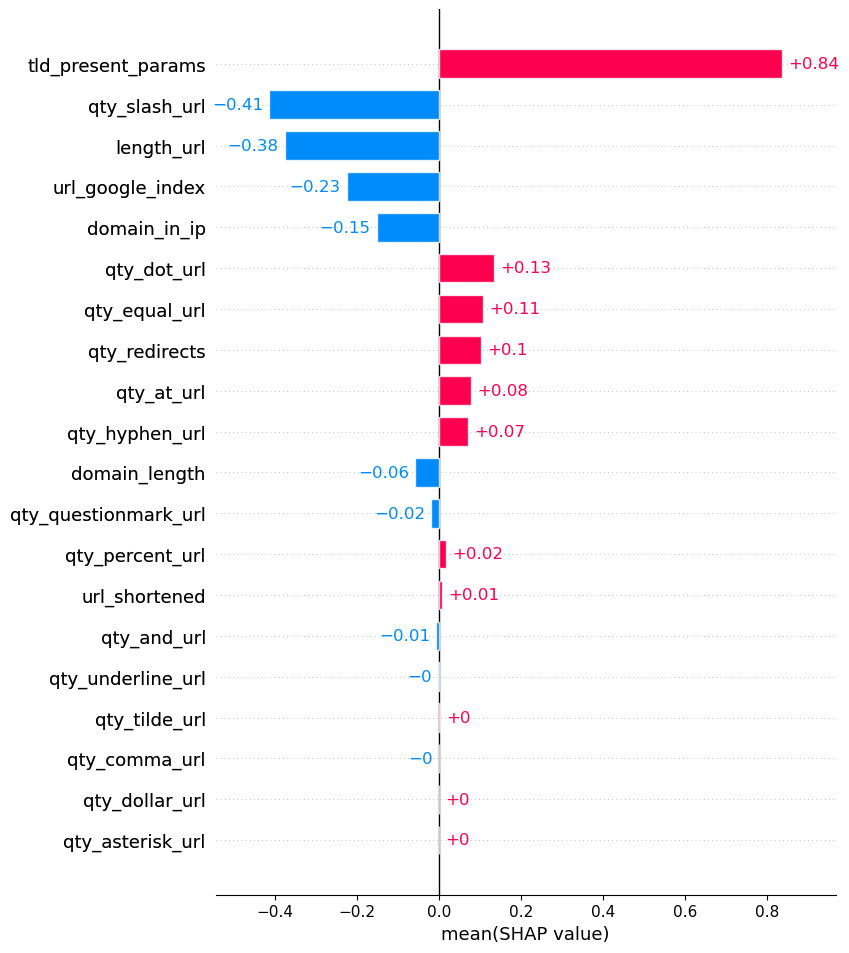
3.5.4. Exp-4 Feature Explanation
In this scenario, we are using the same common 20 features as Exp-3 but on a different dataset . We expect that the apparent ranking order of features’ contribution will be similar as both datasets share these same features. However, we observe the opposite of it. The summary plot in Fig. 6(b) shows that higher values of features url_google_index, qty_percent_url, domain_length, qty_slash_url, qty_questionmark_url, qty_at _url and lower values of features qty_dot_url, qty_redirects, qty_hyphen_url, qty_underline_url are contributing more on phishing prediction. This answers RQ1 and unlike in Exp-3, we see that the lower value of features domain_length, qty_questionmark _url contribute more to phishing prediction. From these two features, or domain_length is the most influential cause it’s the highest ranked feature in Exp-4 and -th ranked feature in Exp-3. Thus, the deviations between both Exp-3 and Exp-4 scenarios even when the same features are used for training and testing, raised a valid trust concern for features across different datasets. We can draw the following insights from both Exp-3 and Exp-4.
Insight 4: The relative orders of the features’ contributions in various dataset-agnostic experiments can vary vastly.
Insight 5: The value range of a particular feature may impact the prediction completely differently in multiple datasets.
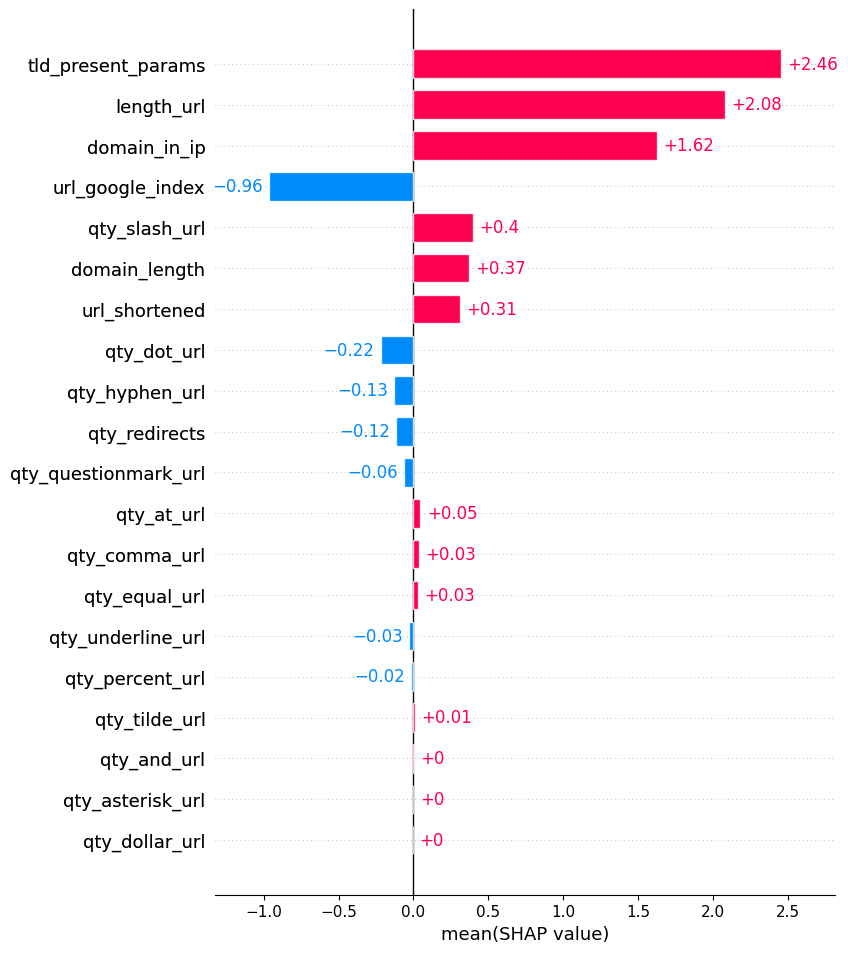
3.5.5. Exp-5 Feature Explanation
In this experiment scenario, we use the model that is trained on dataset , but test it on the test portion of dataset as they both contain these 20 common features. This experiment help us answering RQ2 in particular as we would learn how well or badly the model performs when the same dataset is not used in both the training and testing portions. We observe from Fig. 7 that the impactful features with positive feature contributions are tld_present_params (), length_url (), domain_in_ip (), qty_slash_url (), domain_length () and url_shortened ().
Among the negatively contributing features, url_google_index (),
qty_dot_url (), qty_hyphen_url (), qty_redirects () and qty_questionmark_url () are the highlighting ones. Interestingly, the direction of contributions for the features url_google_index and qty_dot_url are changed compared to Exp-4.
3.5.6. Exp-6 Feature Explanation
In this experiment setup, we do the reverse scenario of Exp-5 where the model that is trained on dataset , but we test it on the test portion of dataset . From Fig. 8, we observe that url_google_index () is the most influential feature with negative contributions though the same feature has positive contributions for single dataset train-test scenarios in both Exp-3 and Exp-4. In this experiment the other negatively contributing features are qty_slash_url (), qty_questionmark_url (), domain_length () and domain_in_ip (). On the contrary, some top positively contributing features are length_url (), qty_dot_url (), qty_underline_url (),
qty_redirects () and qty_hyphen_url ().
Insight 6: When we train on one dataset and test on the other dataset, the model performance degrades significantly and feature contributions on the test set deviate remarkably from the scenario where training and testing has been conducted on the same dataset.
3.5.7. Exp-7 Feature Explanation
These sub-experiments help us answering RQ3. Here, we use the mixed training and testing dataset . Here, we observe from Fig. 9 that for Exp-7.1, feature length_url () is contributing negatively, meaning contributing more towards benign class, while in all previous experiment scenarios, this specific feature has contributed positively to detect phishing URLs. Some negatively contributing features are url_google_index (), qty_slash_url,(), domain_in_ip () and domain_length (). On the other hand, significant positively contributing features are tld_present_params (), qty_dot_url (), qty _equal _url () and qty_redirects (). We can also see that the plot is quite similar to the Exp-6 plot in terms of features’ contribution direction (positive or negative) except a very few features like length_url and tld_present_params. The SHAP plot results from Exp-7.2 and Exp-7.3 are also coherent with Exp-7.1 but not presented for space constraints.
Insight 7: Merging datasets for training can improve the model performance significantly even for diverse testing dataset scenarios and shows more consistent behaviors from the features’ contribution and rank orders.
4. DISCUSSION AND LIMITATION
Amongst the 20 common features across dataset and , these following six features- qty_dot_directory, qty _slash _url, url_google_index, length_url, tld_present_params, and
domain_length play a major role in the model’s predictions in all of the experiment scenarios. However, the contribution orders of these features changes depending on the dataset that has been used for the training and testing. Additionally, we observe the deviations where in a particular experiment a specific feature’s higher range value is impacting more on phishing detection while the lower range value of that same feature contributes more in another experiment setup. This deviation can cause significant detection errors in practice when a new type of data is introduced for prediction in a pre-trained phishing detection model. Thus, we recommend developing a more complete publicly available bench-mark dataset from the research community for comparing model’s performances as well as a comprehensive feature list. We also recommend keeping the dataset live and updated as data trends may change from time to time as attackers adjust their techniques and tactics through adversarial attacks.
Our experiments find that the model that works well when trained and tested on the same dataset, may not be effective when trained on one dataset and tested on another. This results into a very low accuracy for Exp-5 and Exp-6 scenarios, which infers that the model is not generalized well for phishing detection in practice and may only be effective in that particular dataset scenario. Initially, we have assumed that merging dataset and (in Exp-7) would result in better performance than Exp-5 or Exp-6 scenarios. Interestingly, that is turned out to be true as the trained model on the merged dataset capable of performing well on the test portion of not only the merged dataset but also the test portion of individual datasets and . Thus, we recommend training on diverse datasets in practice for designing effective phishing URL or website detection models rather than using any singular dataset.
4.1. Limitations
Even though we shed light on the phishing detection features’ deviation of effectiveness across datasets, there remain some limitations in the present study. First, the study does not take into consideration each feature’s instance-specific contributions (local explanation) for identifying which features are deviating in the case of an individual test instance when trained on one dataset and tested on another. Second, we rely on the features’ SHAP values when interpreting the model. While SHAP gives a single measure of feature relevance, it makes the assumption that features are independent, which may not be true always. Third, We also have not considered any datasets with shared visual similarity features because of scarcity of such features. Fourth, the common phishing versus benign URL classification features that we have analyzed are limited to mostly lexical features as they are more commonly found across multiple datasets. Fifth, we have not considered the deep learning methods which can be considered in future studies.
5. CONCLUSION
The usage of Explainable AI has allowed us to establish variables which are most important in detecting phishing websites, as well as how these features differ between datasets. The analysis discovered critical variables that contribute significantly to the model’s predictions in several experiment scenarios. While the model performs well when trained and evaluated on the same dataset, its effectiveness is reduced when the training and test dataset are different even though they share the same features. This experimental evidences stress the need of training on different and representative datasets to improve model generalizability in practice before claiming a phishing detection model as effective with certain features. Thus, we can evidently state that phishing URL detection model that trained on singular dataset specifically using the lexical features can not be trusted across diverse datasets even if the features have very close data distributions. We recommend using multiple diverse merged dataset as a better method to use as training for the phishing detection model and always use explainable methods for AI/ML model’s verification and trustworthiness for further decision-making on the outcome. The detail implementation code and dataset are shared in the following Github repository (https://anonymous.4open.science/r/Deviation-in-Feature-Contribution-7760/) for reproducing the experiments.
References
- (1)
- Abdelhamid et al. (2017) Neda Abdelhamid, Fadi Thabtah, and Hussein Abdel-Jaber. 2017. Phishing detection: A recent intelligent machine learning comparison based on models content and features. In 2017 IEEE international conference on intelligence and security informatics (ISI). IEEE, 72–77.
- Aljofey et al. (2020) Ali Aljofey, Qingshan Jiang, Qiang Qu, Mingqing Huang, and Jean-Pierre Niyigena. 2020. An effective phishing detection model based on character level convolutional neural network from URL. Electronics 9, 9 (2020), 1514.
- Aljofey et al. (2022) Ali Aljofey, Qingshan Jiang, Abdur Rasool, Hui Chen, Wenyin Liu, Qiang Qu, and Yang Wang. 2022. An effective detection approach for phishing websites using URL and HTML features. Scientific Reports 12, 1 (2022), 8842.
- Bouijij and Berqia (2021) Habiba Bouijij and Amine Berqia. 2021. Machine Learning Algorithms Evaluation for Phishing URLs Classification. 2021 4th International Symposium on Advanced Electrical and Communication Technologies (ISAECT) (2021), 01–05. https://api.semanticscholar.org/CorpusID:245881138
- Chawla et al. (2002) N. V. Chawla, K. W. Bowyer, L. O. Hall, and W. P. Kegelmeyer. 2002. SMOTE: Synthetic Minority Over-sampling Technique. Journal of Artificial Intelligence Research 16 (June 2002), 321–357. https://doi.org/10.1613/jair.953
- Chiew et al. (2018) Kang Leng Chiew, Ee Hung Chang, C Lin Tan, Johari Abdullah, and Kelvin Sheng Chek Yong. 2018. Building standard offline anti-phishing dataset for benchmarking. International Journal of Engineering & Technology 7, 4.31 (2018), 7–14.
- Chinnasamy et al. (2022) P. Chinnasamy, N. Kumaresan, R. Selvaraj, S. Dhanasekaran, K Ramprathap, and Sruthi Boddu. 2022. An Efficient Phishing Attack Detection using Machine Learning Algorithms. In 2022 International Conference on Advancements in Smart, Secure and Intelligent Computing (ASSIC). 1–6. https://doi.org/10.1109/ASSIC55218.2022.10088399
- Das Guptta et al. (2024) Sumitra Das Guptta, Khandaker Tayef Shahriar, Hamed Alqahtani, Dheyaaldin Alsalman, and Iqbal H Sarker. 2024. Modeling hybrid feature-based phishing websites detection using machine learning techniques. Annals of Data Science 11, 1 (2024), 217–242.
- El Aassal et al. (2020) Ayman El Aassal, Shahryar Baki, Avisha Das, and Rakesh M Verma. 2020. An in-depth benchmarking and evaluation of phishing detection research for security needs. Ieee Access 8 (2020), 22170–22192.
- Elsadig et al. (2022) Muna Elsadig, Ashraf Osman Ibrahim, Shakila Basheer, Manal Abdullah Alohali, Sara Alshunaifi, Haya Alqahtani, Nihal Alharbi, and Wamda Nagmeldin. 2022. Intelligent deep machine learning cyber phishing url detection based on bert features extraction. Electronics 11, 22 (2022), 3647.
- Feng and Yue (2020) Tao Feng and Chuan Yue. 2020. Visualizing and interpreting rnn models in url-based phishing detection. In Proceedings of the 25th ACM Symposium on Access Control Models and Technologies. 13–24.
- Group ([n. d.]) Cisco Talos Intelligence Group. [n. d.]. PhishTank. https://phishtank.org/. (Accessed on 1 September, 2024).
- Gupta et al. (2021) Brij B Gupta, Krishna Yadav, Imran Razzak, Konstantinos Psannis, Arcangelo Castiglione, and Xiaojun Chang. 2021. A novel approach for phishing URLs detection using lexical based machine learning in a real-time environment. Computer Communications 175 (2021), 47–57.
- Gupta et al. (2023) Maanak Gupta, Charankumar Akiri, Kshitiz Aryal, Eli Parker, and Lopamudra Praharaj. 2023. From ChatGPT to ThreatGPT: Impact of Generative AI in Cybersecurity and Privacy. IEEE Access 11 (2023), 80218–80245. https://doi.org/10.1109/ACCESS.2023.3300381
- Hannousse and Yahiouche (2021) Abdelhakim Hannousse and Salima Yahiouche. 2021. Towards benchmark datasets for machine learning based website phishing detection: An experimental study. Engineering Applications of Artificial Intelligence 104 (2021), 104347.
- Jain and Gupta (2018) Ankit Kumar Jain and Brij B Gupta. 2018. PHISH-SAFE: URL features-based phishing detection system using machine learning. In Cyber Security: Proceedings of CSI 2015. Springer, 467–474.
- Karim et al. (2023) Abdul Karim, Mobeen Shahroz, Khabib Mustofa, Samir Brahim Belhaouari, and S Ramana Kumar Joga. 2023. Phishing Detection System Through Hybrid Machine Learning Based on URL. IEEE Access PP (01 2023), 1–1. https://doi.org/10.1109/ACCESS.2023.3252366
- Lundberg and Lee (2017) Scott M Lundberg and Su-In Lee. 2017. A Unified Approach to Interpreting Model Predictions. In Advances in Neural Information Processing Systems 30, I. Guyon, U. V. Luxburg, S. Bengio, H. Wallach, R. Fergus, S. Vishwanathan, and R. Garnett (Eds.). Curran Associates, Inc., 4765–4774. http://papers.nips.cc/paper/7062-a-unified-approach-to-interpreting-model-predictions.pdf
- Main (2023) Kelly Main. 2023. Phishing statistics by state in 2024. https://www.forbes.com/advisor/business/phishing-statistics/. (Accessed on 15 May, 2024).
- Maroofi et al. (2020) Sourena Maroofi, Maciej Korczyński, Cristian Hesselman, Benoît Ampeau, and Andrzej Duda. 2020. COMAR: Classification of Compromised versus Maliciously Registered Domains. In 2020 IEEE European Symposium on Security and Privacy (EuroS&P). 607–623. https://doi.org/10.1109/EuroSP48549.2020.00045
- Menon and Gressel (2021) Aditya Gopal Menon and Gilad Gressel. 2021. Concept drift detection in phishing using autoencoders. In Machine Learning and Metaheuristics Algorithms, and Applications: Second Symposium, SoMMA 2020, Chennai, India, October 14–17, 2020, Revised Selected Papers 2. Springer, 208–220.
- Mourtaji et al. (2021) Youness Mourtaji, Mohammed Bouhorma, Daniyal Alghazzawi, Ghadah Aldabbagh, and Abdullah Alghamdi. 2021. Hybrid rule-based solution for phishing URL detection using convolutional neural network. Wireless Communications and Mobile Computing 2021 (2021), 1–24.
- Opara et al. (2024) Chidimma Opara, Yingke Chen, and Bo Wei. 2024. Look before You leap: Detecting phishing web pages by exploiting raw URL And HTML characteristics. Expert Systems with Applications 236 (2024), 121183.
- Preeti and Sharma (2023) Preeti and Priti Sharma. 2023. A Detailed Analysis on Various Datasets using Machine learning and Deep Learning Techniques for Phishing URLs Detection. In 2023 14th International Conference on Computing Communication and Networking Technologies (ICCCNT). 1–10. https://doi.org/10.1109/ICCCNT56998.2023.10307474
- Pritom et al. (2020) Mir Mehedi Ahsan Pritom, Kristin M. Schweitzer, Raymond M. Bateman, Min Xu, and Shouhuai Xu. 2020. Data-Driven Characterization and Detection of COVID-19 Themed Malicious Websites. In 2020 IEEE International Conference on Intelligence and Security Informatics (ISI). 1–6. https://doi.org/10.1109/ISI49825.2020.9280522
- Pritom and Xu (2022) Mir Mehedi Ahsan Pritom and Shouhuai Xu. 2022. Supporting Law-Enforcement to Cope with Blacklisted Websites: Framework and Case Study. In 2022 IEEE Conference on Communications and Network Security (CNS). 181–189. https://doi.org/10.1109/CNS56114.2022.9947260
- Rao et al. (2020) Routhu Srinivasa Rao, Tatti Vaishnavi, and Alwyn Roshan Pais. 2020. CatchPhish: detection of phishing websites by inspecting URLs. Journal of Ambient Intelligence and Humanized Computing 11 (2020), 813–825.
- Roy et al. (2024) Sayak Saha Roy, Poojitha Thota, Krishna Vamsi Naragam, and Shirin Nilizadeh. 2024. From Chatbots to Phishbots?: Phishing Scam Generation in Commercial Large Language Models. In 2024 IEEE Symposium on Security and Privacy (SP). 36–54. https://doi.org/10.1109/SP54263.2024.00182
- Rugangazi and Okeyo (2023) Belyse Rugangazi and George Okeyo. 2023. Detecting Phishing Attacks Using Feature Importance-Based Machine Learning Approach. In 2023 IEEE AFRICON. 1–6. https://doi.org/10.1109/AFRICON55910.2023.10293475
- Sahingoz et al. (2019) Ozgur Koray Sahingoz, Ebubekir Buber, Onder Demir, and Banu Diri. 2019. Machine learning based phishing detection from URLs. Expert Systems with Applications 117 (2019), 345–357.
- Sarasjati et al. (2022) Wendy Sarasjati, Supriadi Rustad, Purwanto, Heru Agus Santoso, Muljono, Abdul Syukur, Fauzi Adi Rafrastara, and De Rosal Ignatius Moses Setiadi. 2022. Comparative Study of Classification Algorithms for Website Phishing Detection on Multiple Datasets. In 2022 International Seminar on Application for Technology of Information and Communication (iSemantic). 448–452. https://doi.org/10.1109/iSemantic55962.2022.9920475
- Shibli et al. (2024) Ashfak Md Shibli, Mir Mehedi A. Pritom, and Maanak Gupta. 2024. AbuseGPT: Abuse of Generative AI ChatBots to Create Smishing Campaigns. In 2024 12th International Symposium on Digital Forensics and Security (ISDFS). 1–6. https://doi.org/10.1109/ISDFS60797.2024.10527300
- Tan et al. (2018) Guolin Tan, Peng Zhang, Qingyun Liu, Xinran Liu, Chunge Zhu, and Fenghu Dou. 2018. Adaptive Malicious URL Detection: Learning in the Presence of Concept Drifts. In 2018 17th IEEE International Conference On Trust, Security And Privacy In Computing And Communications/ 12th IEEE International Conference On Big Data Science And Engineering (TrustCom/BigDataSE). 737–743. https://doi.org/10.1109/TrustCom/BigDataSE.2018.00107
- Thomson (2023) Graham Thomson. 2023. Phishing Outlook 2023: Statistics, Real-Life Incidents, and Best Practices. Technical Report. Albuquerque, NM, USA.
- Verma and Das (2017) Rakesh Verma and Avisha Das. 2017. What’s in a url: Fast feature extraction and malicious url detection. In Proceedings of the 3rd ACM on International Workshop on Security and Privacy Analytics. 55–63.
- Vrbančič et al. (2020) Grega Vrbančič, Iztok Fister, and Vili Podgorelec. 2020. Datasets for phishing websites detection. Data in Brief 33 (2020), 106438. https://doi.org/10.1016/j.dib.2020.106438
- Winson (2024) Winson. 2024. Dataset for link phishing detection. https://www.kaggle.com/datasets/winson13/dataset-for-link-phishing-detection. (Accessed on 15 May, 2024).
- Xu et al. (2013) Li Xu, Zhenxin Zhan, Shouhuai Xu, and Keying Ye. 2013. Cross-layer detection of malicious websites. In Proceedings of the Third ACM Conference on Data and Application Security and Privacy (San Antonio, Texas, USA) (CODASPY ’13). Association for Computing Machinery, New York, NY, USA, 141–152. https://doi.org/10.1145/2435349.2435366
- Yilmaz et al. (2020) Ibrahim Yilmaz, Ambareen Siraj, and Denis Ulybyshev. 2020. Improving DGA-Based Malicious Domain Classifiers for Malware Defense with Adversarial Machine Learning. In 2020 IEEE 4th Conference on Information & Communication Technology (CICT). 1–6. https://doi.org/10.1109/CICT51604.2020.9311925
- Zamir et al. (2020) Ammara Zamir, Hikmat Ullah Khan, Tassawar Iqbal, Nazish Yousaf, Farah Aslam, Almas Anjum, and Maryam Hamdani. 2020. Phishing web site detection using diverse machine learning algorithms. The Electronic Library 38, 1 (2020), 65–80.
- Zeng et al. (2020) Victor Zeng, Shahryar Baki, Ayman El Aassal, Rakesh Verma, Luis Felipe Teixeira De Moraes, and Avisha Das. 2020. Diverse datasets and a customizable benchmarking framework for phishing. In Proceedings of the Sixth International Workshop on Security and Privacy Analytics. 35–41.