SMILE-UHURA Challenge - Small Vessel Segmentation at Mesoscopic Scale from Ultra-High Resolution 7T Magnetic Resonance Angiograms
Abstract
The human brain receives nutrients and oxygen through an intricate network of blood vessels. Pathology affecting small vessels, at the mesoscopic scale, represents a critical vulnerability within the cerebral blood supply and can lead to severe conditions, such as Cerebral Small Vessel Diseases. The advent of 7 Tesla MRI systems has enabled the acquisition of higher spatial resolution images, making it possible to visualise such vessels in the brain. However, the lack of publicly available annotated datasets has impeded the development of robust, machine learning-driven segmentation algorithms. To address the complexities of mesoscopic vessel segmentation and to highlight the need for advanced techniques to manage the high noise levels and poor vessel-to-background contrast inherent in ”ultra-high-resolution” data, the SMILE-UHURA challenge was organised. This challenge, held in conjunction with the ISBI 2023, in Cartagena de Indias, Colombia, aimed to provide a platform for researchers working on related topics. The SMILE-UHURA challenge addresses the gap in publicly available annotated datasets by providing an annotated dataset of Time-of-Flight angiography acquired with 7T MRI. This dataset was created through a combination of automated pre-segmentation and extensive manual refinement. In this manuscript, sixteen submitted methods and two baseline methods are compared both quantitatively and qualitatively on two different datasets: held-out test MRAs from the same dataset as the training data (with labels kept secret) and a separate 7T ToF MRA dataset where both input volumes and labels are kept secret. The results demonstrate that most of the submitted deep learning methods, trained on the provided training dataset, achieved reliable segmentation performance. Dice scores reached up to 0.838 ± 0.066 and 0.716 ± 0.125 on the respective datasets, with an average performance of up to 0.804 ± 0.15.
1 Introduction
Brain function relies on the cerebral vasculature to supply nutrients and oxygen. Any impairment of the vasculature can damage brain tissue, potentially leading to cognitive decline. The cerebral vasculature is organised as a hierarchical, tree-like network, where vessel diameter decreases while the number of branches increases with higher branch order. For major cerebral vessels at the macroscopic scale and for capillaries, arterioles, and venules at the microscopic scale, in vivo and ex vivo imaging modalities are available, respectively. However, assessing the mesoscopic scale (vessel diameters of 100–500 µm) remains challenging. Pathologies at the mesoscopic scale are potentially linked to ageing, dementia, and Alzheimer’s disease [1, 2]. Segmentation and quantification of these vessels are crucial steps in the investigation of Cerebral Small Vessel Disease (CSVD) [3, 4].
Recently, ultra-high field (UHF) magnetic resonance imaging (MRI) has emerged as a means of bridging the gap between macroscopic and microscopic assessments of the human cerebral vasculature. Following pioneering work on magnetic resonance angiography (MRA) at 7 Tesla (7T) [5, 6], the field has advanced significantly, achieving the highest resolutions to date [7, 8] — as high as 150 µm and 140 µm, respectively. These advancements enable imaging of mesoscopic vessels, which are highly relevant to understanding cerebral small vessel diseases, neurodegeneration, and the origins of the functional fMRI signal. However, automatic segmentation of vessels at this scale has yet to be established.
To address this need within the neurological and neuroscientific community, this challenge was initiated, focusing on the segmentation of vasculature at the mesoscopic scale. While vessel segmentation challenges have a long tradition, using UHF MRI for mesoscopic vessels presents unique difficulties compared to 2D microscopic or 3D macroscopic vessel imaging and segmentation: (I) instead of a single 2D image per sample, a 3D volume is acquired, significantly increasing computational demands and making manual segmentation highly time-consuming, and (II) compared to macroscopic segmentation, ultra-high-resolution data is noisier and exhibits poorer vessel-to-background contrast, complicating both automatic and manual segmentation. These challenges have hindered the establishment of openly accessible data repositories and the development of high-performance mesoscopic vessel segmentation algorithms. Currently, no high-resolution 7T dataset with annotations is available for training machine learning-based segmentation methods or benchmarking performance. To address this gap, an annotated dataset of Time-of-Flight (ToF) angiography acquired with a 7T MRI was created for this challenge. This dataset was generated using a combination of automatic pre-segmentation and extensive manual refinement. It serves as the foundation of this challenge and provides a benchmark for quantitative performance assessment, facilitating future advancements in mesoscopic vessel segmentation.
2 Related Work
Benchmark datasets and challenges focused on vessel segmentation have been established in the past, such as the DRIVE challenge, which targets blood vessel segmentation from retinal images [9, 10, 11], and lung vessel segmentation challenges based on computed tomography (CT) images [12]. However, with respect to vessel segmentation from MRA-TOF, no public challenges or open datasets for benchmarking have been available.
There have been other tasks involving MRA-TOF data, such as the ADAM challenge, which focused on microaneurysms [13], and the VALDO challenge, which centred on vascular lesion detection and segmentation [14], including cerebral microbleeds and enlarged perivascular spaces (EPVS). These challenges provided labels specific to their respective tasks but did not address vessel segmentation in particular.
Public datasets, such as the IXI dataset111IXI Dataset: https://brain-development.org/ixi-dataset/, also exist and provide a large collection of MRA-TOF data. However, these datasets have been acquired using MRI scanners with field strengths of 1T, 1.5T, or 3T, rather than ultra-high-field (UHF) scanners such as 7T. Images obtained with a 7T MR scanner at high spatial resolution reveal significantly more small vessels compared to those acquired with 3T scanners [15]. Moreover, none of these datasets include annotations for vessels that could be used to train automatic vessel segmentation algorithms.
2.1 Current approaches for vessel segmentation
Among the most prevalent vessel enhancement algorithms is the Hessian-based Frangi vesselness filter [16], which is typically combined with empirically calibrated thresholding to achieve the final segmentation. The multi-scale properties of this method make it suitable for small vessel segmentation; however, significant parameter fine-tuning is often required to achieve good sensitivity for vessels of interest. Canero and Radeva [17] introduced a vesselness enhancement diffusion (VED) filter that integrates the Frangi filter with an anisotropic diffusion scheme. This approach was later extended by constraining the smoothness of the tensor/vessel response function [18]. Recently, a multi-scale Frangi diffusion filter (MSFDF) pipeline was proposed for segmenting cerebral vessels from susceptibility-weighted imaging (SWI) and TOF-MRA datasets. This method initially pre-selects voxels as vessels or non-vessels using a Bayesian Gaussian mixture classifier, followed by the application of Frangi and VED filters. While effective, these approaches often require manual fine-tuning of parameters for each dataset or even for individual volumes to achieve optimal results. Additionally, they rely on extensive preprocessing steps, such as bias field correction, which makes the execution of the pipeline time-consuming.
In recent years, deep learning methods have been increasingly applied to vessel segmentation tasks across various imaging modalities. Among these, the UNet model [19] has gained significant popularity for its success in segmentation tasks. It has been employed for vessel segmentation in X-ray coronary angiography [20] and TOF-MRA images of patients with cerebrovascular diseases [21]. Furthermore, UNet-based semi-supervised learning approaches have been successfully applied to blood vessel segmentation in retinal images [22] and 7T MRA-ToF images [23].
Despite the development of deep learning methods for vessel segmentation in 7T MRA-ToF images [23], these studies have relied exclusively on semi-automatically generated noisy training labels. The availability of a publicly accessible 7T MRA-ToF dataset with high-quality manual annotations would enable researchers to develop and refine automatic segmentation techniques further. Additionally, such a dataset would facilitate benchmarking against state-of-the-art methods, significantly advancing the field.
Two primary challenges in segmenting vessels in such high-resolution scans are the segmentation of small vessels (with an apparent diameter of only 1–2 voxels) and the maintenance of vessel continuity. While these challenges could potentially be addressed through manual fine-tuning of semi-automatic methods, such approaches are highly time-consuming and not scalable. The problem is further compounded in high-resolution 3D volumes, where the computational demands are significantly greater compared to the analysis of a single 2D image (as is common with fundus images), making manual segmentation particularly laborious. Moreover, in comparison to images used for macroscopic segmentation tasks, ultra-high-resolution data is substantially noisier and exhibits poorer vessel-to-background contrast. These characteristics pose significant difficulties for both automatic and manual segmentation approaches, further emphasising the need for robust, scalable methods.
3 SMILE-UHURA Challenge
The SMILE-UHURA challenge, held in conjunction with the IEEE International Symposium on Biomedical Imaging (ISBI) 2023, in Cartagena de Indias, Colombia (and virtually), seeks to address the notable gap in publicly accessible annotated datasets within the domain of medical imaging by introducing an annotated dataset specifically designed for ToF-MRA acquired using 7T MRI. This dataset represents a significant contribution to the community, as it was meticulously developed through a combination of automated pre-segmentation techniques and thorough manual refinement. The challenge not only provides a robust dataset for the training and evaluation of machine learning models aimed at vessel segmentation in 7T ToF-MRA but also establishes a platform for benchmarking diverse methodological approaches. By making the SMILE-UHURA dataset publicly available (even after the challenge), the challenge aims to foster the development of innovative machine learning models while simultaneously serving as a critical resource for researchers to compare and refine their techniques, thereby advancing the field of medical imaging analysis.
3.1 Dataset
The challenge includes two datasets, the Open Dataset and the Secret Dataset, both acquired at 7T MRI with an isotropic resolution of 300 µm. To contextualise this resolution in relation to other public datasets, the IXI dataset contains images with a resolution of 450 µm, and prior research performing vessel segmentation in 7T MRA-ToF employed a resolution of 600 µm. The Open Dataset was divided into a publicly available training-validation set and a confidential held-out test set, used to assess the performance of submitted methods. The labels from the Secret Dataset will remain unpublished and was utilised for external testing to evaluate the generalisability of the methods on an independent dataset.
3.1.1 Open Dataset
The images in the Open Dataset were sourced from the StudyForrest project222StudyForrest: http://www.studyforrest.org [24], which involved 3D multislab Time-of-Flight Magnetic Resonance Angiography (TOF-MRA) data from 20 healthy, right-handed, native German-speaking subjects, with an average age of 26 years. The imaging protocol utilised four slabs, each comprising 52 slices with a thickness of 300 µm, and encoding was performed from right to left at a 7T field strength. However, MRAs from 2 subjects were excluded due to the presence of wraparound artefacts. The remaining images were divided into two sets: a training-validation set comprising 14 MRAs, which was made publicly available, and a test set containing 4 MRAs, retained exclusively for held-out evaluation.
3.1.2 Secret Dataset
The Secret Dataset was created using TOF-MRAs from a different study [7], comprising 3D TOF-MRA data from seven healthy subjects scanned at 7T with the same isotropic resolution of 300 µm as the Open Dataset. These images were acquired using prospective motion correction techniques to minimise image blurring and prevent the loss of small vessels. In addition, sparse venous saturation was implemented to suppress venous contamination in the angiograms while remaining within specific absorption rate limits (the Open Dataset did not apply any venous saturation).
3.1.3 Annotation
Annotations for both datasets were created using a three-step process. Initially, preliminary segmentations were generated using thresholding in 3D Slicer3333D Slicer: https://www.slicer.org/ [25]. This process was empirically refined for each volume to produce an initial binary mask with minimal noise. While this procedure successfully segmented a substantial portion of medium- to large-scale vessels, many small vessels of high relevance remained unsegmented. Subsequently, these segmentations underwent extensive manual refinement to remove noise and accurately delineate the missing vessels. Finally, a senior neurologist reviewed and verified the annotations to ensure their accuracy. The annotations for the training-validation subset of the Open Dataset are accessible for download upon request on Synapse444SMILE-UHURA Open Dataset on Synapse: https://synapse.org/uhura [26]. Conversely, annotations for the test subset of the Open Dataset and the Secret Dataset have been withheld to prevent potential overfitting or bias.
In addition to these annotations, ten plausible segmentations for each volume in the training-validation subset were generated in a semi-automatic manner by varying the parameters of the Frangi filter (see [27] for details). These segmentations are also available for use. Moreover, additional annotations created using OMELETTE, an automatic small vessel segmentation pipeline [28], are provided. These diverse annotations are intended for benchmarking purposes or for use in training scenarios that benefit from multiple annotations, such as Probabilistic UNets [29, 27].
3.2 Aim
The SMILE-UHURA challenge aims to bridge the gap in publicly available annotated datasets for 7T Time-of-Flight MRI angiography by providing a meticulously annotated dataset. It seeks to support the training and evaluation of machine learning models for vessel segmentation while offering a benchmarking platform for researchers to compare and refine their approaches. By keeping the dataset publicly accessible, the challenge encourages innovation and collaboration in medical imaging analysis.
3.3 Evaluation
The primary evaluation of the SMILE-UHURA challenge utilised five distinct quantitative metrics to objectively assess the performance of the segmentation methods. These metrics provided a robust and comprehensive analysis of the models’ accuracy, efficiency, and reliability in segmenting vascular structures. In addition to these quantitative assessments, a qualitative evaluation was conducted by an expert, who rated the segmentation quality based on visual and practical considerations. This dual approach ensured a balanced evaluation, combining objective data-driven insights with expert judgement to provide a thorough assessment of the segmentation outcomes.
3.3.1 Metrics for quantitative evaluation
Five quantitative metrics were employed to ensure a comprehensive evaluation of the submitted methods: Dice coefficient, Jaccard Index (IoU), volumetric similarity, mutual information, and balanced average Hausdorff distance.
The Dice coefficient and Jaccard Index are standard overlap metrics that quantify the similarity between the predicted segmentation and the ground truth, focusing on the accuracy of the segmented regions. Although mathematically distinct, they provide complementary perspectives, enhancing the reliability of the overlap assessment. Volumetric similarity evaluates the agreement in volume between the predicted and ground truth segmentations, which is crucial for assessing how well a method captures the true size of the vessels. Mutual information measures the statistical dependence between the segmented outputs and the ground truth, offering insight into the shared information beyond spatial overlap alone. The balanced average Hausdorff distance (bAHD or bAVD in the EvaluateSegmentation pipeline) [30] measures the average boundary discrepancy between the predicted segmentation and the ground truth, highlighting the precision of a method in delineating vessel edges.
By incorporating these diverse metrics, the evaluation captures multiple aspects of segmentation performance — including region overlap, volumetric accuracy, statistical correlation, and boundary precision. This approach ensures a thorough and robust assessment of each method’s effectiveness. The quantitative evaluation was performed using the EvaluateSegmentation pipeline555EvaluateSegmentation: https://github.com/Visceral-Project/EvaluateSegmentation [31].
3.3.2 Scoring system for qualitative expert evaluation
The segmentation performance of various algorithms was additionally evaluated qualitatively by an expert through a blinded assessment process. The outputs of each algorithm across different image volumes were assessed based on two primary criteria: the delineation of small vessels and the suppression of noise contamination. Small vessels were defined as those with an apparent diameter of 1–2 voxels, while noise contamination referred to the incorrect segmentation of non-vascular voxels as vessels. Ratings were assigned on a scale from 0 (unacceptable) to 5 (excellent).
For comparative reference, original ToF angiography images were provided to the expert alongside each segmentation. All images (original ToFs and segmentation results) were presented as Maximum Intensity Projections (MIPs), with an additional zoomed view of the Circle of Willis. This was specifically included to enhance the evaluation of small vessel segmentation, such as the lenticulostriate arteries branching from the Middle Cerebral Artery (MCA). This setup allowed for the assessment of whether the segmentation algorithms could potentially surpass the depiction of small vessels offered by ToF angiography, which may be affected by intensity variations caused by imaging imperfections. Segmentations from both datasets were mixed and presented to the expert in a random order to ensure unbiased evaluation.
In addition to the main test volumes from both datasets, an extra ToF-MRA volume, acquired with an isotropic resolution of 150 µm, was provided to the expert. Due to the size of this volume and computational constraints, not all methods could segment it. Consequently, this volume was not included in the primary decision-making process but was used as an additional evaluation to judge the generalisability of the methods with respect to image resolution.
3.4 Challenge setup
Following the acceptance of the SMILE-UHURA challenge for ISBI 2023, it was formally announced on the challenge’s dedicated website666Challenge website: https://www.soumick.com/en/uhura, with registration facilitated through the Synapse platform777Challenge on Synapse: https://www.synapse.org/uhura. The training dataset, including annotations, was provided in NIFTI format, and participants were instructed to submit their solutions as Docker containers, adhering to the detailed guidelines outlined on the Synapse page.
The evaluation environment was equipped with high-performance hardware, comprising a CUDA-enabled Nvidia A6000 GPU with 48GB of memory, a 16-core 32-thread AMD Ryzen 9 3950X processor, and 64GB of RAM. Participants were required to ensure that their Docker containers could run seamlessly on this system. Containers that failed to execute successfully — due to issues such as CUDA memory overflow, excessive CPU or RAM usage causing system hangs, or other technical faults — were disqualified. To maintain fairness and security, internet access was strictly prohibited during execution. As a result, participants had to design self-contained Docker containers, including all necessary trained models and pre-trained weights within the submission. Technical support was made available to assist participants in building their Docker containers or resolving execution issues when required.
Participants were also required to submit an abstract describing their methodology. Out of the 13 submissions that successfully produced results by the event on 18 April 2023, all were invited to present their approaches at ISBI 2023, either in person or online. These presentations highlighted the diverse and innovative techniques developed by the competing teams. Three additional submissions, which successfully ran after further troubleshooting, were subsequently included in the analysis presented here.
The dataset remains accessible on the Synapse page for continuous use, providing researchers with resources for training and benchmarking vessel segmentation algorithms in 7T ToF-MRAs.
4 Methods
4.1 Baseline Methods
Sixteen participating methods were compared against two baseline methods: and . Baseline UNet MSS is a supervised learning method based on a modified version of the multi-scale UNet [32], which computes losses at multiple scales and sums them to derive the final loss. Baseline DS6 is a semi-supervised learning technique that extends Baseline UNet MSS with a Siamese architecture. It learns from both the original data and elastically transformed data using two identical branches: one branch receives the original volume with its label, and the other processes the elastically transformed volume with the corresponding label. This second branch makes the method equivariant to elastic deformations in a self-supervised manner, enhancing its performance on small datasets, even in the presence of noisy labels. Details about both these methods, including preprocessing and training procedures, can be found in the original paper [23], as no modifications were made for this challenge; they were used exactly as described.
4.2 Participating Methods
Among the methods submitted by the 98 registered participants (as of 14 November 2024), 16 methods from 8 participating teams were selected for the challenge manuscript. A few methods were excluded due to incomplete or erroneous submissions. The challenge event, held at ISBI 2023 in Cartagena de Indias, Colombia, on 18 April 2023, included 13 methods, as issues with the submissions of the remaining 3 methods could not be resolved in time for the event. These 3 methods were subsequently included in the final analysis.
It is a transformer-based model specifically designed for 3D medical image segmentation, with a particular focus on MRI analysis. It represents an adaptation of a pre-trained model from the MONAI model zoo [33], originally developed for renal structure segmentation in 3D CT, tailored here for MRI data. The UNesT architecture employs a hierarchical transformer design, aggregating adjacent patch sequences to preserve positional information. This innovative approach effectively addresses the challenge of representing heterogeneous tissue sizes in 3D medical images, enabling the model to capture global dependencies and enhance feature representation. The novelty of ADAR_LAB UNesT
lies in its ability to surpass traditional transformers by integrating hierarchical context for complex volumetric data.
Data processing: The original 3D images, sized (480, 640, 163), are divided into smaller patches compatible with the model’s adjusted input size of (160, 160, 160), modified from the original MONAI configuration of (96, 96, 96). Augmentation strategies, including random cropping, flipping, contrast adjustments, noise addition, and intensity scaling, are applied to enhance the model’s generalisability. Voxel intensity normalisation is performed, capping the maximum intensity value at 1,000 to preserve a broader range of data dynamics, thereby avoiding the compression commonly associated with standard normalisation techniques.
Training process: The training process employs a composite loss function, combining Binary Cross-Entropy (BCE) loss with Dice loss, to improve segmentation accuracy by addressing both pixel-wise predictions and spatial overlap. The RMSprop optimisation algorithm is used, taking advantage of its adaptability to varying gradient scales. This training configuration ensures effective convergence, balancing the capture of global structural predictions with fine-grained accuracy in the segmentation task.
The participants employed the nnUNet method [34], an advanced extension of the UNet architecture, specifically designed for medical image segmentation, with a particular emphasis on vessel and edge detection in MRI data. While retaining the signature U-shaped architecture, nnUNet incorporates self-adapting features to dynamically tailor the network to specific datasets. This adaptive capability enhances segmentation performance across diverse medical imaging tasks, making the model highly versatile and robust. Its novelty lies in its ability to autonomously configure preprocessing, training, and postprocessing pipelines, providing an optimised framework for 3D medical image analysis.
Data processing: Data preprocessing utilises the MONAI framework [35], which applies a range of augmentation techniques to enhance performance, even with limited training data. These techniques include random cropping, contrast adjustment, intensity shifting, noise addition, and flipping. The original 3D images, sized (480 × 640 × 163), are divided into smaller patches (e.g., 96 × 96 × 96 or 128 × 128 × 128) to increase dataset diversity. This patch-based approach improves the model’s generalisability to variations in medical imaging data. MONAI’s seamless integration of preprocessing steps ensures efficiency throughout the workflow.
Training process: The training process uses DiceCELoss, a composite loss function combining Cross-Entropy Loss and Dice Loss, which is particularly effective for imbalanced data and the segmentation of small structures like vessels and edges. The AdamW optimiser [36] is employed, outperforming alternatives such as Adam and RMSprop in achieving better convergence. During inference, a sliding window approach with overlap voting is applied to refine predictions, ensuring high segmentation accuracy. This comprehensive training pipeline, integrated with MONAI’s advanced functionalities, enables robust and precise medical image analysis.
The model of this submission is based on the Swin Transformer architecture [37], which utilises shifted windows to effectively model both local and global representations, achieving superior performance in tasks requiring hierarchical understanding. SwinUNETR [38] integrates a Swin Transformer encoder with a CNN-based decoder, connected through skip connections at multiple resolutions. This design captures fine-grained details as well as high-level features. By leveraging pre-trained weights, SwinUNETR enhances segmentation accuracy and is particularly effective for complex structures, such as vessels and edges in MRI imaging.
Data processing: Data augmentation plays a crucial role in overcoming the limitations of a small training dataset. Techniques such as random cropping, contrast adjustment, intensity scaling, noise addition, flipping, and rotation are employed using the MONAI framework [35]. The original dataset, sized (480 × 640 × 163), is divided into smaller patches (128 × 128 × 128) to enhance diversity and improve the model’s robustness. This patch-based approach, combined with augmentation, ensures better generalisability and prepares the data for effective hierarchical segmentation using SwinUNETR.
Training process: The training process compared multiple loss functions: DiceCELoss, which combines Cross-Entropy and Dice loss; the Tversky loss function, which addresses data imbalance; and Dice loss, which proved most effective for refining small structures like vessels and edges. Dice loss was ultimately selected as the final loss function. The model was optimised using RMSprop, identified as the most effective optimiser, outperforming alternatives such as AdamW and Adam.
This is an ensemble-based model for 3D medical image segmentation, integrating three pre-trained architectures: Swin UNETR [38], nnUNet [34], and UNesT [33]. By combining outputs through multi-layer 3D convolutions, the model generates aggregated predictions with enhanced performance. This novel ensemble strategy exploits the strengths of each individual model, effectively capturing diverse spatial and contextual information. Its hierarchical approach leverages the unique capabilities of transformer-based and traditional convolution-based methods, resulting in significant improvements in segmentation accuracy, particularly for challenging tasks such as vessel and edge detection in medical imaging.
Data processing: Data processing focuses on augmentation to address the limitations of a small dataset. Augmentation techniques include random cropping, intensity scaling, contrast adjustment, noise addition, and flipping, all implemented through the MONAI framework [35]. The original images, sized (480 × 640 × 163), are divided into smaller patches of varying dimensions (e.g., 96 × 96 × 96 and 128 × 128 × 128) to facilitate model training.
Training process: The training process employs a hybrid loss function, DiceCELoss, which combines Cross-Entropy Loss and Dice Loss. This approach is particularly effective in addressing class imbalances and improving the segmentation of small structures such as vessels and edges. The AdamW optimiser [36] is utilised due to its superior performance compared to Adam and RMSprop. During inference, a sliding window approach with overlap voting is applied to refine predictions, further enhancing segmentation precision..
, and
The Koala methods [39] employed a 3D UNet architecture [40] specifically modified for vessel segmentation in MRA data. The model’s depth was increased to four layers in both the encoder and decoder blocks, enhancing its capacity to learn complex features. This set of methods includes three variations, each using different label types from the challenge (see Sec. 3.1.3): Koala Manual
utilised manual labels (the primary label set of the challenge), while Koala OM1
and Koala OM2
relied on labels generated by the automated OMELETTE pipeline [41] (supplied as additional sets of labels of challenge). These automated labels enabled the model to leverage imperfect yet scalable training data, reducing dependence on labour-intensive manual annotations and enhancing generalisability to unseen data.
Data processing: The preprocessing pipeline included N4ITK bias field correction [42] and non-local means denoising [43] to improve the signal-to-noise ratio (SNR). Data augmentation involved generating random patches from input images, with operations such as cropping, resizing, rotation (90°, 180°, and 270°), and Gaussian blurring. Each image was resized to a fixed dimension of 64 × 64 × 64, resulting in 78,000 augmented patches across 13 subjects. These strategies significantly increased dataset diversity, ensuring robust training across multiple label sets.
Training process: The models were trained for 1,000 epochs with an initial learning rate of 0.001, using the Tversky loss function (), which is tailored to handle imbalanced data and small structures like vessels. A learning rate scheduler, ReduceLROnPlateau, dynamically adjusted the learning rate when progress plateaued. Post-processing involved thresholding predicted probabilities at 0.1 and removing small connected components under ten voxels to refine segmentation outputs. Finally, the model was fine-tuned for test-time adaptation. This comprehensive training and post-processing pipeline ensured precise and reliable vessel segmentation results across varying label sources.
, and
The neuRoSliCCe methods [44] introduce Maximum Intensity Projection (MIP) as a loss term to enhance vessel segmentation performed by baseline models (UNet MSS and DS6). neuRoSliCCe MIP
applies MIP loss to UNet-MSS along a single axis, whereas neuRoSliCCe multiMIP
extends this by incorporating MIP loss across all three axes. neuRoSliCCe DS6_MIP
employs the DS6 semi-supervised learning approach [23] with single-axis MIP loss. These methods aim to capture spatial continuity and improve vessel segmentation accuracy by integrating MIP comparisons into the training process, offering a novel approach to incorporating global context directly into optimisation.
Data processing: The training pipeline utilises patch-based processing, dividing 3D MRA volumes of size into patches of . Each patch is associated with its corresponding position on the MIP of the label segmentation. For neuRoSliCCe multiMIP
, label MIPs are generated across three axes to provide multi-dimensional context. The dataset comprises 12 training volumes from the SMILE-UHURA challenge, with 8,000 patches randomly selected per epoch. Data augmentation ensures robust learning through the preparation of patches alongside corresponding MIPs.
Training process: The training process employs a composite loss function that combines Multi-Scale Supervision (MSS) loss and MIP loss, weighted by coefficients and , respectively. MSS loss penalises multi-resolution segmentation errors, while MIP loss compares predicted MIPs against ground-truth MIPs to enforce spatial consistency. neuRoSliCCe MIP
and neuRoSliCCe multiMIP
differ in their application of MIP loss, with the latter averaging losses across all three axes. neuRoSliCCe DS6_MIP
integrates the complete DS6 semi-supervision loss term with MIP loss. All loss components are computed using the Focal Tversky loss [45]. The models are trained over 50 epochs with a learning rate of 0.0001, ensuring precise vessel segmentation.
This method introduces a hybrid framework for the segmentation of cerebral small vessels, integrating the strengths of convolutional neural networks (CNNs) and vision transformers. The encoder employs a Swin Transformer [37] with a cross-attention, window-based mechanism, effectively capturing both global and local features. Rectangular-parallelepiped windows adapt the Swin Transformer to handle non-square images. The decoder utilises a standard UNet structure with skip connections and bi-linear 3D up-sampling to combine features from the encoder. This combination of CNN and transformer elements ensures robust spatial representation, with attention mechanisms enhancing the correspondence between image features. The novelty lies in the application of window-based multi-head cross-attention and transformer-based hierarchical encoding, resulting in improved segmentation accuracy.
Data processing: Images are processed through a 3D segmentation pipeline, utilising a kernel size of for convolutional layers in both the encoder and decoder. Spatial down-sampling is performed using a kernel in the encoder’s max-pooling layers, while transposed 3D convolutions handle up-sampling in the decoder. Outputs from encoder blocks are concatenated with their corresponding decoder blocks via skip connections, producing refined segmentation maps through a convolution and softmax activation.
Training process: Training adopts a five-fold cross-validation strategy, optimising the model based on validation Dice scores with early stopping applied after 20 epochs. The training and testing environments are based on nnUNet. By combining Swin Transformers and UNet components, this hybrid architecture ensures efficient training while capturing both local and global features. The approach is particularly suited to high-dimensional features, effectively addressing the challenges of small vessel segmentation at a mesoscopic scale.
This method leverages the Swin Transformer integrated with a UNet-like architecture for high-throughput MRA vessel segmentation. The encoder employs Swin Transformer blocks with shifted windows, facilitating the learning of complex vascular structures. Patch merging and partitioning blocks enhance the representation of hierarchical features. The decoder reconstructs the segmentation map using patch-expanding blocks and reverse Swin Transformer blocks. This architecture is coupled with a composite loss function that includes global Cross-Entropy loss, over-segmentation Dice loss (OSD Loss), and 2D Dice loss applied to multi-projection maximum intensity projections (MMIPs). The novelty lies in integrating 2D MIP-based supervision with the Swin Transformer for 3D volumetric segmentation, ensuring both local precision and global coherence.
Data processing: Pre-processing includes a custom histogram equalisation technique to threshold the top 5% of pixel intensities, effectively filtering out non-vessel structures such as the skull and brain tissue. Images are divided into patches of size using a sliding window approach with random flipping for data augmentation. This patch-based processing considers the approximate symmetry of blood vessels between brain hemispheres, ensuring a robust data pipeline.
Training process: The model is trained using a composite loss function comprising global Cross-Entropy loss, over-segmentation Dice loss (OSD Loss), and 2D Dice loss applied to MIPs across three axial directions. The Adam optimiser with a learning rate of is utilised, and training is conducted over 20 epochs with a batch size of 1. Five-fold cross-validation ensures model robustness. Post-processing involves majority voting across predictions from five trained models, largest connected component analysis, and custom thresholding to refine vessel predictions, culminating in an accurate segmentation map.
This submission introduced an enhanced version of nnUNet [34], incorporating a multi-scale aggregation block, referred to as MS-nnUNet. This block performs multi-scale feature fusion on the final output features of the nnUNet decoder. Specifically, the multi-scale aggregation block comprises a 3D convolution followed by a series of dilated convolutions with varying dilation rates (2, 4, 6, 8). These dilated convolutions capture feature maps with different receptive fields, which are then concatenated along the channel dimension. The design aims to enrich feature representation, enabling improved boundary definition and object localisation accuracy through contributions from multiple scales.
Data processing: The dataset of 14 subjects was divided into five folds for cross-validation, with each fold containing 2 subjects. Images were padded to standardise spatial dimensions and divided into patches of size . To enhance model generalisation, data augmentation techniques were employed, including random elastic deformations with a probability of 0.2, scaling within a range of 0.7 to 1.4, and rotations along all three axes. Additionally, random gamma adjustments and mirroring along all axes were applied to further augment the dataset.
Training process: The model was trained for up to 1,000 epochs with a batch size of 16, using the SGD optimiser configured with a learning rate of 0.01, momentum of 0.99, and a weight decay of . The training loss function combined Dice loss and binary cross-entropy (BCE) loss, with deep supervision applied at multiple scales to enhance learning across hierarchical feature representations. The best-performing model, determined based on its validation set performance, was retained for final inference.
This method introduces a scrolling 2D UNet for segmenting small blood vessels in 3D MRA volumes. Unlike conventional 3D segmentation methods, this approach processes 3D volumes by sliding along six anatomical directions (AP, PA, LR, RL, IS, SI), enabling 2D segmentation while retaining 3D spatial information. The method employs a modified 2D UNet with group normalisation, Leaky ReLU activation, and average pooling for down-sampling, ensuring computational efficiency. Its novelty lies in combining directional scrolling with a lightweight 2D architecture, achieving segmentation performance comparable to state-of-the-art 3D models such as nnUNet.
Data processing: The dataset consists of 7T MRI images with dimensions , divided into training, validation, and testing sets comprising 8, 3, and 3 subjects, respectively. During pre-processing, the images are padded and sliced into stacks of 10 channels, representing anatomical slices. Data augmentation includes random flipping along all dimensions with a probability of 0.5. This approach integrates 2D slices into a pipeline that preserves 3D spatial continuity.
Training process: The model is trained over 1,000 epochs with a batch size of 8, using the Adam optimiser with an initial learning rate of 0.001. The loss function combines Dice loss and binary cross-entropy (BCE) loss. During training, slices are reshaped and processed in batches, accumulating gradients for optimisation. For inference, outputs from all anatomical directions are summed and normalised, with a detection threshold of 0.3 applied to identify vessel voxels. This configuration delivers performance comparable to 3D methods while significantly reducing computational demands.
This submission utilised nnUNet [34], a self-configuring, state-of-the-art model designed for biomedical image segmentation, particularly excelling in high-resolution MRI vessel segmentation. Renowned for its robustness and flexibility, nnUNet automatically adapts to dataset-specific features, such as voxel spacing, intensity distributions, and class ratios. This adaptability makes it especially effective for tasks requiring precise boundary delineation, such as vessel segmentation. The model’s ability to self-configure without extensive manual tuning enables it to capture fine, complex structures within MRI data, which is critical for accurately segmenting small vessels.
Data processing: The original data processing steps were adhered to in this submission. The input images were preprocessed by cropping non-zero volumes, and patches were created with a patch size of [224, 64, 160] to reduce computational load. Resampling based on voxel spacing was performed to maintain spatial semantics, and z-score normalisation was applied where necessary. This automated preprocessing pipeline ensures efficiency and consistency across diverse input datasets.
Training process: The dataset was divided into training, validation, and testing subsets, comprising 8, 3, and 3 samples respectively. nnUNet was trained for 1,000 epochs using the Adam optimiser with an initial learning rate of 0.001 and a composite loss function combining Dice loss and binary cross-entropy (BCE) loss, balancing pixel-wise precision with spatial overlap. Following the methodology outlined in the nnUNet paper, the framework automatically determined the batch size as 2, based on GPU memory constraints. The training process incorporated dynamic adaptation of patch size, extensive data augmentation (including scaling, rotation, mirroring, and elastic deformations), and robust training configurations to optimise nnUNet’s performance across diverse tasks. This configuration highlights nnUNet’s adaptability and precision, making it particularly well-suited for vessel segmentation, where fine-grained anatomical structures demand a high level of accuracy and consistency.
This submitted method, based on the JoB-VS framework [46], is tailored for the segmentation of brain vasculature using ultra-high-resolution 7T Time-of-Flight (ToF) Magnetic Resonance Angiography (MRA) images. JoB-VS employs a triangular lattice structure to facilitate multi-scale processing, making it particularly effective for segmenting vessels of varying sizes. The framework has been adapted to focus exclusively on vessel segmentation by configuring the loss function to exclude brain segmentation (). This adaptation enhances precision in segmenting vessels, particularly small and intricate structures, while interpolated high-resolution data further improves sensitivity.
Data processing: Pre-processing involves Z-score intensity normalisation to standardise input images. To optimise the segmentation of smaller vessels, the data is interpolated to twice its original resolution. The dataset is divided into two folds of seven subjects each for cross-validation, ensuring the robustness of the model through balanced training and evaluation datasets.
Training process: The JoB-VS framework is trained using a combination of Dice and Cross-Entropy loss terms for vessel segmentation. The Adam optimiser, with a weight decay of , is employed alongside a learning rate scheduler to ensure convergence. The model is trained with a batch size of 1 and an initial learning rate of , continuing until optimal performance is achieved.
Table 1 presents a comprehensive summary of all the submitted methods. While some of these methods were based on previously published work by the participants, others were developed specifically for this challenge — some of which have since been published as complete studies. Table 2 provides a detailed list of the published methods, including links to their corresponding codebases. Additionally, some participants supplied further information, such as the GPU models used and the computational complexity of their methods; these details are summarised in Table LABEL:tab:methods_addinfo.
| Method | Base model | Method details | Loss function | Optimiser |
| UNet MSS | UNet with multi-scale supervision | Focal Tversky | Adam | |
| UNet MSS | UNet with multi-scale supervision with deformation-aware learning | Focal Tversky | Adam | |
| UNesT |
* Hierarchical transformer
* Adaptation of a pre-trained model from the MONAI model zoo |
Dice + Binary cross-entropy | RMSprop | |
| nnUNet | A self-configuring model that adapts to dataset-specific features | Dice + Cross-entropy | AdamW | |
| SwinUNETR | Swin Transformer encoder with a CNN-based decoder | Dice + Cross-entropy | RMSprop | |
| UNesT + nnUNet + SwinUNETR | Ensemble of outputs through multi-layer 3D convolutions | Dice + Cross-entropy | AdamW | |
| UNet | - | Tversky | Adam | |
| UNet MSS | UNet with multi-scale supervision | Focal Tversky | Adam | |
| UNet MSS | UNet with multi-scale supervision | Focal Tversky | Adam | |
| UNet MSS | UNet with multi-scale supervision | Focal Tversky | Adam | |
| SwinUNETR | Swin Transformer encoder with a CNN-based decoder | Dice | ? | |
| SwinUNETR | Swin Transformer encoder with a CNN-based decoder | Over-segmentation (OSD) + 2D Dice | Adam | |
| MS-nnUNet | Multi-scale feature fusion on the final output features of the nnUNet decoder | Dice + Binary cross-entropy | SGD | |
| UNet | Processes 3D volumes using a 2D UNet by sliding along six anatomical directions (AP, PA, LR, RL, IS, SI) | Dice + Binary cross-entropy | Adam | |
| nnUNet | A self-configuring model that adapts to dataset-specific features | Dice + Binary cross-entropy | Adam | |
| JoB-VS | A triangular lattice structure to facilitate multi-scale processing | Dice + Cross-entropy | Adam |
| Method | Paper | Code | |||
|
|
[23] | https://github.com/soumickmj/DS6 | |||
|
|
[39] | https://github.com/KMarshallX/VesselBoost | |||
|
|
[44] | https://github.com/soumickmj/SPOCKMIP | |||
| [46] | https://github.com/BCV-Uniandes/JoB-VS |
5 Results
5.1 Quantitative Results
5.1.1 Open Dataset
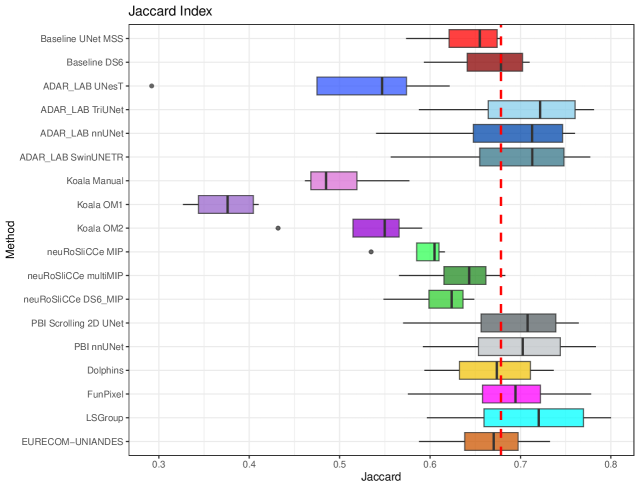
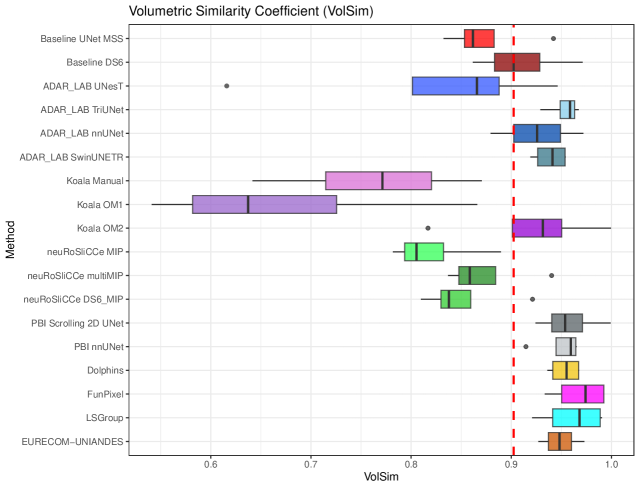
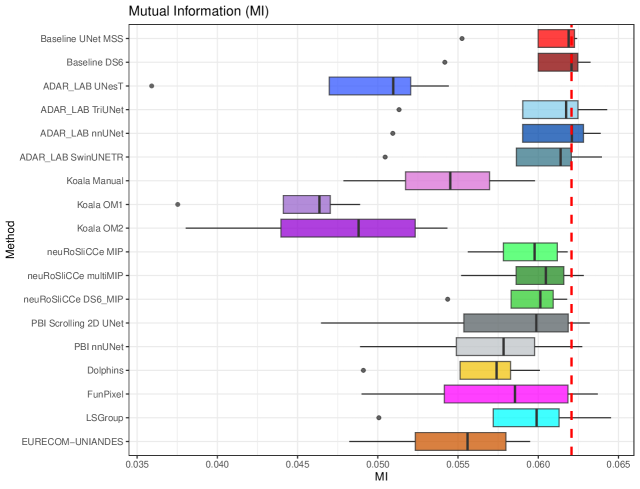
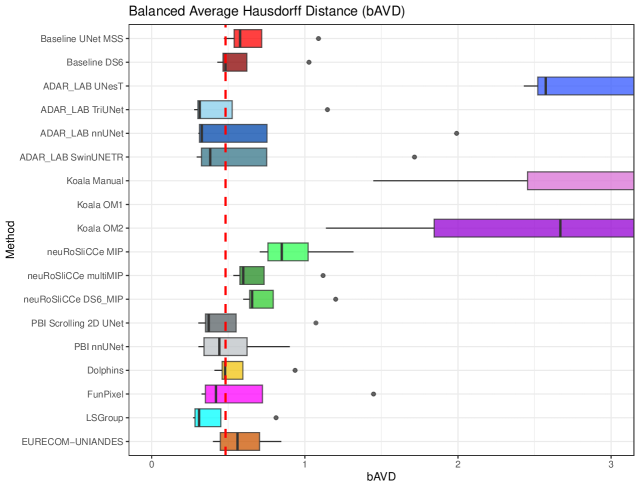
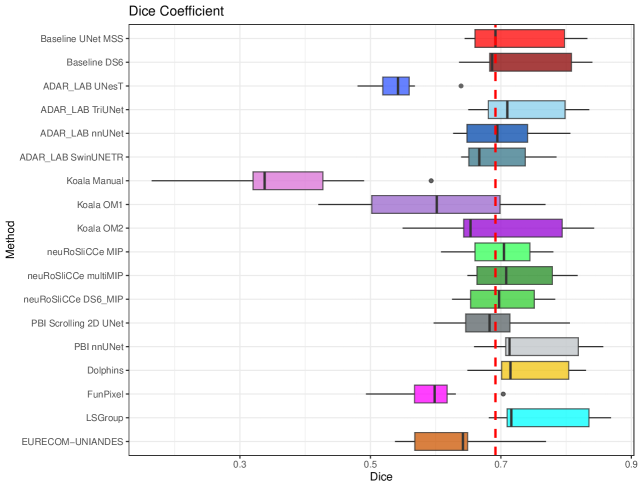
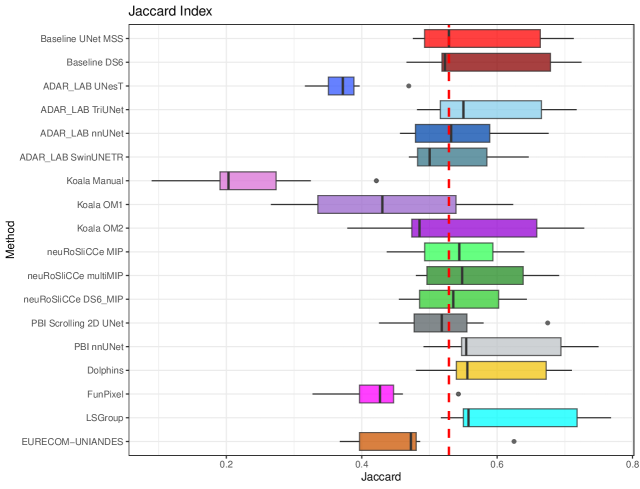
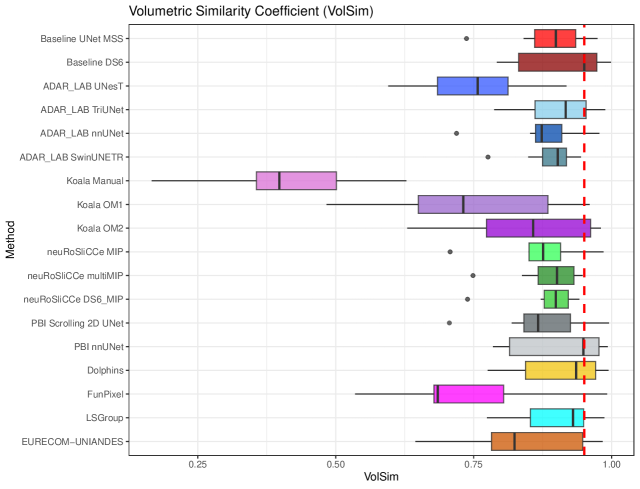
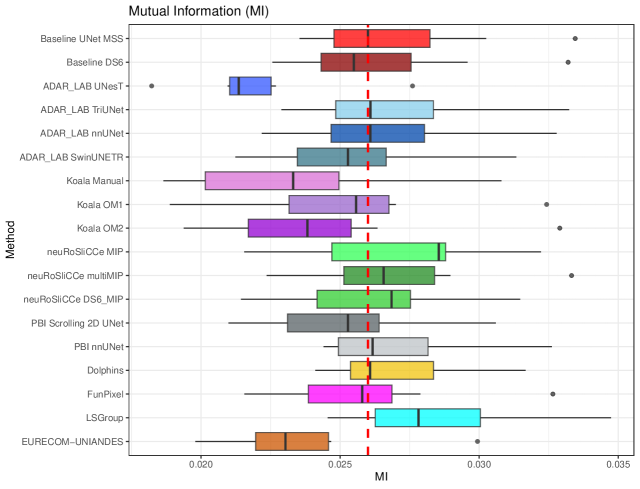
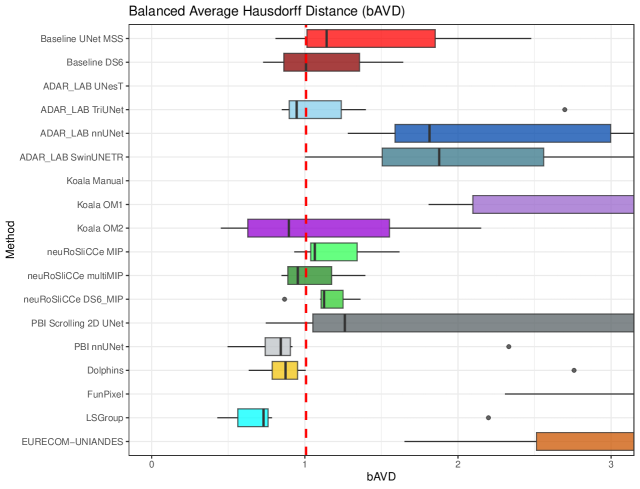
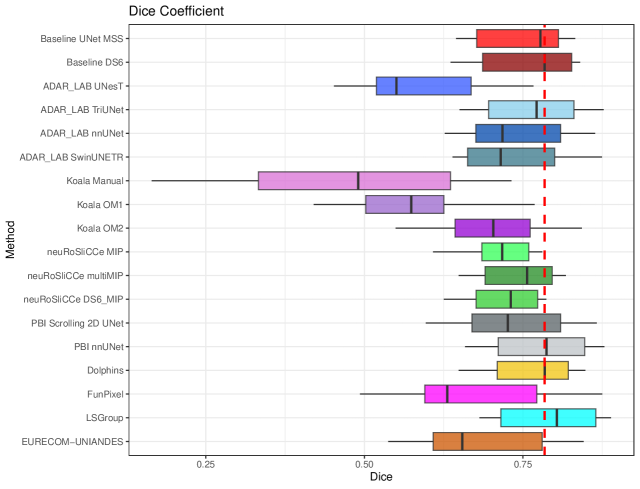
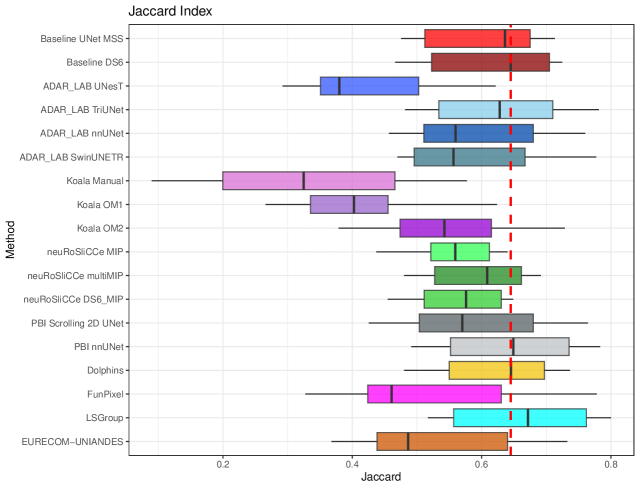
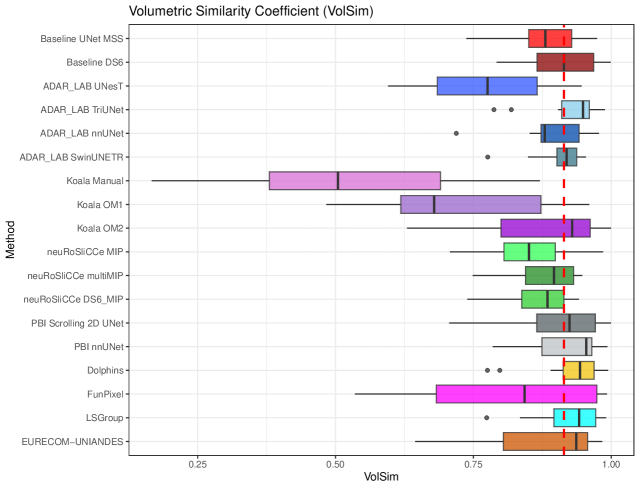
The performance of various deep learning methods was evaluated on the open dataset, comprising MRI volumes held out from the training set but sharing identical properties. The metrics assessed included the Dice coefficient (DICE), Jaccard index (JACRD), volumetric similarity coefficient (VOLSMTY), mutual information (MUTINF), and balanced average Hausdorff distance (bAHD, or bAVD according to the EvaluateSegmentation pipeline), each reported as median ± interquartile range (IQR) in Table 3, and shown in Figures 1,2,3,4, and 5.
| Method | Dice | Jaccard | VolSim | MI | bAVD |
| Baseline DS6 | 0.808 ± 0.044 | 0.678 ± 0.061 | 0.902 ± 0.045 | 0.062 ± 0.002 | 0.482 ± 0.155 |
| Baseline UNet MSS | 0.791 ± 0.039 | 0.655 ± 0.053 | 0.862 ± 0.03 | 0.062 ± 0.002 | 0.578 ± 0.18 |
| ADAR_LAB TriUNet | 0.838 ± 0.066 | 0.722 ± 0.096 | 0.959 ± 0.014 | 0.062 ± 0.003 | 0.314 ± 0.224 |
| LSGroup | 0.837 ± 0.075 | 0.72 ± 0.11 | 0.968 ± 0.047 | 0.06 ± 0.004 | 0.309 ± 0.168 |
| ADAR_LAB nnUNet | 0.832 ± 0.07 | 0.713 ± 0.099 | 0.926 ± 0.047 | 0.062 ± 0.004 | 0.328 ± 0.441 |
| ADAR_LAB SwinUNETR | 0.832 ± 0.066 | 0.713 ± 0.093 | 0.941 ± 0.027 | 0.061 ± 0.003 | 0.382 ± 0.426 |
| PBI Scrolling 2D UNet | 0.829 ± 0.058 | 0.708 ± 0.083 | 0.954 ± 0.031 | 0.06 ± 0.007 | 0.373 ± 0.2 |
| FunPixel | 0.82 ± 0.045 | 0.694 ± 0.064 | 0.974 ± 0.042 | 0.059 ± 0.008 | 0.42 ± 0.373 |
| PBI nnUNet | 0.825 ± 0.063 | 0.702 ± 0.091 | 0.959 ± 0.02 | 0.058 ± 0.005 | 0.442 ± 0.281 |
| Dolphins | 0.805 ± 0.056 | 0.674 ± 0.078 | 0.955 ± 0.026 | 0.057 ± 0.003 | 0.479 ± 0.135 |
| EURECOM-UNIANDES | 0.803 ± 0.043 | 0.67 ± 0.059 | 0.948 ± 0.023 | 0.056 ± 0.006 | 0.561 ± 0.256 |
| neuRoSliCCe multiMIP | 0.783 ± 0.035 | 0.643 ± 0.046 | 0.859 ± 0.037 | 0.06 ± 0.003 | 0.598 ± 0.158 |
| neuRoSliCCe DS6_MIP | 0.768 ± 0.029 | 0.624 ± 0.038 | 0.838 ± 0.03 | 0.06 ± 0.003 | 0.656 ± 0.153 |
| neuRoSliCCe MIP | 0.754 ± 0.02 | 0.605 ± 0.025 | 0.805 ± 0.039 | 0.06 ± 0.003 | 0.85 ± 0.262 |
| Koala OM2 | 0.71 ± 0.044 | 0.55 ± 0.051 | 0.932 ± 0.049 | 0.049 ± 0.008 | 2.669 ± 1.597 |
| ADAR_LAB UNesT | 0.707 ± 0.093 | 0.547 ± 0.099 | 0.866 ± 0.087 | 0.051 ± 0.005 | 2.573 ± 2.531 |
| Koala Manual | 0.653 ± 0.045 | 0.485 ± 0.051 | 0.771 ± 0.106 | 0.055 ± 0.005 | 3.285 ± 1.517 |
| Koala OM1 | 0.546 ± 0.064 | 0.376 ± 0.061 | 0.637 ± 0.144 | 0.046 ± 0.003 | 8.728 ± 6.924 |
The baselines, namely Baseline DS6 and Baseline UNet MSS, yielded moderate performance with DICE scores of 0.808 ± 0.044 and 0.791 ± 0.039, respectively. While these baselines provided a solid foundation, they were surpassed by several proposed methods. For instance, methods such as ADAR_LAB nnUNet and ADAR_LAB SwinUNETR achieved DICE scores of 0.832 ± 0.070 and 0.832 ± 0.066, respectively, indicating improved segmentation performance over the baselines.
Notably, methods like PBI Scrolling 2D UNet and PBI nnUNet also outperformed the baselines, with DICE scores of 0.829 ± 0.058 and 0.825 ± 0.063. Their JACRD values and volume similarities further corroborated their enhanced performance. Conversely, some methods did not surpass the baseline performance. The neuRoSliCCe series, including neuRoSliCCe multiMIP, DS6_MIP, and MIP, yielded DICE scores ranging from 0.754 ± 0.020 to 0.783 ± 0.035, which are lower than those of the baselines. Koala OM2 and ADAR_LAB UNesT performed poorer compared to the baselines.
Methods such as Koala OM1 and Koala Manual exhibited the lowest performance metrics. Koala OM1 achieved a DICE of 0.546 ± 0.064 and a JACRD of 0.376 ± 0.061, significantly underperforming compared to the baselines and other methods. The high bAHD of 8.728 ± 6.924 for Koala OM1 indicates substantial boundary inaccuracies. Similarly, Koala Manual reported a DICE of 0.653 ± 0.045 and a bAHD of 3.285 ± 1.517, failing to meet the performance levels of the baseline methods.
The ADAR_LAB TriUNet method demonstrated the highest performance among all evaluated techniques. Specifically, it achieved a DICE of 0.838 ± 0.066 and a JACRD of 0.722 ± 0.096, outperforming the baselines and other methods in these metrics. The VOLSMTY for this method was also high at 0.959 ± 0.014, indicating a strong agreement with the ground truth volumes. Furthermore, it exhibited a low bAHD of 0.314 ± 0.224, reflecting accurate boundary delineation.
Similarly, the LSGroup method showed competitive performance, with a DICE of 0.837 ± 0.075 and a JACRD of 0.720 ± 0.110. Its volume similarity was the highest among all methods at 0.968 ± 0.047, and it achieved the lowest bAHD of 0.309 ± 0.168. These results suggest that LSGroup is highly effective in both volumetric accuracy and boundary precision.
The mutual information metric remained relatively consistent across most methods, with values clustering around 0.060 ± 0.003. The baselines and top-performing methods shared similar MUTINF scores, suggesting that this metric was less discriminative among the evaluated techniques.
In summary of the results on the open dataset, ADAR_LAB TriUNet and LSGroup, consistently outperformed the baseline methods across multiple metrics.

5.1.2 Secret Dataset
The next set of evaluations were performed on the ”Secret Dataset,” which, while similar in resolution and field strength to the training data, originates from a different source and may possess distinct properties. The median ± IQR of the scores (DICE, JACRD, VOLSMTY, MUTINF and bAHD) are reported in Table 4 and shown using box plots in Figures 6,7,8,9, and 10.
| Method | Dice | Jaccard | VolSim | MI | bAVD |
| Baseline DS6 | 0.687 ± 0.125 | 0.523 ± 0.16 | 0.95 ± 0.142 | 0.025 ± 0.003 | 1.008 ± 0.495 |
| Baseline UNet MSS | 0.692 ± 0.137 | 0.529 ± 0.171 | 0.899 ± 0.074 | 0.026 ± 0.003 | 1.142 ± 0.838 |
| LSGroup | 0.716 ± 0.125 | 0.558 ± 0.168 | 0.93 ± 0.096 | 0.028 ± 0.004 | 0.73 ± 0.197 |
| PBI nnUNet | 0.713 ± 0.111 | 0.554 ± 0.147 | 0.949 ± 0.162 | 0.026 ± 0.003 | 0.843 ± 0.164 |
| Dolphins | 0.715 ± 0.103 | 0.556 ± 0.133 | 0.936 ± 0.127 | 0.026 ± 0.003 | 0.874 ± 0.165 |
| ADAR_LAB TriUNet | 0.71 ± 0.118 | 0.55 ± 0.149 | 0.917 ± 0.093 | 0.026 ± 0.004 | 0.947 ± 0.34 |
| neuRoSliCCe multiMIP | 0.708 ± 0.116 | 0.548 ± 0.142 | 0.901 ± 0.065 | 0.027 ± 0.003 | 0.954 ± 0.286 |
| neuRoSliCCe MIP | 0.705 ± 0.084 | 0.544 ± 0.101 | 0.876 ± 0.057 | 0.029 ± 0.004 | 1.065 ± 0.303 |
| neuRoSliCCe DS6_MIP | 0.697 ± 0.098 | 0.535 ± 0.117 | 0.899 ± 0.044 | 0.027 ± 0.003 | 1.126 ± 0.143 |
| ADAR_LAB nnUNet | 0.695 ± 0.093 | 0.532 ± 0.11 | 0.873 ± 0.048 | 0.026 ± 0.003 | 1.814 ± 1.407 |
| ADAR_LAB SwinUNETR | 0.667 ± 0.086 | 0.5 ± 0.102 | 0.902 ± 0.043 | 0.025 ± 0.003 | 1.878 ± 1.054 |
| Koala OM2 | 0.654 ± 0.151 | 0.485 ± 0.185 | 0.858 ± 0.189 | 0.024 ± 0.004 | 0.896 ± 0.925 |
| PBI Scrolling 2D UNet | 0.683 ± 0.068 | 0.518 ± 0.078 | 0.867 ± 0.085 | 0.025 ± 0.003 | 1.262 ± 3.01 |
| Koala OM1 | 0.602 ± 0.197 | 0.43 ± 0.204 | 0.731 ± 0.235 | 0.026 ± 0.004 | 4.601 ± 5.207 |
| EURECOM-UNIANDES | 0.642 ± 0.081 | 0.473 ± 0.084 | 0.824 ± 0.165 | 0.023 ± 0.003 | 4.31 ± 2.779 |
| FunPixel | 0.598 ± 0.05 | 0.427 ± 0.05 | 0.685 ± 0.126 | 0.026 ± 0.003 | 5.879 ± 3.658 |
| ADAR_LAB UNesT | 0.542 ± 0.04 | 0.372 ± 0.038 | 0.757 ± 0.128 | 0.021 ± 0.001 | 7.955 ± 9.856 |
| Koala Manual | 0.338 ± 0.107 | 0.203 ± 0.083 | 0.398 ± 0.145 | 0.023 ± 0.005 | 17.325 ± 14.446 |
The baseline methods, UNet MSS and DS6, yielded DICE scores of 0.692 ± 0.137 and 0.687 ± 0.125, respectively. While these baselines provided a solid reference point, they were outperformed by several proposed methods. However, certain methods did not exceed baseline performance. For instance, ADAR_LAB SwinUNETR achieved a DICE of 0.667 ± 0.086 and a JACRD of 0.500 ± 0.102, both lower than those of the baselines. Similarly, the Koala OM2 method reported a DICE of 0.654 ± 0.151 and a JACRD of 0.485 ± 0.185, failing to surpass baseline metrics.
The PBI Scrolling 2D UNet method yielded a DICE of 0.683 ± 0.068 and a JACRD of 0.518 ± 0.078, slightly below the baselines. Its VOLSMTY was 0.867 ± 0.085, and it had a relatively high bAHD of 1.262 ± 3.010, indicating less precise boundary segmentation. Methods such as EURECOM-UNIANDES and FunPixel also did not outperform the baselines, with DICE scores of 0.642 ± 0.081 and 0.598 ± 0.050, respectively. Their bAHD scores were significantly higher, suggesting challenges in boundary accuracy.
The Koala Manual method exhibited the lowest performance metrics, with a DICE of 0.338 ± 0.107 and a JACRD of 0.203 ± 0.083. Its volume similarity was 0.398 ± 0.145, and it reported a high bAHD of 17.325 ± 14.446, indicating substantial boundary inaccuracies.
The LSGroup method exhibited the highest overall performance on the Secret Dataset, achieving a DICE of 0.716 ± 0.125 and a JACRD of 0.558 ± 0.168, surpassing both baseline methods and most other evaluated techniques. Its VOLSMTY was 0.930 ± 0.096, indicating a strong concordance with the ground truth volumes. Notably, LSGroup attained a bAHD of 0.730 ± 0.197, reflecting precise boundary delineation and marking the lowest bAHD among all methods on this dataset.
Close contenders included the Dolphins method and PBI nnUNet, with DICE scores of 0.715 ± 0.103 and 0.713 ± 0.111, respectively. Their JACRD values were 0.556 ± 0.133 and 0.554 ± 0.147, demonstrating competitive overlap metrics. The VOLSMTY for these methods were also high — 0.936 ± 0.127 for Dolphins and 0.949 ± 0.162 for PBI nnUNet — suggesting robust volumetric accuracy. Their bAHD scores, 0.874 ± 0.165 for Dolphins and 0.843 ± 0.164 for PBI nnUNet, were lower than those of the baselines, indicating improved boundary accuracy.
The ADAR_LAB TriUNet method, which previously excelled on the open dataset, achieved a DICE of 0.710 ± 0.118 and a JACRD of 0.550 ± 0.149 on the Secret Dataset. While these results are commendable and surpass both baselines, they suggest a slight decrease in performance compared to its results on the open dataset. The VOLSMTY for ADAR_LAB TriUNet was 0.917 ± 0.093, and its bAHD was 0.947 ± 0.340, both indicating satisfactory but not superior performance relative to the top methods.
The neuRoSliCCe series of methods — multiMIP, MIP, and DS6_MIP — demonstrated consistent performance, with DICE scores of 0.708 ± 0.116, 0.705 ± 0.084, and 0.697 ± 0.098, respectively. These methods outperformed the baselines in terms of DICE and JACRD but did not surpass the top-performing methods. Their VOLSMTY ranged from 0.876 ± 0.057 to 0.901 ± 0.065, and their bAHD scores were comparable to the baselines, suggesting moderate boundary accuracy.
Similar to the open dataset, MUTINF showed less variation across methods, with values clustering around 0.026 ± 0.003. The LSGroup method had a slightly higher MUTINF of 0.028 ± 0.004, potentially indicating better mutual dependence between the segmented and ground truth images. However, this metric did not significantly distinguish between the top-performing methods and the baselines.
In summary, on the Secret Dataset, several proposed methods, notably LSGroup, Dolphins, and PBI nnUNet, consistently outperformed the baseline methods and other submitted methods across multiple metrics. These methods demonstrated superior generalisation capabilities to data with different properties from the training set. The performance of ADAR_LAB TriUNet, while still above the baselines, was slightly diminished compared to its results on the open dataset, suggesting potential sensitivity to dataset variations.
The implications of these findings are critical for the field of medical image segmentation. The ability of methods like LSGroup and Dolphins to maintain high performance on a dataset with different properties indicates strong generalisation, which is essential for clinical applicability. These results suggest that incorporating architectures and training strategies that promote adaptability can enhance the robustness of segmentation models.
The fact that some methods did not exceed baseline performance on the secret dataset highlights the necessity for continued research into techniques that improve generalisation. It underscores the importance of developing models that are not only optimised for specific datasets but are also resilient to variations inherent in medical imaging data.
5.1.3 Overall Performance
The final set of quantitative evaluation to judge the overall performance of the methods across datasets by aggregating the results from both the open dataset and the secret dataset. The scores are reported in Table 5 and shown using box plots in Figures 11,12,13,14, and 15.
The baseline methods, DS6 and UNet MSS, yielded DICE scores of 0.784 ± 0.140 and 0.778 ± 0.129, respectively. Some of the submitted methods did not surpass baseline performance. For example, the PBI Scrolling 2D UNet achieved a DICE of 0.726 ± 0.140 and a JACRD of 0.570 ± 0.176, which are lower than those of the baselines, and its bAHD was relatively high at 1.073 ± 1.536, indicating less precise boundary segmentation.
Methods such as Koala OM1, FunPixel, and ADAR_LAB UNesT exhibited the lowest performance metrics. Koala OM1 reported a DICE of 0.574 ± 0.123 and a JACRD of 0.403 ± 0.120, significantly underperforming compared to the baselines and top methods. FunPixel had a DICE of 0.631 ± 0.177 and a JACRD of 0.461 ± 0.207, with a high bAHD of 4.184 ± 5.953. ADAR_LAB UNesT achieved a DICE of 0.551 ± 0.149 and a JACRD of 0.380 ± 0.152, with a bAHD of 5.576 ± 8.189, indicating substantial boundary inaccuracies.
The LSGroup method demonstrated the highest overall performance across the combined datasets, achieving a DICE of 0.804 ± 0.150 (approximately 2% higher than that of DS6 and 3% higher than UNet MSS) and a JACRD of 0.672 ± 0.205, surpassing both baseline methods and all other evaluated techniques. Its VOLSMTY was 0.942 ± 0.076, indicating a strong agreement with the ground truth volumes. Additionally, LSGroup attained the lowest bAHD of 0.583 ± 0.380, reflecting precise boundary delineation.
Close competitors included the PBI nnUNet and Dolphins methods. PBI nnUNet achieved a DICE of 0.787 ± 0.136 and a JACRD of 0.649 ± 0.183, while Dolphins reported a DICE of 0.784 ± 0.112 and a JACRD of 0.645 ± 0.147. Both methods outperformed the baseline methods, with PBI nnUNet showing slightly higher VOLSMTY at 0.955 ± 0.090 compared to Dolphins at 0.943 ± 0.056. Their bAHD scores were also lower than the baselines, indicating better boundary accuracy.
The ADAR_LAB TriUNet method, which previously excelled on the open dataset, achieved an overall DICE of 0.772 ± 0.135 and a JACRD of 0.628 ± 0.176. Although these results surpass the baseline methods, they are slightly lower than those of the top-performing methods. The VOLSMTY for ADAR_LAB TriUNet was high at 0.949 ± 0.050, suggesting robust volumetric accuracy. However, its bAHD was 0.917 ± 0.529, which, while better than the baselines, was higher than that of LSGroup, indicating less precise boundary segmentation.
Methods such as neuRoSliCCe multiMIP and neuRoSliCCe DS6_MIP demonstrated moderate performance. NeuRoSliCCe multiMIP achieved a DICE of 0.757 ± 0.106 and a JACRD of 0.609 ± 0.134, outperforming the baselines in volume similarity with a score of 0.896 ± 0.087 but with a higher bAHD of 0.908 ± 0.311. NeuRoSliCCe DS6_MIP had a DICE of 0.731 ± 0.097 and a JACRD of 0.576 ± 0.119, with a bAHD of 1.114 ± 0.406, indicating less accurate boundary delineation compared to the top methods.
Notably, methods such as ADAR_LAB nnUNet and ADAR_LAB SwinUNETR, which performed well on the open dataset, did not maintain superior performance in the overall evaluation. ADAR_LAB nnUNet had a DICE of 0.718 ± 0.134 and a JACRD of 0.560 ± 0.169, while ADAR_LAB SwinUNETR had a DICE of 0.715 ± 0.137 and a JACRD of 0.556 ± 0.171. Both methods had higher bAHD scores of 1.643 ± 1.505 and 1.508 ± 1.404, respectively, suggesting decreased boundary accuracy.
In summary, the LSGroup method consistently outperformed the baseline methods across multiple metrics in the overall evaluation. Its superior DICE, JACRD, volume similarity, and lowest bAHD indicate its effectiveness in both overlap and boundary accuracy. The PBI nnUNet and Dolphins methods also demonstrated strong performance, exceeding the baselines and achieving competitive metrics.
The baselines provided a solid performance benchmark but were surpassed by several submitted methods. However, certain methods, such as PBI Scrolling 2D UNet, ADAR_LAB nnUNet, and ADAR_LAB SwinUNETR, did not consistently outperform the baselines in the overall evaluation. This suggests that while some methods may perform well on specific datasets, their generalisation across diverse data may be limited.
The inability of methods like Koala OM1, FunPixel, and ADAR_LAB UNesT to exceed baseline performance underscores the challenges in developing robust segmentation algorithms. Their lower DICE and JACRD scores, along with higher bAHD values, indicate difficulties in accurately capturing vessel structures and delineating boundaries.
The implications of these findings are significant for the advancement of medical image segmentation. The consistent superiority of the LSGroup method suggests that its architecture and training strategies effectively capture the complexities of vessel segmentation across diverse datasets. This robustness is crucial for clinical applications, where models must perform reliably on data with varying properties.
The results highlight the importance of developing methods with strong generalisation capabilities. While some methods may excel on familiar datasets, their performance may diminish when applied to data with different characteristics. Therefore, future research should focus on enhancing the adaptability of segmentation models to ensure consistent performance across various imaging conditions.
In conclusion, the overall evaluation demonstrates that certain advanced methods can surpass baseline performance and offer improved segmentation accuracy. The LSGroup method, in particular, shows promise for clinical application due to its superior performance across multiple metrics and datasets. However, the variability in performance among different methods underscores the necessity for continued development of robust, generalisable segmentation algorithms in the field of medical image analysis.
| Method | Dice | Jaccard | VolSim | MI | bAVD |
| Baseline DS6 | 0.784 ± 0.14 | 0.645 ± 0.182 | 0.914 ± 0.103 | 0.03 ± 0.033 | 0.886 ± 0.443 |
| Baseline UNet MSS | 0.778 ± 0.129 | 0.636 ± 0.163 | 0.88 ± 0.078 | 0.03 ± 0.033 | 1.087 ± 0.482 |
| LSGroup | 0.804 ± 0.15 | 0.672 ± 0.205 | 0.942 ± 0.076 | 0.032 ± 0.027 | 0.583 ± 0.38 |
| PBI nnUNet | 0.787 ± 0.136 | 0.649 ± 0.183 | 0.955 ± 0.09 | 0.03 ± 0.027 | 0.749 ± 0.384 |
| Dolphins | 0.784 ± 0.112 | 0.645 ± 0.147 | 0.943 ± 0.056 | 0.029 ± 0.027 | 0.822 ± 0.36 |
| ADAR_LAB TriUNet | 0.772 ± 0.135 | 0.628 ± 0.176 | 0.949 ± 0.05 | 0.029 ± 0.031 | 0.917 ± 0.529 |
| neuRoSliCCe multiMIP | 0.757 ± 0.106 | 0.609 ± 0.134 | 0.896 ± 0.087 | 0.029 ± 0.031 | 0.908 ± 0.311 |
| PBI Scrolling 2D UNet | 0.726 ± 0.14 | 0.57 ± 0.176 | 0.924 ± 0.106 | 0.027 ± 0.028 | 1.073 ± 1.536 |
| neuRoSliCCe DS6_MIP | 0.731 ± 0.097 | 0.576 ± 0.119 | 0.884 ± 0.076 | 0.028 ± 0.031 | 1.114 ± 0.406 |
| neuRoSliCCe MIP | 0.717 ± 0.074 | 0.559 ± 0.091 | 0.851 ± 0.093 | 0.029 ± 0.03 | 1.047 ± 0.265 |
| ADAR_LAB nnUNet | 0.718 ± 0.134 | 0.56 ± 0.169 | 0.879 ± 0.069 | 0.028 ± 0.031 | 1.643 ± 1.505 |
| ADAR_LAB SwinUNETR | 0.715 ± 0.137 | 0.556 ± 0.171 | 0.919 ± 0.036 | 0.028 ± 0.031 | 1.508 ± 1.404 |
| Koala OM2 | 0.703 ± 0.118 | 0.542 ± 0.141 | 0.929 ± 0.162 | 0.026 ± 0.019 | 1.138 ± 1.912 |
| EURECOM-UNIANDES | 0.654 ± 0.172 | 0.486 ± 0.202 | 0.936 ± 0.153 | 0.025 ± 0.028 | 1.96 ± 3.636 |
| FunPixel | 0.631 ± 0.177 | 0.461 ± 0.207 | 0.843 ± 0.291 | 0.028 ± 0.027 | 4.184 ± 5.953 |
| Koala OM1 | 0.574 ± 0.123 | 0.403 ± 0.12 | 0.679 ± 0.254 | 0.027 ± 0.017 | 5.569 ± 6.348 |
| ADAR_LAB UNesT | 0.551 ± 0.149 | 0.38 ± 0.152 | 0.776 ± 0.181 | 0.023 ± 0.022 | 5.576 ± 8.189 |
| Koala Manual | 0.49 ± 0.303 | 0.325 ± 0.266 | 0.504 ± 0.31 | 0.027 ± 0.029 | 11.104 ± 14.385 |


Conclusion of Quantitative
In conclusion, the comprehensive evaluation of several submitted methods for vessel segmentation across both the open dataset and the secret dataset has yielded significant insights into their performance and generalisation capabilities. The LSGroup method consistently demonstrated superior performance, achieving the highest metrics across both datasets. Specifically, it attained the highest Dice coefficient and Jaccard index, along with the lowest balanced average Hausdorff distance (bAHD), indicating exceptional overlap and boundary accuracy. This suggests that the LSGroup method possesses robust generalisation capabilities, effectively capturing vessel structures even when confronted with data possessing different properties from the training set.
The baseline methods, DS6 and UNet MSS, provided solid performance benchmarks, with respectable Dice coefficients and Jaccard indices. However, several proposed methods, including LSGroup, PBI nnUNet, and Dolphins, consistently surpassed these baselines. The PBI nnUNet and Dolphins methods exhibited strong performance, outperforming the baselines in key metrics such as the Dice coefficient, Jaccard index, and bAHD. This indicates that the incorporation of advanced architectures and training strategies can lead to significant improvements over standard baseline models.
Conversely, certain methods failed to surpass the baseline performance on one or both datasets. Notably, methods such as ADAR_LAB UNesT, Koala OM1, FunPixel, and Koala Manual did not exceed baseline metrics, exhibiting lower Dice coefficients and higher bAHD values. These findings highlight limitations in their segmentation capabilities and suggest challenges in their ability to generalise to datasets with different characteristics.
The baselines, while surpassed by several methods, demonstrated relatively good performance, particularly considering their simplicity compared to more complex architectures and their years of publications. Their consistent performance across both datasets underscores their reliability as reference models in vessel segmentation tasks. However, the ability of certain advanced methods to exceed baseline performance indicates that further enhancements in network design and training can yield substantial gains in segmentation accuracy.
Overall, these results emphasise the critical need for segmentation methods that combine high accuracy with strong generalisation capabilities. The superior performance of the LSGroup method suggests that it effectively addresses the complexities inherent in vessel segmentation across varied datasets. This has significant implications for clinical applications, where models must reliably perform on data from different sources and with varying properties.
Future research should focus on enhancing the adaptability of segmentation models, ensuring consistent performance across diverse imaging conditions. The development of robust, generalisable algorithms is essential for advancing the utility of deep learning in medical image analysis and ultimately improving diagnostic processes and patient outcomes.
5.2 Qualitative Results
The qualitative analysis of the segmentation methods was conducted based on expert ratings ranging from 0 to 5, where 0 indicates poor performance and 5 denotes excellent performance. The expert evaluated each method on two key aspects: Q1 — small vessel segmentation performance, and Q2 — noise-free segmentation. The evaluations were performed separately on the open dataset and the secret dataset and the results provide insights into how each method performs in capturing fine vascular structures and producing clean segmentation outputs. The results are presented in Table 6.
5.2.1 Open Dataset
Q1: Small Vessel Segmentation Performance
Both the baseline methods received a median score of 3.0 ± 0.0 for small vessel segmentation performance and the score suggests a moderate ability of the baselines to segment small vessels accurately. Methods like PBI Scrolling 2D UNet and EURECOM-UNIANDES scored slightly below the baselines with median scores of 2.5 ± 1.0. ADAR_LAB TriUNet, ADAR_LAB UNesT, Koala OM1, and FunPixel received lower median scores ranging from 2.0 ± 0.0 to 2.0 ± 0.75, indicating challenges in accurately segmenting small vessels on the open dataset. These methods did not outperform the baselines and suggest a need for improvements in handling fine vascular structures.
Other methods such as neuRoSliCCe DS6 MIP, neuRoSliCCe MIP, ADAR_LAB nnUNet, Dolphins, Koala OM2, LSGroup, and PBI nnUNet matched the baselines with median scores of 3.0, though some exhibited higher variability in performance as indicated by their IQR values. For instance, neuRoSliCCe MIP had an IQR of 0.75, suggesting some inconsistency in its performance across the dataset.
Among the submitted methods, neuRoSliCCe multiMIP and Koala Manual slightly outperformed the baselines with median scores of 3.5 ± 1.0 for Q1. The higher median score of neuRoSliCCe multiMIP indicates its enhanced capability in capturing small vascular structures compared to the baselines. However, the IQR of 1.0 suggests some variability in its performance across different samples. Similarly, Koala Manual achieved a median score of 3.5 ± 1.0, indicating that manual segmentation approaches can sometimes provide superior detail in small vessel delineation.
Q2: Noise-Free Segmentation
Both baseline methods again achieved median scores of 3.0 ± 0.0, reflecting moderate performance in producing moderately ”clean” segmentation outputs without spurious artefacts.
Most of the evaluated methods matched the baselines with median scores of 3.0, including neuRoSliCCe DS6 MIP, neuRoSliCCe multiMIP, ADAR_LAB nnUNet, Dolphins, Koala OM2, LSGroup, PBI nnUNet, PBI Scrolling 2D UNet, ADAR_LAB TriUNet, and EURECOM-UNIANDES. This indicates that these methods are comparable to the baselines in terms of generating noise-free segmentations.
However, some methods fell below the baseline performance for Q2. neuRoSliCCe MIP and ADAR_LAB SwinUNETR received median scores of 2.5, with IQRs of 1.0, suggesting variability and occasional issues with noise in their segmentation outputs. Koala OM1 and FunPixel both scored 2.0 ± 0.0, indicating consistent but lower performance in producing clean segmentations. Koala Manual had a median score of 2.0 ± 0.75, showing that manual segmentation may introduce some noise or inconsistencies.
5.2.2 Secret Dataset
Q1: Small Vessel Segmentation Performance
On the Secret Dataset, the Baseline UNet MSS achieved a higher median score of 4.0 ± 0.5 for small vessel segmentation, indicating improved performance compared to the open dataset. Baseline DS6 maintained a median score of 3.0 ± 1.0, showing consistent performance with some variability.
Methods that matched or exceeded the performance of the best baseline include neuRoSliCCe DS6 MIP, neuRoSliCCe MIP, and Koala Manual, each with a median score of 4.0. neuRoSliCCe DS6 MIP and neuRoSliCCe MIP both had an IQR of 1.0, suggesting some variability but overall strong performance in small vessel segmentation on the Secret Dataset. Koala Manual also achieved a median score of 4.0 ± 1.0, reinforcing the potential effectiveness of manual segmentation approaches in capturing small vessels.
Most other methods, including ADAR_LAB nnUNet, Dolphins, Koala OM2, LSGroup, PBI nnUNet, PBI Scrolling 2D UNet, ADAR_LAB TriUNet, ADAR_LAB SwinUNETR, EURECOM-UNIANDES, Koala OM1, and FunPixel, received median scores of 3.0, indicating performance comparable to the baseline DS6 but below the Baseline UNet MSS. ADAR_LAB UNesT scored lower with a median of 2.0 ± 1.5, suggesting challenges in small vessel segmentation on this dataset.
Q2: Noise-Free Segmentation
For noise-free segmentation on the Secret Dataset, both baseline methods achieved median scores of 3.0, with Baseline UNet MSS showing higher variability (IQR of 1.0). This indicates moderate performance in generating clean segmentation outputs.
Most methods matched the baselines with median scores of 3.0, including neuRoSliCCe DS6 MIP, neuRoSliCCe multiMIP, ADAR_LAB nnUNet, Dolphins, Koala OM2, LSGroup, PBI nnUNet, PBI Scrolling 2D UNet, and ADAR_LAB TriUNet. This suggests that these methods are capable of producing noise-free segmentations comparable to the baselines.
Some methods performed below the baselines for Q2 on the Secret Dataset. ADAR_LAB SwinUNETR, EURECOM-UNIANDES, Koala OM1, and ADAR_LAB UNesT received median scores of 2.0, indicating issues with noise in their segmentations. FunPixel and Koala Manual scored even lower, with median scores of 1.0, suggesting significant challenges in producing clean segmentation outputs without artefacts.
5.2.3 Overall Performance Across Datasets
Q1: Small Vessel Segmentation Performance
Across both datasets, neuRoSliCCe DS6 MIP, neuRoSliCCe MIP, and Koala Manual demonstrated strong performance in small vessel segmentation, often matching or exceeding the baseline methods. On the Secret Dataset, Baseline UNet MSS showed improved performance with a median score of 4.0 ± 0.5, indicating that this baseline method generalised well to the new data.
Some methods, such as ADAR_LAB nnUNet, Dolphins, Koala OM2, LSGroup, and PBI nnUNet, consistently matched the baseline performance across both datasets, indicating stable but not superior small vessel segmentation capabilities.
Methods like ADAR_LAB UNesT and FunPixel struggled with small vessel segmentation, particularly on the Secret Dataset, where they received lower median scores. This suggests that these methods may have limitations in capturing fine vascular details, especially when confronted with data possessing different properties from the training set.
Q2: Noise-Free Segmentation
For noise-free segmentation, the baseline methods maintained consistent median scores of 3.0 across both datasets, serving as reliable references for evaluating other methods.
Several methods matched the baselines in producing clean segmentations, including neuRoSliCCe DS6 MIP, neuRoSliCCe multiMIP, ADAR_LAB nnUNet, Dolphins, Koala OM2, LSGroup, PBI nnUNet, PBI Scrolling 2D UNet, and ADAR_LAB TriUNet. This consistency suggests that these methods are effective in minimising noise and artefacts in their outputs across different datasets.
Conversely, methods such as ADAR_LAB SwinUNETR, EURECOM-UNIANDES, Koala OM1, ADAR_LAB UNesT, FunPixel, and Koala Manual displayed lower performance in noise-free segmentation on the Secret Dataset. The reduced median scores indicate challenges in maintaining output quality when dealing with unfamiliar data, highlighting potential limitations in their robustness and generalisation capabilities.
5.2.4 Additional Challenge: 150
An additional qualitative evaluation was conducted on an MRA volume with a resolution of 150 — double the resolution of the volumes in both the open and Secret Datasets. Due to computational resource limitations provided for the challenge, only a limited number of methods, including the baseline models, were capable of segmenting this high-resolution volume. The ratings are preseneted in Table 7.
In terms of small vessel segmentation performance (Q1) on the high-resolution volume, EURECOM-UNIANDES achieved the highest rating with a score of 4, outperforming both baseline methods. This indicates that EURECOM-UNIANDES was particularly effective in capturing fine vascular structures at the higher resolution, demonstrating superior capability in small vessel segmentation compared to other evaluated methods.
The Baseline DS6 method received a score of 3, indicating moderate performance in small vessel segmentation. In contrast, Baseline UNet MSS and all variants of the neuRoSliCCe method (DS6 MIP, MIP, and multiMIP) each received a score of 2, suggesting that they were less effective in segmenting small vessels at this higher resolution compared to Baseline DS6 and EURECOM-UNIANDES.
For noise-free segmentation (Q2), the baseline methods Baseline DS6 and Baseline UNet MSS, as well as all the neuRoSliCCe methods, achieved a score of 3, indicating moderate performance in producing clean segmentation outputs without excessive noise or artefacts. This suggests that these methods were able to maintain a reasonable level of output quality despite the increased resolution of the volume.
In contrast, EURECOM-UNIANDES received a lower score of 2 for noise-free segmentation. This indicates that, although this method excelled in small vessel segmentation (Q1), it introduced more noise or artefacts into the segmentation outputs compared to the baselines and neuRoSliCCe methods. This trade-off suggests that the method prioritised capturing fine details over maintaining noise-free output.
The Baseline DS6 method demonstrated balanced performance, achieving a score of 3 for both small vessel segmentation and noise-free segmentation. This consistent performance indicates that Baseline DS6 maintained moderate effectiveness in both criteria, even when processing a volume with double the usual resolution.
Given only the baselines and a few submitted methods managed to generate segmentation, detailed analysis (including quantitative) and discussion are not performed on this data.
Final Conclusions Across Questions and Datasets
The qualitative analysis reveals that while some methods demonstrate strong performance in specific areas, no single method consistently outperforms the baselines across all metrics and datasets. The baseline methods themselves exhibit solid and sometimes superior performance, particularly Baseline UNet MSS, which achieved the highest median score for small vessel segmentation on the Secret Dataset.
Methods such as neuRoSliCCe DS6 MIP and neuRoSliCCe MIP show promise in small vessel segmentation, occasionally surpassing the baselines. However, their performance varies between datasets, indicating that their effectiveness may be influenced by the characteristics of the data.
In terms of noise-free segmentation, many methods match the baseline performance, suggesting that producing clean segmentation outputs is a common strength among the evaluated techniques. Nevertheless, some methods struggle with this aspect on the Secret Dataset, which may be attributed to differences in data properties that affect their ability to generalise.
The Koala Manual method, while performing well in small vessel segmentation, particularly on the Secret Dataset, shows significant variability and lower scores in noise-free segmentation. This highlights the trade-offs that may occur when prioritising fine detail capture over output cleanliness.
Overall, the baselines provide a robust benchmark, and while certain methods can match or slightly exceed their performance in specific areas, none consistently outperform them across all metrics and datasets. The results underscore the challenges in developing segmentation methods that are both highly accurate in capturing small vessels and capable of producing noise-free outputs, especially when applied to datasets with varying properties.
Future work should focus on enhancing the generalisation capabilities of segmentation methods, ensuring that they maintain high performance levels across diverse datasets. Emphasising robustness and adaptability in method development will be crucial for advancing the practical applicability of deep learning models in medical image analysis.
| Open Dataset | Secret Dataset | |||
| Method | Q1 | Q2 | Q1 | Q2 |
| Baseline UNet MSS | 3.0 ± 0.0 | 3.0 ± 0.0 | 4.0 ± 0.5 | 3.0 ± 1.0 |
| Baseline DS6 | 3.0 ± 0.0 | 3.0 ± 0.0 | 3.0 ± 1.0 | 3.0 ± 1.0 |
| neuRoSliCCe DS6 MIP | 3.0 ± 0.0 | 3.0 ± 0.0 | 4.0 ± 1.0 | 3.0 ± 0.0 |
| neuRoSliCCe multiMIP | 3.5 ± 1.0 | 3.0 ± 0.0 | 3.0 ± 1.0 | 3.0 ± 0.5 |
| neuRoSliCCe MIP | 3.0 ± 0.75 | 2.5 ± 1.0 | 4.0 ± 1.0 | 3.0 ± 0.0 |
| ADAR LAB nnUNet | 3.0 ± 0.0 | 3.0 ± 0.0 | 3.0 ± 0.0 | 3.0 ± 0.0 |
| Dolphins | 3.0 ± 0.0 | 3.0 ± 0.0 | 3.0 ± 0.0 | 3.0 ± 1.0 |
| Koala OM2 | 3.0 ± 0.0 | 3.0 ± 0.0 | 3.0 ± 0.5 | 3.0 ± 1.0 |
| LSGroup | 3.0 ± 0.75 | 3.0 ± 0.0 | 3.0 ± 0.0 | 3.0 ± 1.0 |
| PBI nnUNet | 3.0 ± 0.75 | 3.0 ± 0.0 | 3.0 ± 0.0 | 3.0 ± 1.0 |
| PBI Scrolling 2D UNet | 2.5 ± 1.0 | 3.0 ± 0.0 | 3.0 ± 0.5 | 3.0 ± 0.0 |
| ADAR LAB TriUNet | 2.0 ± 0.0 | 3.0 ± 0.0 | 3.0 ± 0.0 | 3.0 ± 0.0 |
| ADAR LAB SwinUNETR | 3.0 ± 0.0 | 2.5 ± 1.0 | 3.0 ± 0.0 | 2.0 ± 1.0 |
| EURECOM-UNIANDES | 2.5 ± 1.0 | 3.0 ± 0.0 | 3.0 ± 0.5 | 2.0 ± 1.0 |
| Koala Manual | 3.5 ± 1.0 | 2.0 ± 0.75 | 4.0 ± 1.0 | 1.0 ± 1.5 |
| ADAR LAB UNesT | 2.0 ± 0.0 | 3.0 ± 0.0 | 2.0 ± 1.5 | 2.0 ± 0.0 |
| Koala OM1 | 2.0 ± 0.75 | 2.0 ± 0.0 | 3.0 ± 0.5 | 2.0 ± 0.5 |
| FunPixel | 2.0 ± 0.75 | 2.0 ± 0.0 | 3.0 ± 0.5 | 1.0 ± 1.0 |
| Method | Q1 | Q2 |
| Baseline DS6 | 3 | 3 |
| Baseline UNet MSS | 2 | 3 |
| EURECOM-UNIANDES | 4 | 2 |
| neuRoSliCCe DS6 MIP | 2 | 3 |
| neuRoSliCCe MIP | 2 | 3 |
| neuRoSliCCe multiMIP | 2 | 3 |
6 Acknowledgements
The organisers extend their gratitude to Paul Yushkevich and Maria A. Zululaga of the ISBI 2023 Challenge Committee for their invaluable guidance and support. The organisers also wish to thank Ignacio Larrabide, Camila García, and other members of the co-located challenge, SHINY-ICARUS: Segmentation over Three-Dimensional Rotational Angiography of the Internal Carotid Artery with Aneurysm, for their support with the shared on-site organisation. Finally, the organisers express their sincere appreciation to Sage Bionetworks for their SYPANSE platform, which hosted the challenge dataset.H.M. was supported in part by the German Research Foundation (DFG) under project numbers MA 9235/1-1 (446268581) and MA 9235/3-1 (501214112), as well as by the Deutsche Alzheimer Gesellschaft (DAG) e.V. (MD-DARS and BB-DARS project). C.C.Y., T.L.H., Y.S.T., Y.Z.F., Y.C.Y., and J.D.H. received support in part from the Ministry of Science and Technology, Taiwan, under Grant No. MOST-111-2218-E-A49-022, as well as from the computing services of the National Center for High-Performance Computing (NCHC) and the Taiwan Computing Cloud (TWCC).K.X., S.L., F.L.R., and S.B. acknowledge Steffen Bollmann for his invaluable support with high-performance computing facilities, Docker containers, and Neurodesk.The research of R.E.J. leading to these results was funded by the French government, under the management of the Agence Nationale de la Recherche, as part of the ”Investissements d’avenir” programme. This includes funding under reference ANR-19-P3IA-0001 (PRAIRIE 3IA Institute) and reference ANR-10-IAHU-0006 (Agence Nationale de la Recherche-10-IA Institut Hospitalo-Universitaire-6).The work of M.A.Z. was supported by the ANR JCJC project I-VESSEG (22-CE45-0015-01).
References
- [1] J. M. Wardlaw, C. Smith, M. Dichgans, Small vessel disease: mechanisms and clinical implications, The Lancet Neurology 18 (7) (2019) 684–696.
- [2] E. Chalkias, I.-N. Chalkias, C. Bakirtzis, L. Messinis, G. Nasios, P. Ioannidis, D. Pirounides, Differentiating degenerative from vascular dementia with the help of optical coherence tomography angiography biomarkers, in: Healthcare, Vol. 10, MDPI, 2022, p. 539.
- [3] Y. Duan, W. Shan, L. Liu, Q. Wang, Z. Wu, P. Liu, J. Ji, Y. Liu, K. He, Y. Wang, Primary categorizing and masking cerebral small vessel disease based on “deep learning system”, Frontiers in Neuroinformatics 14 (2020) 17.
- [4] J. Litak, M. Mazurek, B. Kulesza, P. Szmygin, J. Litak, P. Kamieniak, C. Grochowski, Cerebral small vessel disease, International journal of molecular sciences 21 (24) (2020) 9729.
- [5] J. Hendrikse, J. J. Zwanenburg, F. Visser, T. Takahara, P. Luijten, Noninvasive depiction of the lenticulostriate arteries with time-of-flight mr angiography at 7.0 t, Cerebrovascular diseases 26 (6) (2008) 624–629.
- [6] C.-K. Kang, C.-W. Park, J.-Y. Han, S.-H. Kim, C.-A. Park, K.-N. Kim, S.-M. Hong, Y.-B. Kim, K. H. Lee, Z.-H. Cho, Imaging and analysis of lenticulostriate arteries using 7.0-tesla magnetic resonance angiography, Magnetic Resonance in Medicine: An Official Journal of the International Society for Magnetic Resonance in Medicine 61 (1) (2009) 136–144.
- [7] H. Mattern, A. Sciarra, F. Godenschweger, D. Stucht, F. Lüsebrink, G. Rose, O. Speck, Prospective motion correction enables highest resolution time-of-flight angiography at 7t, Magnetic resonance in medicine 80 (1) (2018) 248–258.
- [8] S. Bollmann, H. Mattern, M. Bernier, S. D. Robinson, D. Park, O. Speck, J. R. Polimeni, Imaging of the pial arterial vasculature of the human brain in vivo using high-resolution 7t time-of-flight angiography, Elife 11 (2022) e71186.
- [9] J. Staal, M. D. Abràmoff, M. Niemeijer, M. A. Viergever, B. Van Ginneken, Ridge-based vessel segmentation in color images of the retina, IEEE transactions on medical imaging 23 (4) (2004) 501–509.
- [10] M. Al-Rawi, M. Qutaishat, M. Arrar, An improved matched filter for blood vessel detection of digital retinal images, Computers in biology and medicine 37 (2) (2007) 262–267.
- [11] R. Annunziata, A. Garzelli, L. Ballerini, A. Mecocci, E. Trucco, Leveraging multiscale hessian-based enhancement with a novel exudate inpainting technique for retinal vessel segmentation, IEEE journal of biomedical and health informatics 20 (4) (2015) 1129–1138.
- [12] R. D. Rudyanto, S. Kerkstra, E. M. Van Rikxoort, C. Fetita, P.-Y. Brillet, C. Lefevre, W. Xue, X. Zhu, J. Liang, I. Öksüz, et al., Comparing algorithms for automated vessel segmentation in computed tomography scans of the lung: the vessel12 study, Medical image analysis 18 (7) (2014) 1217–1232.
- [13] K. M. Timmins, I. C. van der Schaaf, E. Bennink, Y. M. Ruigrok, X. An, M. Baumgartner, P. Bourdon, R. De Feo, T. Di Noto, F. Dubost, et al., Comparing methods of detecting and segmenting unruptured intracranial aneurysms on tof-mras: The adam challenge, Neuroimage 238 (2021) 118216.
- [14] C. H. Sudre, K. Van Wijnen, F. Dubost, H. Adams, D. Atkinson, F. Barkhof, M. A. Birhanu, E. E. Bron, R. Camarasa, N. Chaturvedi, et al., Where is valdo? vascular lesions detection and segmentation challenge at miccai 2021, arXiv preprint arXiv:2208.07167.
- [15] W. Liao, K. Rohr, C. K. Kang, Z. H. Cho, L. Fellow, S. Wörz, Automatic 3D segmentation and quantification of lenticulostriate arteries from high-resolution 7 tesla MRA images, IEEE Transactions on Image Processing 25 (1) (2016) 400–413. doi:10.1109/TIP.2015.2499085.
- [16] A. F. Frangi, W. J. Niessen, K. L. Vincken, M. A. Viergever, Multiscale vessel enhancement filtering, in: International conference on medical image computing and computer-assisted intervention, Springer, 1998, pp. 130–137.
- [17] C. Canero, P. Radeva, Vesselness enhancement diffusion, Pattern Recognition Letters 24 (16) (2003) 3141–3151.
- [18] R. Manniesing, W. Niessen, Multiscale vessel enhancing diffusion in ct angiography noise filtering, in: Biennial International Conference on Information Processing in Medical Imaging, Springer, 2005, pp. 138–149.
- [19] O. Ronneberger, P. Fischer, T. Brox, U-net: Convolutional networks for biomedical image segmentation, in: International Conference on Medical image computing and computer-assisted intervention, Springer, 2015, pp. 234–241. doi:10.1007/978-3-319-24574-4\_28.
- [20] S. Yang, J. Kweon, J.-H. Roh, J.-H. Lee, H. Kang, L.-J. Park, D. J. Kim, H. Yang, J. Hur, D.-Y. Kang, et al., Deep learning segmentation of major vessels in x-ray coronary angiography, Scientific reports 9 (1) (2019) 1–11.
- [21] M. Livne, J. Rieger, O. U. Aydin, A. A. Taha, E. M. Akay, T. Kossen, J. Sobesky, J. D. Kelleher, K. Hildebrand, D. Frey, et al., A u-net deep learning framework for high performance vessel segmentation in patients with cerebrovascular disease, Frontiers in neuroscience 13 (2019) 97.
- [22] D. Chen, Y. Ao, S. Liu, Semi-supervised learning method of u-net deep learning network for blood vessel segmentation in retinal images, Symmetry 12 (7) (2020) 1067.
- [23] S. Chatterjee, K. Prabhu, M. Pattadkal, G. Bortsova, C. Sarasaen, F. Dubost, H. Mattern, M. de Bruijne, O. Speck, A. Nürnberger, Ds6: Deformation-aware semi-supervised learning: Application to small vessel segmentation with noisy training data, Journal of Imaging 8 (10) (2022) 259.
- [24] M. Hanke, F. J. Baumgartner, P. Ibe, F. R. Kaule, S. Pollmann, O. Speck, W. Zinke, J. Stadler, A high-resolution 7-tesla fmri dataset from complex natural stimulation with an audio movie, Scientific data 1 (1) (2014) 1–18.
- [25] A. Fedorov, R. Beichel, J. Kalpathy-Cramer, J. Finet, J.-C. Fillion-Robin, S. Pujol, C. Bauer, D. Jennings, F. Fennessy, M. Sonka, et al., 3d slicer as an image computing platform for the quantitative imaging network, Magnetic resonance imaging 30 (9) (2012) 1323–1341.
-
[26]
S. Chatterjee, H. Mattern, F. Dubost, S. Schreiber, A. Nürnberger, O. Speck, Smile-uhura: Small vessel segmentation at mesoscopic scale from ultra-high resolution 7t magnetic resonance angiograms (2022).
doi:10.7303/SYN47164761.
URL https://repo-prod.prod.sagebase.org/repo/v1/doi/locate?id=syn47164761&type=ENTITY - [27] S. Chatterjee, F. Gaidzik, A. Sciarra, H. Mattern, G. Janiga, O. Speck, A. Nürnberger, S. Pathiraja, Pulaski: Learning inter-rater variability using statistical distances to improve probabilistic segmentation, arXiv preprint arXiv:2312.15686.
- [28] H. Mattern, Openly available sMall vEsseL sEgmenTaTion pipelinE (OMELETTE), in: 2021 ISMRM & SMRT Annual Meeting & Exhibition, 2021, p. 3745.
- [29] S. Kohl, B. Romera-Paredes, C. Meyer, J. De Fauw, J. R. Ledsam, K. Maier-Hein, S. Eslami, D. Jimenez Rezende, O. Ronneberger, A probabilistic u-net for segmentation of ambiguous images, Advances in neural information processing systems 31.
- [30] O. U. Aydin, A. A. Taha, A. Hilbert, A. A. Khalil, I. Galinovic, J. B. Fiebach, D. Frey, V. I. Madai, On the usage of average hausdorff distance for segmentation performance assessment: hidden error when used for ranking, European radiology experimental 5 (2021) 1–7.
- [31] A. A. Taha, A. Hanbury, Metrics for evaluating 3d medical image segmentation: analysis, selection, and tool, BMC medical imaging 15 (2015) 1–28.
- [32] G. Zeng, X. Yang, J. Li, L. Yu, P.-A. Heng, G. Zheng, 3d u-net with multi-level deep supervision: fully automatic segmentation of proximal femur in 3d mr images, in: Machine Learning in Medical Imaging: 8th International Workshop, MLMI 2017, Held in Conjunction with MICCAI 2017, Quebec City, QC, Canada, September 10, 2017, Proceedings 8, Springer, 2017, pp. 274–282.
- [33] X. Yu, Q. Yang, Y. Zhou, L. Y. Cai, R. Gao, H. H. Lee, T. Li, S. Bao, Z. Xu, T. A. Lasko, et al., Unest: local spatial representation learning with hierarchical transformer for efficient medical segmentation, Medical Image Analysis 90 (2023) 102939.
- [34] F. Isensee, P. F. Jaeger, S. A. Kohl, J. Petersen, K. H. Maier-Hein, nnu-net: a self-configuring method for deep learning-based biomedical image segmentation, Nature methods 18 (2) (2021) 203–211.
- [35] M. J. Cardoso, W. Li, R. Brown, N. Ma, E. Kerfoot, Y. Wang, B. Murrey, A. Myronenko, C. Zhao, D. Yang, et al., Monai: An open-source framework for deep learning in healthcare, arXiv preprint arXiv:2211.02701.
- [36] I. Loshchilov, F. Hutter, Decoupled weight decay regularization, in: International Conference on Learning Representations, 2019.
- [37] Z. Liu, Y. Lin, Y. Cao, H. Hu, Y. Wei, Z. Zhang, S. Lin, B. Guo, Swin transformer: Hierarchical vision transformer using shifted windows, in: Proceedings of the IEEE/CVF international conference on computer vision, 2021, pp. 10012–10022.
- [38] A. Hatamizadeh, V. Nath, Y. Tang, D. Yang, H. R. Roth, D. Xu, Swin unetr: Swin transformers for semantic segmentation of brain tumors in mri images, in: International MICCAI brainlesion workshop, Springer, 2021, pp. 272–284.
- [39] M. Xu, F. L. Ribeiro, M. Barth, M. Bernier, S. Bollmann, S. Chatterjee, F. Cognolato, O. F. Gulban, V. Itkyal, S. Liu, H. Mattern, J. R. Polimeni, T. B. Shaw, O. Speck, S. Bollmann, Vesselboost: A Python Toolbox for Small Blood Vessel Segmentation in Human Magnetic Resonance Angiography Data, Aperture Neuro 4. doi:10.52294/001c.123217.
- [40] Ö. Çiçek, A. Abdulkadir, S. S. Lienkamp, T. Brox, O. Ronneberger, 3d u-net: learning dense volumetric segmentation from sparse annotation, in: Medical Image Computing and Computer-Assisted Intervention–MICCAI 2016: 19th International Conference, Athens, Greece, October 17-21, 2016, Proceedings, Part II 19, Springer, 2016, pp. 424–432.
-
[41]
H. Mattern, Openly available small vessel segmentation pipeline (omelette), 29th Annual Meeting of International Society of Magnetic Resonance in Medicine (ISMRM), May 2021, virtual meeting, 2021.
URL https://archive.ismrm.org/2021/3745.html - [42] N. J. Tustison, B. B. Avants, P. A. Cook, Y. Zheng, A. Egan, P. A. Yushkevich, J. C. Gee, N4itk: improved n3 bias correction, IEEE transactions on medical imaging 29 (6) (2010) 1310–1320.
- [43] J. V. Manjón, P. Coupé, L. Martí-Bonmatí, D. L. Collins, M. Robles, Adaptive non-local means denoising of mr images with spatially varying noise levels, Journal of Magnetic Resonance Imaging 31 (1) (2010) 192–203.
- [44] C. Radhakrishna, K. V. Chintalapati, S. C. H. R. Kumar, R. Sutrave, H. Mattern, O. Speck, A. Nürnberger, S. Chatterjee, Spockmip: Segmentation of vessels in mras with enhanced continuity using maximum intensity projection as loss, arXiv preprint arXiv:2407.08655.
- [45] N. Abraham, N. M. Khan, A novel focal tversky loss function with improved attention u-net for lesion segmentation, in: 2019 IEEE 16th international symposium on biomedical imaging (ISBI 2019), IEEE, 2019, pp. 683–687.
- [46] N. Valderrama, I. Pitsiorlas, L. Vargas, P. Arbeláez, M. A. Zuluaga, Job-vs: Joint brain-vessel segmentation in tof-mra images, in: 2023 IEEE 20th International Symposium on Biomedical Imaging (ISBI), IEEE, 2023, pp. 1–5.