Coherently Coupled Carrier and Phonon Dynamics in Elemental Tellurium Probed by Few-Femtosecond Core-Level Transient Absorption
Abstract
The narrow bandgap semiconductor elemental tellurium (Te) has a unique electronic structure due to strong spin-orbit splitting and a lack of inversion symmetry of it’s helical lattice. Using broadband extreme ultraviolet core-level transient absorption, we measure simultaneously the coherently coupled photo-induced carrier and lattice dynamics at the Te N4,5 edge initiated by a few-cycle NIR pulse. Ultrafast excitation of carriers leads to a coherently excited A1g phonon oscillation and the generation of a hot carrier population distribution that oscillates in temperature, and the phonon excursion and hot carrier temperature are out of phase with respect to each other. The depths of modulation suggest a significant coupling between the electronic and lattice degrees of freedom in Te. A long-lived shift of the absorption edge suggests a metastable excited state of Te in a new equilibrium potential energy surface that lives on the order of the carrier recombination timescale. The observed phonon-induced oscillations of the hot carriers are supportive of a semiconductor-to-metal light-induced phase transition, whereby Te becomes more metallic with increasing phonon-induced displacement. Additionally, near the Fermi level we observe an energy-dependent phase of the displacive excitation of the A1g phonon mode. The discovery of coherent coupling between the lattice and hot carriers in Te provides the basis to investigate coherent interactions between spin and orbital degrees of freedom. The results spectrally and temporally resolve the correlation between photo-excited hot carriers and coherent lattice excitations, providing insight on the optical manipulation of the tellurium electronic structure at high carrier densities exceeding .
I Introduction
Tellurium (Te) is an elemental semiconductor that has attracted extensive interest due to its chiral structure of connected Van der Waals helical chains [1]. The strong spin-orbit interaction and chiral structure lead to many exotic electronic properties that include radial spin textures [2], topological phase transitions [3], and a quantum Hall effect [4]. An exceptionally high field effect mobility [5], resistance to oxidation [5], and thickness-tunable band gap of Te nanowires enables potential application in p-type transistors at the quantum confinement scale [6]. The high level of nested electronic bands also inherently leads to favorable thermoelectric properties in p-type Te where knowledge of carrier-phonon scattering is of vital importance [7]. Underlying these favorable properties are two anisotropic lone electron pairs at the valence band maximum (VBM) and isotropic anti-bonding -orbitals at the conduction band minimum (CBM). Important to realizing applications with Te is understanding the non-equilibrium carrier dynamics in both its valence and conduction bands. Manipulation of the chiral structure is possible by excitation of the electrons, which thus enables coupling of the electronic, lattice, and spin degrees of freedom. This is achievable via intense ultrafast laser pulses that may induce dynamic coupling between the electrons and lattice [8]. While optical-pump probe [9, 8, 10] and photoelectron spectroscopy [11] have made progress in the measurement of lattice and carrier dynamics in Te, simultaneous measurement remains difficult. In these regards, a time-resolved spectroscopic method that can resolve both the hot carriers and excited lattice configuration will be helpful in understanding the coupling of the lone pair and anti-bonding orbitals to obtain useful properties.
In previous ultrafast studies of elemental Te, laser excitation was shown to induce a transient semiconductor-to-metal transition by distortion along the A1g phonon coordinate [8, 10, 12]. It was also demonstrated, using polarized optical transient reflectivity spectroscopy, that there is a band-splitting in the conduction band minimum that emerges at the H-valley and decays over 30 ps by relaxation of the carriers to the ground state [13]. More recently, it was determined with transient reflectivity in the mid-IR spectral region that the Auger recombination at the H-valley occurs over the same timescale [14]. Coherent dynamics of the A1g phonon have been studied extensively [15], investigating the impacts of carrier density, diffusion [9], and electronic softening [16] of the mode. Further investigation is needed as to how the A1g coherent phonon motion couples to the hot carriers that influence these effects and how hot carriers are possibly associated with a light-induced phase transition.
In this work, we provide experimental characterization of the hot carrier dynamics and their coupling to the lattice via broadband extreme ultraviolet (XUV) transient absorption measurements at the Te N4,5 edge of Te thin films. The core-level transitions from the Te shell to the Fermi level probe the carriers in the valence band structure, changes to the lattice, and transient modification of the electronic structure with few-femtosecond resolution. We: (1) track the carrier thermalization and cooling processes, (2) characterize coherent coupling of the lattice and electronic degrees of freedom, and (3) measure the photo-induced lattice distortion coupled to the electronic structure. By exciting Te with a few-femtosecond laser pulse that spans visible to NIR wavelengths (500-1000 nm), at carrier densities around , we observe the generation of hot holes and electrons in the electronic band structure and coherent excitation of the A1g phonon mode. The high energy carriers rapidly thermalize through electron-electron (5 fs) and electron-phonon (0.15(1) ps) scattering to a hot Fermi-Dirac distribution and subsequently cool over the course of 1.60(2) ps. Due to coupling between electronic and lattice degrees of freedom, excitation of the A1g mode coherently modulates the temperature of the hot carriers with an observed nearly phase difference between the hot carriers the phonon-driven displacement. We attribute this to a variation of the electronic heat capacity as Te becomes more metallic when the structure is symmetrized by the A1g mode. This coherent anti-correlation between phonon excursion and carrier temperature, predicted by Giret et al. [17] and previously observed in the A7 semimetals [18, 19] and CDW materials [20], is also now observed in a degenerate semiconductor. Further, we measure a long-lived distortion of the lattice along the A1g phonon mode coordinate that decays over 31(2) ps. This is consistent with the hypothesis that carrier recombination times in Te [14] determine the lifetime of the metastable phase. Lastly, we resolve the spectral phase of the coherent phonon, which provides insight into the effects of hot carrier relaxation in the generation of the A1g phonon and identify a rad phase at the frequency attributed to weak excitation of the E1TO phonon.
II Experimental
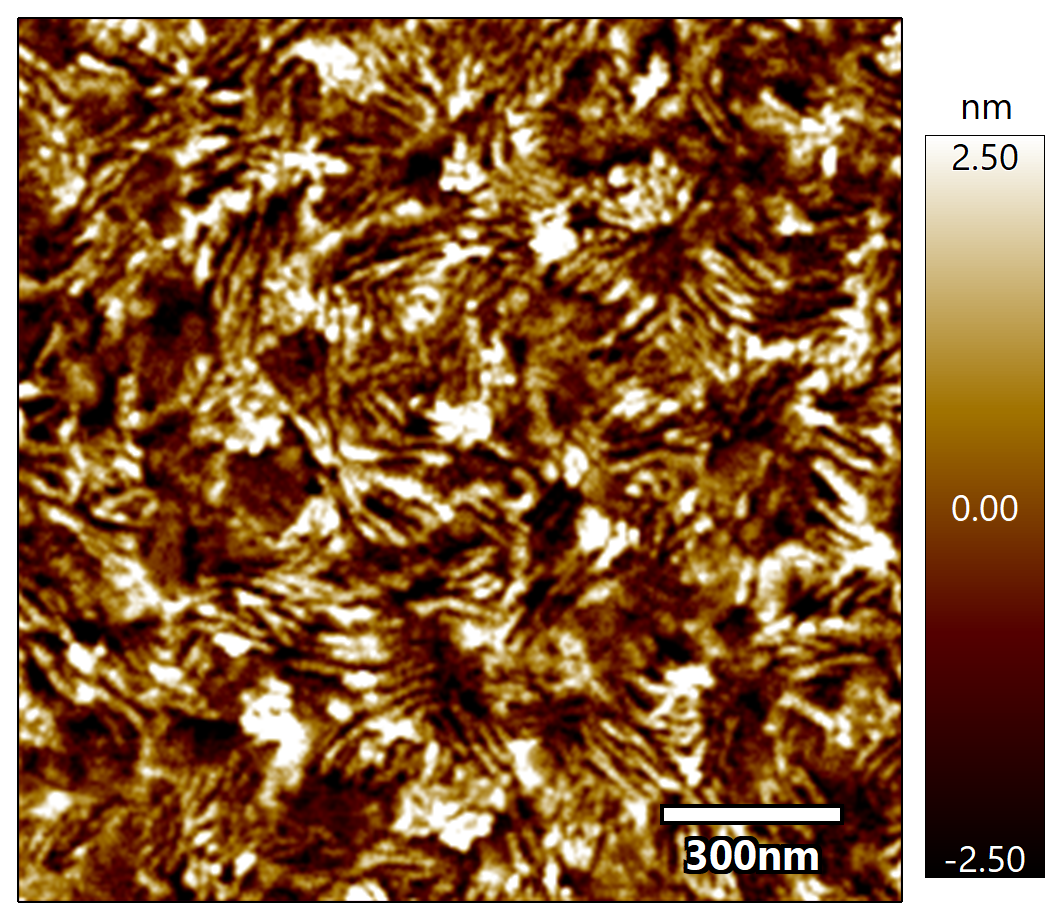
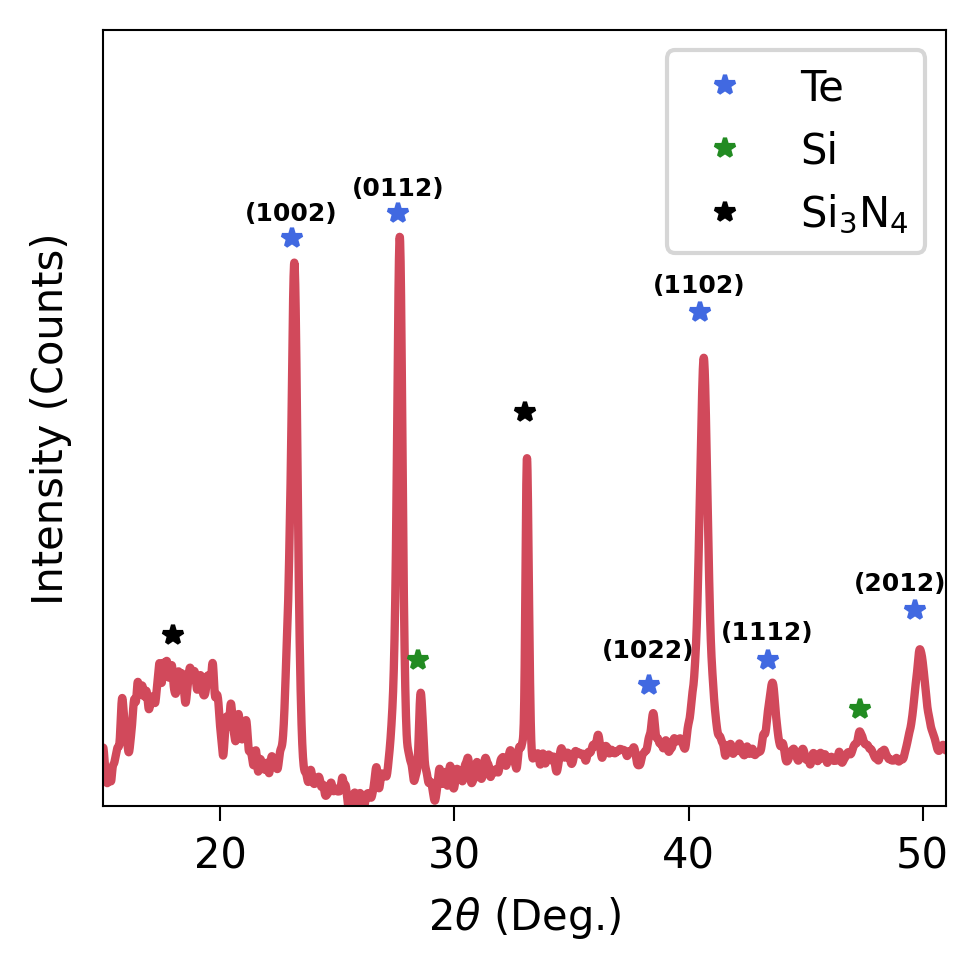
In the experiments we used polycrystalline Te films that are electron beam evaporated (Lebow) onto 30 nm thick silicon nitride windows (Norcada). The Te thickness was confirmed by atomic force scanning tip microscopy to be approximately 100 nm (see Fig. 6 in Appendix B). The trigonal form of Te is expected to form following crystallization of initially amorphous films over the course of a few minutes at room temperature [21]. This was confirmed by x-ray diffraction of the Te samples on silicon nitride (see Fig. 7 in Appendix B). To avoid sample evaporation, ablation, or laser pulse induced amorphization, careful consideration was taken to reduce laser induced heating during the experiment by chopping both the pump and probe to a repetition rate of 100 Hz. The XUV pump-probe experiments were performed at room temperature with a broadband attosecond XUV probe generated by focusing a near single cycle visible to near infrared laser pulse into argon gas for High Harmonic Generation (HHG) [22]. The same optical laser pulse is split before the HHG generation region in a Mach-Zender interferometer where it is delayed in time relative to the XUV probe from -100 to 3000 fs in steps of 6.6 fs. A measurement at shorter timescales used 0.66 fs steps from -30 to 90 fs along with parallel XUV transient absorption measurements in neon to obtain the zero-delay and the instrument response of 6.4(5) fs (see Appendix C). The carrier density induced by the pump is calculated by using the absorption coefficient and reflectance at 800 nm [23]. Further details on the instrument and XUV source are in Appendix A.
III Results
In this section we first present the XUV transient absorption spectra at a carrier density exceeding the photo-induced phase transition threshold [12]. Subsequently, the spectral contributions are decomposed to disentangle the electronic and lattice degrees of freedom. We use both a simple model and then a bi-linear decomposition for analysis. Finally, the temporal response of the spectral contributions are characterized and fitted with a multi-temperature model.
III.1 XUV Transient Absorption
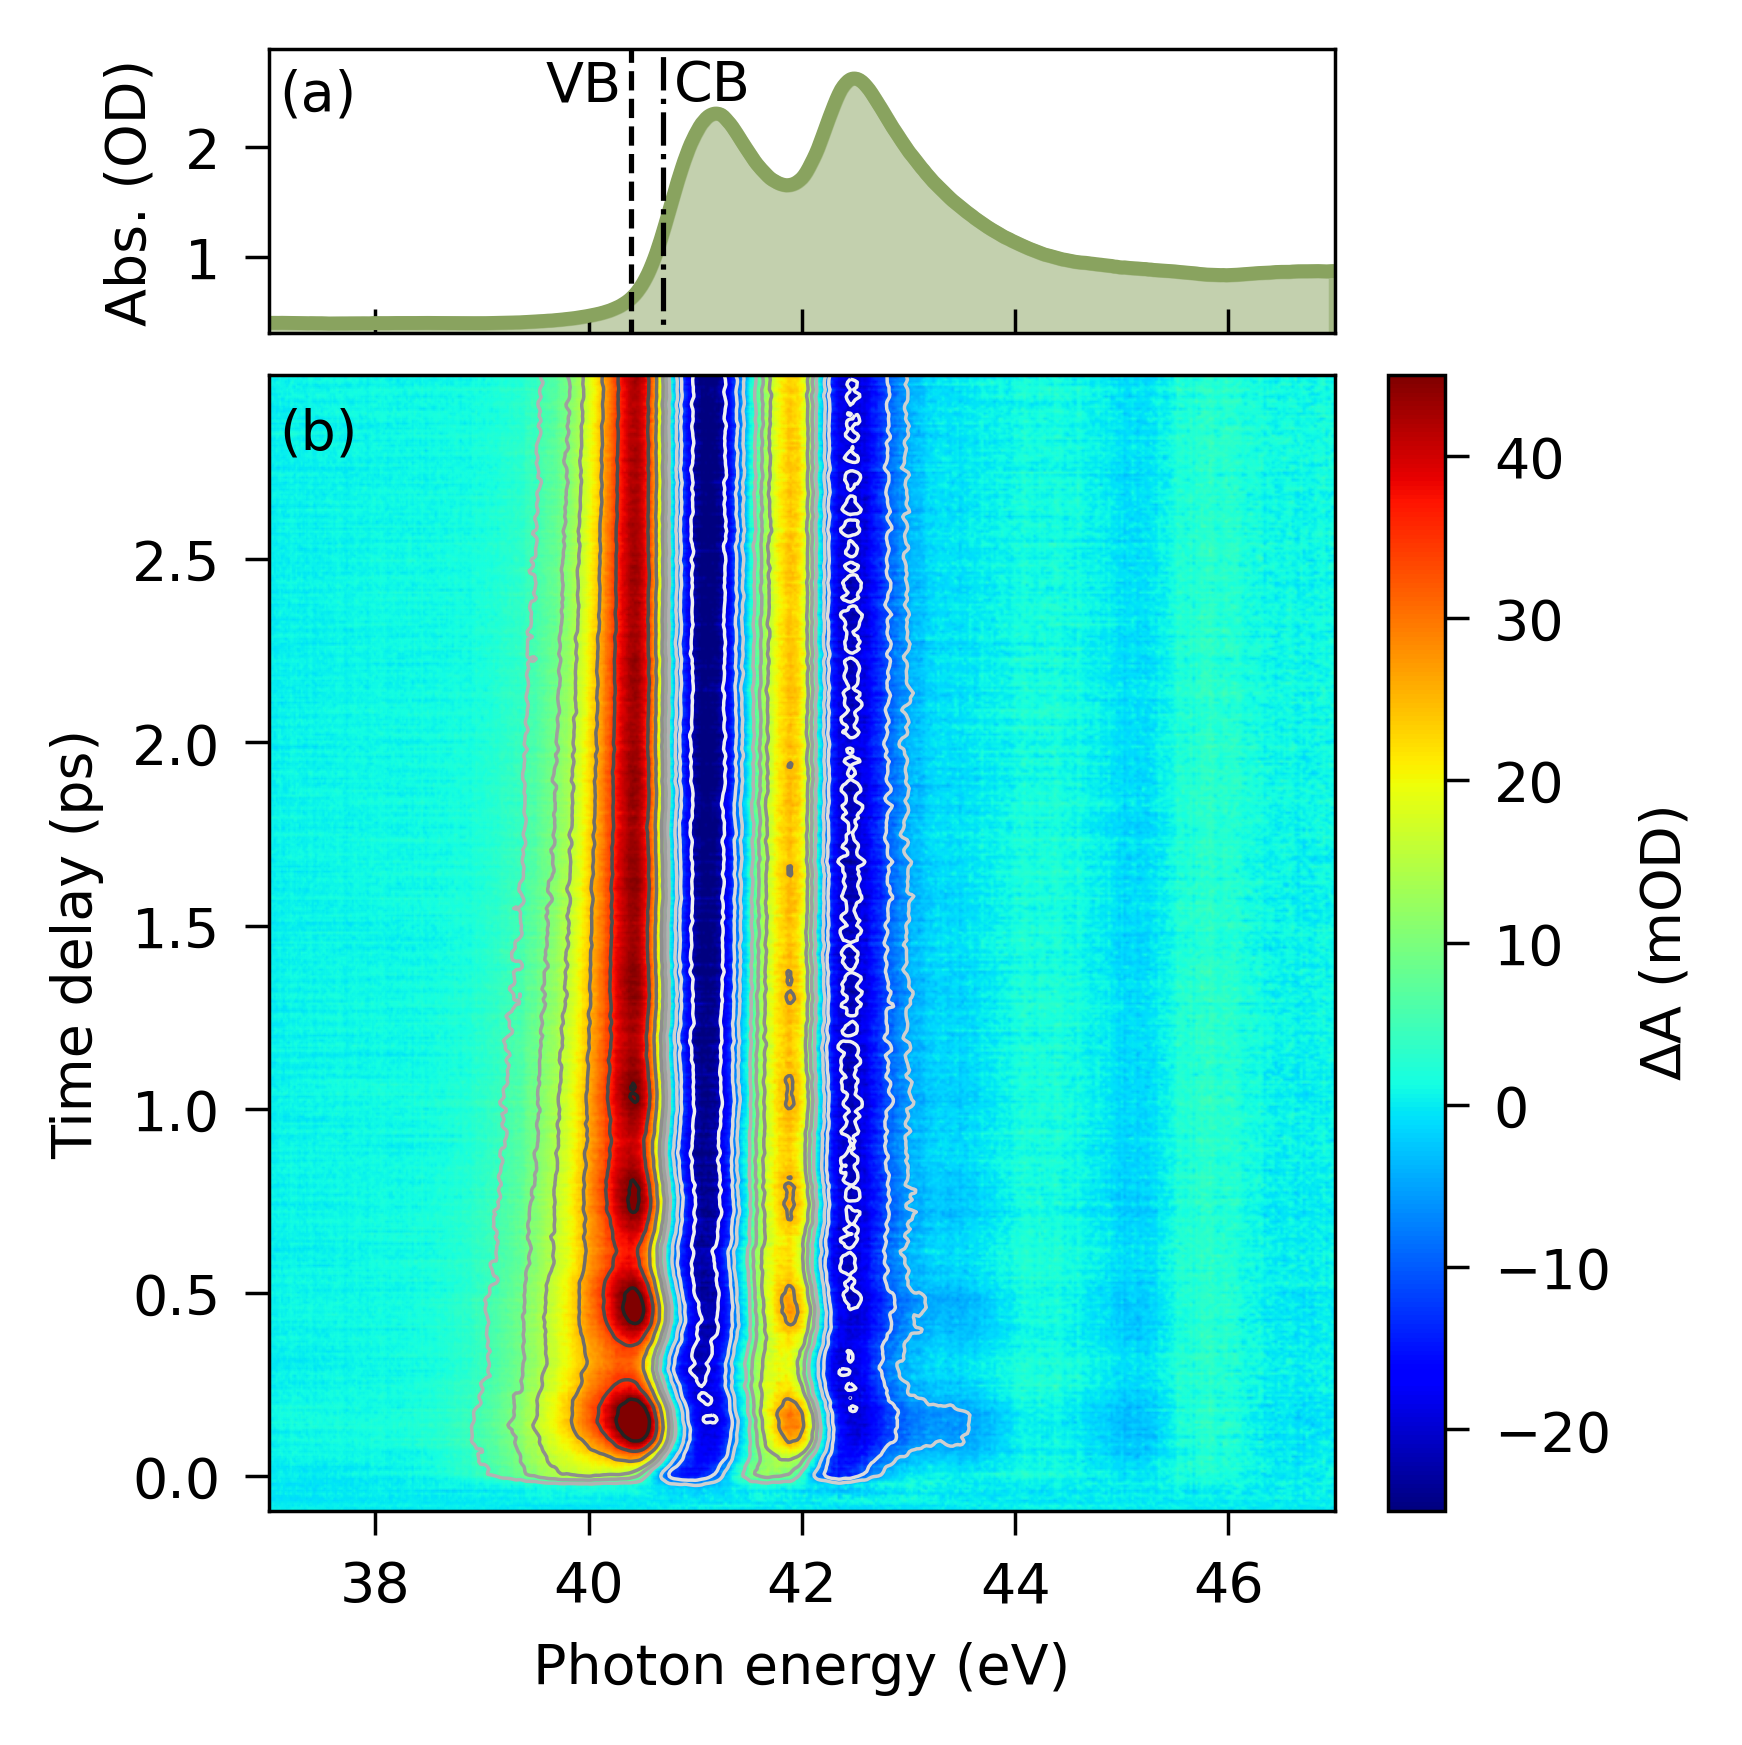
In Fig. 1(a), the ground state core-absorption spectrum at the Te N4,5 edge in the range of 37 to 47 eV is shown. The increase in absorption, corresponds to the (42.3 eV) and (40.7 eV) semi-core electrons excited to the conduction band (CB) edge. The well resolved spin-orbit doublet with a 1.6 eV splitting and smooth absorption at higher energies is in agreement with synchrotron measurements of Te [24]. The absorption onset ( 41 eV) would correspond to transitions from to the unoccupied -orbitals at the H-point followed by higher lying transitions across the entire Brillouin zone (BZ). At energies above the peak there are small features that correspond to forbidden transitions to -bands well above the conduction band minimum (CBM) [25]. Due to the strong core-hole screening at the Te N4,5 edge, as previously reported [26], the absorption structure should well reflect a core-hole modified density of states in the conduction band. The lifetime broadening from the core-hole (on the order of 0.5 eV [25]), however, precludes our ability to resolve specific valleys in the absorption. The position of the valence band maximum in Te from the is previously reported to be 40.4 eV [27] and in p-type Te, the Fermi level is pinned near the valence band maximum (VBM) [28]. We expect our films to be naturally p-type, typical of evaporated Te [21].
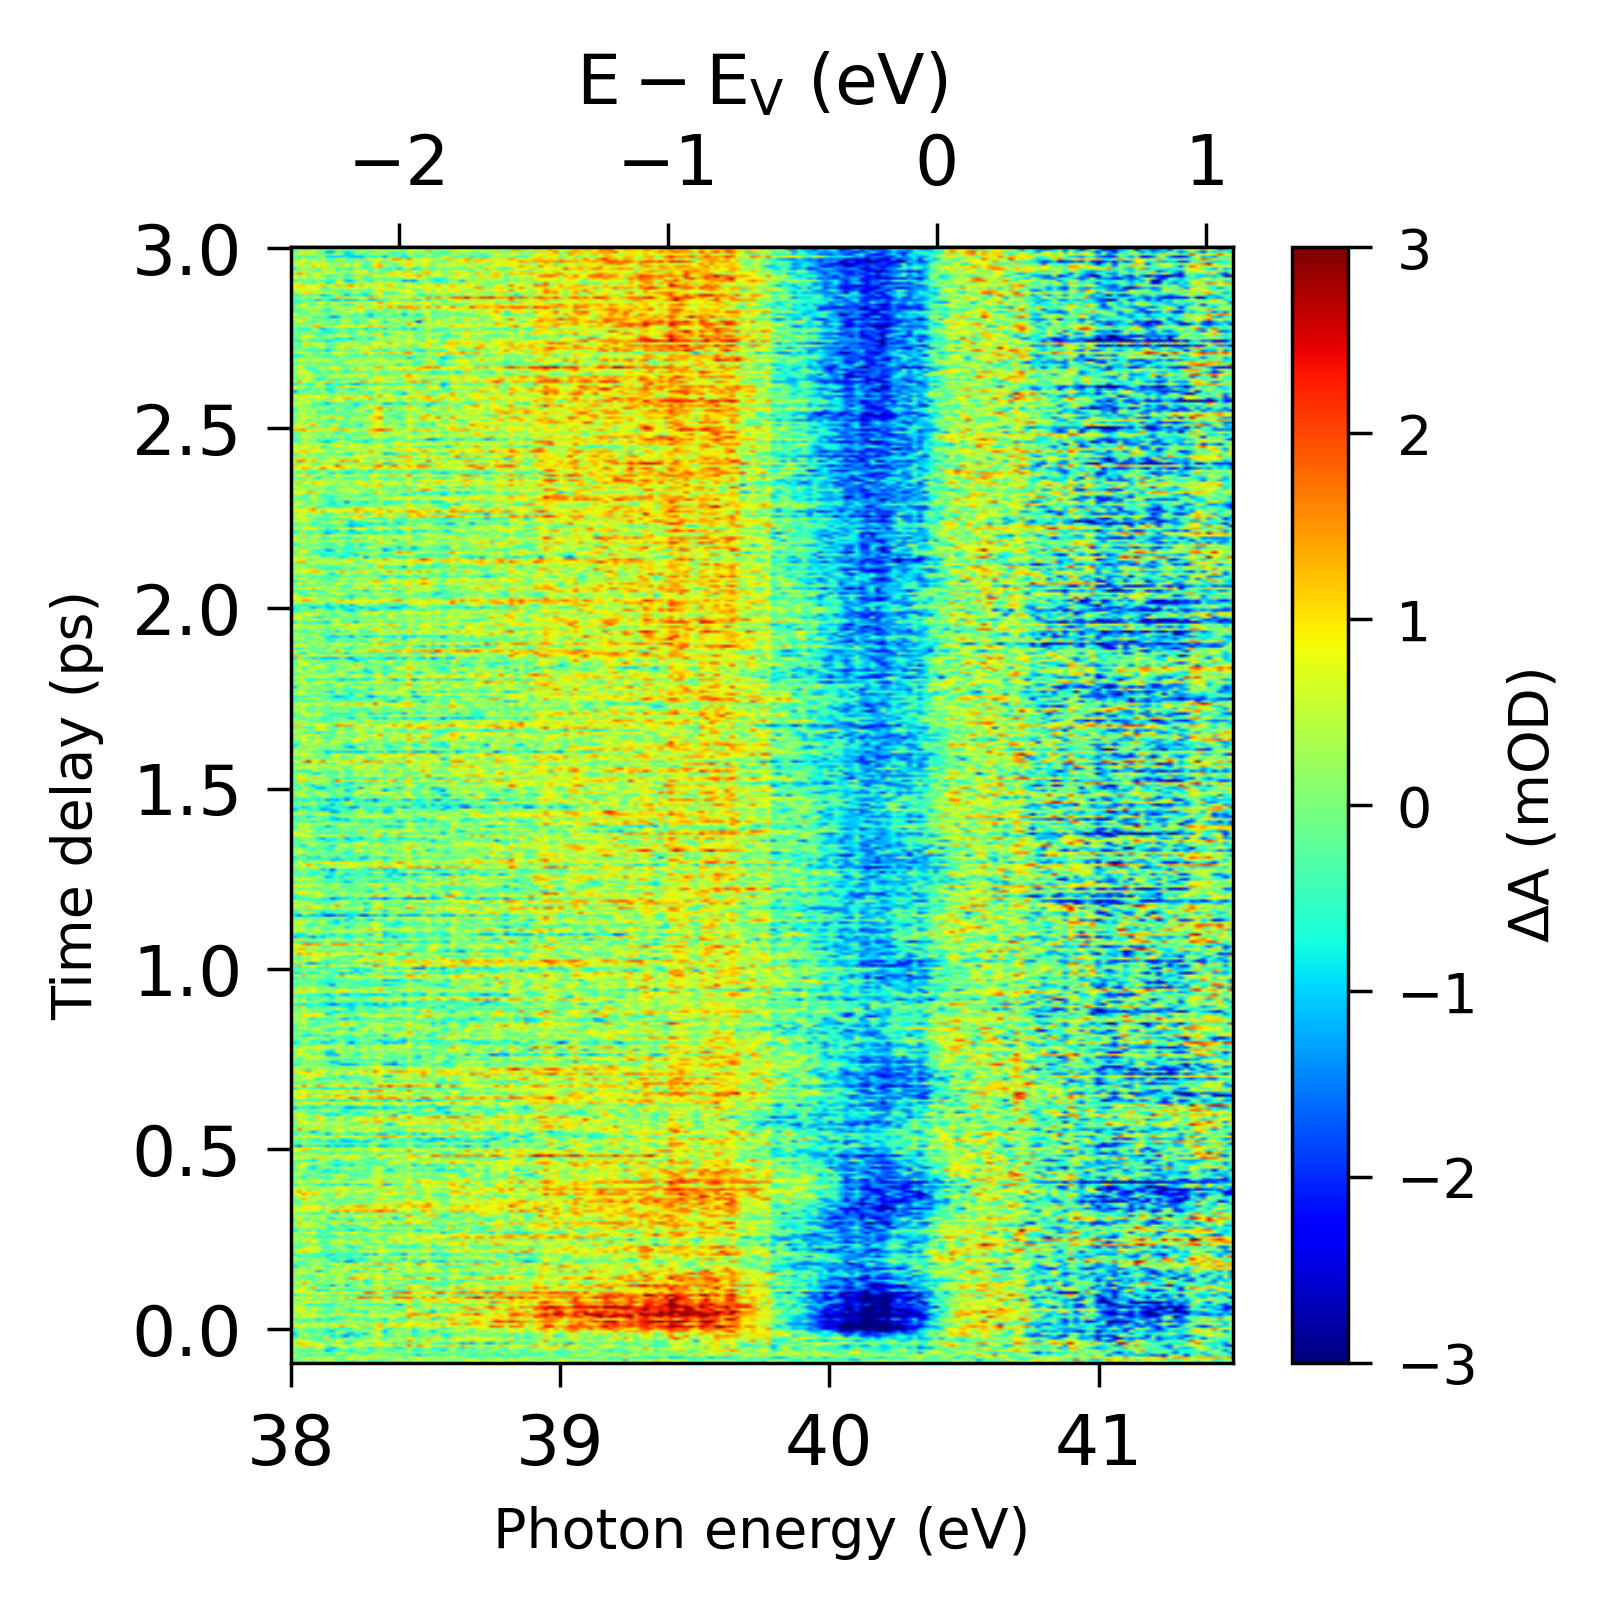
To track the dynamics, the change in the core-level absorption from the ground state at the Te N4,5 edge is detected by measuring the transmitted XUV with and without a time-delayed optical pump pulse. The XUV transient absorption spectra are shown in Fig. 1(b) at a carrier density of 1.5 . Typical of XUV transient absorption of thin films, a delay independent background before time zero that is due to static heating is subtracted. Following the arrival of the pump pulse at time zero, there is an increase in absorption starting at 39 eV, which then decreases around 41 eV. This pattern is replicated by the spin-orbit doublet and persists beyond our measured time delay. Within the first picosecond, the beating pattern centered around 40.5 eV and 42 eV resembles a shifting back and forth of the absorption edge at a frequency of 3.15 THz. The beating is also visible above 43 eV in the bands far from the Fermi level. The beating frequency of the absorption edge is consistent with the coherent excitation of the A1g phonon, but shifted from the equilibrium frequency of 3.6 THz [13]. Furthermore, at 40.5 eV, the A1g phonon beating exhibits a tilt in time with respect to energy, indicative of a non-flat phase distribution of the coherent motion versus photon energy.
In addition to the lattice dynamics shifting the absorption edge, an increase in absorption is present below the VBM at 40.4 eV. This may be attributed to effects of state blocking/filling, resulting from the transitions of the core level to newly unoccupied states in the VB [26]. We therefore attribute this transient signal to the photo-generated hot holes in the VB. At the earliest timescale of the measurement, the increase in absorption would at most extend down to 38.2 eV, but will narrow in time as high energy (hot) holes relax (See Appendix D). Compared to the holes, which are spectrally isolated below the VBM of the , a decrease in absorption above the Fermi level from hot electrons is not as readily discerned due to spectral congestion between the lattice and carrier features. In the next section we focus on isolating the spectral contributions of the A1g phonon mode and the hot carriers.
III.2 Decomposing the Spectral Contributions of the A1g Phonon and Carriers
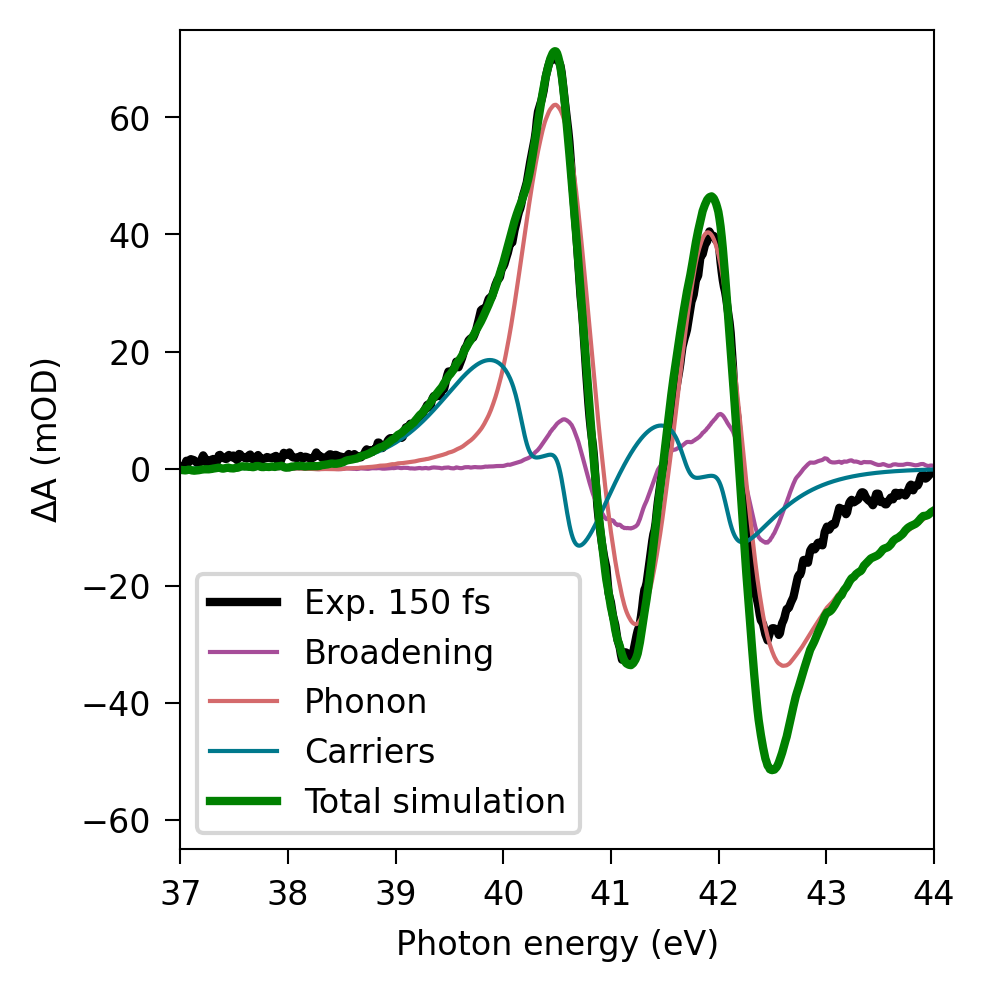
We first turn to the predominant spectral features in the transient absorption spectra at 150 fs, corresponding to the first oscillation maximum of the phonon. Well demonstrated in previous core-level TA measurements of elemental semiconductors [29] and transition metal dichacolgenides [26, 30], the excited state can be decomposed into individual contributions:
| (1) |
incorporating the phonon and band-gap renormalization induced absorption edge shift (), excited state inhomogeneous broadening of the core-level transition (), and carrier induced state blocking (filling) in the conduction (valence) band (), also called state removal/state opening. In the region of the Te N4,5 edge we show the decomposition into these components in Fig. 2. To retrieve the individual contributions, a global optimization is performed at 1 eV around the Fermi level with a basin-hopping algorithm to account for a high dimensionality minimization and the statistical errors retrieved via the Hessian matrix.
In this simplistic model the phonon and band-gap renormalization absorption edge shift is optimized to a 589(6) meV uniform energy shift with respect to the ground state XUV absorption. An optimized 5.1(6) % scaling factor is applied to the ground state XUV absorption to obtain agreement with the A. We believe the scaling factor is due to non-uniform shifting of the conduction band across the BZ following photoexcitation [29, 18]. The shift includes both changes to the conduction band energy and 4d core-level binding energies that we cannot independently discern. The inhomogeneous broadening of the excited state is achieved by convolving the static absorption with a Gaussian. As hot carrier thermalization is expected to occur mostly within the first 100 fs, we approximate the carrier induced state filling and blocking as a Fermi-Dirac distribution over parabolic bands with lifetime broadening. This is replicated for the spin-orbit split core-levels where there is strong spectral overlap between the holes of the and electrons of the . From this, we estimate a shared electronic temperature of 3180(50) K for both holes and electrons at the maximum of the phonon displacement and a hole Fermi level of 39.68(4) eV, about 0.8 eV below the VBM. Due to spectral congestion at the electron state blocking signal, the assumption of a shared electronic temperature is made to reduce the parametrization of the optimization.
While reproducing the change in absorption near the Fermi level, the model deviates from experiment due to an overestimate of the edge shift at high energies (above 42 eV). This we attribute to a non-uniform electron-phonon coupling over a large photon energy range [29, 18]. Although this approach provides precise quantities within the approximations, lack of detailed knowledge of complex band dynamics and strong spectral overlap of lattice and carrier features gives rise to significant uncertainty. Further the necessity to utilize a scaling factor in the rigid shift decomposition due to an unknown dependence of the shift on band dispersion and energy impedes successful interpretations with this decomposition method. We therefore analyze the complete TA spectra with another unbiased decomposition method and apply the previous methodology to validate the results.
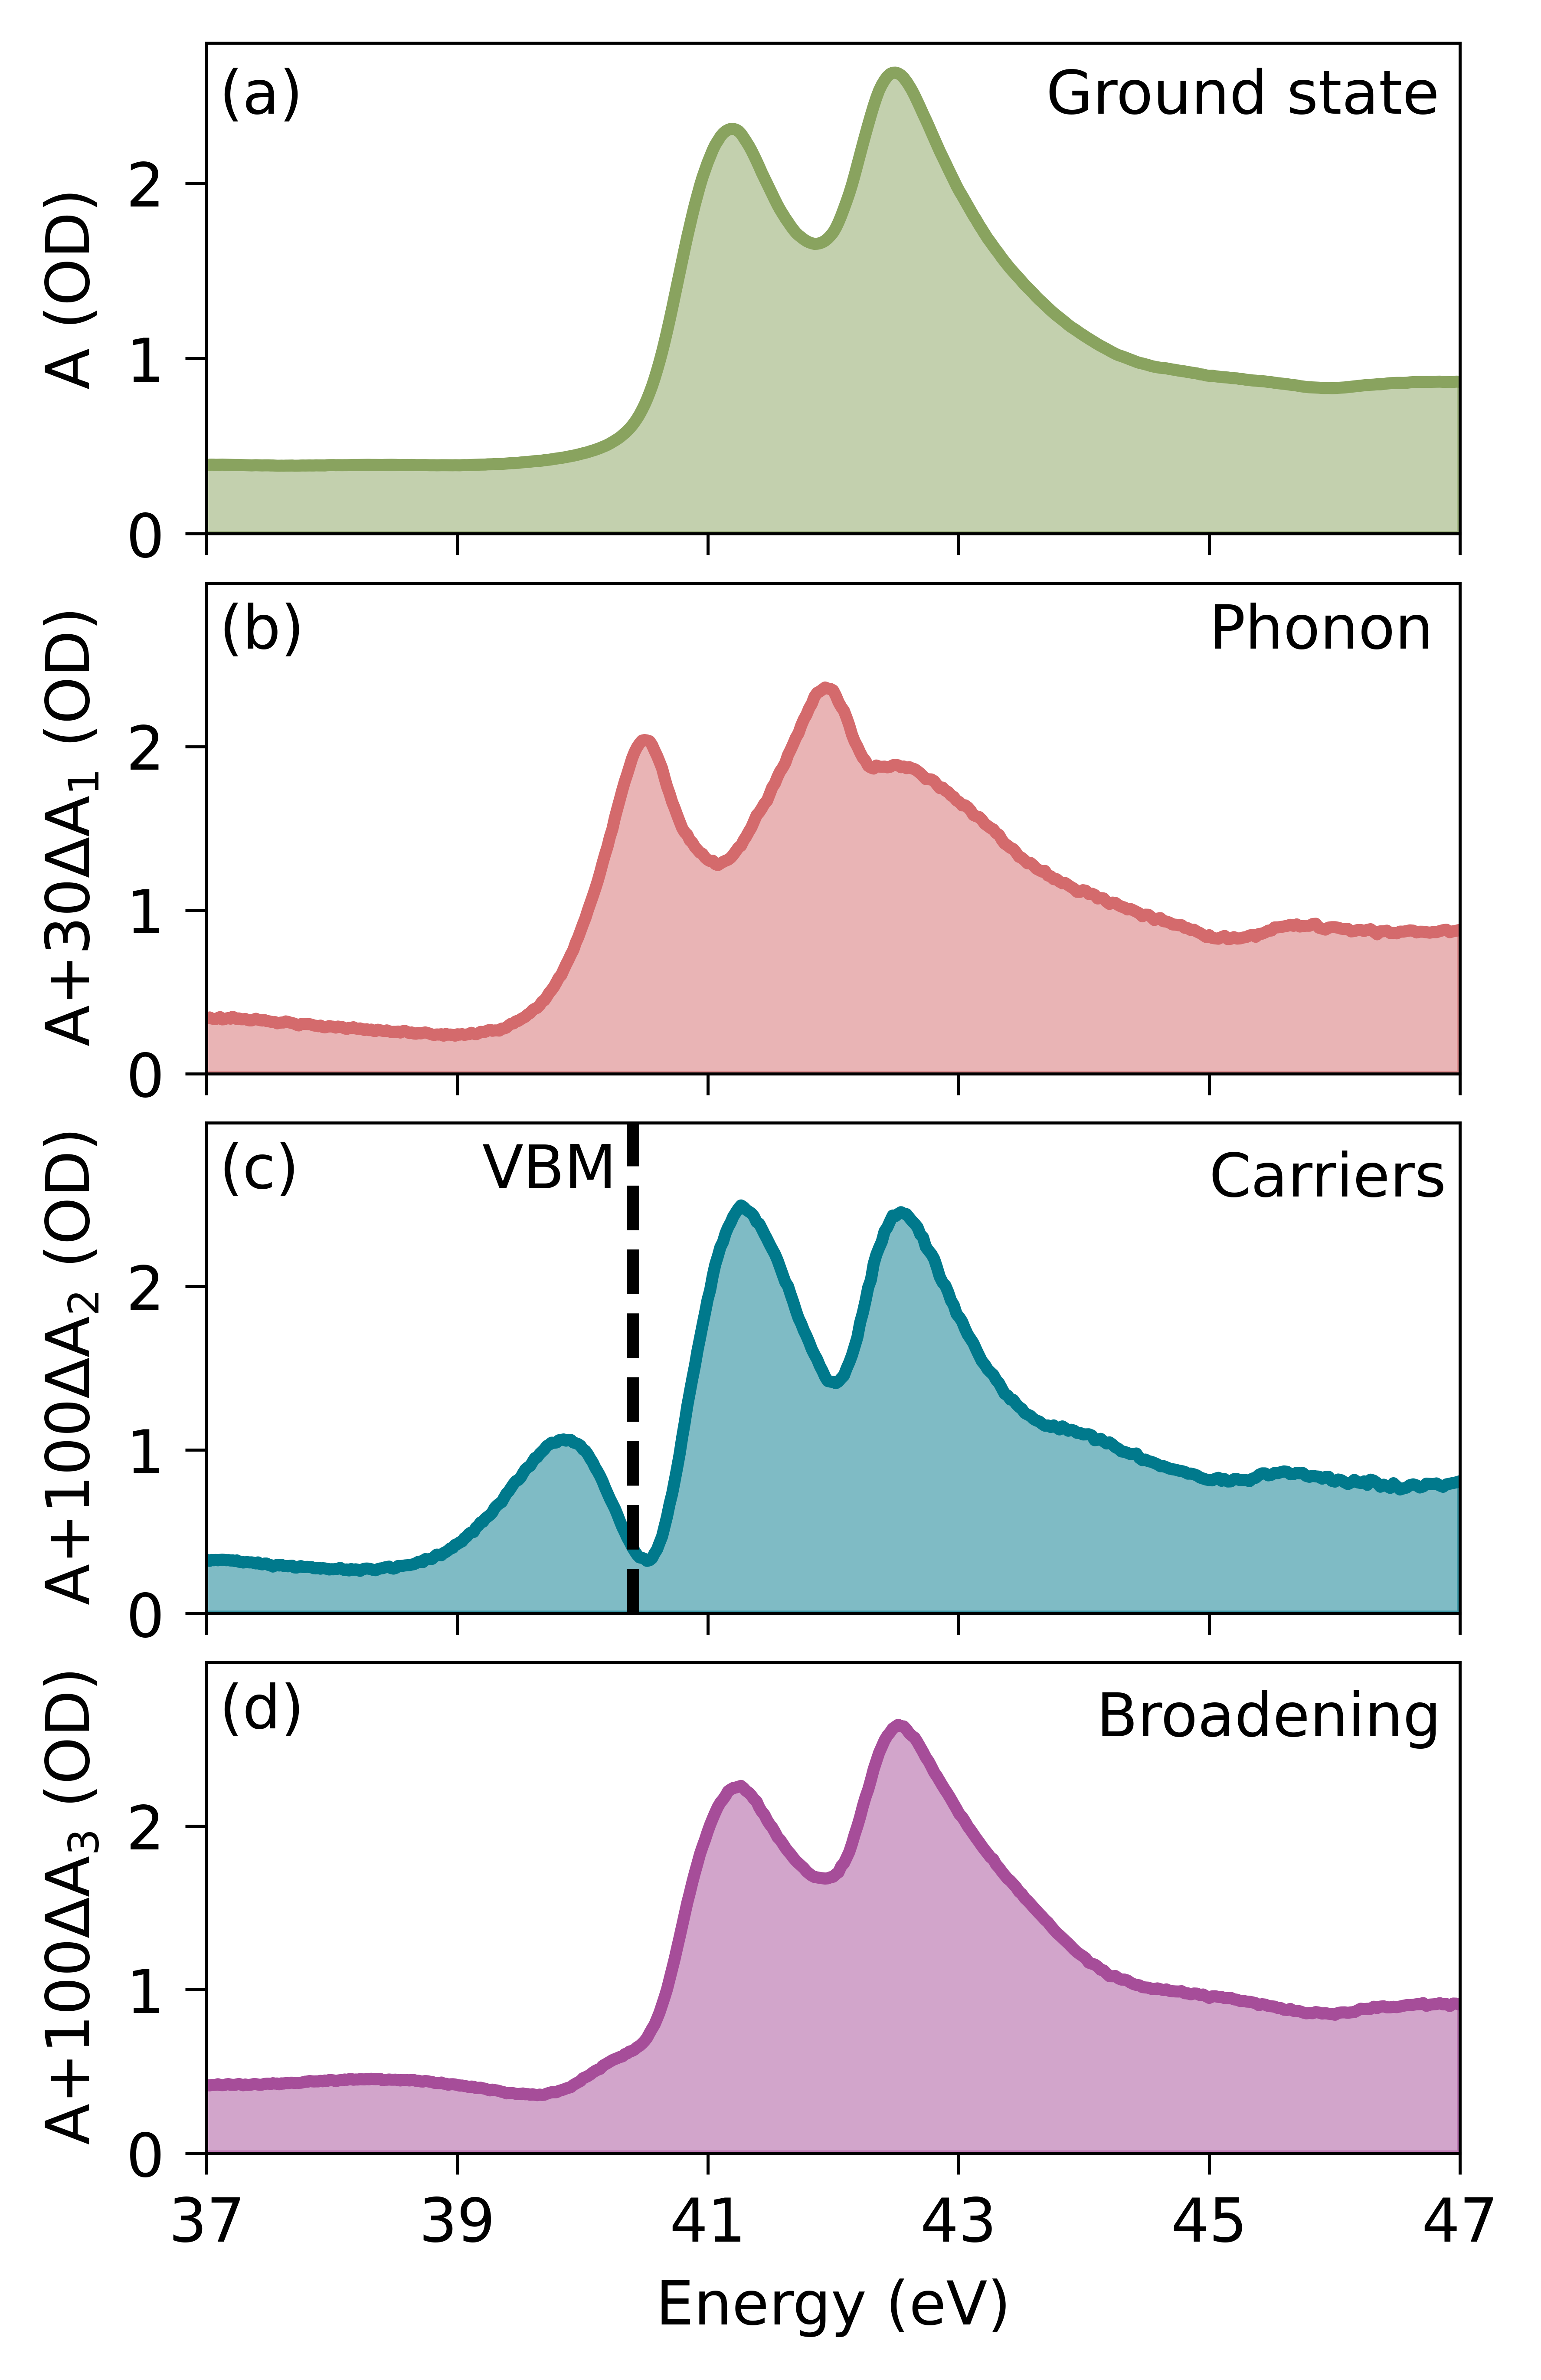
To further evaluate our observations of the edge shift, broadening, and carriers, a singular value decomposition (SVD) is utilized to decompose the distinct transient contributions with unique spectral and kinetic profiles. As noticeable in Fig. 2, each contribution of shifting, broadening, and state filling/blocking has a unique derivative behavior in the spectral domain. The SVD approach enables isolation of the three basic contributions to the TA without presumptive modeling or restriction in the spectral and temporal domain. Further, it provides noise reduction and can isolate spectral contributions arising from strongly overlapping phonon and carrier signals of the spin-orbit doublet splitting. The SVD is implemented by adding the static absorption from Fig. 1(a) to the A at every time point, forcing the zero order basis vector to be the non-time-dependent ground state absorption.
We find the entire transient signal is largely reproduced by three singular value components consistent with the above model. The spectra of the SVD are shown in Fig. 3(b,c,d) where the spectral SVD vectors are added back to the XUV ground state absorption for comparison. The largest SVD component (Fig. 3(b)) comprises 56% of the SVD decomposition and resembles a shift of the ground state absorption (Fig. 3(a)) to lower energies. There is an additional appearance of spectral features above the peak that cannot be reproduced by shifting the ground state XUV absorption. This SVD component we assign to the absorption edge shift due to coherent phonon, band-gap renormalization, and changes to the equilibrium position of Te along the A1g phonon coordinate from photoexcitation. From previous ultrafast work in Te at similar carrier densities, we expect an exceptionally large magnitude shift of the Te equilibrium position on the order of 26 pm [8, 9]. This is about ten times larger than what is reported in the semimetal Bismuth (2.6 pm) [18] and thus it is not surprising the shift of the Te absorption edge in the XUV is much larger compared to Bi [18]. The major contributions to the absorption edge shift therefore originate from changes to the binding energies of the core-levels from changes in bond length and shifting of the conduction band to lower energies.
The second largest singular value (28% of the signal) shown in Fig. 3(c) readily resembles an unshifted XUV ground state absorption with a large increase in absorption below the valence band maximum and suppression of the peak relative to the . The increase in absorption below the VBM from the Te must be due to opening of states in the valence band, while the suppression of the peak comes from electrons populating the conduction band following excitation. The state filling/blocking contributions retrieved from the simple model agrees with the increase in absorption below the VBM in the second SVD vector as well as a decrease in the transition to the CB, respectively. Nevertheless, this singular value consistent with hot carriers incorporates both the holes and electrons. We find a small contribution of excited state broadening in the SVD decomposition (Fig. 3(d)) which agrees with the simple model. Both phonons and electronic effects could give rise to broadening [31], however, the relative contributions cannot be disentangled from the spectrum. While included for completeness in the SVD analysis, the excited state broadening is a minor effect that is not analyzed in more detail.
III.3 Temporal Dynamics of the A1g Phonon and Carriers
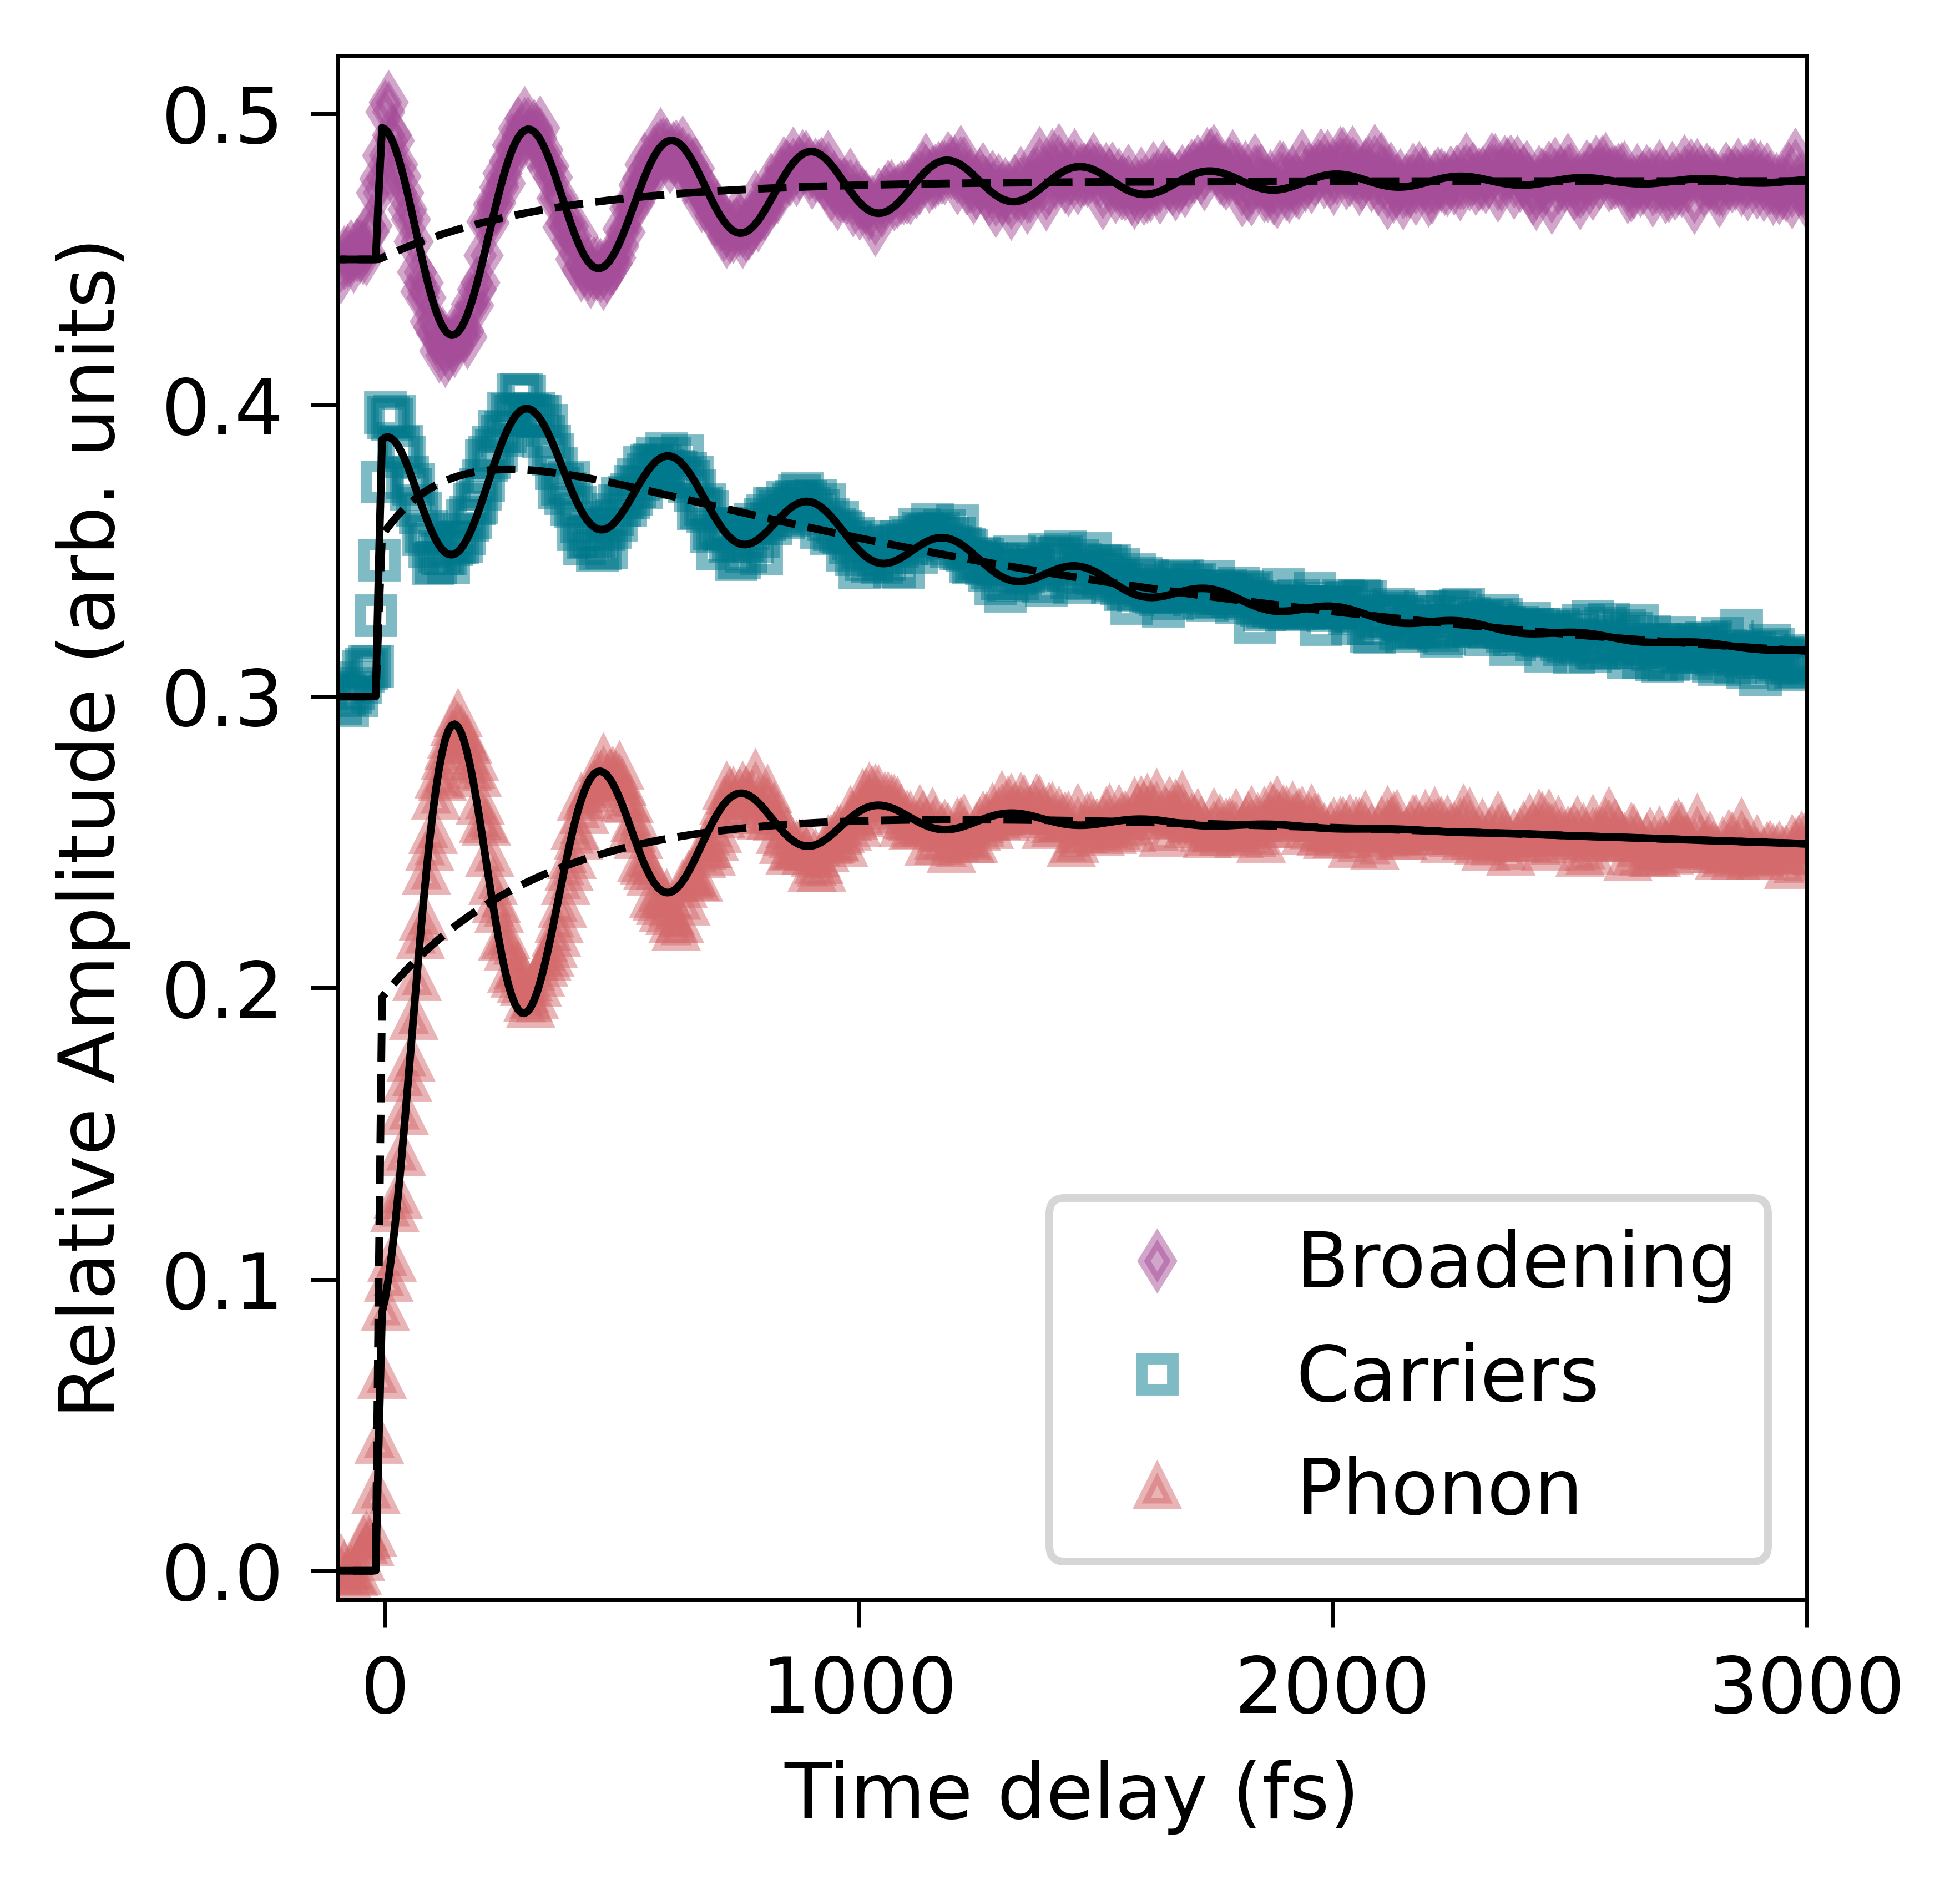
We now turn to the temporal dynamics of the three SVD components that track the kinetic processes following the excitation. In Fig. 4 the temporal vectors exhibit distinct dynamics that encode the edge shift, broadening, and carriers in detail. Focusing on the exponential rises and decays, the temporal dependence of the edge shift contribution (labeled phonon) has a sharp initial rise within the first few femtoseconds of the optical excitation followed by a slower onset over a picosecond. The fast rise can be ascribed to a rapid structural rearrangement driven by the depopulation of lone pair states near the Fermi level to anti-bonding states in the conduction band [8]. The rapid destabilization of the ground state potential energy surface results in a displacive force along the A1g phonon coordinate that decreases the helical chain radius by shifting the equilibrium position (). This increases the symmetry of the Te structure, inducing a displacive excitation of a coherent phonon (DECP) [15]. The change in local environment is what gives rise to an absorption edge shift due to changes in the 4d binding energy and decrease in the band-gap. The picosecond rise is typical of an incoherent growth in the acoustic phonon population that emerges from decay of the optical phonons [32]. The decay of the acoustic phonons is heavily suppressed by the very low lattice thermal conductivity of Te [7] and occurs over the course of milliseconds, as determined from the presence of a large heat background in our TA spectra. The decay we measure is thus due to the relaxation of the excited state potential energy surface over tens of picoseconds.
Fig. 4 also shows the SVD component assigned to the hot carriers (blue curve). The carriers exhibit an immediate increase following excitation, but notably there is a delayed maximum. The cause of the delayed maximum is the thermalization of carriers towards the Fermi level [11]. However, the biexponential rise of the carriers suggests two potential channels feeding the thermalized carriers. The decay we attribute to a decrease in the electronic temperature of Te () as the hot carriers dissipate their energy through electron-phonon coupling [19]. The temporal evolution of the broadening (purple curve in Fig. 4) appears with no clear decay on the measured timescale. The slow rise and lack of decay is attributable to an increase in vibrational broadening due to populating incoherent acoustic phonons, which thus increase the lattice temperature [33].
Notably, we observe oscillations in both the phonon and hot carrier signals. While observation of the A1g phonon in Te is well established, oscillations in the hot carrier signal at the same frequency is similar to the back-coupling of the electronic temperature to the lattice that has been observed in semi-metallic Bi [18], Sb [19], and CDW system TaSe2 [20]. The hot carrier signal follows the A1g phonon motion, indicating the coupling arises from movement along the A1g phonon coordinate, corresponding to changes in the Te chain radius. The phase shift implies that when the Te helices are symmetrized (phonon maximum excursion), the carriers have a local temperature minimum. We discuss the potential source of this phase shift and quantify the temporal dynamics in the following section IV.
IV discussion
IV.1 Multi-Temperature Model
To quantify the dynamics of the phonons and carriers the three SVD traces were globally fit using (Equation 2) which corresponds to a multi-temperature model implemented using the Minuit2 library [34]. A Gaussian instrument response function, , is retrieved by an external measurement and fixed in the fitting routine. In this model, the hot carriers are an electronic temperature () bath that may transfer energy to the lattice via an electron-phonon scattering rate (). The electronic temperature receives energy via the initially non-thermal carriers following photo-excitation through fast and slow scattering channels consistent with the biexponential rise of the hot carriers (e = electronic and p = phonon). The phonon trace is described by both the tellurium atom displacement from the equilibrium position along the A1g coordinate () and the acoustic phonon temperature (). The acoustic phonon temperature is fixed to rise at twice the rate of the coherent phonon decay () as the coherent optical phonon has been shown to decay via a Klemen’s like mechanism [32] through an anharmonic coupling of the lattice displacement to degenerate acoustic modes [35]. The rate for the initial displacement of the tellurium atoms is described by and relaxation back to the ground state potential energy surface (). Finally, the coherent energy exchange between the coherent optical phonon and electronic temperature is described following the approach of Drescher et al. [19] with the A1g frequency (), coherent phonon phase (), and a frequency chirp of (). The transient broadening , while not shown in Equation 2, is fit for completeness and follows the acoustic phonon temperature and phenomenologically the electronic component of the coherent energy exchange.
| (2) | ||||
At a carrier density of 1.5, the A1g phonon frequency retrieved is = 3.16(1) THz compared to the equilibrium 3.6 THz measured by Raman spectroscopy (see black curves in Fig. 4). The softening of the A1g mode is not surprising as the frequency is known to be dependent upon both carrier density [16, 9], and temperature in the form of anharmonic phonon-phonon coupling [9]. However, when subjected to a few percent excitation of the valence electrons, an increase in temperature is expected to signifigantly blue shift the A1g phonon frequency [9]. The 12.2 % decrease in frequency of the A1g motion measured with the XUV can then be attributed to a decrease in bond strength as the non-bonding lone pairs at the Fermi level are nearly instantaneously excited into the conduction band anti-bonding orbitals. This is in good agreement with the measured frequency determined from optical reflectivity pump-probe spectroscopy of polycrystalline Te [16, 9]. Similarly, at a carrier density of 2 the A1g phonon frequency is found to be 3.6(3) THz, closer to the equilibrium value (See Appendix E) with no apparent decay. The coherent phonon lifetime of ps and chirp of 1.02(7) ps-2 at 1.5 is typical of high fluence [9], while the coherent phonon phase is determined to be -0.03(1) rad and is discussed further below in Section IV.2.
The rise () and decay () of the Te displacement from the equilibrium position () is now considered. The lifetime of the decay of from the excited state potential energy surface is ps and is much slower than the hot carrier decay. This lifetime of the Te displacement in the excited state potential energy surface is nearly identical to the carrier Auger recombination lifetime (31 ps) at the band-edge measured via optical pump-probe spectroscopy in 100 nm thick flakes [14] and the photo-induced degeneracy lifting of the conduction band minimum (H6 band) relaxation time (30 ps) [13]. In the original formulation of the displacive excitation of a coherent phonon model it is unclear whether the displacement is dependent upon the carrier population, , or if only the electronic temperature contributes to the displacement [15]. It is notable that in the multi-temperature model follows a timescale comparable to Auger recombination of fully relaxed carriers, such that . This could potentially explain why the displacement of the Te equilibrium position is much larger than in A7 semimetals [19, 18] where it is proposed to follow the electronic temperature. Additionally, when measured at a carrier density of , has no measurable decay out to the maximum time delays tested ( 2 ps). This is consistent with lengthening of the carrier lifetime as Auger recombination is reduced at low carrier densities, and multi-phonon mediated recombination is only expected to occur over 200 ps [14]. Moreover, there is a fast rise () to , which while nearly instantaneous with the sub 5 fs pump excitation, is found to be fs in a measurement with 660 as steps (see Appendix F). The delayed response of the Te equilibrium position displacement could be due to a lifetime dependence of the displacive force and non-equal contributions of the carriers to the excited state potential energy surface [36].
The dynamics of the hot carriers are examined in Fig. 4. Upon initial excitation, the non-thermal carriers far from-equilibrium will quickly redistribute their energy through various scattering channels as they thermalize. The biexponential rise of the multi-temperature model for the hot carriers includes a fast term on the order of the 6.4(5) fs instrument response, and a slower 0.15(1) ps rise. Both timescales are much faster than previously measured inter-valley scattering that necessitates a population of high momentum acoustic phonons [37, 13]. Thus the primary source is likely intra-valley scattering towards the Fermi level in the form of energy-relaxation that is typically on the order of 100 fs [38, 39]. It is however possible that both carrier-carrier and carrier-optical phonon scattering are the dominant mechanisms for thermalization [40, 26]. While carrier-carrier scattering can only redistribute energy within the electronic system, the maximum energy exchange is on the order of the 800 nm photon energy. This will lead to much faster thermalization than through optical phonon emission that is constrained to the tens of meV transfer per scattering event. The fast rise () is thus attributable to carrier-carrier scattering, while the slower thermalization channel can be attributed to electron-phonon coupling, which is similar to the 0.3 ps intra sub-band cooling time measured with photoelectron spectroscopy [11]. The discrepancy could be due to the fact that in the analysis the hot carrier signal included both holes and electrons and that there are differences in scattering rates for holes versus electrons. The hot carrier decay () has a relaxation time of 1.60(2) ps that is similar to the timescale (1.3 ps [37], 1.7 ps [11]) for the transfer of high-energy carriers to the lowest energy sub-bands of the H-valley. In this process, for the hot carrier decay, the electronic temperature is reduced as optical-phonon emission through electron-phonon coupling that transfers energy to the lattice. The hot carriers determined from the SVD do not include the cooled lowest energy carriers that share the long lifetime of the Te equilibrium position displacement. Similarly, the non-thermal carriers are shown in the residual TA spectra alongside the cooled carriers (See Fig. 9 of Appendix D).
IV.2 Coupled Carrier and A1g Phonon Dynamics
We now consider the coherent modulations of that are observed. Following the absorption of an ultrashort optical laser pulse by Te, there is a rapid increase in the total energy of the electronic degrees of freedom. This abrupt increase in the carrier population () and electronic temperature () contributes to excite the A1g phonon mode and is well explained by the DECP model [15] and additional theory by O’Mahony et al. [36] While Te is a semiconductor in the ground state, the displacement along the A1g phonon coordinate leads to a symmetric Dirac metal through a light-induced phase transition [8]. This phase transition can similarly be achieved by depopulating the doubly degenerate VBM lone-pair orbitals with shear strain to the CBM [3]. The increase in metallic character when Te becomes more symmetric by reducing the helical chain radius should lead to an increase in the electronic heat capacity [41] as the density of states is increased at the Fermi level [42]. If we consider the temporal evolution of the hot carriers in Fig. 4, the phase offset is close to with respect to the phonon excursion. When the phonon displacement is maximum and Te most metallic, the electronic heat capacity is maximized, leading to a lower temperature of the hot carriers. This similarly follows the thermodynamic model of Giret et al. [17] that describes a coupling between the electronic temperature and lattice motion in Bi as an isentropic conservation of entropy. The same model has been applied to interpret XUV pump-probe results in Sb [19] and Bi [18]. While the thermodynamic model anticipates that the mass of the atoms scales the change in electronic temperature, the temperature oscillations in Sb [19] with similar mass to Te, are smaller. This implies the oscillations observed in electronic temperature of Te are more nuanced possibly due to the greater equilibrium position displacement. In the vicinity of the semiconductor-to-metal phase transition [8], the dependence of the electronic heat capacity on could exhibit a large variation. This is anticipated as there are numerous band crossings at the Fermi level that emerge upon symmetrizing Te [8, 42]. While an indirect band gap is closed at the A-valley for a 14 pm displacement [42], complete symmetrizing of Te at 26 pm additionally closes the gap at the H-valley [8]. Under the conditions anticipated at our fluence, an opening and closing (maximum phonon displacement) of the gap will heavily influence the electronic heat capacity by transiently changing the number of available states in proximity to the Fermi level. A large excursion radius of the A1g phonon in Te could amplify this effect. The same dependence on could similarly emerge in the form of a dynamical coupling between the carriers and transiently changing band structure [42] in which the carriers rapidly redistribute, rather than remain in their bands. In addition to the change in electronic temperature, this non-adiabatic change in band occupations would produce oscillations in the hot carriers at the same frequency as the A1g phonon motion. While we cannot discern the source from our experiment, calculations of the electronic heat capacity changes from the light-induced semiconductor to metal phase transition may prove useful in the future in understanding the observations.
Finally, we consider a Fourier analysis of the phonon-induced oscillations shown in Fig. 5. This is accomplished by subtracting the exponential contributions to the TA captured by the SVD and adding back the residual TA of Fig. 9. Further, a decomposition of the spin-orbit split 4d core-levels is done following the methodology of Zuerch et al. [29] to eliminate spectral congestion between the and to conduction band transitions. Fig. 5(a), the power spectrum () with only the phonon-induced oscillations shows a maximum intensity near the Fermi level of 40.4 eV, while above 42 eV, weaker features are associated with the appearance of phonon-induced features from the large lattice distortion found in Fig. 3(b). These spectral features that appear far from the band-edge due to a large could be a useful spectral fingerprint of the Te electronic structure to compare with theoretical calculations of the XUV absorption for the semiconducting and metallic phases. The peak intensity is found around the A1g mode frequency, however, there is considerable asymmetry and breadth in the spectrum with a shoulder at 2.3 to 2.5 THz. While the chirp of the phonon should shift the asymmetry towards higher frequencies, the appearance of a feature towards lower frequencies is consistent with the excitation of the much weaker E1TO phonon mode whose equilibrium frequency is 2.7 THz [13]. This was observed only at low temperatures previously in Te using an optical-pump probe method at 2.45 THz [9]. It is however possible the XUV core-level probe is more sensitive to the E1TO mode depending on the core-excited potential energy surface; morever, the shorter laser pulse could increase the amount of coherence, and our higher excitation fluence could increase the amount of excitation of the E1TO phonon mode at room temperature. Similarly, an asymmetric E1g mode has been observed in MoTe2 where it is only a fraction of the A1g intensity [26]. We thus consider both the A1g and E1TO modes in a phase analysis of the coherent phonon motions.
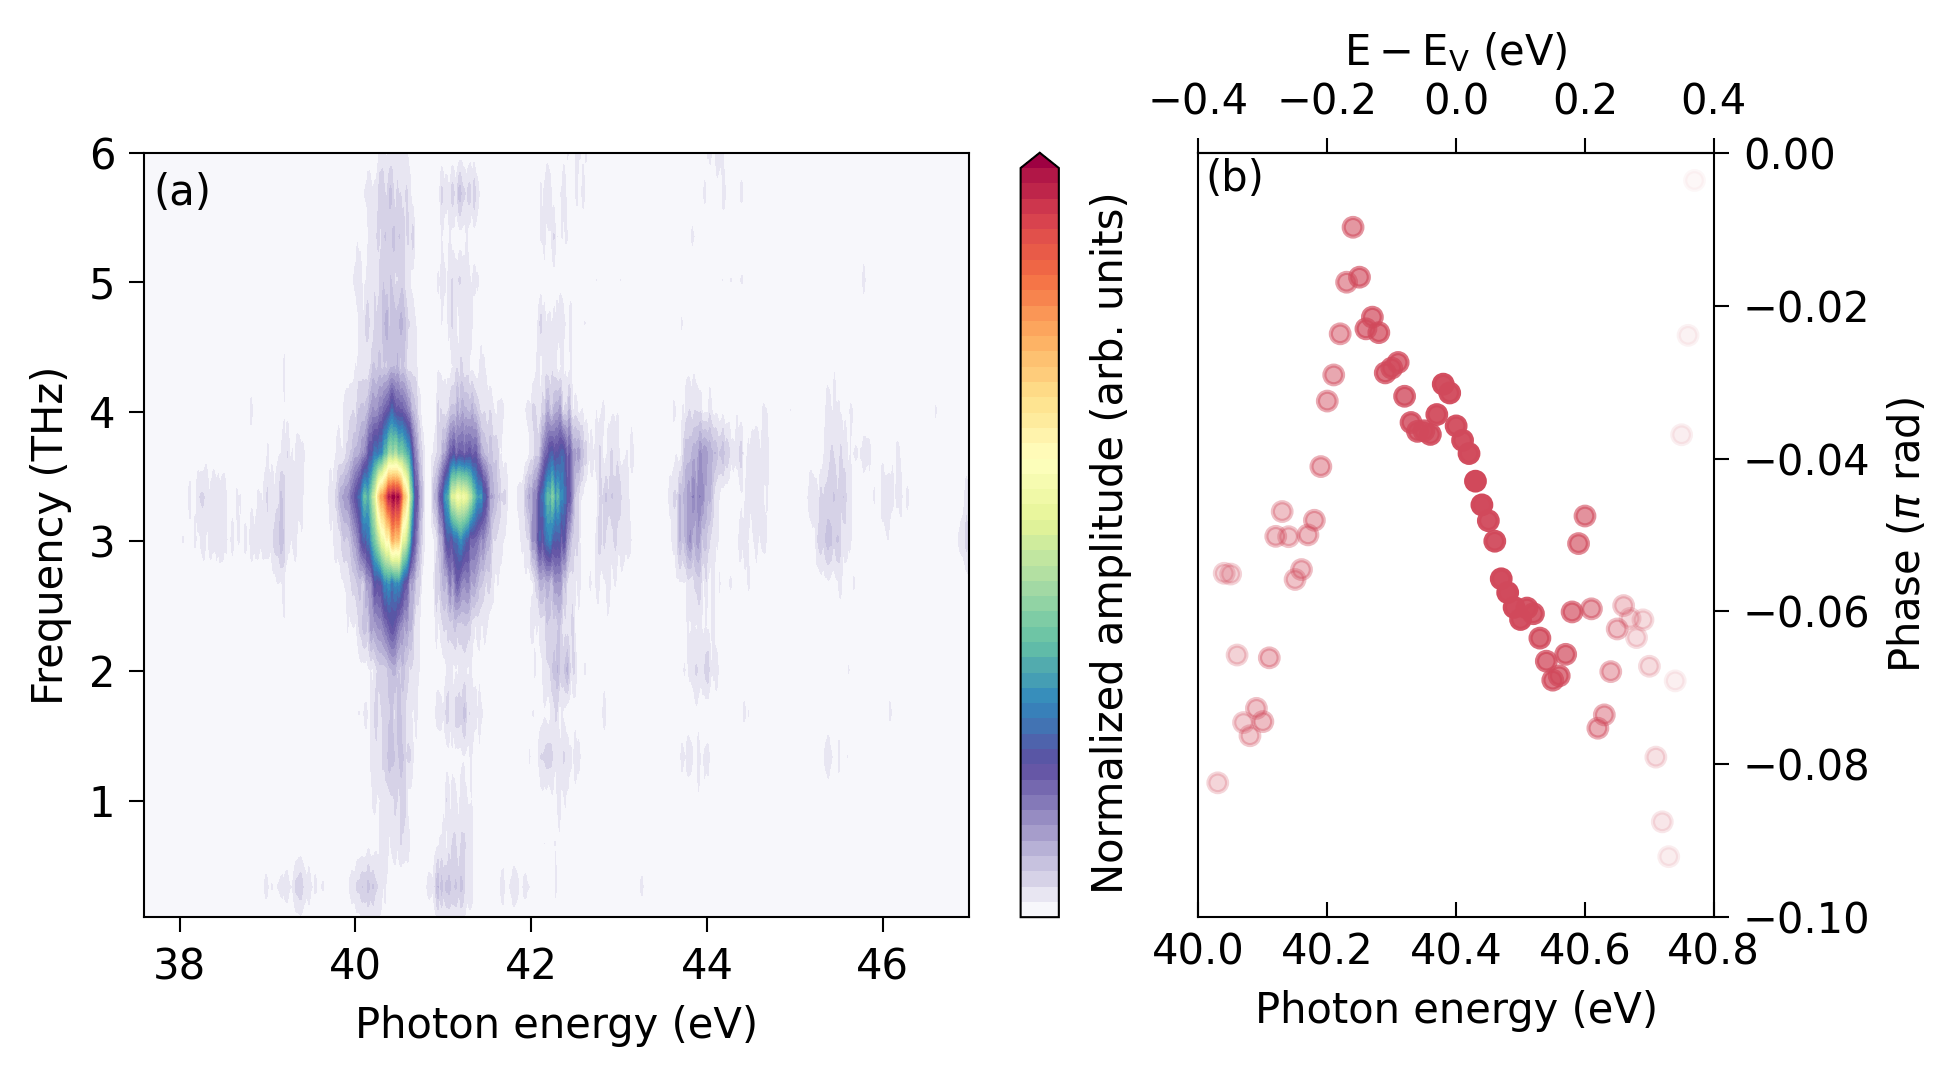
In Fig. 5(b), the spectral phase is shown for the A1g mode in vicinity of the Fermi level. In agreement with the phase of rad retrieved from the multi-temperature model, the average phase of the A1g phonon from Fourier analysis in Fig. 5(b) at the Fermi level is rad. The phase observed here is in good agreement with the previously reported value of rad [15]. It is however worth noting that there is a non-flat variation of the spectral phase across the XUV absorption energy. In the case of a purely displacive excitation, the phase of the A1g phonon should be zero with a small phase imparted by the dampening [15]. The dampening induced phase shift calculated from the phonon dampening and carrier relaxation is found to be less than rad. OḾahony [43] demonstrated in the A7 semimetals that there is a dependence of the phonon phase on lifetime of the electronic excitation, which results in a mixing of a displacive excitation force (flat phase) and an impulsive force that depends on carrier relaxation. The XUV energy dependence of the A1g phonon phase near the Fermi level in Fig. 5(b) thus could be due to such an energy dependent electron-phonon coupling [43]. In the case of a pure displacive excitation, where there is no electronic excitation lifetime dependence, the force exerted on the A1g phonon mode will be constant over the pump pulse and there should be no energy-dependence of the phase. In Te, the measured phase exhibits a small but observable, rad variation. This implies a small, but non-zero effect of carrier relaxation on the A1g phonon driving force. Despite the hot carrier energy thermalization through electron-phonon scattering, which occurs over 0.15(1) ps, this appears to have little impact on the phase. When analyzing the character of the bands excited by the 1.3-2.5 eV pump pulse, this is not surprising. The bandwidth covers the non-bonding lone pair (-3 eV to VBM) and the anti-bonding orbitals (CBM to 3 eV above) crucial to the helical chain structure [44]. All the excited electrons are thus likely to cause a weakening of the intra-chain bonds, as opposed to a strong energy-dependent contribution, which would therefore produce a near pure displacive excitation. This could be tested in detail with theoretical calculations of the energy dependent carrier relaxation as has been done for 2D tellurium [45], or by calculating the band dependence of the force along the A1g phonon coordinate [43].
Although the weak E1TO mode is not distinctively apparent in the time-domain dynamics, due to the small signal strength in the Fourier analysis compared to the dominating A1g mode, we consider the amplitude weighted average phase near the Fermi level (40 to 40.8 eV), where the A is at a maximum and the E1TO mode can be resolved. Unlike the A1g mode attributed to a displacive excitation driven by , the phase at the 2.3-2.5 THz E1TO mode frequency is rad, which is inconsistent with the displacive mechanism. This is not surprising as the chain rotation motion of the E1TO mode is unlikely to be coupled to the lifting of the degeneracy at the Fermi level or population of intra-chain -type anti-bonding orbitals. This is similarly observed in Sb and was attributed to a non-resonant impulsive stimulated Raman scattering [46]. It is also possible to consider excitation of the non-bonding lone pairs of the valence band, which could exert a symmetry breaking force through an asymmetric excited electron distribution, leading to excitation of the E1TO mode [36]. While we found that the coherent phonons are not responsive to changes in laser polarization in the absorption detection geometry with these polycrystalline samples, future studies on samples oriented perpendicular to the c-axis could enhance measurement of the non-totally symmetric modes. It may be interesting to explore whether the E1TO mode may couple to the electronic temperature or influence motion along the A1g coordinate.
V Summary
Using few-femtosecond core-level transient absorption at the Te N4,5 edge we have observed a coherent coupling of the photo-excited holes and electrons to the A1g phonon mode in elemental tellurium. Following excitation of the lone-pair orbitals to the anti-bonding conduction band, the lattice is excited along the A1g phonon coordinate to a new metastable excited state that lives on the timescale of carrier recombination. This excited lattice configuration is found to follow the 31(2) ps carrier population decay, while hot carrier relaxation () driven by electron-phonon coupling is much faster and occurs over 1.60(2) ps. Coherent excitation of the A1g phonon mode modulates the hot carrier temperature (), in which when the phonon displacement is maximized (Te symmetrized), the carrier temperature is minimized due to an increase in electronic heat capacity as Te becomes more metallic and the density of states is increased at the Fermi level. This back-coupling of the lattice energy to the carriers is observed for the first time in a semiconductor and is driven by a coupling between the electronic and lattice degrees of freedom along the A1g coordinate. The results are corroborating evidence of the light-induced semiconductor-to-metal phase transition [8, 10, 12] by demonstrating a strong dependence of the electronic density of states on . While depopulating the lone-pairs and populating the anti-bonding conduction band leads to the metastable Te phase, Fourier analysis demonstrates the launching of the coherent phonon is not through a pure displacive excitation, but has a weak dependence upon carrier relaxation possibly due to energy-dependent electron-phonon coupling. The measurement of coherent coupling between the hot carriers and A1g phonon mode in elemental Te provides the basis for further investigation of the light-induced phase transition from a semiconductor to metal and how it may couple to other degrees of freedom, such as spin or the non-totally symmetric phonon modes.
VI Acknowledgments
This work was supported by the U.S. Department of Energy, Office of Science, Basic Energy Science (BES), Materials Sciences and Engineering Division under contract DE-AC02-05CH11231 within the Fundamentals of Semiconductor Nanowires Program (KCPY23) for performance of the extreme ultraviolet laser experiments, preparation of samples, and analysis and interpretation of the results. Support for laser instrumentation and vacuum hardware is from AFOSR grant numbers FA9550-19-1-0314, FA9550-24-1-0184, and FA9550-22-1-0451. This material is based upon work supported by the National Science Foundation Graduate Research Fellowship Program (NSF GRFP) under Grant No. DGE 2146752 and DGE 1752814. Any opinions, findings, and conclusions or recommendations expressed in this material are those of the author(s) and do not necessarily reflect the views of the National Science Foundation. J.R.A and H.K.D.L acknowledge support from the NSF GRFP. H.L. acknowledges support from the Swedish Research Council (2023-06502) and the Sweden-America Foundation, L.D. acknowledges the European Union’s Horizon research and innovation programme under the Marie Sklodowska-Curie grant agreement No 101066334—SR-XTRS-2DLayMat.
Appendix A Experimental Appartus
The XUV transient absorption experiments are conducted on a table-top apparatus that starts with a Ti:sapphire laser (Coherent Astrella). The output is 7 mJ at 1 kHz with a pulse duration of 35 fs at a center wavelength of 795 nm. From the laser output, 2.3 mJ is reflected from a beam splitter and focused into a 2.2 meter long 400 micron inner diameter hollow core fiber filled with neon at a pressure of 30 Psi for supercontinuum generation. The supercontinuum output of the hollow core fiber spans an octave from 500 to 1000 nm with a pulse energy of 1.5 mJ and is mechanically chopped to 100 Hz prior to collimation. The beam is subsequently collimated with a magnification of 1.25 to the fiber input and compressed with seven pairs of PC70 double angle chirp mirrors (Ultrafast Innovations) that support the entire beam bandwidth and a Z-cut 2 mm thick ammonium dihydrogen phosphate crystal [47]. The resulting beam is sent into the Mach-Zender interferometer via a 1 mm thick beam splitter (90T:10R), where the transmitted beam is used for HHG, and the reflected portion is used for the pump. Both pump and HHG driving pulse are optimized with fused silica wedges for fine tuning of the dispersion and are approximately 4 fs in duration. The HHG driving arm is focused (50 cm focal length) into an argon filled gas cell for HHG where a broadband XUV (35-73 eV) pulse is generated as the probe pulse. The residual NIR-VIS driving field is filtered out with a 100 nm thick Al foil that acts as a high-pass filter. The XUV pulse is focused onto the thin film sample by a gold-coated toroidal mirror implemented in a 2f-2f imaging configuration and subsequently dispersed onto a CCD camera (PIXIS 400B) in a flat-field grating spectrograph where the transmitted spectrum is measured. The pump in the Mach-Zender is time delayed to the probe by an optical delay line with an optical encoder (Attocube), and focused (1 m focal length) onto the sample after recombining in a collinear geometry with the XUV by an annular mirror. The pump beam is removed by a second 100 nm thick Al foil prior to entering the spectrograph chamber. The pump beam is both transmitted and blocked at each time delay to collect XUV spectrum with and without the pump. The XUV absorption spectra undergo noise reduction via an edge-referencing scheme [48] in the 60-73 eV region where no TA signal is observed to improve the noise floor to about 1 mOD.
Appendix B Film characterization
In Fig. 6 we present an atomic force microscopy image of the Te thin film used in the experiment. Over a large area the film is found to exhibit uniform coverage, with a surface roughness on the order of a few nanometers. Additionally, part of the substrate was masked during the deposition enabling no film to be deposited on part of the substrate. From this, the film is estimated to be on the order of 100 nm. Further, the crystallinity is identified by powder x-ray diffraction of a film on the SiN substrate used in the pump-probe where the peaks are labeled by material via their miller indices in Fig. 7. The identifiable miller indices of trigional Te (RRUFF ID: R070376.1) [49] confirm that the Te film is polycrystalline as expected.
Appendix C Instrument response function
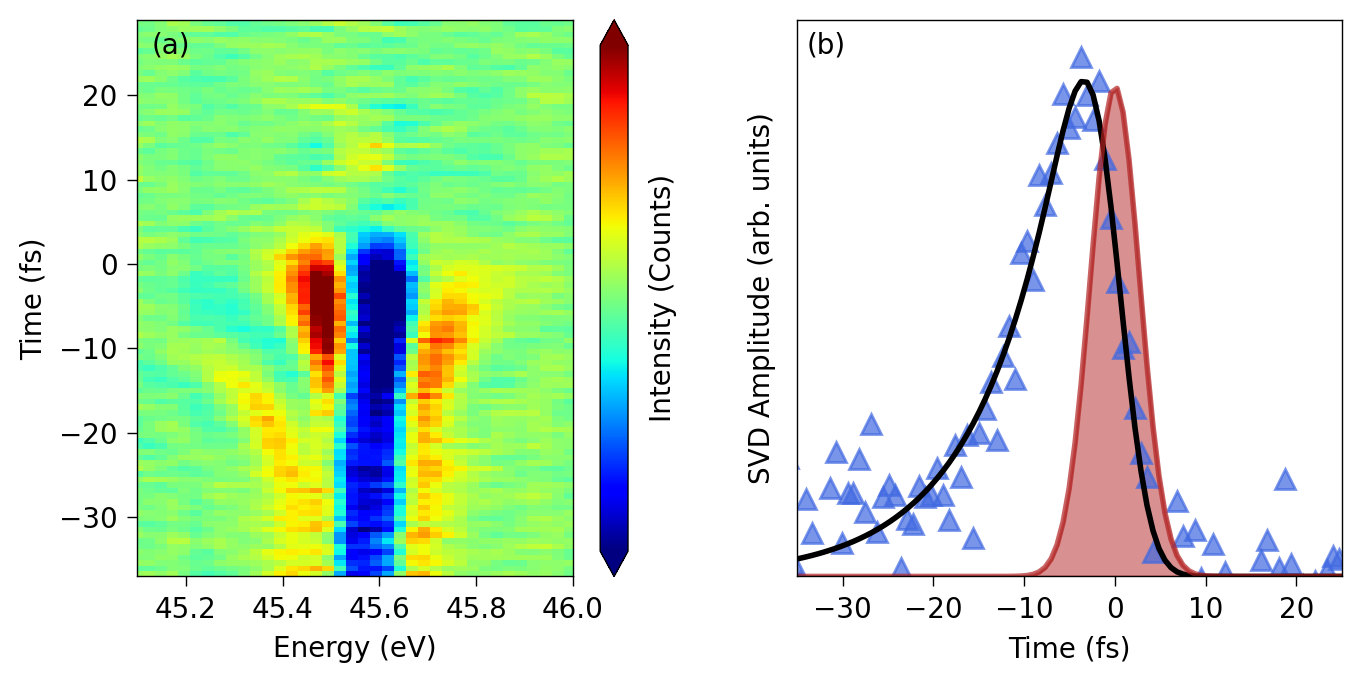
In order to characterize the instrument response time, we measure the singly excited Rydberg resonance in neon located at 45.55 eV [50]. Unlike the above measurements where the XUV spectrum is measured after interaction with the NIR and there is only a transient signal after time zero, in neon the XUV comes before the NIR. This enables the NIR to perturb the oscillating XUV dipole near the resonance by coupling to nearby states and the continuum producing a line-shape change and suppression useful to characterize few-cycle pulses. Fig. 8(a) demonstrates the change in XUV intensity at the n=3 resonance due to the NIR. Using SVD analysis and analyzing the temporal vector of the first component, we retrieve a 6.4(5) fs instrument response time by a least squares fit with an exponentially modified Gaussian shown in Fig. 8(b). At the start of each measurement this methodology is used to optimize the pump pulse contrast and duration by fine tuning of the dispersion. The neon Rydberg resonances are additionally used to calibrate the spectrometer.
Appendix D Residual Transient Absorption
The residual TA signal is presented in Fig. 9 where there is a few mOD signal near the 4d5/2 to Fermi level (40.4 eV) transition that rapidly decays on the timescale of a couple hundred femtoseconds. This residual increase in absorption is well below the Fermi level, and a decrease near the Fermi level is consistent with non-thermalized holes and electrons not captured by the SVD that we assign to the hot carriers. Additionally, the hot carriers dissipate their energy into low energy carriers near the Fermi level that persist to 31 ps , which results in the appearance of state blocking/filling contributions emerging in the residual TA after the 1.6 ps decay. In addition to evolution of the state blocking via the hot carriers, the phase variation in energy of the phonon motion is not possible to capture with a single SVD component and is thus found in the residual TA. This phase variation in energy of the A1g phonon motion results in oscillatory features in the residual TA, alongside potential features of the E1TO mode excitation.
Appendix E Low fluence measurement
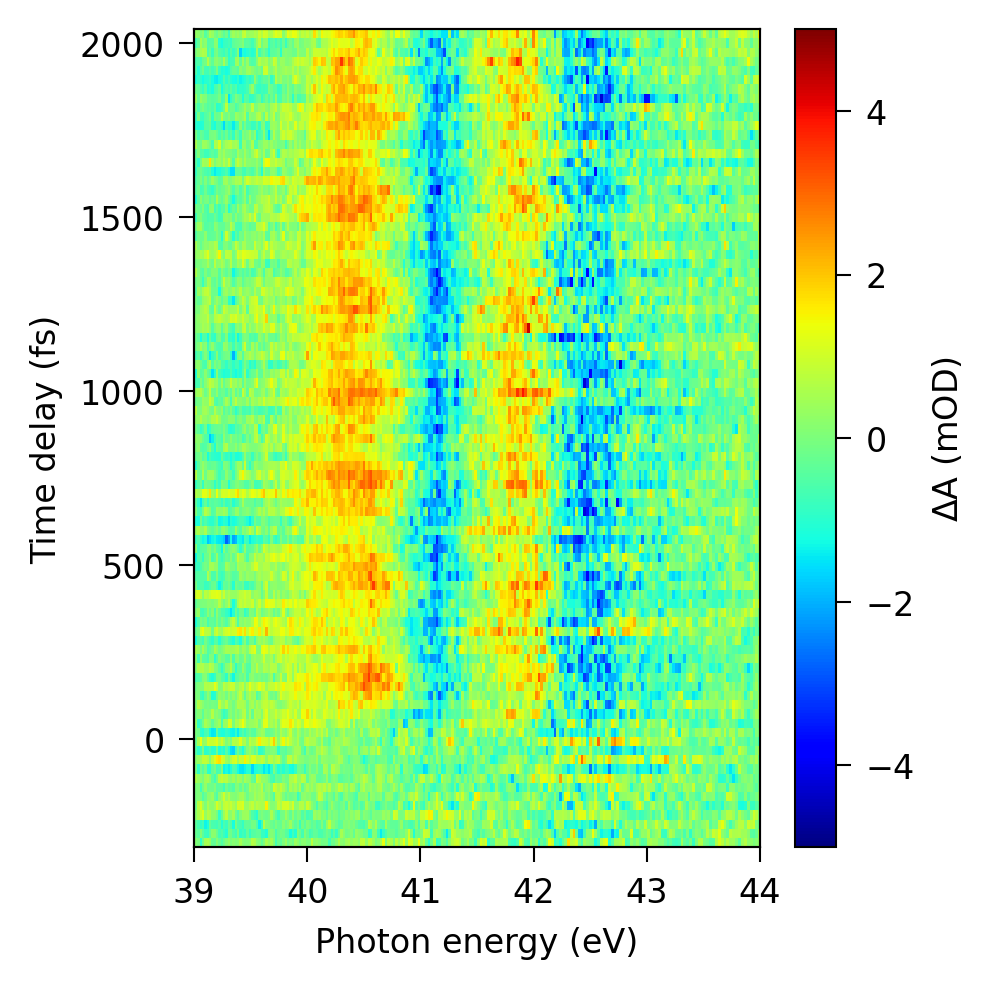
In Fig. 10 we present the transient absorption spectra at a carrier density of . At this lower carrier density, below the expected threshold for the photo-induced semiconductor-to-metal phase transition, the phonon induced edge shift is clearly observed, however, the substantially smaller state blocking/filling contributions are not resolved. The SVD applied to these measurements reveals a single SVD vector resembling the phonon induced absorption edge shift. All other SVD components are indistinguishable from noise. From this, we find no measurable decay () of the excited state equilibrium position and coherent phonon () on the timescale of the measurement. The retrieved frequency is 3.6(3) THz, closer to the equilibrium frequency due to a reduced electronic softening.
Appendix F Short timescales
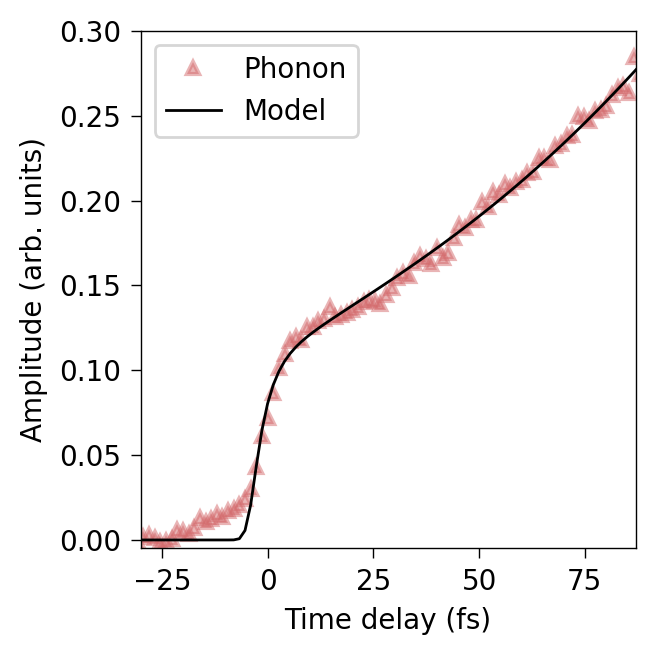
As discussed above in section IV, the shift of the Te equilibrium position in the DECP model should depend on the carrier population [15]. In Fig. 11 we show the phonon induced edge shift component of the multi-temperature model () to a measurement utilizing 660 as time-steps, with the longtime scale components fixed to the results retrieved from the scan to longer timescales. In conjunction with the Te measurement, TA of the neon Rydberg resonances are done after each scan cycle to correct for zero-delay drifts and this enables coupled fitting to retrieve dynamics on the timescale of the cross-correlation. Applying the same SVD methodology as above, we do a simultaneous fit of the Te edge shift and neon Rydberg resonances, where the instrument response convolution is a shared parameter. Through this, we retrieve a 3(1) fs rise time () of the edge shift describing the initial equilibrium position displacement of Te. This would suggest the response of is not immediate, but there is a time dependence of the displacive force. The tail of the signal is not captured by the fitting, which is attributable to a weak pre-pulse in the pump beam, visible at around 10 fs in Fig. 8(a).
References
- Bradley [1924] A. J. Bradley, London Edinburgh Philos. Mag. & J. Sci. 48, 477 (1924).
- Sakano et al. [2020] M. Sakano, M. Hirayama, T. Takahashi, S. Akebi, M. Nakayama, K. Kuroda, K. Taguchi, T. Yoshikawa, K. Miyamoto, T. Okuda, K. Ono, H. Kumigashira, T. Ideue, Y. Iwasa, N. Mitsuishi, K. Ishizaka, S. Shin, T. Miyake, S. Murakami, T. Sasagawa, and T. Kondo, Phys. Rev. Lett. 124, 136404 (2020).
- Ideue et al. [2019] T. Ideue, M. Hirayama, H. Taiko, T. Takahashi, M. Murase, T. Miyake, S. Murakami, T. Sasagawa, and Y. Iwasa, Proc. Natl. Acad. Sci. U.S.A. 116, 25530 (2019).
- Qiu et al. [2020] G. Qiu, C. Niu, Y. Wang, M. Si, Z. Zhang, W. Wu, and P. D. Ye, Nat. Nanotechnol 15, 585 (2020).
- Kim et al. [2022] T. Kim, C. H. Choi, P. Byeon, M. Lee, A. Song, K.-B. Chung, S. Han, S.-Y. Chung, K.-S. Park, and J. K. Jeong, npj 2D mater. appl. 6, 4 (2022).
- Kramer et al. [2020] A. Kramer, M. L. Van de Put, C. L. Hinkle, and W. G. Vandenberghe, npj 2D mater. appl. 4, 10 (2020).
- Lin et al. [2016] S. Lin, W. Li, Z. Chen, J. Shen, B. Ge, and Y. Pei, Nat. Commun. 7, 10287 (2016).
- Ning et al. [2022] H. Ning, O. Mehio, C. Lian, X. Li, E. Zoghlin, P. Zhou, B. Cheng, S. D. Wilson, B. M. Wong, and D. Hsieh, Phys. Rev. B 106, 205118 (2022).
- Kamaraju et al. [2010] N. Kamaraju, S. Kumar, M. Anija, and A. K. Sood, Phys. Rev. B 82, 195202 (2010).
- Roeser et al. [2002] C. A. D. Roeser, A. M.-T. Kim, and E. Mazur, in Conference on Lasers and Electro-Optics, OSA Technical Digest (Optica Publishing Group, Long Beach, California, 2002) p. JTuF5.
- Lyu et al. [2023] X. Lyu, Y. Li, P. Jiang, J. Zhang, X. Liu, X. Li, H. Yang, G. Lu, X. Hu, L. Peng, Q. Gong, and Y. Gao, Nano Lett. 23, 9547 (2023).
- Kim et al. [2003] A. M.-T. Kim, C. A. D. Roeser, and E. Mazur, Phys. Rev. B 68, 012301 (2003).
- Jnawali et al. [2020] G. Jnawali, Y. Xiang, S. M. Linser, I. A. Shojaei, R. Wang, G. Qiu, C. Lian, B. M. Wong, W. Wu, P. D. Ye, Y. Leng, H. E. Jackson, and L. M. Smith, Nat. Commun. 11, 3991 (2020).
- Zhuo et al. [2024] X. Zhuo, Q. Wang, B. Cheng, D. Liang, H. Mu, L. Li, Z. Wang, A. Pan, C. Zeng, and D. Sun, Phys. Rev. B 110, 014311 (2024).
- Zeiger et al. [1992] H. J. Zeiger, J. Vidal, T. K. Cheng, E. P. Ippen, G. Dresselhaus, and M. S. Dresselhaus, Phys. Rev. B 45, 768 (1992).
- Hunsche et al. [1995] S. Hunsche, K. Wienecke, T. Dekorsy, and H. Kurz, Phys. Rev. Lett. 75, 1815 (1995).
- Giret et al. [2011] Y. Giret, A. Gellé, and B. Arnaud, Phys. Rev. Lett. 106, 155503 (2011).
- Géneaux et al. [2021] R. Géneaux, I. Timrov, C. J. Kaplan, A. D. Ross, P. M. Kraus, and S. R. Leone, Phys. Rev. Res. 3, 033210 (2021).
- Drescher et al. [2023] L. Drescher, B. R. de Roulet, Y. S. Phang, and S. R. Leone, “On the onset of coherent phonon motion in peierls-distorted antimony by attosecond transient absorption,” (2023), arXiv:2309.00734 [physics.optics] .
- Zhang et al. [2020] Y. Zhang, X. Shi, W. You, Z. Tao, Y. Zhong, F. Cheenicode Kabeer, P. Maldonado, P. M. Oppeneer, M. Bauer, K. Rossnagel, H. Kapteyn, and M. Murnane, Proc. Natl. Acad. Sci. U.S.A. 117, 8788 (2020).
- Zhao et al. [2021] C. Zhao, H. Batiz, B. Yasar, H. Kim, W. Ji, M. C. Scott, D. C. Chrzan, and A. Javey, Adv. Mater. 33, 2100860 (2021).
- Ferray et al. [1988] M. Ferray, A. L’Huillier, X. F. Li, L. A. Lompre, G. Mainfray, and C. Manus, J. Phys. B 21, L31 (1988).
- Tutihasi et al. [1969] S. Tutihasi, G. G. Roberts, R. C. Keezer, and R. E. Drews, Phys. Rev. 177, 1143 (1969).
- Givens et al. [1955] M. P. Givens, C. J. Koester, and W. L. Goffe, Phys. Rev. 100, 1112 (1955).
- Sonntag et al. [1973] B. Sonntag, T. Tuomi, and G. Zimmerer, Phys. Status Solidi B 58, 101 (1973).
- Attar et al. [2020] A. R. Attar, H.-T. Chang, A. Britz, X. Zhang, M.-F. Lin, A. Krishnamoorthy, T. Linker, D. Fritz, D. M. Neumark, R. K. Kalia, A. Nakano, P. Ajayan, P. Vashishta, U. Bergmann, and S. R. Leone, ACS Nano 14, 15829 (2020).
- Fuggle and Mårtensson [1980] J. C. Fuggle and N. Mårtensson, J. Electron Spectros. Relat. Phenomena 21, 275 (1980).
- Dasika et al. [2021] P. Dasika, D. Samantaray, K. Murali, N. Abraham, K. Watanbe, T. Taniguchi, N. Ravishankar, and K. Majumdar, Adv. Funct. Mater. 31, 2006278 (2021).
- Zürch et al. [2017] M. Zürch, H.-T. Chang, L. J. Borja, P. M. Kraus, S. K. Cushing, A. Gandman, C. J. Kaplan, M. H. Oh, J. S. Prell, D. Prendergast, C. D. Pemmaraju, D. M. Neumark, and S. R. Leone, Nat. Commun. 8, 15734 (2017).
- Oh et al. [2023] J. Oh, H.-T. Chang, C. T. Chen, S. Aloni, A. Schwartzberg, and S. R. Leone, J. Phys. Chem. C 127, 5004 (2023).
- de Groot and Kotani [2008] F. de Groot and A. Kotani, Core Level Spectroscopy of Solids (CRC Press, Florida, 2008).
- Klemens [1966] P. G. Klemens, Phys. Rev. 148, 845 (1966).
- Tan et al. [2023] T. S. Tan, J. J. Kas, S. B. Trickey, and J. J. Rehr, Phys. Rev. B 107, 115122 (2023).
- James and Roos [1975] F. James and M. Roos, Comput. Phys. Commun. 10, 343 (1975).
- Teitelbaum et al. [2018] S. W. Teitelbaum, T. Henighan, Y. Huang, H. Liu, M. P. Jiang, D. Zhu, M. Chollet, T. Sato, E. D. Murray, S. Fahy, S. O’Mahony, T. P. Bailey, C. Uher, M. Trigo, and D. A. Reis, Phys. Rev. Lett. 121, 125901 (2018).
- O’Mahony et al. [2019] S. M. O’Mahony, F. Murphy-Armando, E. D. Murray, J. D. Querales-Flores, I. Savić, and S. Fahy, Phys. Rev. Lett. 123, 087401 (2019).
- Jang et al. [2024] H. Jang, N. S. Han, G. Kim, K. S. Jeong, T. H. Yoon, and M. Cho, J. Phys. Chem. C 128, 268 (2024).
- Ichibayashi and Tanimura [2009] T. Ichibayashi and K. Tanimura, Phys. Rev. Lett. 102, 087403 (2009).
- Z. Lin et al. [1988] W. Z. Lin, R. W. Schoenlein, J. G. Fujimoto, and E. P. Ippen, IEEE J. Quantum Electron. 24, 267 (1988).
- Wilson and Coh [2020] R. B. Wilson and S. Coh, Commun. Phys. 3, 179 (2020).
- Ashcroft and Mermin [1976] N. W. Ashcroft and N. D. Mermin, Solid State Physics (Holt, Rinehart and Winston, New York, 1976).
- Tangney and Fahy [2002] P. Tangney and S. Fahy, Phys. Rev. B 65, 054302 (2002).
- OḾahony [2020] S. M. OḾahony, Electronic excitation and atomic forces in optically excited group V semimetals, Phd thesis, University College Cork, Cork, Ireland (2020).
- Kirchhoff et al. [1994] F. Kirchhoff, N. Binggeli, G. Galli, and S. Massidda, Phys. Rev. B 50, 9063 (1994).
- Xia et al. [2024] Y. Xia, L. Peng, L. Shu, A. Wu, H. Shao, B. Li, J. Zhang, Z. Sui, H. Zhu, and H. Zhang, ACS Nano 18, 5814 (2024).
- Ishioka et al. [2008] K. Ishioka, M. Kitajima, and O. V. Misochko, J. Appl. Phys. 103, 123505 (2008).
- Timmers et al. [2017] H. Timmers, Y. Kobayashi, K. F. Chang, M. Reduzzi, D. M. Neumark, and S. R. Leone, Opt. Lett. 42, 811 (2017).
- Géneaux et al. [2021] R. Géneaux, H.-T. Chang, A. M. Schwartzberg, and H. J. B. Marroux, Opt. Express 29, 951 (2021).
- Lafuente et al. [2016] B. Lafuente, R. T. Downs, H. Yang, and N. Stone, “Highlights in mineralogical crystallography: The rruff project,” (De Gruyter (O), 2016) pp. 1–30.
- Schulz et al. [1996] K. Schulz, M. Domke, R. Püttner, A. Gutiérrez, G. Kaindl, G. Miecznik, and C. H. Greene, Phys. Rev. A 54, 3095 (1996).