Robustness and Confounders in the Demographic Alignment of LLMs with Human Perceptions of Offensiveness
Abstract
Large language models (LLMs) are known to exhibit demographic biases, yet few studies systematically evaluate these biases across multiple datasets or account for confounding factors. In this work, we examine LLM alignment with human annotations in five offensive language datasets, comprising approximately 220K annotations. Our findings reveal that while demographic traits, particularly race, influence alignment, these effects are inconsistent across datasets and often entangled with other factors. Confounders—such as document difficulty, annotator sensitivity, and within-group agreement—account for more variation in alignment patterns than demographic traits alone. Specifically, alignment increases with higher annotator sensitivity and group agreement, while greater document difficulty corresponds to reduced alignment. Our results underscore the importance of multi-dataset analyses and confounder-aware methodologies in developing robust measures of demographic bias in LLMs.
Robustness and Confounders in the Demographic Alignment of LLMs with Human Perceptions of Offensiveness
Shayan Alipour1, Indira Sen2, Mattia Samory1, and Tanushree Mitra3 1 Sapienza University of Rome, 2 University of Mannheim, 3 University of Washington shayan.alipour@uniroma1.it, indira.sen@uni-mannheim.de, mattia.samory@uniroma1.it, tmitra@uw.edu
1 Introduction
A growing body of literature explores LLMs as a quick, cheap, and dependable alternative to human annotators Chiang and Lee (2023); Törnberg (2023); Zhu et al. (2023); Gilardi et al. (2023). The eventuality of annotating data with LLMs is more than simple speculation: professional annotators already rely on LLMs to speed up their work Veselovsky et al. (2023). Since good-quality data annotations are a primary concern for any machine-learning application, its essential to assess the quality of LLM-generated annotations.
In particular, tasks that reflect annotators’ subjective judgment and experiences, such as the perceived offensiveness of a message Davani et al. (2023), raise the question of what kind of subjectivities are reflected in LLM-generated annotations. Recent research finds evidence of demographic bias, that is, systematic alignment between LLMs’ annotations and those from select demographic groups of human annotators. If LLMs replicate the views of one demographic group over others, the resulting data applications risk perpetuating structural harms like marginalization of minority views.
Although LLMs’ demographic bias has been identified for a variety of subjective constructs including resume screening Wilson and Caliskan (2024), medicine Omiye et al. (2023); Zack et al. (2023), political opinions Motoki et al. (2024), and offensiveness Sun et al. (2023); Santy et al. (2023), we know little about whether such bias holds beyond individual datasets. Moreover, many of these studies focus on different NLP tasks and datasets. For example, for offensiveness annotations, Sun et al. find that LLMs align most with White and female annotators in the POPQUORN dataset, while Schäfer et al. use the same dataset and do not find alignment between LLMs and women. Using a different dataset, Santy et al. find LLM alignment on offensiveness to be highest with Asian Americans. Thus, current findings are often contradictory due to the use of single datasets or idiosyncratic alignment measurement approaches, even if the same LLMs are studied. Understanding which demographic biases are consistent in LLM annotations is fundamental to tackling them. Our work fills this gap with a systematic study of LLM alignment on offensiveness labeling with different genders and ethnicities across five datasets, while also investigating factors beyond annotator demographics that might drive human-LLM misalignment.
First, we verify RQ0: to what extent LLMs can substitute human annotators in detecting offensive language, to establish that LLMs’ bias may not simply be attributed to low performance. Indeed, LLMs are strong performers: correlations with aggregate human labels are positive and significant—ranging from 0.4 and 0.8. Through permutation and bootstrapping tests, we show that LLMs surpass individual human annotators in three out of five datasets, while the performance in the remaining cases is comparable.
Next, we test RQ1: which demographic biases are consistently reproduced in LLM-generated annotations across datasets. Demographic biases exist within each dataset; however, most of these biases lack consistency. In our experiments we used two methods—rounded average and majority vote—to calculate the final label for a post. We found that only the bias between the White and Black demographics remained consistent when using the rounded average across all five datasets. Other differences between demographic pairs either appeared in only some datasets or even showed opposite results in different datasets.
We, therefore, explore RQ2: to what extent confounding factors explain demographic bias, to understand how different characteristics of the datasets may lead to varying measures of demographic bias. We consider three alternative hypotheses: HPa) how difficult documents to annotate may be assigned unevenly across demographics; HPb) how individual annotators may have idiosyncratic annotation preferences that dominate those of the demographic; and HPc), how annotators in a demographic sample may have varying levels of agreement, in turn affecting LLMs’ alignment. We find them significantly related by modeling the relationship between demographic bias and confounders via logistic regression. Confounders explain a large fraction of the variance of LLM–human alignment, and thus can help us unpack cases when demographic bias is inconsistent.
Overall contributions and novelty. Unlike past work which has mainly focused on single datasets for assessing human-LLM alignment for data annotation, we investigate alignment between humans and LLMs for labeling offensive content across five different datasets. Depending on the dataset and contrary to past work Sun et al. (2023); Santy et al. (2023), we do not find consistent gender alignment effects or better alignment with Asian Americans. While, we do find consistent patterns of better alignment with White people vs. Black people, demographic variables only drive a fraction of misalignment. We unpack this through a regression analysis with other confounding factors, like annotation difficulty. Finally, we contribute a harmonized, preprocessed, and merged version of five different NLP datasets modeling offensive language spanning 219,359 annotations, disaggregated by annotator groups that we make openly available for further community use.111https://github.com/shayanalipour/llm-alignment-bias
2 Data
To fully understand how LLM annotations align with human opinions, we leverage 5 datasets encoding annotators’ perceptions of offensiveness—a construct that has been proven to vary according to annotators’ sociodemographic characteristics. Specifically, we use the following datasets: 1) “Annotator with Attitudes” (AwA) dataset Sap et al. (2021), 2) UC Berkeley’s Measuring Hate Speech Corpus (MHSC) (Kennedy et al., 2020), 3) NLPositionality (NLPos) dataset Santy et al. (2023), 4) POPQUORN dataset (POPQ) (Pei and Jurgens, 2023), and 5) Social Bias Inference Corpus (SBIC) (Sap et al., 2020).222Offensiveness is examined in three of the five datasets studied in this work (AwA, POPQ, and SBIC), while the remaining two datasets (NLPos and MHSC) focus on hate speech. Past research has looked into the association between offensiveness language and hate speech, concluding that both constructs, while not being the same, are often similarly perceived Davidson et al. (2017); Founta et al. (2018); Fortuna and Nunes (2018). Furthermore, offensive language can be considered a superset of hate speech, where the latter is offensive language targeting protected groups or minorities. We use the annotator backgrounds in these datasets to consider the potential alignment between LLMs’ responses and those of annotators in specific demographic groups (Table 1). Following past research Sap et al. (2021, 2019), we focus on annotators’ ethnicity and gender as major factors in demographic alignment. Although age is a sociodemographic trait also present in all of the datasets included in this study, gender and ethnicity have the advantages that they are coded harmonically across datasets, and that their empirical distributions are such that they are likely to provide sufficient statistical power for analyses. More details about the datasets and their annotators can be found in the Appendix A.
| Demographic | AwA | MHSC | NLPos | POPQ | SBIC |
| Man | |||||
| Woman | |||||
| Asian | - | ||||
| Black | |||||
| Hispanic | - | - | |||
| White |
3 Methods
In this section, we outline the models used for annotating data, explain our approach to prompting, and describe how we evaluate each of our research questions.
3.1 Models
We conduct our experiments with two state-of-the-art models, GPT4o mini (Achiam et al., 2023) and Gemini 1.5 Flash (Team et al., 2024), to identify consistent trends in detecting offensive and hateful language and explore any inter-model variations. Recent studies show that while GPT models perform well on hate speech detection Huang et al. (2023), they may exhibit inherent biases, aligning more closely with certain demographics than others (Zack et al., 2024; Wang et al., 2023; Tao et al., 2023). Similarly, Gemini 1.5 Flash which is a distilled version of Gemini 1.5 Pro, has been reported to achieve near parity with OpenAI’s models across many benchmarks (Team et al., 2024).
3.2 Prompting Strategies
We designed a scoring system that matches the questions asked to human annotators across various datasets for evaluating offensive or toxic content. Following the approach in Wei et al. (2022), we required the model to not only rate the comments but also justify its scores. The wording of the prompts was the same as that used for human annotators, with an additional instruction: “Begin your response by mentioning one of the valid options, then provide a concise explanation for your rating." Our prompts are included in Table 8 in the Appendix. We used a regular expression to extract the final labels from the models’ responses.
3.3 RQ0: LLMs as Annotators
To evaluate how effectively LLMs detect uncivil language, we compared model-generated labels with human annotators’ labels across multiple datasets. We calculated ground truth values using two methods: a rounded average of the labels and the majority label. The main body focuses on the rounded average method, while the majority-label results are detailed in the supplementary information. We calculated the Pearson correlation coefficients between the model and human labels, performed t-tests to assess statistical significance, and calculated 95% confidence intervals (CI) using bootstrapping with 1,000 samples. To further test the robustness of the correlations, we ran a permutation test by shuffling demographic information and recalculating correlations for 1,000 iterations.
To measure agreement among human annotators, we used a leave-one-out approach. For each annotator, we excluded their label from each post and recalculated the ground truth from the remaining labels. This was repeated for every post that the annotator labeled. We then measured the correlation between the annotator’s labels and the recalculated ground truth. By averaging these correlations across all annotators, we determined overall human agreement. To evaluate the robustness, we applied bootstrapping (1,000 samples) to this correlation distribution to estimate 95% confidence intervals.
3.4 RQ1: Demographic Bias Robustness
To analyze demographic biases in LLM-generated annotations, we calculate the ground truth for each demographic by filtering the annotations for that group and aggregating them per post. We then compute the Pearson correlation between the model’s predictions and the demographic-specific ground truth. We also apply the aforementioned robustness checks, including t-tests, confidence interval estimation using bootstrapping, and permutation tests on the demographic labels.
To assess whether the model consistently aligns better with one demographic than another, we use Steiger’s test Steiger (1980); Hoerger (2013) to determine if the difference between correlations is statistically significant. Steiger’s test compares correlations that share a common variable, in this case, the model’s predictions. To account for multiple comparisons, we adjust -values using the Holm-Bonferroni correction. Additionally, we compute confidence intervals for the difference in correlations using bootstrapping. In particular, we measured where represents the model’s predictions, and are two demographic groups. This involves resampling the annotations for each demographic pair and recalculating the difference over 1,000 iterations. If the 95% CI for the bootstrapped distribution includes zero, this suggests that the observed difference in correlations may be due to random variation in the sample distribution.
3.5 RQ2: Demographic Bias Confounders
We consider alternative hypotheses for the alignment between the LLMs and humans, beyond demographic bias. We use individual annotations as observations and operationalize alignment as an indicator variable set to 1 when LLM and human annotations coincide. While considering exact alignment does not capture the direction and magnitude of the differences in annotations, this operalization is practically useful since alignment is high overall (~60% of annotations align perfectly). We model alignment via logistic regression with annotators’ demographic traits as independent variables. Next, we develop additional hypotheses for factors that may confound demographic alignment, which we include as additional independent variables.
HPa: difficulty.
Documents that are difficult to annotate may be assigned unevenly across demographics, which may in turn negatively affect LLM’s alignment. We measure difficulty as the negative Kullback-Leibler divergence between a document’s labels and the uniform distribution. Intuitively, the more diverse the annotators’ labels, the more difficult the document is to annotate.
HPb: sensitivity.
Since few annotators partake in most annotation tasks, some annotators contribute more labels than others, and the representation of demographic traits is unequal, individual annotator factors may dominate the apparent demographic biases. At its simplest, some annotators may systematically label documents as more offensive than other annotators, irrespective of their demographic or a document’s aggregate label. To measure sensitivity, we rank annotators of a document based on their labels. The higher the annotators’ rank, the more likely they align with LLMs tuned to discourage offensive content.
HPc: agreement.
Although alignment is typically measured with a whole demographic group of annotators, different groups may have varying levels of internal agreement. When a group internally disagrees, alignment with it is more complex (and arguably, less meaningful). We operationalize agreement as the negative absolute difference between the individual annotators’ labels and the average label of their demographic groups, therefore computing distinct agreement values for gender and ethnicity. The more annotators behave similarly to their reference group, the higher the agreement.
In addition to confounders, we include the document’s offensiveness label as a control variable to account for skews in the LLMs’ annotations, since we aim at measuring whether LLMs replicate demographics’ annotations of individual documents rather than generic similarity in label distributions in a dataset. LLMs may prefer to label documents as offensive, given their terms of service and training for application in general, safe-for-work contexts. We also control for dataset-specific levels of the dependent and independent variables by including corresponding intercepts. We center all binary variables and standardize confounders and documents’ labels within each dataset by centering them and dividing their values by two standard deviations to make their scales comparable and interpretable Gelman (2008).
4 Results
In this section, we address three questions about the capabilities of LLMs in simulating human judgment when annotating offensive language. First (RQ0), we examine the extent to which LLMs can accurately replicate human annotations overall. Second (RQ1), we investigate the alignment between these models and the annotations of sociodemographic subgroups of annotators and whether these alignments are consistent across datasets. Third (RQ2), we model the alignment behavior by considering potential confounding factors.
4.1 RQ0: Viability of LLMs as Annotators
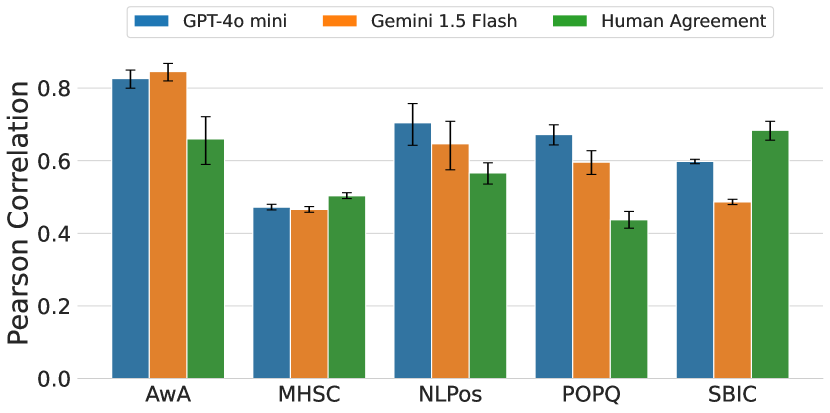
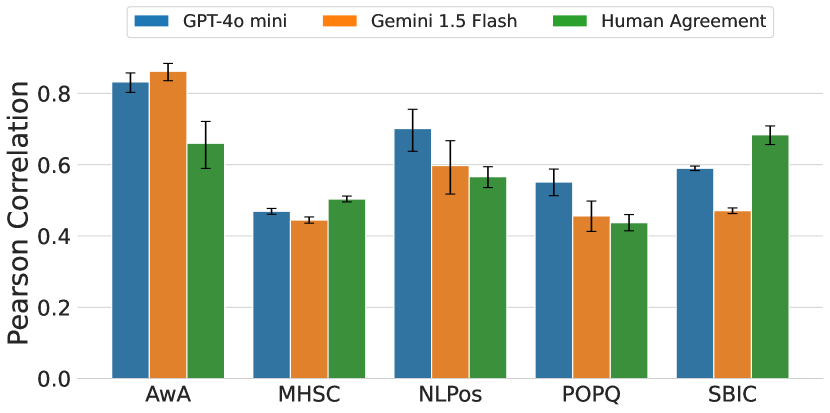
Our results demonstrate that LLMs closely mirror human annotations. Figure 1 shows that the correlations between LLM labels and ground truth labels are strong, positive, and significant, measured using both rounded averages and majority votes.333Figure 4 in the Appendix shows the results for the majority votes, which display a similar pattern. Specifically, the overall correlations range from to across the datasets and models, indicating the models’ strong alignment with human consensus. To put model performance into perspective, we compare them with the performance that individual human annotators achieve compared to the remaining annotators. In three datasets—AwA, POPQ, and NLPos—LLMs surpass individual human annotators. In the other two datasets (SBIC and MHSC), LLMs perform competitively.
4.2 RQ1: Robustness of Demographic Bias
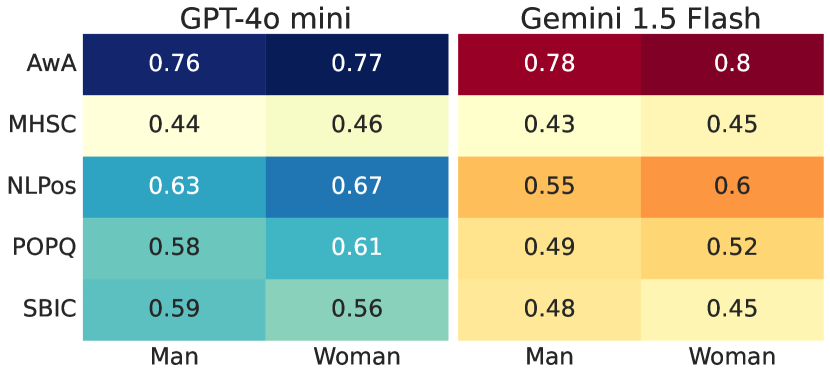
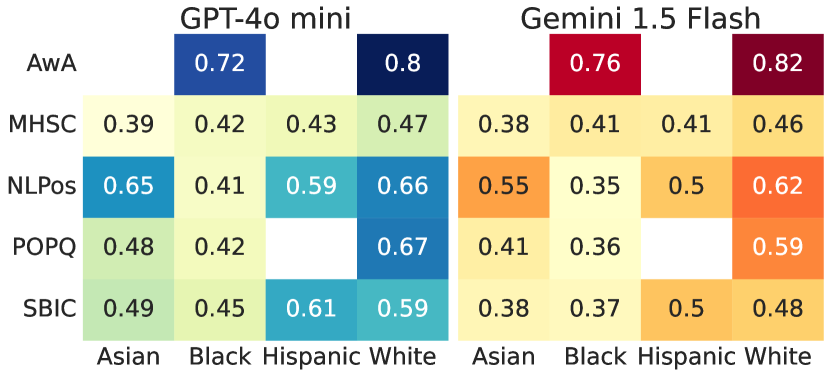
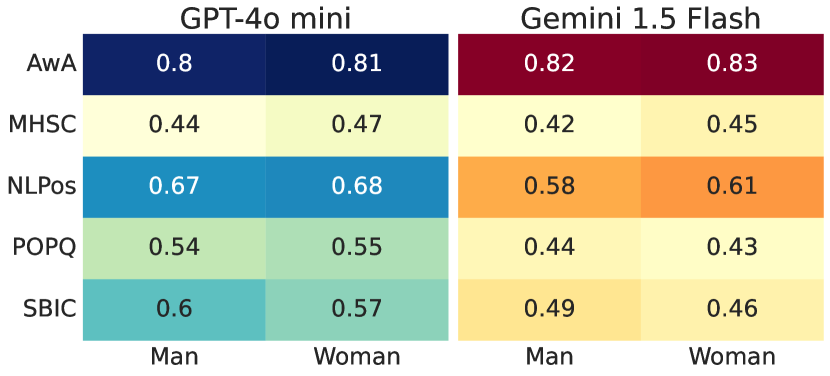
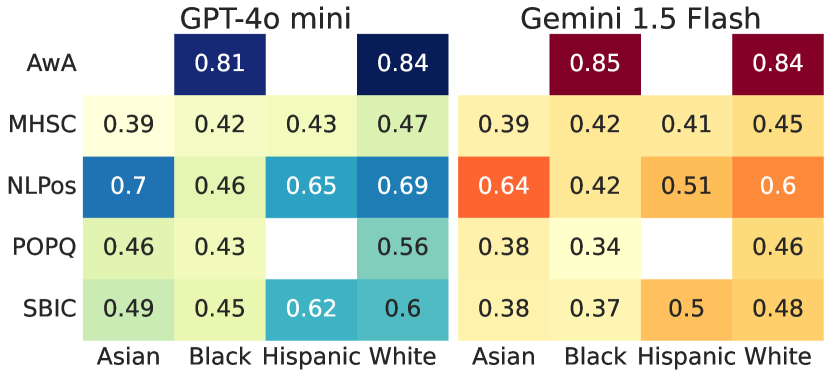
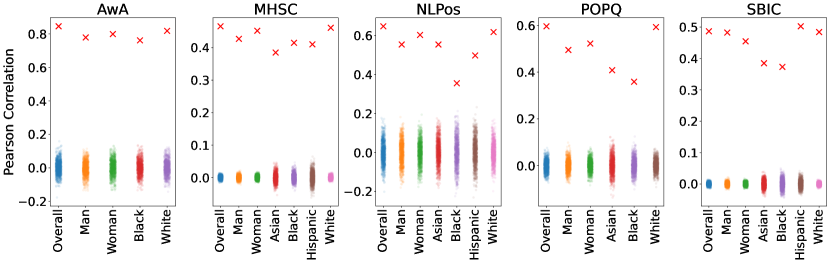
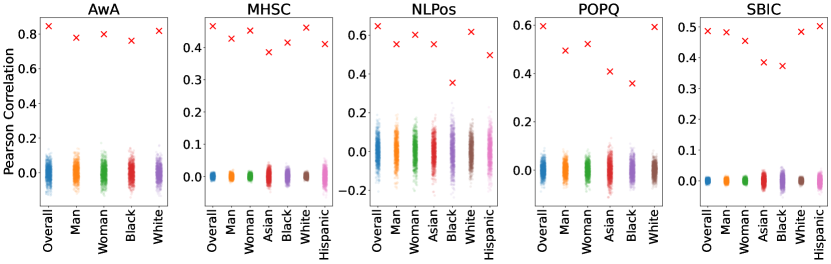
Figure 2 shows the correlation values between LLM labels and the labels of annotators from each demographic group. In Figure 2.a both GPT-4o and Gemini show similar patterns, aligning more closely with annotations from women in the AwA, MHSC, NLPos, and POPQ datasets, while aligning better with men’s annotations in SBIC. For ethnicity, Figure 2.b shows that both models align better with the White demographic in four datasets, except in SBIC, where they achieve higher with the Hispanic demographic. The Hispanic demographic appears in two other datasets—MHSC and NLPos—where they rank third and second out of four ethnic groups, respectively. Across most datasets, the Black demographic generally shows the lowest correlations, except in MHSC, where it surpasses the Asian demographic. These correlation values, as summarized in Table 4, are significant and not due to chance, as confirmed by our permutation tests (see Figures 7 and 8 in the Appendix).
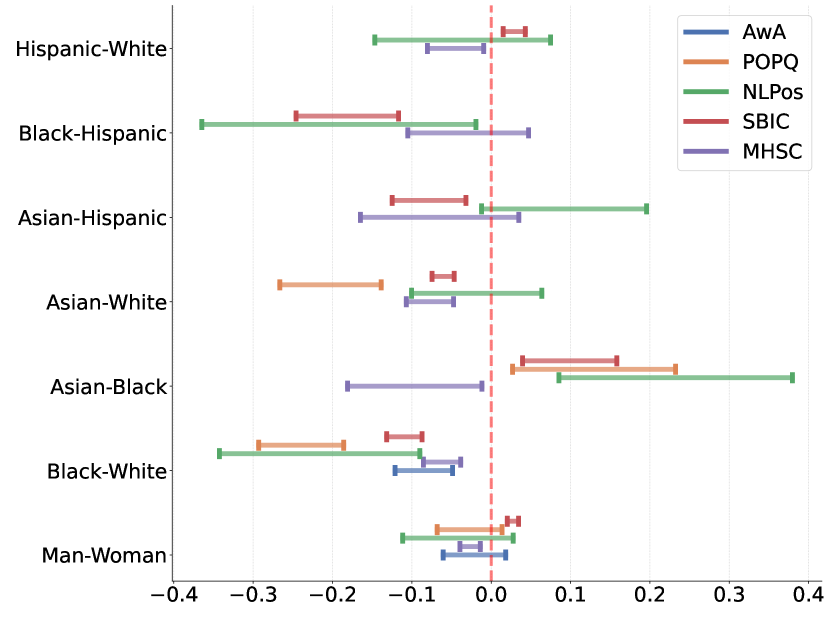
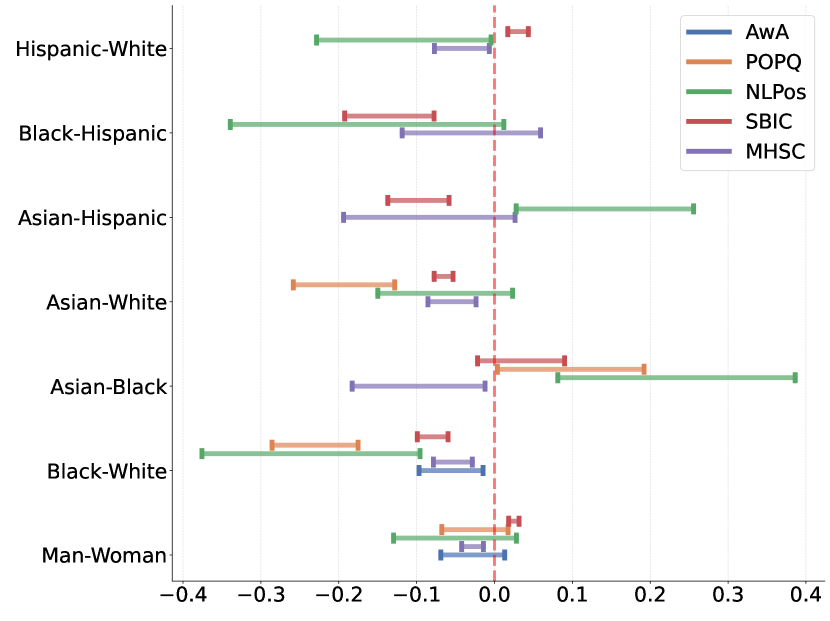
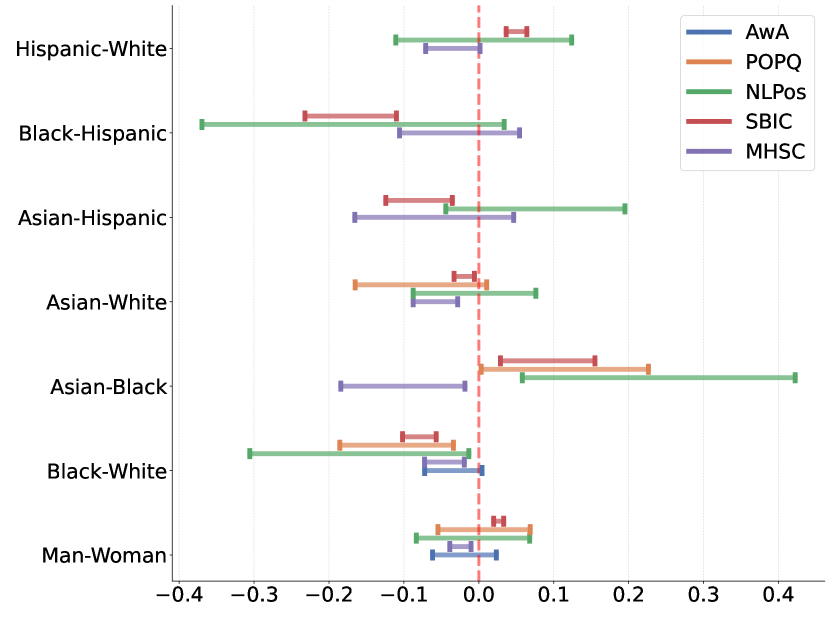
However, echoing Movva et al., statistical significance alone doesn’t guarantee consistent alignment across demographic groups. To assess whether these differences are robust and meaningful, we examine the correlation differences using Steiger’s test and bootstrapping. Without this additional analysis, there’s a risk of over-interpreting the correlations, which might reflect dataset-specific variations rather than true alignment. Figure 3 displays the results for demographic pair comparisons when using the rounded average aggregation method. Some comparisons reveal no significant or robust differences. For example, in the POPQ dataset, the correlation difference between men and women changes sign depending on the sample. We observe that the models align slightly better with the Hispanic demographic than with the White demographic in SBIC, but this trend reverses in MHSC and NLPos. The only consistent finding across all datasets is the Black-White pair, where models show lower correlations with the Black people.
Results from Figure 3 highlight a general lack of robustness indicating that demographic annotations are influenced by many factors beyond demographic identity, such as individual interpretation or dataset composition.444Results for the majority vote are similar and reported in the Appendix (Figure 6) While the correlation values between models and annotator groups are statistically significant, testing the robustness of correlation differences shows that demographic identity alone does not consistently explain the observed variance in model alignment.
4.3 RQ2: Significant Confounders of Demographic Alignment
We now explore potential confounders that may account for inconsistencies in RQ1. Table 2 shows the summary statistics of the logistic regressions of the alignment between LLM and human labels (1 only if they use the same label). The first regression (on the left in the table) explains the relationship between LLM alignment and the annotator’s gender and ethnicity, controlling for per-dataset differences. As for our previous analyses, alignment is higher for White than for Black annotators, with marginally significant differences between women and men. This demographic-only model explains little variance in the LLM-human alignment (pseudo- = 0.015). The second model (on the right in the table) attempts to explain the remaining variance by accounting for confounding factors. Indeed, modeling confounders substantially improves model fit (pseudo- = 0.213). All confounders show statistically significant coefficients and follow their hypothesized behavior (controlling for annotators’ demographics).
First, the more difficult it is to label a document, i.e., the more diversity in the annotators’ labels regardless of their demographics, the lower the alignment with the LLM. Conversely, the higher the agreement between annotators of the same demographic on a document, the higher the likelihood of alignment. Additionally, the more sensitive one annotator is to offensiveness compared to other annotators of the same document, the higher the alignment, which remains true even when controlling for the overall label of the document, irrespective of the annotators’ demographics. In fact, the largest coefficients are associated with confounders at the level of the document—its label and annotation difficulty—which do not directly model the preference of individuals or groups of annotators.
Yet, these confounders do not fully mediate demographic alignment: when explicitly modeling them, we see increased rather than decreased significance of demographic coefficients, e.g., LLMs significantly align with male annotators in the confounder-aware model but not in the demographics-only model. Additionally, even with the confounders, the overall explanation for the variance in annotations is moderate (pseudo- = 0.213), indicating that other hidden confounders need to be accounted for to explain (mis)alignment, e.g., social media usage or attitudes towards free speech Fleisig et al. (2023); Sap et al. (2021).
In summary, we find that LLMs’ demographic bias is at least partially explained by confounding factors. Especially, LLMs’ overall tendency to rate documents as offensive matches demographics that are assigned more, more clearly offensive documents and/or include more sensitive, mutually agreeing individual annotators. Since the procedures of annotator recruitment and document assignment for a demographic vary between annotation tasks, LLMs may appear biased toward different demographics in the resulting datasets. Thus, by resorting to factors at the document, individual annotator, and annotator sample levels, we can reconcile inconsistencies in the demographic bias observed across datasets—that would otherwise contradict the assumption that LLMs replicate certain demographics’ annotations.
| D.V.: alignment | model 1 | model 2 |
|---|---|---|
| dataset=popq | ∗∗∗ | ∗∗∗ |
| dataset=nlpos | ∗∗∗ | ∗∗∗ |
| dataset=sbic | ∗∗∗ | ∗∗∗ |
| dataset=mhsc | ∗∗∗ | ∗∗∗ |
| gender=woman | ∗ | ∗∗∗ |
| ethnicity=asian | ∗∗∗ | ∗∗∗ |
| ethnicity=black | ∗∗∗ | ∗∗∗ |
| ethnicity=hispanic | ∗ | |
| difficulty | ∗∗∗ | |
| sensitivity | ∗∗∗ | |
| agreementethnicity | ∗∗∗ | |
| agreementgender | ∗∗∗ | |
| label | ∗∗∗ | |
| intercept | ∗∗∗ | ∗∗∗ |
| observations | 219359 | 219359 |
| pseudo | ||
| ∗p0.05; ∗∗p0.01; ∗∗∗p0.001 | ||
5 Related Work
Paper Models Used Datasets Task / Construct Demographic Variables Demographic / Default Prompting Findings for Default Prompting Giorgi et al. (2024) Llama-3, Phi-3, SOLAR-10, Starling-LM 1 (Measuring Hate Speech) hate speech gender, race, age, education, religion, sexuality, ideology demographic N/A Hu and Collier (2024) GPT4, GPT3.5, LlaMa-2, Tulu several sentiment, stance, offensive language, hate speech, social acceptability gender, race, location, education, native language, age, religion, political leaning demographic N/A Sun et al. (2023) FLAN-T5-XXL, FLAN-UL2, GPT-3.5, GPT-4 1 (POPQUORN) offensiveness, politeness gender, race both better alignment with White people and women Schäfer et al. (2024) GPT4o, Claude 1 (POPQUORN) offensiveness, politeness gender, race, age, education, occupation both better alignment with White people compared to Black people Beck et al. (2023) GPT-3, T5, OPT, Pythia several sentiment, stance, offensive language, hate speech gender, race, age, education, political leaning both do not test or report alignment with the default prompt, i.e., the one without sociodemographic info. Santy et al. (2023) GPT4 1 (NLPositionality) hate speech, social acceptability gender, race, location, education, native language, age, religion default for hate speech: better alignment with Asian-Americans than White Movva et al. (2024) GPT4 1 (DICES) safety gender, race default no clear demographic alignment Ours GPT4o, Gemini, LLaMa several offensiveness, hate speech gender, race default better alignment with White people compared to Black people
Our work assess one aspect of human-LLM alignment within the context of automated labeling — demographic alignment. Therefore, it lies at the intersection of using LLMs for annotation, annotation subjectivity, and demographic bias in LLMs.
5.1 Using LLMs for Data Annotation
While pre-trained language models like BERT and RoBERTa have been used widely for content analysis (González-Carvajal and Garrido-Merchán, 2020), recent work has focused on using generative LLMs, such as Flan-T5 and GPT for data labeling for various social constructs like offensive language (Zampieri et al., 2023), stance detection (Aiyappa et al., 2024), hate speech (Huang et al., 2023), and framing (Gilardi et al., 2023). However, there is contention about the quality of LLM-generated annotations. Since ChatGPT’s release, some studies have claimed it outperforms human annotators (Gilardi et al., 2023; Wu et al., 2023; Chiang and Lee, 2023; Törnberg, 2023; Zhu et al., 2023), while others find LLMs do not reach human-level performance (Kristensen-McLachlan et al., 2023).
5.2 Subjectivity and Demographic Factors in Human Annotations
Data annotations from multiple annotators, collected for training supervised classification models, have traditionally been aggregated to a single ground-truth label for each instance, usually based on majority aggregation. Yet, annotation is often an interpretive task that depends on the annotator’s positionality, social situation, and lived experiences (Paullada et al., 2021; Santy et al., 2023), which challenges the assumption of the existence of such a single true label. Recent work in NLP and ML has recognized that the typical majority aggregation can squash the opinions and views of minoritized and marginalized populations (Davani et al., 2022, 2023). This is particularly pertinent for subjective tasks such as detecting offensive, abusive, or toxic content. Here, an annotator’s demographic identity (Al Kuwatly et al., 2020), attitudes (Sap et al., 2021), personal experiences (Sang and Stanton, 2022), and their combination impact annotator perception of toxicity. Furthermore, researchers also recommend explicitly factoring in dimensions that would lead to disagreement before the annotation task to reduce haphazard annotation distributions Fleisig et al. (2024).
5.3 Demographic Alignment of LLMs for Annotation
A growing body of work looks more specifically at the sociodemographic alignment of LLMs and human annotators for the task of content analysis Sun et al. (2023); Santy et al. (2023), inter alia. Table 3 summarizes and compares this work to most related past and concurrent work on this, focusing on the different types of LLMs studies, the different NLP tasks, as well as on how many datasets. More importantly, we differentiate between default vs. sociodemographic prompting, where the latter includes demographic variables in the input prompt to LLMs in order to improve alignment. However, in this work, we focus on the default prompts without sociodemographic signals to first systematically investigate the default alignment of LLMs across several datasets, and thereby establish convergent validity Cunningham et al. (2001).
Papers assessing default prompting are the closest to our current research; they mainly do so on single, but different datsets, leading to contradictory findings about demographic alignment, even for the same or related NLP tasks like offensiveness and hate speech. Sun et al. look into the alignment between human annotators and LLM annotations for offensiveness and politeness, finding that LLMs align best with White women. Schäfer et al.use the same dataset, but find that LLMs align better with White people, but not women. Differing from both of these, Santy et al. find that for hate speech detection, models align best with Asian Americans. Our work unpacks these seemingly contradictory findings by conducting a systematic study across several datasets, accounting for variance, and going beyond demographic variables.
6 Discussion and Conclusions
Summary of findings. Our findings corroborate some of the previous results on demographic biases in LLMs’ offensiveness ratings. Specifically and in line with Sun et al. and Schäfer et al., LLMs consistently align better with White annotators vs. Black. This bias replicates across five datasets and is measurable even when accounting for several confounders. However, our systematic analysis offer a more nuanced picture compared to single-dataset studies from past work. Apparent demographic biases such as those based on annotators’ gender Sun et al. (2023) or the Asian American demographic Santy et al. (2023), are statistically significant but contradictory in different datasets. We show that LLM–human alignment may appear, unduly, as being associated with the annotators’ demographic, when in fact it is confounded, if not explained by several factors that accrue in groups of annotators who share a demographic trait in a particular dataset but not in others.
Implications for Demographic Alignment in Data Annotation. The consistently worse alignment with Black people highlights inherent biases in the use of LLMs for detecting offensiveness. Therefore, we echo the warnings raised in related literature about the potential negative consequences of using LLM-generated annotations without first understanding whose points of view they may reinforce or neglect. However, given the lack of consistent alignment with any other demographic factor, we caution against narratives that anthropomorphize LLMs and essentialize annotators.
Recommendations for Measuring Misalignment. Our results show that measuring demographic biases in a single dataset may produce unreliable results. Systematic benchmarking across multiple datasets, coupled with replication and meta-analytical studies, is essential to support general claims about demographic bias. Moreover, including confounding variables in analyses is crucial to distinguish between demographic bias and other sources of LLM–human alignment; established frameworks like Item-Response Theory, which guide the hypotheses about confounders in the present work, offer valuable best practices.
The heterogeneity of results also underscores the need for datasets with greater demographic representation, more redundant labeling, and increased data diversity Fleisig et al. (2024). While acknowledging the practical and financial constraints of building such datasets, our research provides insights into strategic approaches for enhancing data quality. Specifically, we emphasize the importance of accounting for confounders, such as document difficulty and the sensitivity of individual annotators, in their interplay with annotator demographics. Since, at present, such confounders only emerge at the end of the annotation process, we see an opportunity for developing annotation solutions that dynamically adjust annotator recruitment and document assignment in response to emerging patterns.
7 Limitations
Our study has several limitations that point to opportunities for future work. The analysis is restricted to the English language, which limits the applicability of our findings across languages with different cultural nuances and linguistic structures. Additionally, our focus on demographic factors like gender and race provides only a partial view of potential biases, possibly overlooking other demographic characteristics that may influence alignment patterns. While we incorporated confounders such as document difficulty and annotator sensitivity, other factors like the target of offensive language, could further enhance our model. The rapid advancements in language models seek the need for refining evaluation methods to maintain relevance over time. Finally, we only assess the biases associated with default prompting, i.e., prompting without sociodemographic signals. While other researchers have looked into sociodemographic prompting Beck et al. (2023); Sun et al. (2023); Schäfer et al. (2024), it is important to consider the default case in detail since in real-world settings, all relevant demographic variables may not be known a priori. Indeed, most recent work benchmarking the use of LLMs for content labeling do so without sociodemographic prompting Gilardi et al. (2023); Ziems et al. (2024).
8 Ethics Statement
As language technologies become widely used for algorithmic decision-making, such as using NLP techniques for detecting offensive content as a type of content moderation tool, there are growing concerns about these technology’s biases against marginalized populations; populations who are themselves most susceptible to receiving offensive attacks on platforms. In this work, we assess one aspect of such bias in the latest generation of language technology — demographic misalignment in prompt-based Large Language Models. Our findings across multiple datasets show that current LLMs have varying and inconsistent alignment with different demographics, but have especially lower alignment with Black people, and for offensive and potentially offensive content.
While current work has assessed the utility of including demographic information in prompts to induce personas (‘demographic steering’) (Santurkar et al., 2023), also in the context of data annotation (Sun et al., 2023; Beck et al., 2023), the preliminary results indicate that this type of steering does not improve alignment. Therefore, we need to assess further strategies such as fine-tuning (instruction or otherwise), Retrieval Augmented Generation, or even pre-training to address this misalignment.
We use three openly available datasets in our experiments, where the creators of these datasets made annotator demographics available along with the distribution of annotator labels (Sun et al., 2023; Sap et al., 2020; Kennedy et al., 2020). All of the annotator data released by these authors are anonymized and we do not attempt to deanonymize any of the annotators. While we attempted to include understudied demographic identities in this work, particularly intersectional identities, we only consider men and women within our gender variables. This is because the annotations of other genders (non-binary people) were significantly fewer and could not be quantitatively modeled. However, it is important to represent gender minorities when assessing the alignment of LLMs, especially when they are used to label offensive content targeting these groups. We hope to address this in future work by having a larger and more diverse pool of annotators.
While the results of our work indicate the need for strategies to improve alignment, there are also concerns of demographic essentialization and ecological fallacies (Orlikowski et al., 2023); their demographic identity could be one of the many factors affecting an annotator’s perception of offensiveness. Other important factors to consider could be lived experiences, particularly past experiences with harassment. In future work, we hope to disentangle demographic and individual patterns when annotating content and devise ways of incorporating these into LLMs.
9 Reproducibility
Our analysis relies on five distinct datasets, with four freely accessible through public repositories. The fifth dataset AwA (Annotators with Attitude) can be obtained through a formal request to the original authors. We used two models gpt-4o-mini-2024-07-18 and gemini-1.5-flash-002 both of which can be accessed from OpenAI and Google’s APIs. The exact prompts that we used for all LLMs are included in the Appendix (Section C). The code to run the experiments is available at llm-demographic-bias repository on Github.
References
- Achiam et al. (2023) Josh Achiam, Steven Adler, Sandhini Agarwal, Lama Ahmad, Ilge Akkaya, Florencia Leoni Aleman, Diogo Almeida, Janko Altenschmidt, Sam Altman, Shyamal Anadkat, et al. 2023. Gpt-4 technical report. arXiv preprint arXiv:2303.08774.
- Aiyappa et al. (2024) Rachith Aiyappa, Shruthi Senthilmani, Jisun An, Haewoon Kwak, and Yong-Yeol Ahn. 2024. Benchmarking zero-shot stance detection with flant5-xxl: Insights from training data, prompting, and decoding strategies into its near-sota performance. arXiv preprint arXiv:2403.00236.
- Al Kuwatly et al. (2020) Hala Al Kuwatly, Maximilian Wich, and Georg Groh. 2020. Identifying and measuring annotator bias based on annotators’ demographic characteristics. In Proceedings of the fourth workshop on online abuse and harms, pages 184–190.
- Beck et al. (2023) Tilman Beck, Hendrik Schuff, Anne Lauscher, and Iryna Gurevych. 2023. How (not) to use sociodemographic information for subjective nlp tasks. arXiv preprint arXiv:2309.07034.
- Chiang and Lee (2023) Cheng-Han Chiang and Hung-yi Lee. 2023. Can large language models be an alternative to human evaluations? arXiv preprint arXiv:2305.01937.
- Cunningham et al. (2001) William A Cunningham, Kristopher J Preacher, and Mahzarin R Banaji. 2001. Implicit attitude measures: Consistency, stability, and convergent validity. Psychological science, 12(2):163–170.
- Davani et al. (2023) Aida Mostafazadeh Davani, Mark Diaz, Dylan Baker, and Vinodkumar Prabhakaran. 2023. Disentangling disagreements on offensiveness: A cross-cultural study. In The 61st Annual Meeting of the Association for Computational Linguistics.
- Davani et al. (2022) Aida Mostafazadeh Davani, Mark Díaz, and Vinodkumar Prabhakaran. 2022. Dealing with disagreements: Looking beyond the majority vote in subjective annotations. Transactions of the Association for Computational Linguistics, 10:92–110.
- Davidson et al. (2017) Thomas Davidson, Dana Warmsley, Michael Macy, and Ingmar Weber. 2017. Automated hate speech detection and the problem of offensive language. In Proceedings of the international AAAI conference on web and social media, volume 11, pages 512–515.
- Fleisig et al. (2023) Eve Fleisig, Rediet Abebe, and Dan Klein. 2023. When the majority is wrong: Modeling annotator disagreement for subjective tasks. In Proceedings of the 2023 Conference on Empirical Methods in Natural Language Processing, pages 6715–6726.
- Fleisig et al. (2024) Eve Fleisig, Su Lin Blodgett, Dan Klein, and Zeerak Talat. 2024. The perspectivist paradigm shift: Assumptions and challenges of capturing human labels. In Proceedings of the 2024 Conference of the North American Chapter of the Association for Computational Linguistics: Human Language Technologies (Volume 1: Long Papers), pages 2279–2292.
- Fortuna and Nunes (2018) Paula Fortuna and Sérgio Nunes. 2018. A survey on automatic detection of hate speech in text. ACM Computing Surveys (CSUR), 51(4):1–30.
- Founta et al. (2018) Antigoni Founta, Constantinos Djouvas, Despoina Chatzakou, Ilias Leontiadis, Jeremy Blackburn, Gianluca Stringhini, Athena Vakali, Michael Sirivianos, and Nicolas Kourtellis. 2018. Large scale crowdsourcing and characterization of twitter abusive behavior. In Proceedings of the international AAAI conference on web and social media, volume 12.
- Gelman (2008) Andrew Gelman. 2008. Scaling regression inputs by dividing by two standard deviations. Statistics in medicine, 27(15):2865–2873.
- Gilardi et al. (2023) Fabrizio Gilardi, Meysam Alizadeh, and Maël Kubli. 2023. Chatgpt outperforms crowd workers for text-annotation tasks. Proceedings of the National Academy of Sciences, 120(30):e2305016120.
- Giorgi et al. (2024) Tommaso Giorgi, Lorenzo Cima, Tiziano Fagni, Marco Avvenuti, and Stefano Cresci. 2024. Human and llm biases in hate speech annotations: A socio-demographic analysis of annotators and targets. arXiv preprint arXiv:2410.07991.
- González-Carvajal and Garrido-Merchán (2020) Santiago González-Carvajal and Eduardo C Garrido-Merchán. 2020. Comparing bert against traditional machine learning text classification. arXiv preprint arXiv:2005.13012.
- Hoerger (2013) M Hoerger. 2013. Zh: An updated version of steiger’s z and web-based calculator for testing the statistical significance of the difference between dependent correlations.
- Hu and Collier (2024) Tiancheng Hu and Nigel Collier. 2024. Quantifying the persona effect in LLM simulations. In Proceedings of the 62nd Annual Meeting of the Association for Computational Linguistics (Volume 1: Long Papers), pages 10289–10307, Bangkok, Thailand. Association for Computational Linguistics.
- Huang et al. (2023) Fan Huang, Haewoon Kwak, and Jisun An. 2023. Is chatgpt better than human annotators? potential and limitations of chatgpt in explaining implicit hate speech. In Companion proceedings of the ACM web conference 2023, pages 294–297.
- Kennedy et al. (2020) Chris J Kennedy, Geoff Bacon, Alexander Sahn, and Claudia von Vacano. 2020. Constructing interval variables via faceted rasch measurement and multitask deep learning: a hate speech application. arXiv preprint arXiv:2009.10277.
- Kristensen-McLachlan et al. (2023) Ross Deans Kristensen-McLachlan, Miceal Canavan, Márton Kardos, Mia Jacobsen, and Lene Aarøe. 2023. Chatbots are not reliable text annotators. arXiv preprint arXiv:2311.05769.
- Motoki et al. (2024) Fabio Motoki, Valdemar Pinho Neto, and Victor Rodrigues. 2024. More human than human: measuring chatgpt political bias. Public Choice, 198(1):3–23.
- Movva et al. (2024) Rajiv Movva, Pang Wei Koh, and Emma Pierson. 2024. Annotation alignment: Comparing llm and human annotations of conversational safety. arXiv preprint arXiv:2406.06369.
- Omiye et al. (2023) Jesutofunmi A Omiye, Jenna C Lester, Simon Spichak, Veronica Rotemberg, and Roxana Daneshjou. 2023. Large language models propagate race-based medicine. NPJ Digital Medicine, 6(1):195.
- Orlikowski et al. (2023) Matthias Orlikowski, Paul Röttger, Philipp Cimiano, and Dirk Hovy. 2023. The ecological fallacy in annotation: Modelling human label variation goes beyond sociodemographics. arXiv preprint arXiv:2306.11559.
- Paullada et al. (2021) Amandalynne Paullada, Inioluwa Deborah Raji, Emily M Bender, Emily Denton, and Alex Hanna. 2021. Data and its (dis) contents: A survey of dataset development and use in machine learning research. Patterns, 2(11).
- Pei and Jurgens (2023) Jiaxin Pei and David Jurgens. 2023. When do annotator demographics matter? measuring the influence of annotator demographics with the popquorn dataset. arXiv preprint arXiv:2306.06826.
- Sang and Stanton (2022) Yisi Sang and Jeffrey Stanton. 2022. The origin and value of disagreement among data labelers: A case study of individual differences in hate speech annotation. In International Conference on Information, pages 425–444. Springer.
- Santurkar et al. (2023) Shibani Santurkar, Esin Durmus, Faisal Ladhak, Cinoo Lee, Percy Liang, and Tatsunori Hashimoto. 2023. Whose opinions do language models reflect? In International Conference on Machine Learning, pages 29971–30004. PMLR.
- Santy et al. (2023) Sebastin Santy, Jenny T Liang, Ronan Le Bras, Katharina Reinecke, and Maarten Sap. 2023. Nlpositionality.
- Sap et al. (2019) Maarten Sap, Dallas Card, Saadia Gabriel, Yejin Choi, and Noah A Smith. 2019. The risk of racial bias in hate speech detection. In Proceedings of the 57th annual meeting of the association for computational linguistics, pages 1668–1678.
- Sap et al. (2020) Maarten Sap, Saadia Gabriel, Lianhui Qin, Dan Jurafsky, Noah A Smith, and Yejin Choi. 2020. Social bias frames: Reasoning about social and power implications of language. In Proceedings of the 58th Annual Meeting of the Association for Computational Linguistics, pages 5477–5490.
- Sap et al. (2021) Maarten Sap, Swabha Swayamdipta, Laura Vianna, Xuhui Zhou, Yejin Choi, and Noah A Smith. 2021. Annotators with attitudes: How annotator beliefs and identities bias toxic language detection. arXiv preprint arXiv:2111.07997.
- Schäfer et al. (2024) Johannes Schäfer, Aidan Combs, Christopher Bagdon, Jiahui Li, Nadine Probol, Lynn Greschner, Sean Papay, Yarik Menchaca Resendiz, Aswathy Velutharambath, Amelie Wührl, Sabine Weber, and Roman Klinger. 2024. Which demographics do llms default to during annotation? Preprint, arXiv:2410.08820.
- Steiger (1980) James H Steiger. 1980. Tests for comparing elements of a correlation matrix. Psychological bulletin, 87(2):245.
- Sun et al. (2023) Huaman Sun, Jiaxin Pei, Minje Choi, and David Jurgens. 2023. Aligning with whom? large language models have gender and racial biases in subjective nlp tasks. arXiv preprint arXiv:2311.09730.
- Tao et al. (2023) Yan Tao, Olga Viberg, Ryan S Baker, and Rene F Kizilcec. 2023. Auditing and mitigating cultural bias in llms. arXiv preprint arXiv:2311.14096.
- Team et al. (2024) Gemini Team, Petko Georgiev, Ving Ian Lei, Ryan Burnell, Libin Bai, Anmol Gulati, Garrett Tanzer, Damien Vincent, Zhufeng Pan, Shibo Wang, et al. 2024. Gemini 1.5: Unlocking multimodal understanding across millions of tokens of context. arXiv preprint arXiv:2403.05530.
- Törnberg (2023) Petter Törnberg. 2023. Chatgpt-4 outperforms experts and crowd workers in annotating political twitter messages with zero-shot learning. arXiv preprint arXiv:2304.06588.
- Veselovsky et al. (2023) Veniamin Veselovsky, Manoel Horta Ribeiro, Philip Cozzolino, Andrew Gordon, David Rothschild, and Robert West. 2023. Prevalence and prevention of large language model use in crowd work. arXiv preprint arXiv:2310.15683.
- Wang et al. (2023) Boxin Wang, Weixin Chen, Hengzhi Pei, Chulin Xie, Mintong Kang, Chenhui Zhang, Chejian Xu, Zidi Xiong, Ritik Dutta, Rylan Schaeffer, et al. 2023. Decodingtrust: A comprehensive assessment of trustworthiness in gpt models. arXiv preprint arXiv:2306.11698.
- Wei et al. (2022) Jason Wei, Xuezhi Wang, Dale Schuurmans, Maarten Bosma, Fei Xia, Ed Chi, Quoc V Le, Denny Zhou, et al. 2022. Chain-of-thought prompting elicits reasoning in large language models. Advances in neural information processing systems, 35:24824–24837.
- Wilson and Caliskan (2024) Kyra Wilson and Aylin Caliskan. 2024. Gender, race, and intersectional bias in resume screening via language model retrieval. In Proceedings of the AAAI/ACM Conference on AI, Ethics, and Society, volume 7, pages 1578–1590.
- Wu et al. (2023) Patrick Y Wu, Joshua A Tucker, Jonathan Nagler, and Solomon Messing. 2023. Large language models can be used to estimate the ideologies of politicians in a zero-shot learning setting. arXiv preprint arXiv:2303.12057.
- Zack et al. (2023) Travis Zack, Eric Lehman, Mirac Suzgun, Jorge A Rodriguez, Leo Anthony Celi, Judy Gichoya, Dan Jurafsky, Peter Szolovits, David W Bates, Raja-Elie E Abdulnour, et al. 2023. Coding inequity: Assessing gpt-4’s potential for perpetuating racial and gender biases in healthcare. medRxiv, pages 2023–07.
- Zack et al. (2024) Travis Zack, Eric Lehman, Mirac Suzgun, Jorge A Rodriguez, Leo Anthony Celi, Judy Gichoya, Dan Jurafsky, Peter Szolovits, David W Bates, Raja-Elie E Abdulnour, et al. 2024. Assessing the potential of gpt-4 to perpetuate racial and gender biases in health care: a model evaluation study. The Lancet Digital Health, 6(1):e12–e22.
- Zampieri et al. (2023) Marcos Zampieri, Sara Rosenthal, Preslav Nakov, Alphaeus Dmonte, and Tharindu Ranasinghe. 2023. Offenseval 2023: Offensive language identification in the age of large language models. Natural Language Engineering, 29(6):1416–1435.
- Zhu et al. (2023) Yiming Zhu, Peixian Zhang, Ehsan-Ul Haq, Pan Hui, and Gareth Tyson. 2023. Can chatgpt reproduce human-generated labels? a study of social computing tasks. arXiv preprint arXiv:2304.10145.
- Ziems et al. (2024) Caleb Ziems, William Held, Omar Shaikh, Jiaao Chen, Zhehao Zhang, and Diyi Yang. 2024. Can large language models transform computational social science? Computational Linguistics, pages 1–55.
Appendix A Dataset Details and Demographic Distribution
Here, we provided a more detailed summary of the 5 different datasets used in this work.
The “Annotator with Attitudes” (AwA) dataset Sap et al. (2021) curates a dataset on potentially offensive content targeting Black people. We use their Breadth-of-Posts dataset, which contains 626 posts annotated by 177 annotators, totaling 3,349 annotations from different genders, ethnicities, and political backgrounds. Annotators were asked to rate how much they perceived each post as toxic, hateful, disrespectful, or offensive on a 5-point Likert scale, ranging from 1 (not at all) to 5 (very much so). To remain consistent across datasets, we use the annotators’ gender and ethnicity as demographic variables.
UC Berkeley’s Measuring Hate Speech Corpus (MHSC) (Kennedy et al., 2020) contains 90,174 annotations from 7,725 annotators on 39,263 online comments. The metric used for comparison was the “hatespeech” ordinal label of each comment measuring the identified severity on a three-level scale: yes, no, and unclear.
We used the NLPositionality (NLPos) dataset Santy et al. (2023), which was originally used for the hate speech detection task in their paper. This dataset contains annotations from 412 annotators on 299 posts, totaling 4,417 annotations. Annotators were asked to evaluate an instance using a 3-point scale.
The POPQUORN dataset (Pei and Jurgens, 2023) (POPQ) contains 12,088 annotations on 1,500 online comments from 243 annotators from a sample of the US adult population that was representative based on age, gender, and ethnicity. Annotators were asked to provide an offensiveness score of each text sample on a 1-5 scale, from “Not offensive at all” to “Very offensive”, gathered from annotators through a multiple-choice task.
The Social Bias Inference Corpus (Sap et al., 2020), referred to as SBIC, contains 109,349 annotations on 44,232 online posts from 280 annotators. The dataset is acknowledged by its creators to be racially skewed, with a vast majority of annotators being White and nearly none being both Black and male. Annotators were asked to evaluate whether each post could be considered offensive, disrespectful, or toxic to anyone/someone, with the following valid response options: 1 (Yes, this could be offensive), 2 (Maybe, I’m not sure), 3 (No, this is harmless), and 4 (I don’t understand the post).
Naturally, a major factor determining the subjective offensiveness of a particular statement is the group or individual targeted by said statement. Therefore, we reasoned that demographic factors most frequently targeted by offensive statements were likely to have major effects on the perception of offensiveness, providing valuable insights in determining potential alignment. Considering available annotator data regarding targeted groups, it became clear that ethnicity and gender were the two most significant factors represented in targeted language. 11.7% and 7.6% of SBIC annotations noted targeted language towards Black folks and women respectively - figures around twice those corresponding to any other group. In MHSC, 35.7% of annotations indicated offensive language targeting a racial group and 29.8% targeted a gender, with 20.6% targeting women and 16.9% targeting Black people specifically. In contrast, age groups were targeted to a much lesser degree (1.5% of Hate Speech annotations), displaying less evidence supporting its status as a largely influential factor. Overall, offensive language was shown to target racial and gender demographic groups, specifically Black people and women, indicating a high likelihood that annotator ethnicity and gender would have significant influences on the variable perception of offensive statements.
Appendix B Majority Results
In this section, we present the results using the majority vote aggregation method to calculate the ground truth (e.g., offensiveness level).
RQ0: Figure 4 shows that the performance of language models on the subjective task of offensive language annotation aligns closely with the average performance of human annotators. This trend mirrors the pattern observed when the ground truth was calculated using rounded averages. Specifically, the correlations for GPT-4o mini range from to , while Gemini 1.5 Flash achieves correlations ranging from to .
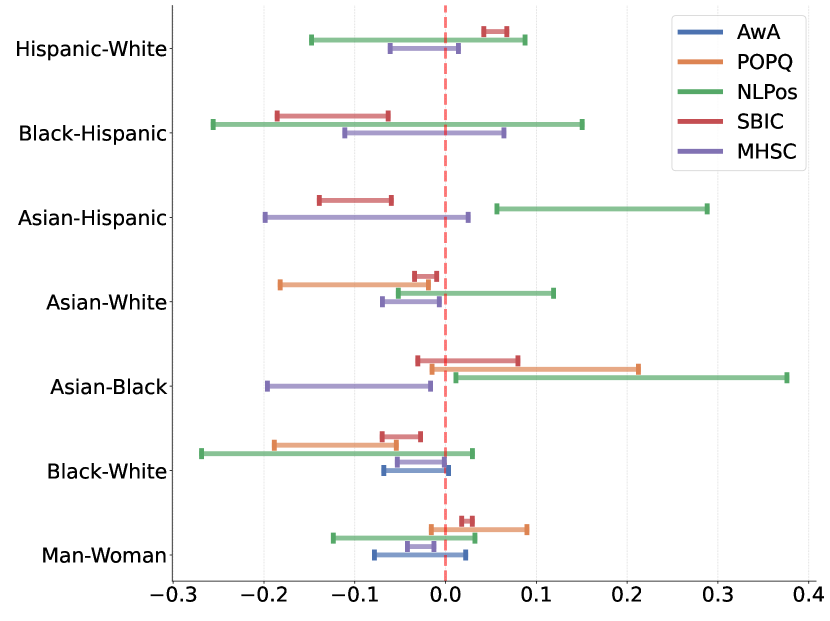
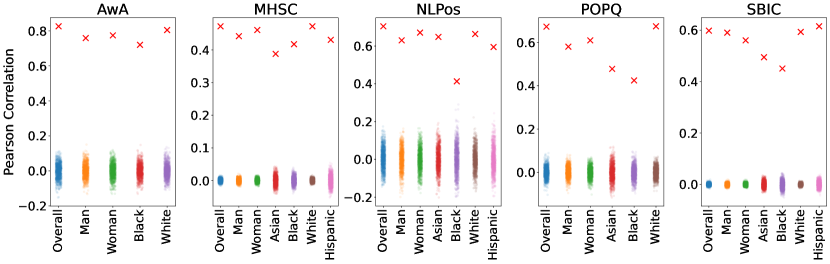
RQ1: Figure 5 presents the correlation values between LLM labels and the labels of annotators from each demographic group when using the majority vote aggregation method. The patterns observed largely align with those reported for the rounded average aggregation. For gender, in most datasets, both GPT-4o and Gemini align more closely with annotations from women. However, in addition to the SBIC database, we observe that in the POPQ dataset for the Gemini model, the correlation for men () is also slightly higher than for women (). For ethnicity, the majority vote results similarly show that model annotations often align better with the White demographic across datasets with some exceptions. For example, consistent with the rounded average results, in the SBIC dataset, models align better with the Hispanic demographic. In the NLPos dataset, we observe a reversal: Asian annotators achieve higher correlations compared to the White demographic ( vs. for GPT-4o mini, and vs. for Gemini 1.5 Flash). Additionally, in the AwA dataset, Gemini shows a slightly higher correlation with the Black demographic () compared to the White demographic (). As in the rounded average case, we assess the robustness of these differences using Steiger’s test and bootstrapping. Figure 6 indicate the same inconsistency patterns across demographic groups. For example, in the Gemini model, even the Black-White correlation differences show sign reversals at the tails of the 95% confidence intervals for the AwA and NLPos datasets. Overall, Table 5 highlights that, while correlation values between models and demographic groups are statistically significant, the observed differences as evident in Table 7 are inconsistent. This inconsistency suggests that demographic identity alone does not consistently account for variations in model alignment, reaffirming the influence of other factors such as dataset composition or individual interpretation.

| Demo. | Model | AwA | MHSC | NLPos | POPQ | SBIC | |||||
|---|---|---|---|---|---|---|---|---|---|---|---|
| Corr. | 95% CI | Corr. | 95% CI | Corr. | 95% CI | Corr. | 95% CI | Corr. | 95% CI | ||
| Overall | GPT | ||||||||||
| Gemini | |||||||||||
| Man | GPT | ||||||||||
| Gemini | |||||||||||
| Woman | GPT | ||||||||||
| Gemini | |||||||||||
| Asian | GPT | – | – | ||||||||
| Gemini | – | – | |||||||||
| Black | GPT | ||||||||||
| Gemini | |||||||||||
| Hispanic | GPT | – | – | – | – | ||||||
| Gemini | – | – | – | – | |||||||
| White | GPT | ||||||||||
| Gemini | |||||||||||
| Demo. Pair | Model | AwA | MHSC | NLPos | POPQ | SBIC |
|---|---|---|---|---|---|---|
| Asian - Black | GPT | – | (-0.18, -0.01)∗∗ | (0.09, 0.38)∗∗ | (0.03, 0.23)∗∗ | (0.04, 0.16)∗∗ |
| Gemini | – | (-0.18, -0.01)∗ | (0.08, 0.39)∗∗ | (0.00, 0.19)∗ | (-0.02, 0.09) | |
| Asian - Hispanic | GPT | – | (-0.16, 0.03) | (-0.01, 0.20) | – | (-0.12, -0.03)∗∗ |
| Gemini | – | (-0.19, 0.03) | (0.03, 0.26)∗∗ | – | (-0.14, -0.06)∗∗ | |
| Asian - White | GPT | – | (-0.11, -0.05)∗∗∗ | (-0.10, 0.06) | (-0.27, -0.14)∗∗∗ | (-0.07, -0.05)∗∗∗ |
| Gemini | – | (-0.09, -0.02)∗∗∗ | (-0.15, 0.02) | (-0.26, -0.13)∗∗∗ | (-0.08, -0.05)∗∗∗ | |
| Black - Hispanic | GPT | – | (-0.11, 0.05) | (-0.36, -0.02)∗ | – | (-0.25, -0.12)∗∗∗ |
| Gemini | – | (-0.12, 0.06) | (-0.34, 0.01) | – | (-0.19, -0.08)∗∗∗ | |
| Black - White | GPT | (-0.12, -0.05)∗∗∗ | (-0.09, -0.04)∗∗∗ | (-0.34, -0.09)∗∗ | (-0.29, -0.19)∗∗∗ | (-0.13, -0.09)∗∗∗ |
| Gemini | (-0.10, -0.01)∗∗ | (-0.08, -0.03)∗∗∗ | (-0.38, -0.10)∗∗∗ | (-0.29, -0.18)∗∗∗ | (-0.10, -0.06)∗∗∗ | |
| Hispanic - White | GPT | – | (-0.08, -0.01)∗∗ | (-0.15, 0.07) | – | (0.02, 0.04)∗∗∗ |
| Gemini | – | (-0.08, -0.01)∗ | (-0.23, -0.00)∗ | – | (0.02, 0.04)∗∗ | |
| Man - Woman | GPT | (-0.06, 0.02) | (-0.04, -0.01)∗∗∗ | (-0.11, 0.03) | (-0.07, 0.01) | (0.02, 0.03)∗∗∗ |
| Gemini | (-0.07, 0.01) | (-0.04, -0.01)∗∗∗ | (-0.13, 0.03) | (-0.07, 0.02) | (0.02, 0.03)∗∗∗ |
| Demo. Pair | Model | AwA | MHSC | NLPos | POPQ | SBIC |
|---|---|---|---|---|---|---|
| Asian - Black | GPT | – | (-0.18, -0.02)∗∗ | (0.06, 0.42)∗∗ | (0.00, 0.23) | (0.03, 0.16)∗∗ |
| Gemini | – | (-0.20, -0.02)∗ | (0.01, 0.38)∗ | (-0.01, 0.21) | (-0.03, 0.08) | |
| Asian - Hispanic | GPT | – | (-0.17, 0.05) | (-0.04, 0.20) | – | (-0.12, -0.04)∗∗ |
| Gemini | – | (-0.20, 0.02) | (0.06, 0.29)∗∗ | – | (-0.14, -0.06)∗∗ | |
| Asian - White | GPT | – | (-0.09, -0.03)∗∗∗ | (-0.09, 0.08) | (-0.16, 0.01) | (-0.03, -0.01)∗∗ |
| Gemini | – | (-0.07, -0.01)∗ | (-0.05, 0.12) | (-0.18, -0.02)∗ | (-0.03, -0.01)∗∗ | |
| Black - Hispanic | GPT | – | (-0.11, 0.05) | (-0.37, 0.03) | – | (-0.23, -0.11)∗∗∗ |
| Gemini | – | (-0.11, 0.06) | (-0.26, 0.15) | – | (-0.19, -0.06)∗∗ | |
| Black - White | GPT | (-0.07, 0.00)∗∗ | (-0.07, -0.02)∗∗∗ | (-0.31, -0.01)∗∗ | (-0.19, -0.03)∗∗ | (-0.10, -0.06)∗∗∗ |
| Gemini | (-0.07, 0.00)∗∗ | (-0.05, -0.00)∗ | (-0.27, 0.03) | (-0.19, -0.05)∗∗ | (-0.07, -0.03)∗∗ | |
| Hispanic - White | GPT | – | (-0.07, 0.00) | (-0.11, 0.12) | – | (0.04, 0.06)∗∗∗ |
| Gemini | – | (-0.06, 0.01) | (-0.15, 0.09) | – | (0.04, 0.07)∗∗∗ | |
| Man - Woman | GPT | (-0.06, 0.02) | (-0.04, -0.01)∗∗ | (-0.08, 0.07) | (-0.05, 0.07) | (0.02, 0.03)∗∗∗ |
| Gemini | (-0.08, 0.02)∗ | (-0.04, -0.01)∗∗∗ | (-0.12, 0.03) | (-0.02, 0.09) | (0.02, 0.03)∗∗∗ |
Appendix C Prompts
| Dataset | Prompt |
|---|---|
| AwA | How much could this post be seen as toxic/hateful/disrespectful or offensive to anyone, on a scale from 1 (not at all) to 5 (very much so)? Valid options: 1, 2, 3, 4, 5. Begin your response by selecting one of the valid options, then provide a concise explanation for your rating. |
| MHSC | Does this comment contain hate speech, defined as “bias-motivated, hostile and malicious language targeted at a person/group because of their actual or perceived innate characteristics, especially when the group is unnecessarily labeled (e.g., “jew bankers”, “nâĂŞ hooligans”).” The comment contains hate speech if slurs or derogatory language are used toward any person or group regardless of whether or not the target is a member of the slur-target group. (e.g. a comment calling Trump a faggot or a n***** still contains hate speech). Valid options are 1 (Yes), 2 (Unclear), 3 (No). Begin your response by mentioning one of the valid options, then provide a concise explanation for your rating. |
| NLPos | Do you think this post is hateful speech? Valid options are 1 (Yes), 2 (Not sure), 3 (No). Begin your response by mentioning one of the valid options, then provide a concise explanation for your rating. |
| POPQ | Consider you read the above comment on Reddit. How offensive do you think it is, on a scale from 1 (not offensive at all) to 5 (very offensive)? Valid options: 1, 2, 3, 4, 5. Begin your response by selecting one of the valid options, then provide a concise explanation for your rating. |
| SBIC | Could this post be considered offensive, disrespectful, or toxic to anyone/someone? Valid options are: 1 (Yes, this could be offensive), 2 (Maybe, I’m not sure), 3 (No, this is harmless), 4 (I don’t understand the post). Begin your response by mentioning one of the valid options, then provide a concise explanation for your rating. |