A spatially-resolved spectral analysis of giant radio galaxies with MeerKAT
Abstract
In this study we report spatially resolved, wideband spectral properties of three giant radio galaxies (GRGs) in the COSMOS field: MGTC J095959.63+024608.6 , MGTC J100016.84+015133.0 and MGTC J100022.85+031520.4. One such galaxy MGTC J100022.85+031520.4 is reported here for the first time with a projected linear size of 1.29 Mpc at a redshift of 0.1034. Unlike the other two, it is associated with a brightest cluster galaxy (BCG), making it one of the few GRGs known to inhabit cluster environments. We examine the spectral age distributions of the three GRGs using new MeerKAT UHF-band (544-1088 MHz) observations, and -band (900-1670 MHz) data from the MeerKAT International GHz Tiered Extragalactic Exploration (MIGHTEE) survey. We test two different models of spectral ageing, the Jaffe-Perola and Tribble models, using the Broadband Radio Astronomy Tools (brats) software which we find agree well with each other. We estimate the Tribble spectral age for MGTC J095959.63+024608.6 as 68 Myr, MGTC J100016.84+015133.0 as 47 Myr and MGTC J100022.85+031520.4 as 67 Myr. We find significant disagreements between these spectral age estimates and the estimates of the dynamical ages of these GRGs, modelled in cluster and group environments. Our results highlight the need for additional processes which are not accounted for in either the dynamic age or spectral age estimations.
keywords:
radio continuum: galaxies -galaxies: active –galaxies: evolution –galaxies: nuclei. – methods: observational1 Introduction
Giant radio galaxies (GRGs) display jets and lobes of sychrotron-emitting plasma that extend greater than 700 kpc in projected linear length, representing the most extended population of radio galaxies (Willis et al. 1974; Schoenmakers et al. 2000; Dabhade et al. 2023). Their extensive relativistic jets and lobes may play an important role in the evolution of their host galaxy and surrounding environment via ‘jet-mode’ active galactic nuclei (AGN) feedback (Bower et al., 2006; Croton et al., 2006; Fabian, 2012; Heckman & Best, 2014). In this mode of feedback, the AGN plasma jets travel through the inter-stellar medium (ISM), disturbing and heating the surrounding gas. This is thought to prevent gas cooling and stop accretion onto the super massive black hole (SMBH), halting its growth. In GRGs, since the jets are so large, this process extends further into the intergalactic and intercluster medium (IGM and ICM). Thus, GRGs could be ideal probes of the impact of AGN activity on the IGM and may provide insight into the nature of the environment itself. (Safouris et al., 2008, 2009; Malarecki et al., 2013, 2015)
The reason for the really large sizes of GRGs is still uncertain. An early suggestion was made by Mack et al. (1998) that the extended size of GRGs is due to the under-densities found within the IGM where the speed of the plasma is not as eroded by interactions with intervening matter. However, recent studies have reported that between 4-10% of identified GRGs reside within high-density cluster environments (Dabhade et al., 2020; Tang et al., 2020; Simonte et al., 2024). Another potential explanation for the occurrence of GRGs is that these galaxies contain abnormally powerful AGN engines which allow the jets to expand to large scales in short amounts of time (Gopal-Krishna et al., 1989). Counter to this, Komberg & Pashchenko (2009) and Hardcastle et al. (2019) found no evidence of the massive linear size of GRGs being due to particularly powerful central engines.
A more likely scenario then is that GRGs represent the oldest AGN systems, where the radio jets have had enough time to evolve and grow (Subrahmanyan et al., 1996). This scenario was previously thought to be implausible because the extrapolated number densities of GRGs as of 2021 were too low; only 820 had been identified compared to the hundreds of thousands of reported normal radio sources (Dabhade et al., 2020). However, recent work (e.g., Delhaize et al. 2021; Simonte et al. 2024; Oei et al. 2023; Mostert et al. 2024) suggests that the actual GRG sky density is significantly higher than indicated by previous studies. These works suggest that the surface brightness sensitivity of telescopes was actually the limiting factor, since these giants are often faint and diffuse. According to Simonte et al. (2024), who performed a large-scale study of the radio, optical, and infrared properties of GRGs compared to regular radio galaxies, age is the main factor determining a radio galaxy’s length. Given enough time for the galaxy to evolve, the other main factors in the late-stage size of a radio galaxy are the jet power, the host galaxy mass, and the large-scale environment.
If GRGs do represent the oldest AGN systems, then studying their extended structure is crucial to understanding the evolution of galaxies, their interactions, and their effect on the IGM. This is now becoming feasible, with the number of identified GRGs increasing dramatically in the last couple of years. The most notable of these is due to the second data release of the LOFAR Two-metre Sky Survey (LOTSS-DR2, Shimwell et al. 2022) and the work of Mostert et al. (2024), increasing the total number of identified GRGs in the literature to 12000.
Complementary to LOFAR, which operates at 144 MHz, the MeerKAT radio interferometer in South Africa (Jonas & MeerKAT Team, 2016) is an excellent instrument for the study of GRGs at higher frequencies ( 1 GHz). This is due to its excellent point source sensitivity, similar resolution capabilities, and excellent coverage. It can currently observe in three different bands: the UHF (544-1088 MHz) and (856-1670 MHz) bands, as well as the newly commissioned (1750-3500 MHz) band.
One of the Large Survey Projects underway with MeerKAT is the MeerKAT International GHz Tiered Extragalactic
Exploration (MIGHTEE) survey (Jarvis et al., 2016). MIGHTEE is a sensitive galaxy evolution survey over 20 deg2, targeting the fields CDFS, ELAIS-S1, -LSS and COSMOS in the and bands. -band continuum maps of part of the -LSS and COSMOS field have already been released to the public as part of the Early Science data release (ES) (Heywood et al., 2022). These maps are confusion limited at a rms value of 4.5 Jy beam-1 . Two GRGs MGTC J095959.63+024608.6 (hereafter GRG1) and MGTC J100016.84+015133.0 (hereafter GRG2) were discovered in the MIGHTEE-COSMOS field in the ES data release and presented by Delhaize et al. (2021).
If we wish to probe the physical processes underlying GRGs and their impact on the surrounding environment, we need to measure the timescales or ‘ages’ involved. One way to do this is by examining the radio continuum spectrum of the GRGs to determine their spectral ages. In general, the optically thin radio spectrum can be described by a power law where the slope is the spectral index. The spectral index of the radiation is dependent on the source of the radiation, the environment, the physical processes involved and the timescales over which they occur. At frequencies close to 1 GHz, the continuum emission is affected by synchrotron losses (Harwood et al., 2013), inverse Compton scattering (Blundell et al., 1999) and adiabatic losses (Blundell & Rawlings, 2000), though the effects of adiabatic losses are not well constrained.
If the spectrum is taken to be dominated by synchrotron emission processes, then the lifetime of an electron is inversely proportional to its energy and the perpendicular component of the magnetic field, i.e. . Thus, higher-energy electrons will lose their energy at a faster rate, which results in a ‘steeper’ spectrum in regions of older plasma (e.g. Blundell & Rawlings 2000; Harwood et al. 2015) . This allows an estimate of the spectral ages of the plasma, where age is defined as the time since the plasma was last injected with newly accelerated particles. Creating a spatially resolved spectral age map of a source allows us to see in detail the dynamics and evolution of the source and how it has interacted with the environment over time.
For normal sized radio galaxies, previous studies have found that steepens with increased linear size and that, except at high frequencies, the rest frame spectral indices have a stronger dependence on luminosity than redshift (Blundell et al., 1999; Dabhade et al., 2020). The spectral index is expected to steepen in the lobes away from the hotspot as electrons are accelerated at the jet termination shock. This trend is expected to extend to GRGs. Confirmation of this is an important aspect of this work, which serves as a pilot study for the spectral analysis of a larger sample of GRGs in MIGHTEE.
In this work, we combine MIGHTEE -band data with new MeerKAT UHF-band observations to investigate the activity and history of the diffuse emission in the jets of the MIGHTEE COSMOS GRGs via the use of spectral age models. Furthermore, a newly identified third GRG found within the UHF COSMOS region is also examined. In section 2 we discuss the data processing of the multi-band data and in sections 3 and 4.1 we discuss our analysis of our results. The conclusions of the analysis are summarized in section 5. Throughout this paper, we assume a CDM cosmology of = 67.8 km s-1Mpc-1, = 0.692 and = 0.308 (Planck Collaboration et al., 2016).
2 Data
For our spectral index analysis, we make use of MeerKAT observations of the COSMOS region in three frequency ranges centred on 632 MHz, 755 MHz and 1284 MHz. The 1.28 GHz data comes from -band continuum maps from MIGHTEE data release 1 (DR1; Hale et al., 2024). DR1 has an expanded survey area of 4 deg2 in the COSMOS region and an improved sensitivity (rms 3.5 Jy beam-1) compared to the Early Science release (1.6 deg2, rms 4.5 Jy beam-1). Two versions of the MIGHTEE DR1 images have been released, one maximising resolution and the other maximising sensitivity. We use the lower-resolution, higher-sensitivity DR1 image in this work. Full details of the observations and data processing are given by Heywood et al. (2022) and Hale et al. (2024).
The 632 MHz and 755 MHz-centred data comes from UHF band MeerKAT Open Time observations of COSMOS (ID: SCI-20210212-JD-01; PI: Delhaize), henceforth referred to as UHF-COSMOS. Details of these observations and the full-band reduction will be presented by Delhaize et al. (in prep). In this work, we only use the lower half of the UHF band (570-816 MHz). This was to ensure the highest signal-to-noise ratio of the diffuse GRG lobe emission, since most of this emission is seen mainly in the lower part of the band. We separate the measurement set (ms) file into two equal sub-bands, dubbed UHF Low and UHF Mid respectively. This provides more spectral points to improve the accuracy of spectral index fitting.
The two sub-bands were separated from the original ms file using the casa task mstransform and imaged independently using the Oxkat pipeline111https://github.com/IanHeywood/oxkat (Heywood, 2020) up to and including cleaning and self calibration (2GC). Since the 2GC calibration is sufficient, it is unnecessary to apply direction-dependent calibration (3GC). The primary and secondary calibrators are J0408-6545 and J1008+0730 respectively. Images are made with wsclean using a Briggs-weighting robust parameter of -0.5 and a pixel size of 2 arcsec to match the resolution parameters of the MIGHTEE -band image as closely as possible. The images are truncated at the 30% primary beam power level. We also apply an inner cut to the plane at 87m. This corresponds to the shortest MeerKAT baseline at the lowest -band frequency of 856 MHz to ensure that the coverage was as similar as possible in each frequency band of our analysis.
The main properties of the MIGHTEE and UHF-COSMOS data are summarised in Table 1. The and UHF band images are confusion limited, with the UHF observations reaching rms noise sensitivities of approximately 9.2 Jy beam-1 and 14.6 Jy beam-1 for UHF Low and Mid respectively. The beam size of the lower frequency UHF images are larger ( arcsec) compared to the -band ( arcsec).
GRG3 (see section 3.1) is entirely within the 30% primary beam cut of the UHF-COSMOS images. However, only part of the source is within the MIGHTEE DR1 region due to the smaller field of view in the -band and the conservative primary beam cut at the edges of the mosaic. We therefore re-imaged the MIGHTEE observations of a single pointing centred on 100028.6, +2∘33′33.8′′ (see the appendix of Hale et al., 2024) with a primary beam cut at the 30% power level. The resulting image, which we will refer to as COSMOS8, fully encompasses all emission associated with GRG3. However, it has a slightly poorer sensitivity (rms 5.1 Jy beam-1) compared to the full mosaic since it only contains data from a single 8-hour track.
| (1) | (2) | (3) | (4) | (5) |
|---|---|---|---|---|
| Name | Frequency Range | Resolution | RMS noise level | |
| (MHz) | (MHz) | (arcsec2) | (Jy beam-1) | |
| MIGHTEE -band | 900-1670 | 1284 | 8.90 8.90 | 3.5 |
| COSMOS8 -band | 900-1670 | 1284 | 8.69 6.69 | 5.1 |
| UHF Mid | 693-816 | 755 | 11.70 11.70 | 9.2 |
| UHF Low | 570-692 | 632 | 14.08 14.08 | 14.6 |
3 Results
3.1 Characterising the GRGs
As mentioned in section 1, GRG1 and GRG2 were first identified as GRGs in the MIGHTEE Early Science images (Delhaize et al., 2021). These galaxies had been previously classified as extended, multiple-component radio galaxies, since the core and inner parts of the jets had been detected in previous surveys (most recently the VLA at 3 GHz; Vardoulaki et al. 2015; Smolčić et al. 2017; Vardoulaki et al. 2019). However, due to brightness sensitivity limits, the most extended, diffuse and faint emission of the lobes had remained undetected until the availability of MeerKAT observations, and so these objects were not identified as giants. GRG1 and GRG2 are both low excitation radio galaxies (LERGs) hosted by red and quenched ellipticals. For further details on GRG1 and GRG2, see Delhaize et al. (2021).
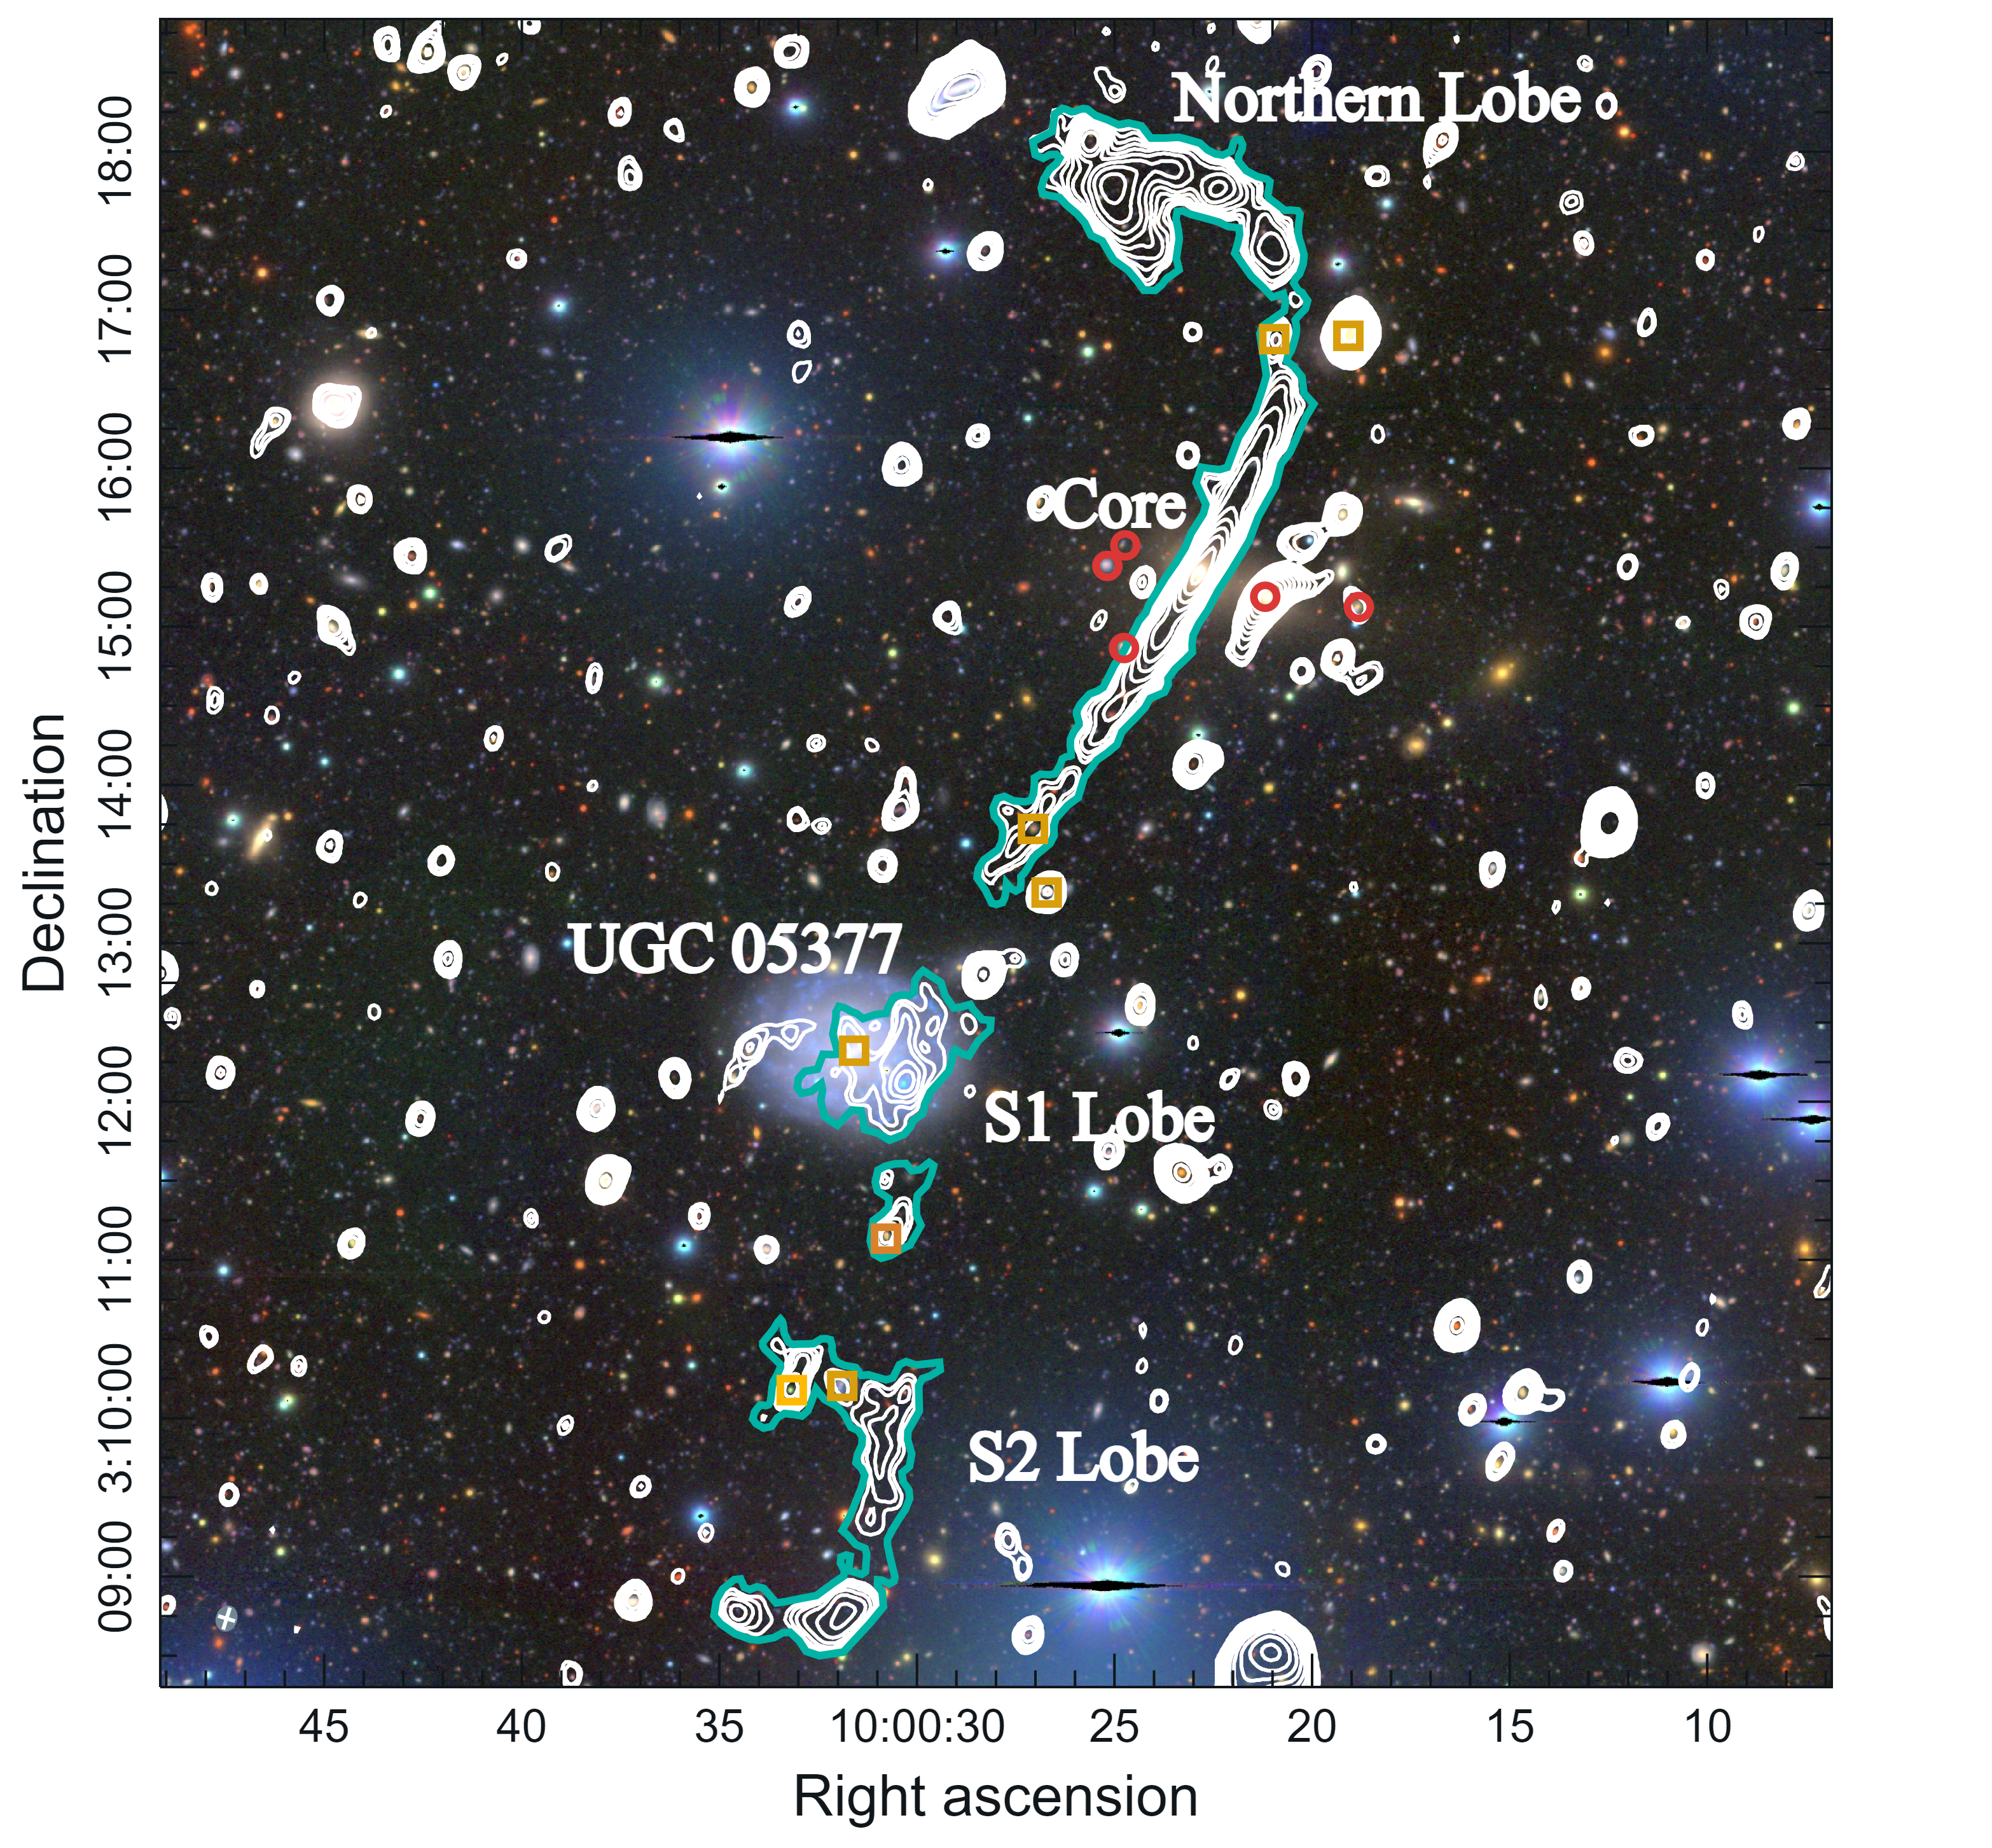
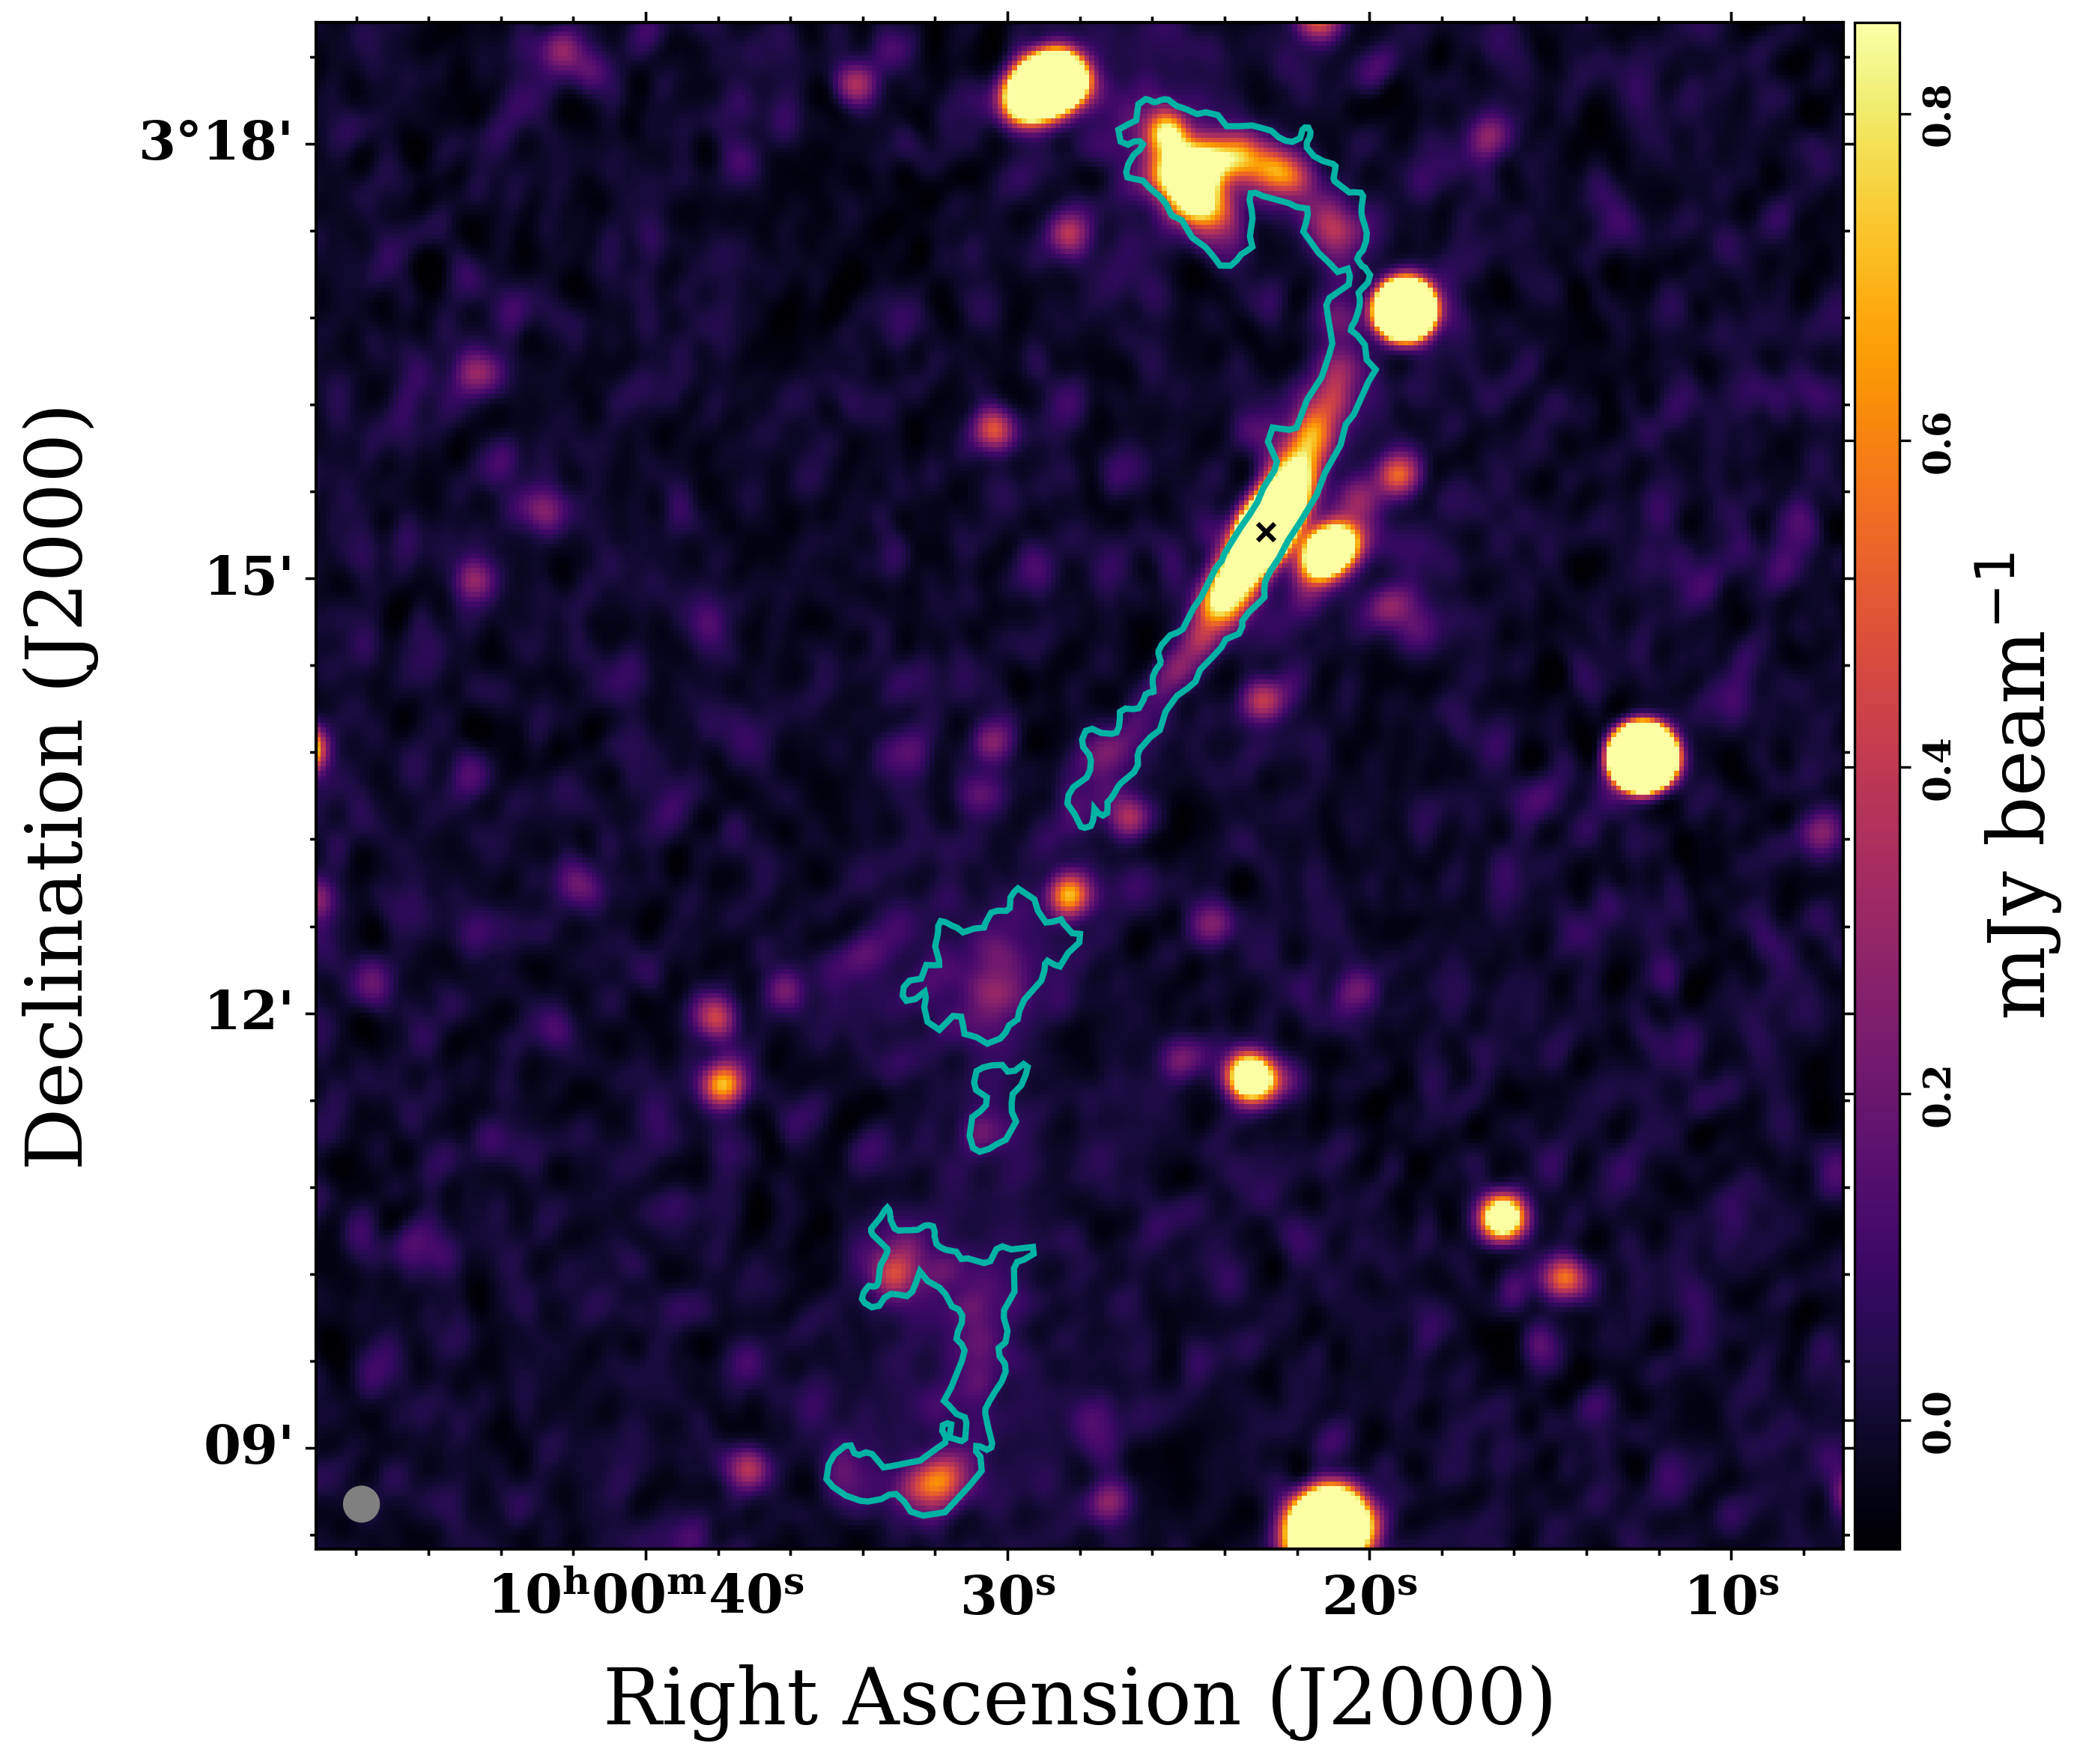
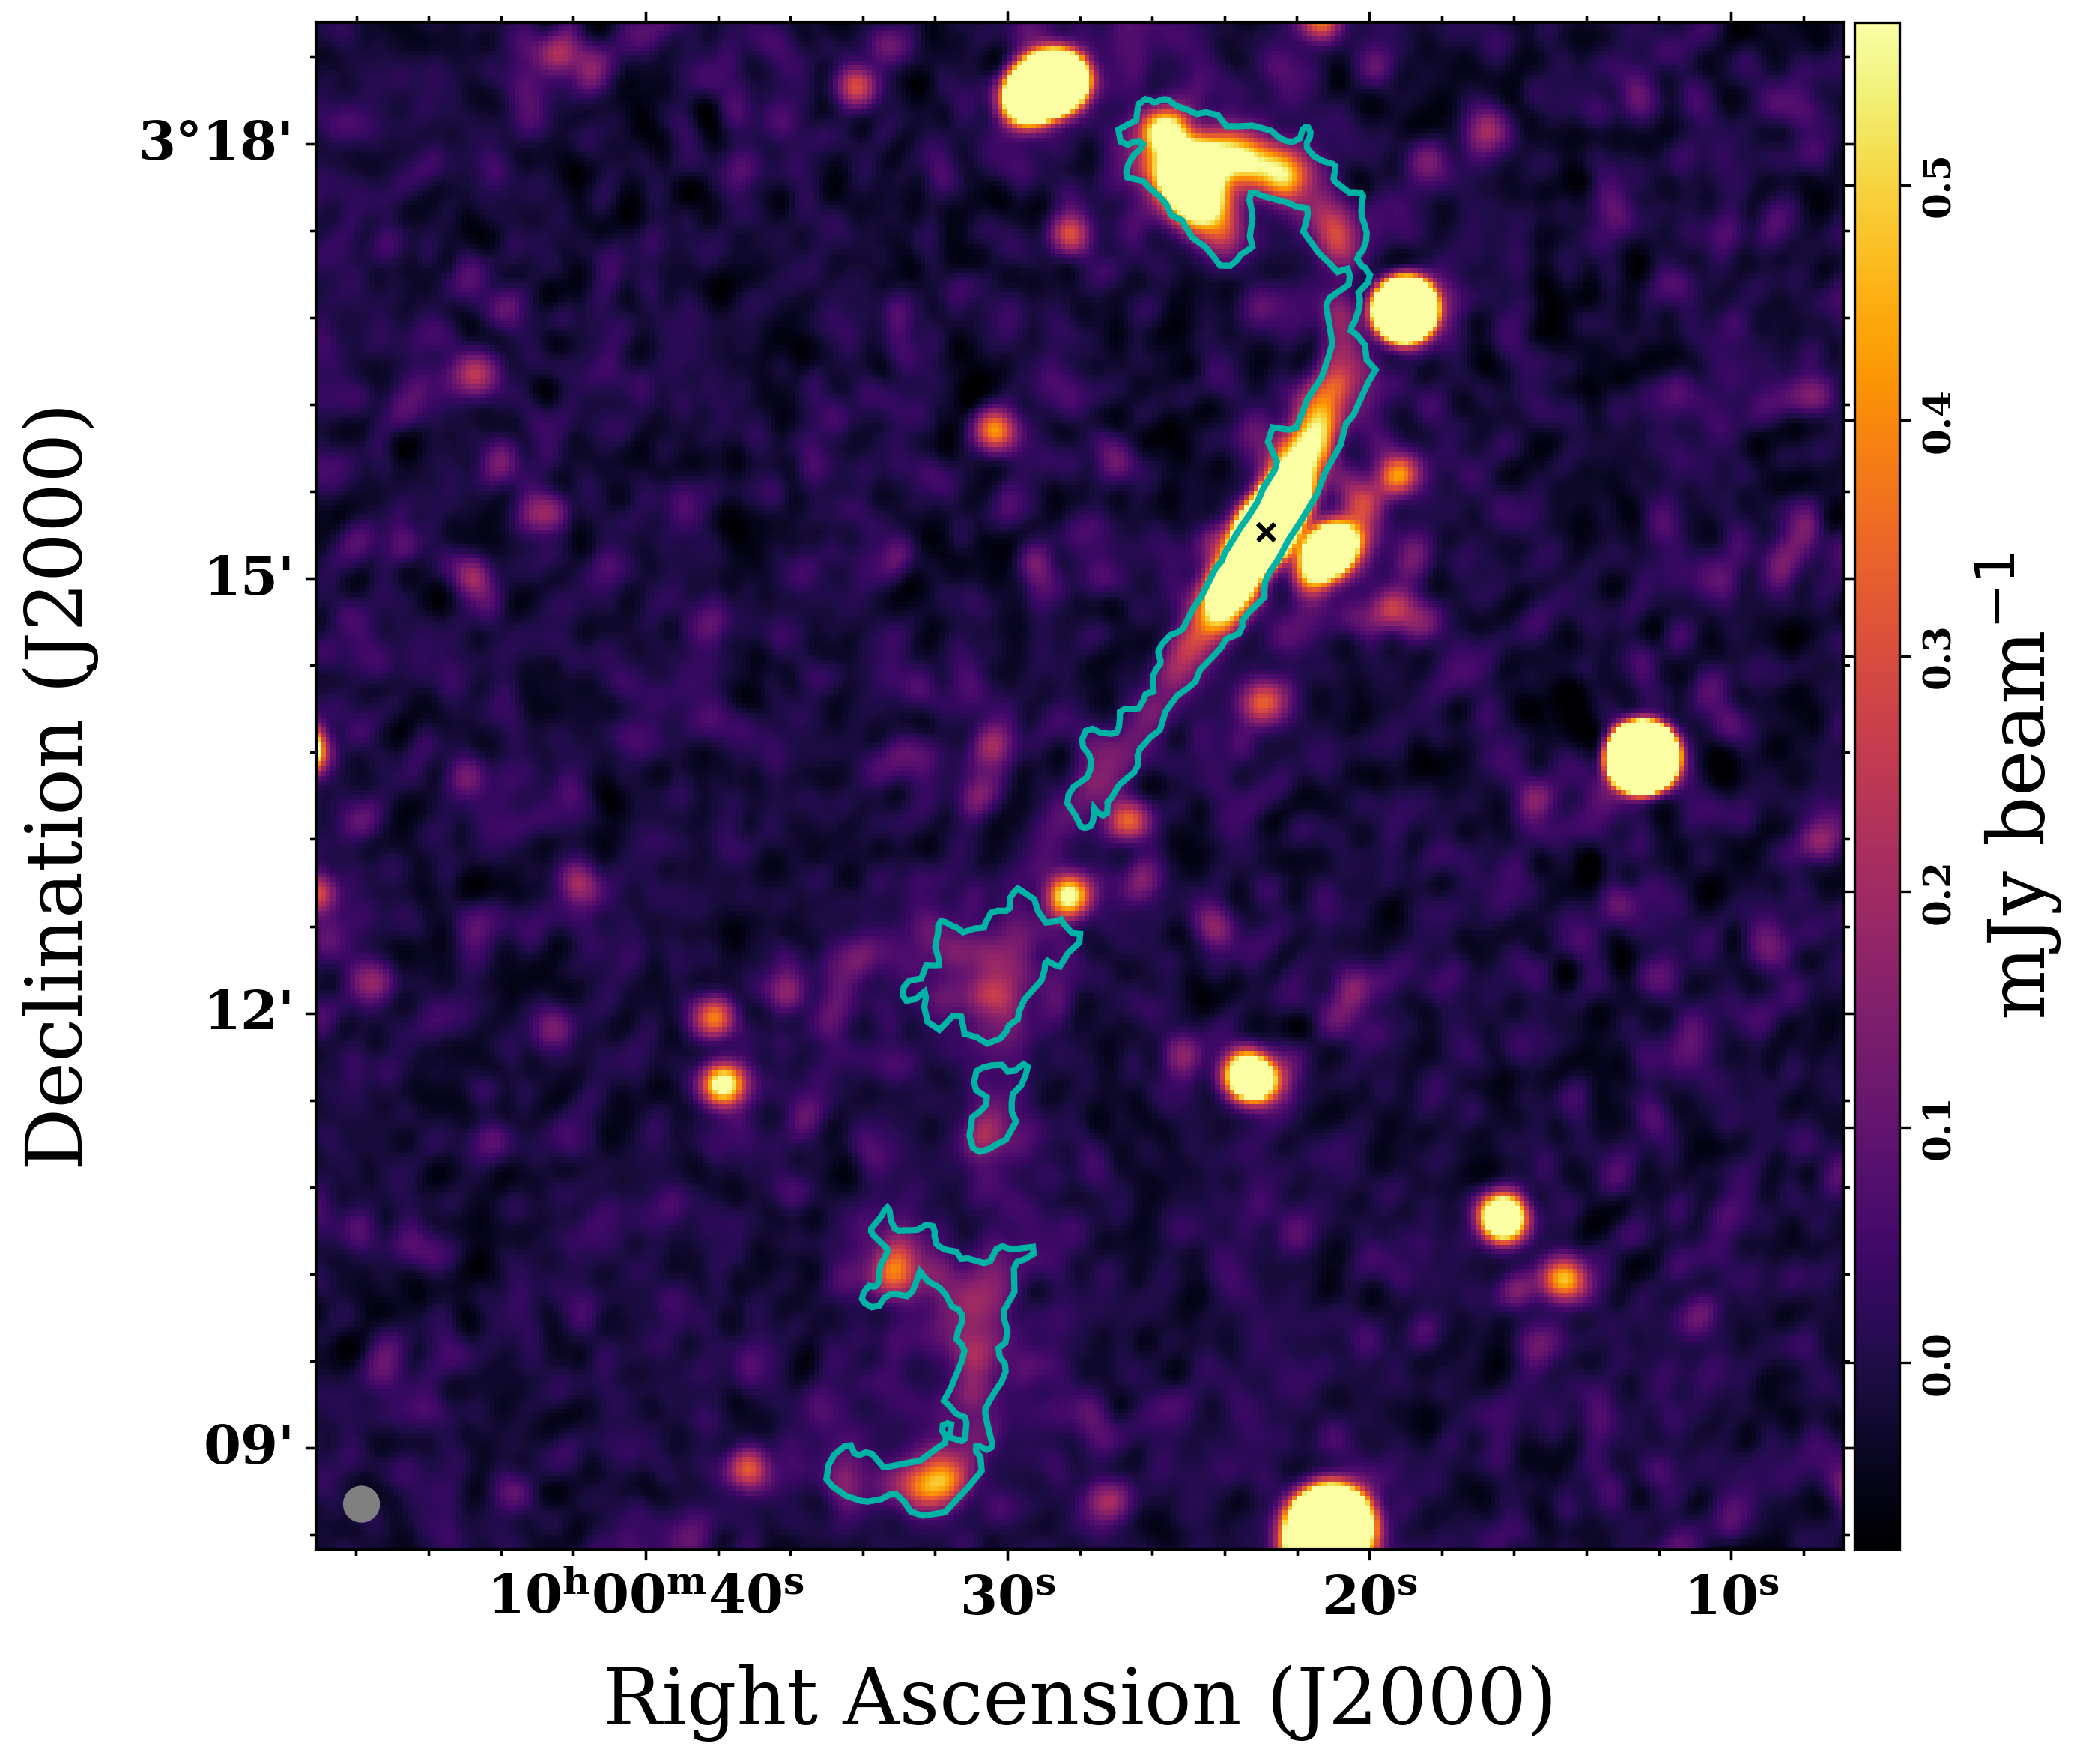
We present here a third GRG in the COSMOS field for the first time. It was discovered via visual inspection in the UHF-COSMOS continuum map using a process similar to that described by Prescott et al. (2018). An optical Hyper Suprime-Cam (HSC; Aihara et al., 2018) image of the host galaxy222CDS HiPS2FITS service https://alasky.cds.unistra.fr/h is shown in Figure 1, with MIGHTEE -band radio contours overlaid. GRG3 does not display typical Fanaroff-Riley-I/II (FRI/FRII; Fanaroff & Riley 1974) radio morphology. It is centre-brightened and contains a potential hot or warm spot in the northern lobe of the galaxy. With the centre brightening, it is more likely a plumed FRI galaxy, similar to 3C 31 (Laing et al., 2008).
The radio core is located at R.A. = 100022.85 and Dec = +03∘15′20.4′′ and coincides with the known optical galaxy SDSS J100022.85+031520.4. According to the Sloan Digital Sky Survey Data Release 13 (SDSS DR13; Albareti et al., 2017) the galaxy has a spectroscopic redshift of = 0.10344 0.00002. Notably, it is the central galaxy and brightest cluster galaxy (BCG) in the cluster WHL J100022.9+031521 (Wen et al., 2012), which places it amongst 4% of GRGs residing in clusters according to Simonte et al. (2024). Its location at the centre of the cluster and bent morphology in the top lobe may lead it to have similar properties to wide-angle-tail (WAT) galaxies (Burns, 1990). The host’s cluster is poor, with only ten n200 cluster members, where is the number of cluster members that occupy a region that has a density of 200 times the critical density of the universe. The total mass in the same region is (see section 4.2). The closest cluster member is WISEA J100021.13+031511.3 (from the ALLWISE source catalogue), with a redshift of = 0.1024 and an angular separation from GRG3 of 0.45 arcminutes.
Several foreground galaxies overlap with the radio contours of GRG3, as seen in Figure 1. The northern part of the lower lobe (S1 lobe) overlaps with the star-forming galaxy UGC 05377 ( = 0.007175 ± 1.33; Schneider et al. 1990). However, the radio contours in this region are not centred on UGC 05377, implying that at least some fraction of the emission is not due to that galaxy and is likely associated with the GRG. We do not exclude this region from our analysis since spatially-resolved spectral modelling is performed on a pixel-by-pixel basis, so contamination by star-formation in this area will not affect our calculations along the rest of the GRG. It is assumed that the diffuse lower lobe (S2 lobe) centred at 100032 +3∘10′00′′ is related to GRG3 due to the configuration of the emission. There is a potential source located at 100033, 3∘10′12′′, which we assume to be a star as it is listed as such in the SDSS DR6 catalogue (Adelman-McCarthy et al., 2008), and there is no counterpart in the HSC catalogue. As with UGC 05377, we include this region in our analysis with the caveat that it might contain contaminating emission not associated with the GRG.
With these assumptions, the total projected angular size of the radio galaxy measured between the outer edges of the northern lobe and the S2 lobe is 12.0 arcmin. This gives it a projected linear size of 1.29 Mpc, establishing it as a GRG. Even if the entirety of the southern lobe is discounted, the remaining extent between the northern lobe and the southern part of the inner jet has a projected length slightly above 700 kpc and the source would still be classified as a GRG. The cyan contour in Figure 1 encompasses all emission we consider to be associated with the GRG.
| (1) | (2) | (3) | (4) | (5) | (6) |
|---|---|---|---|---|---|
| Name | R.A. | Dec | |||
| (J2000) | (J2000) | (arcmin) | (Mpc) | ||
| MGTC J095959.63+024608.6 (GRG1) | 095959.63 | +02∘46′08.6′′ | 0.1656 | 13.8 | 2.42 |
| MGTC J100016.84+015133.0 (GRG2) | 100016.84 | +01∘51′33.0′′ | 0.3363 | 6.8 | 2.04 |
| MGTC J100022.85+031520.4 (GRG3) | 100022.85 | +03∘15′20.4′′ | 0.1034 | 12.0 | 1.29 |
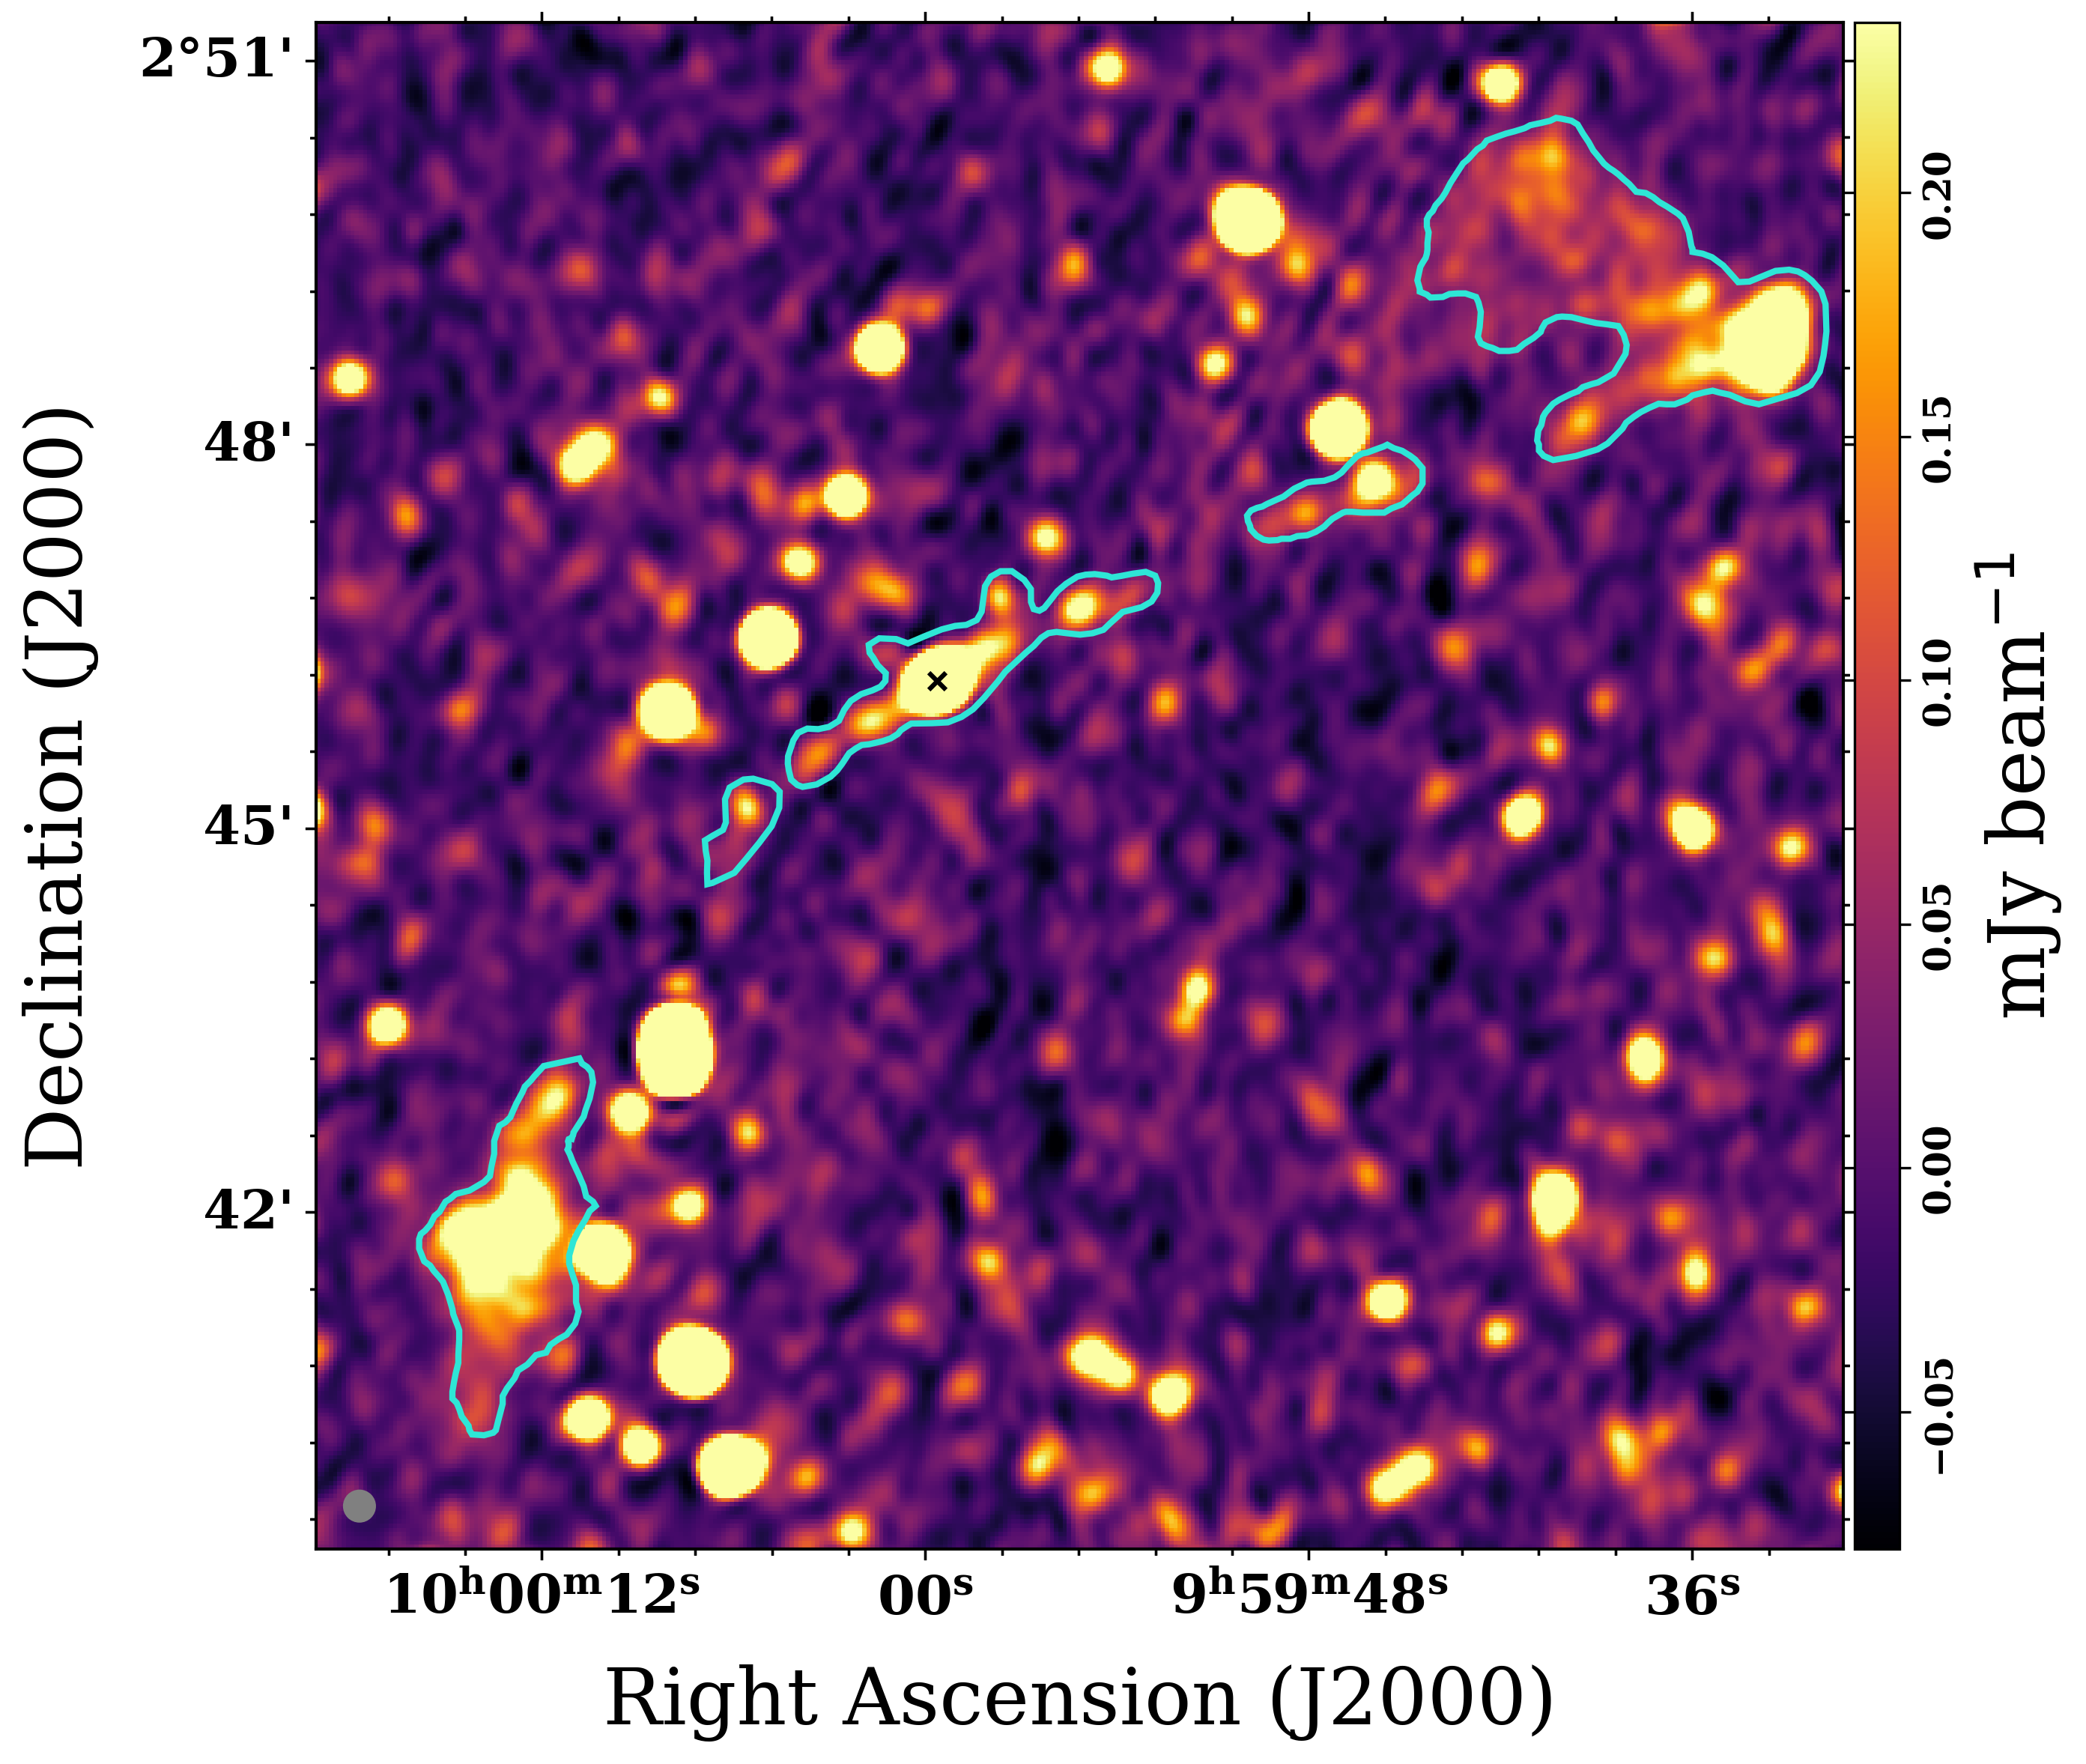
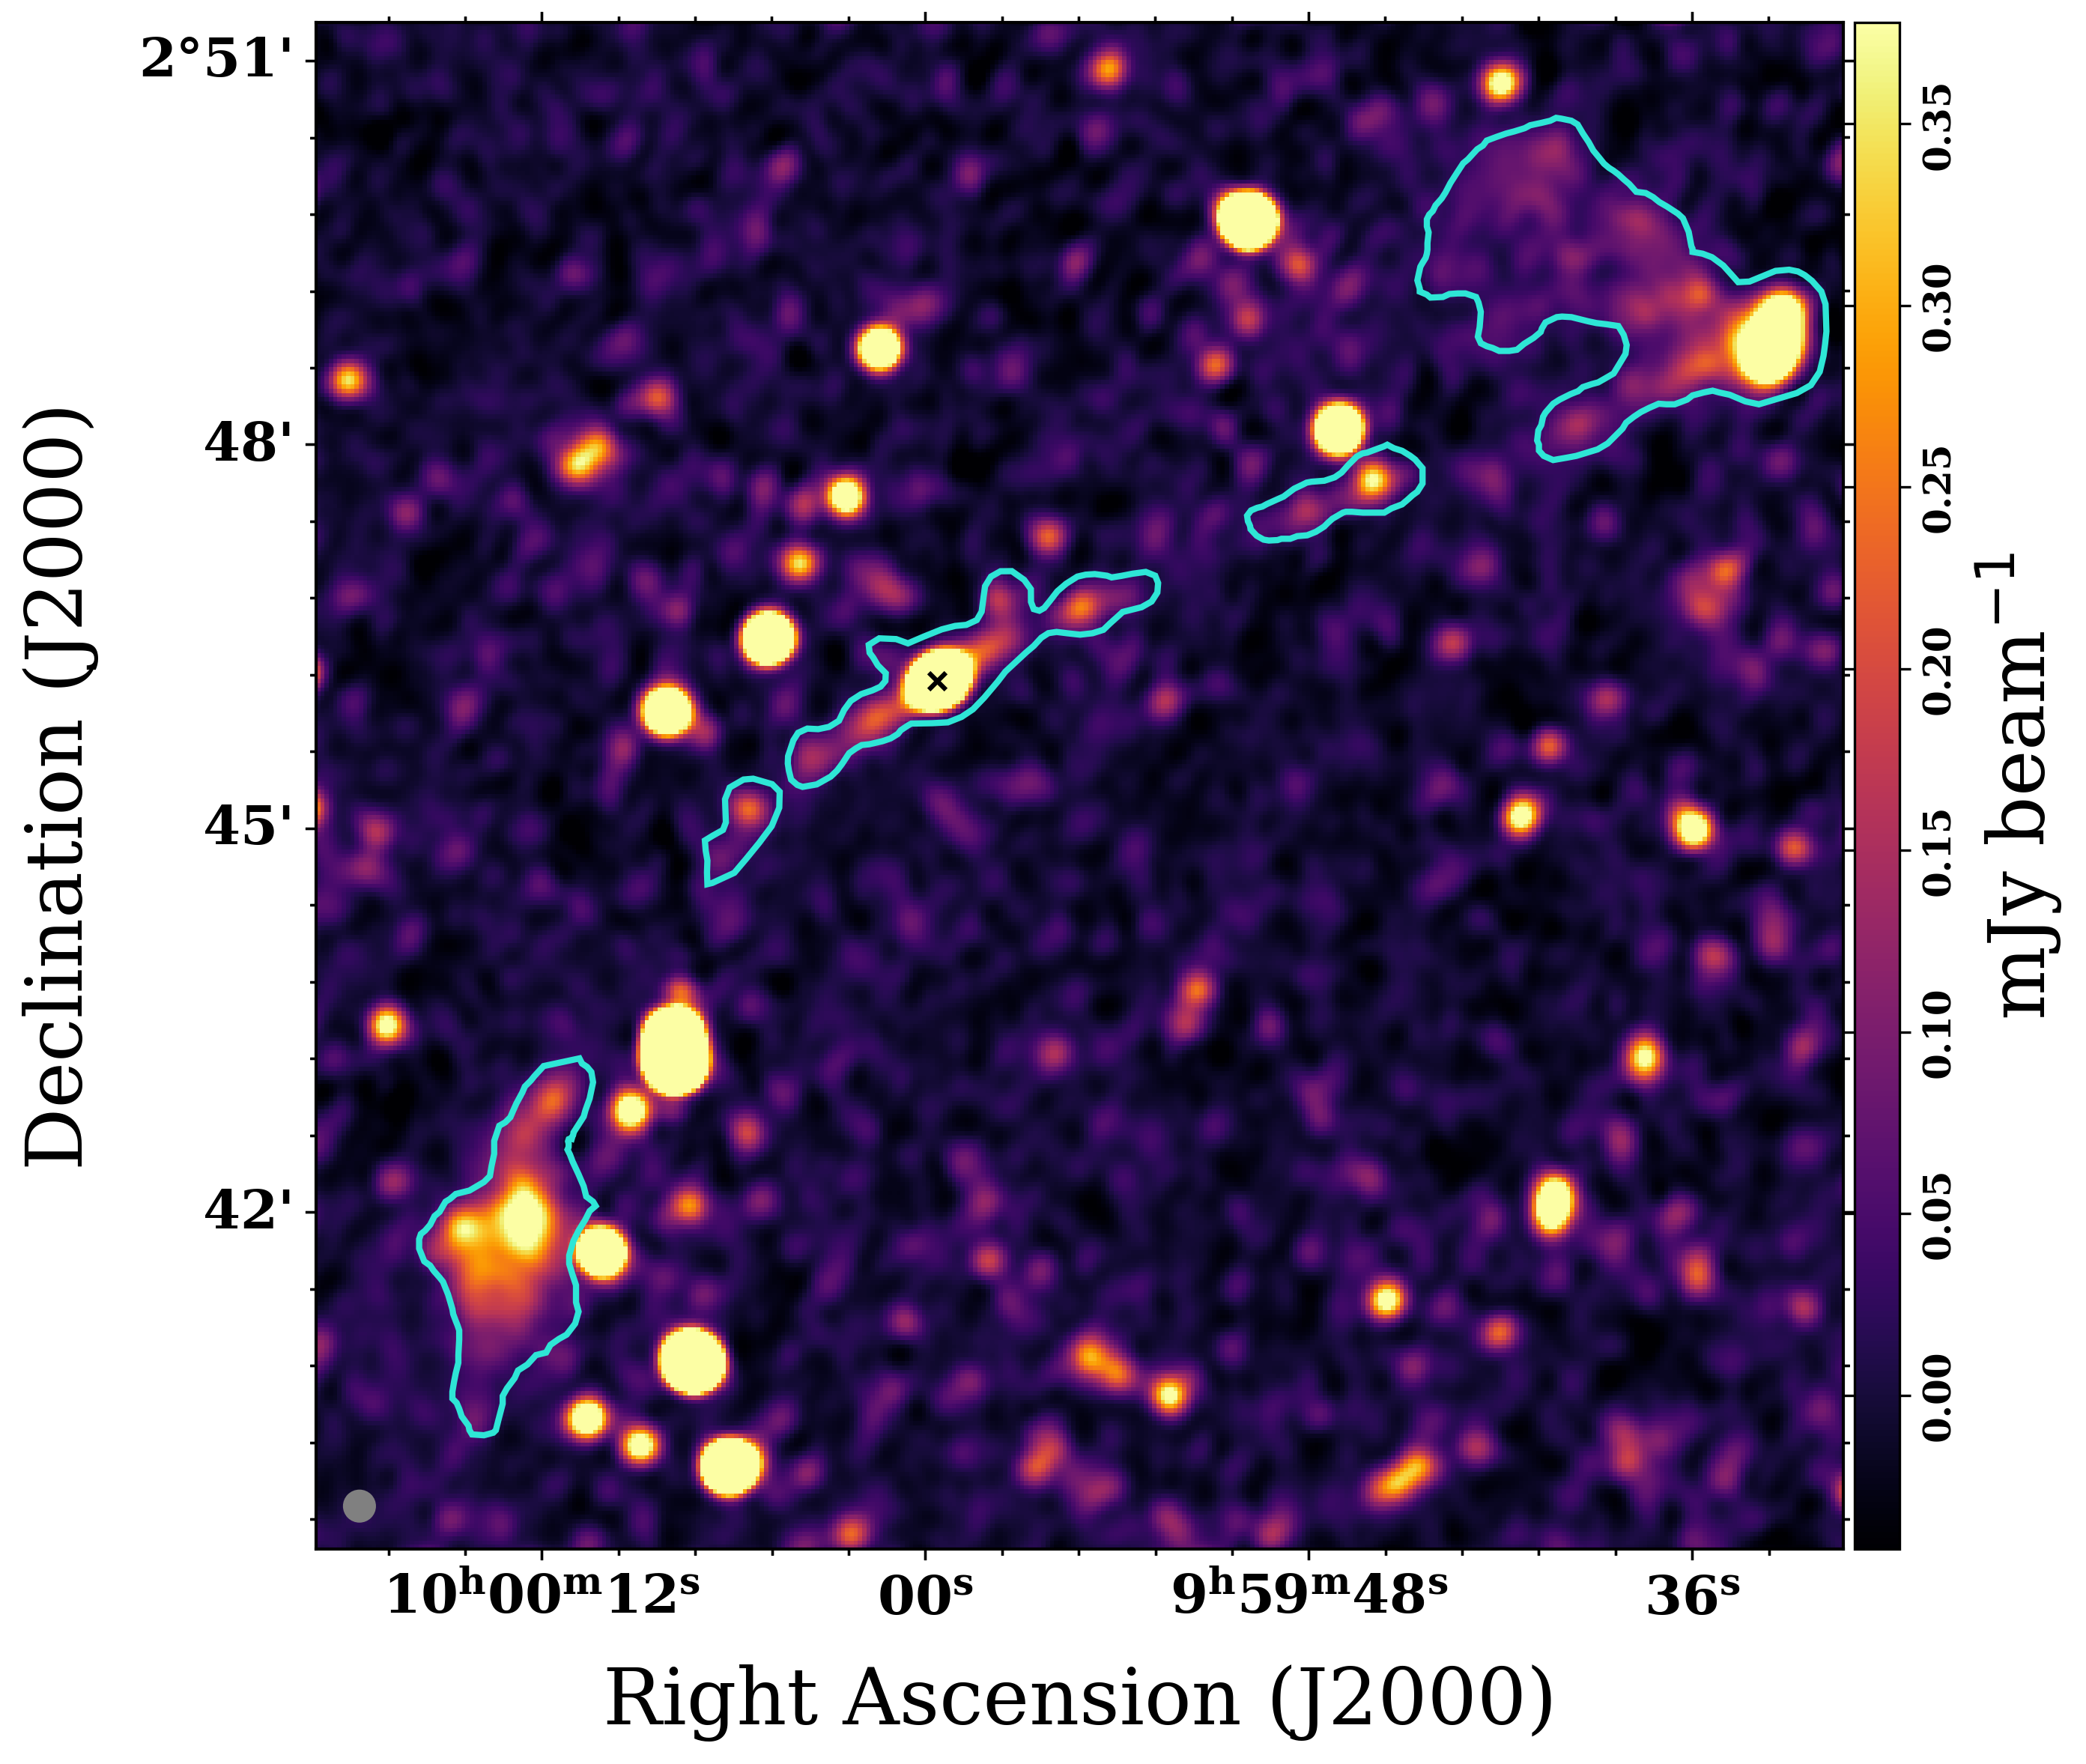
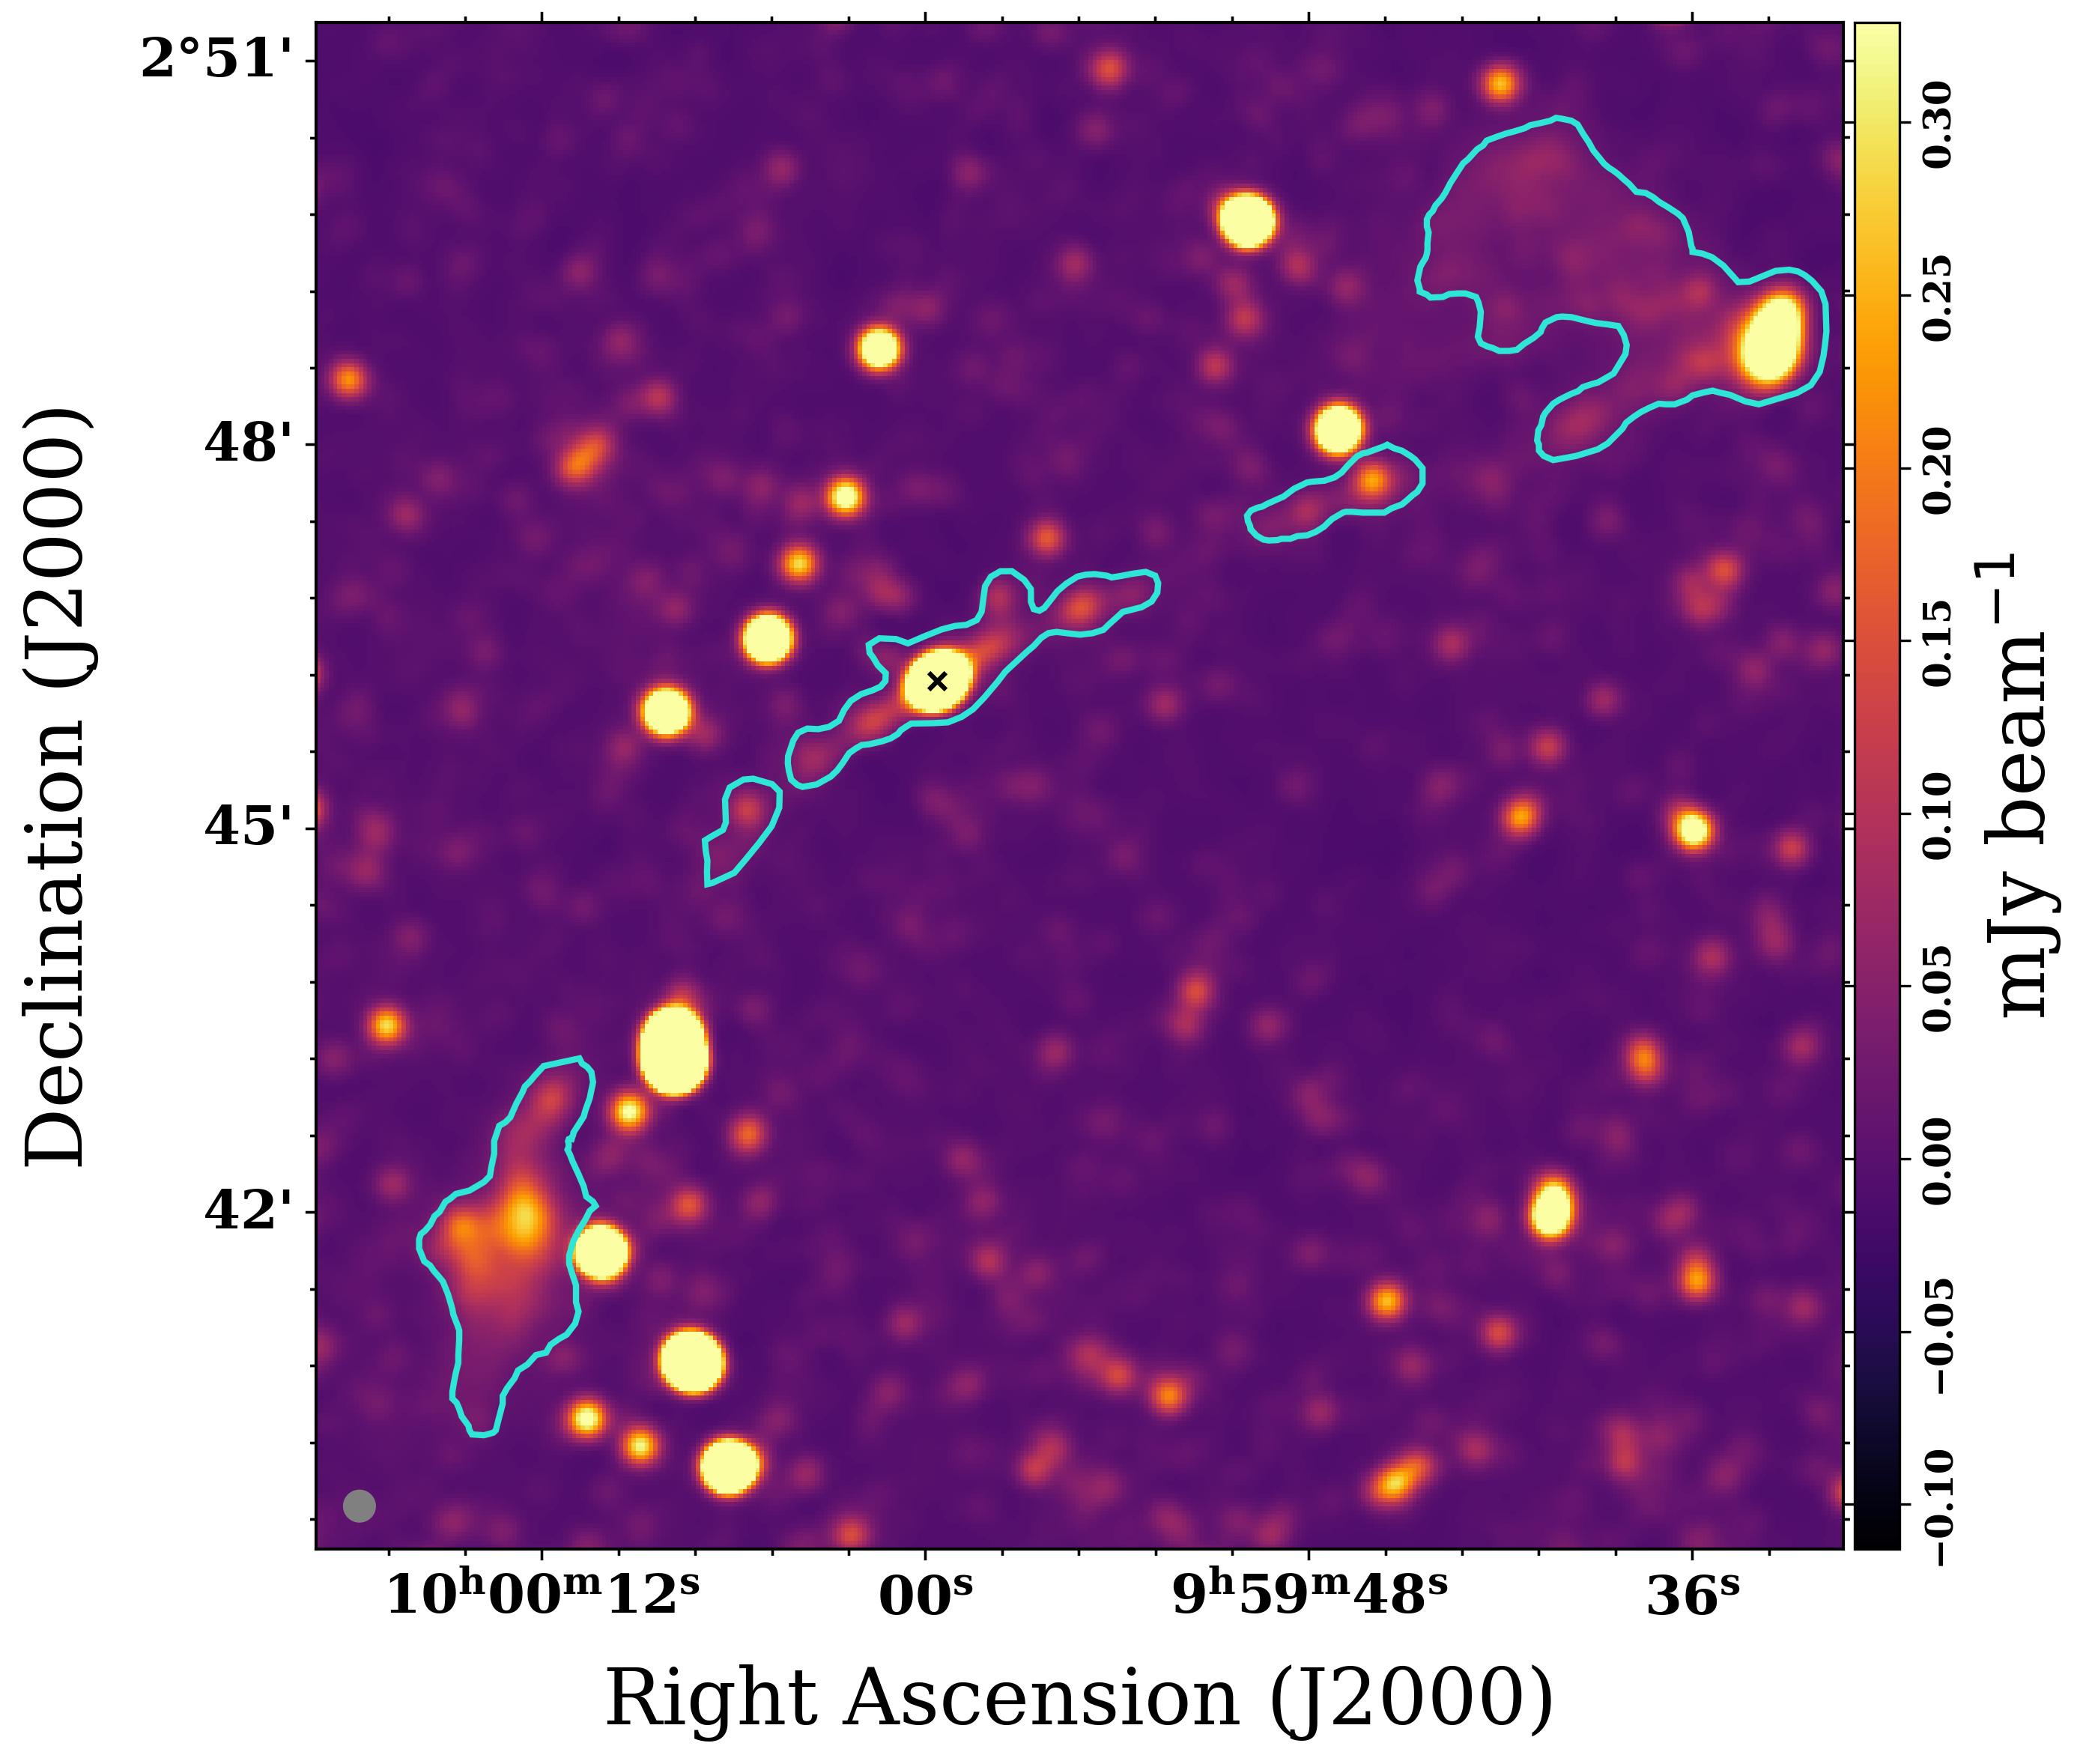
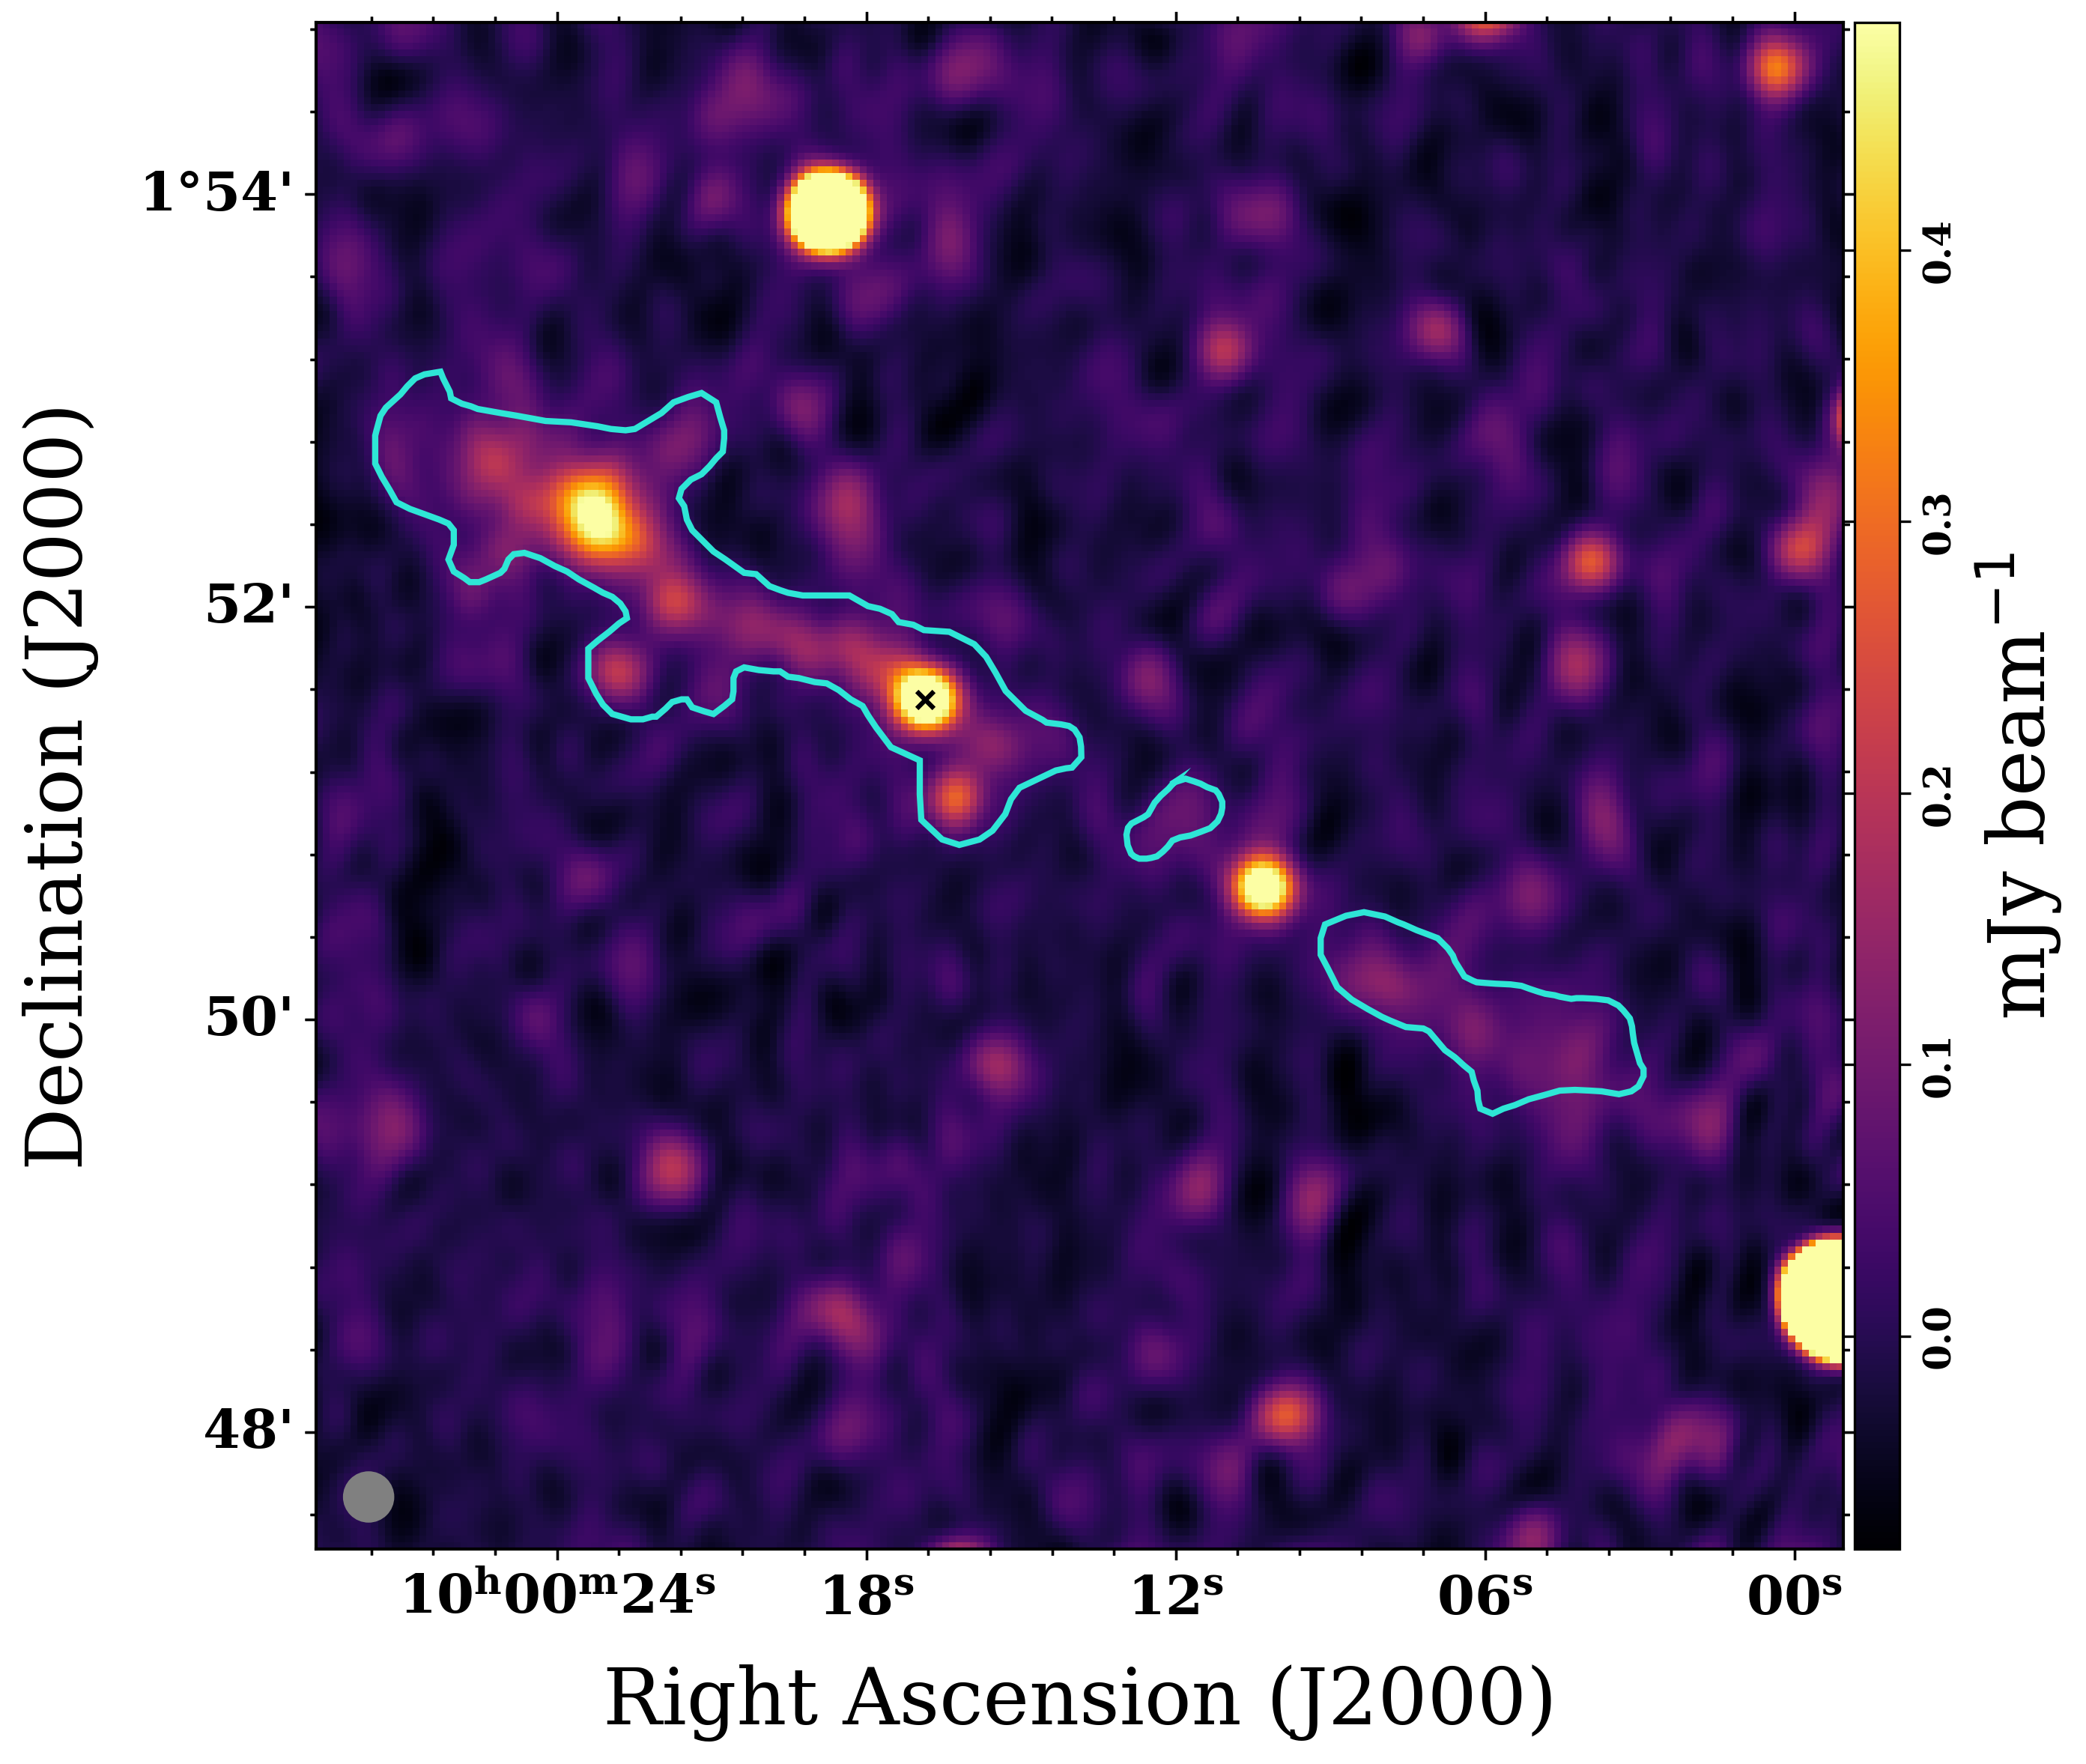
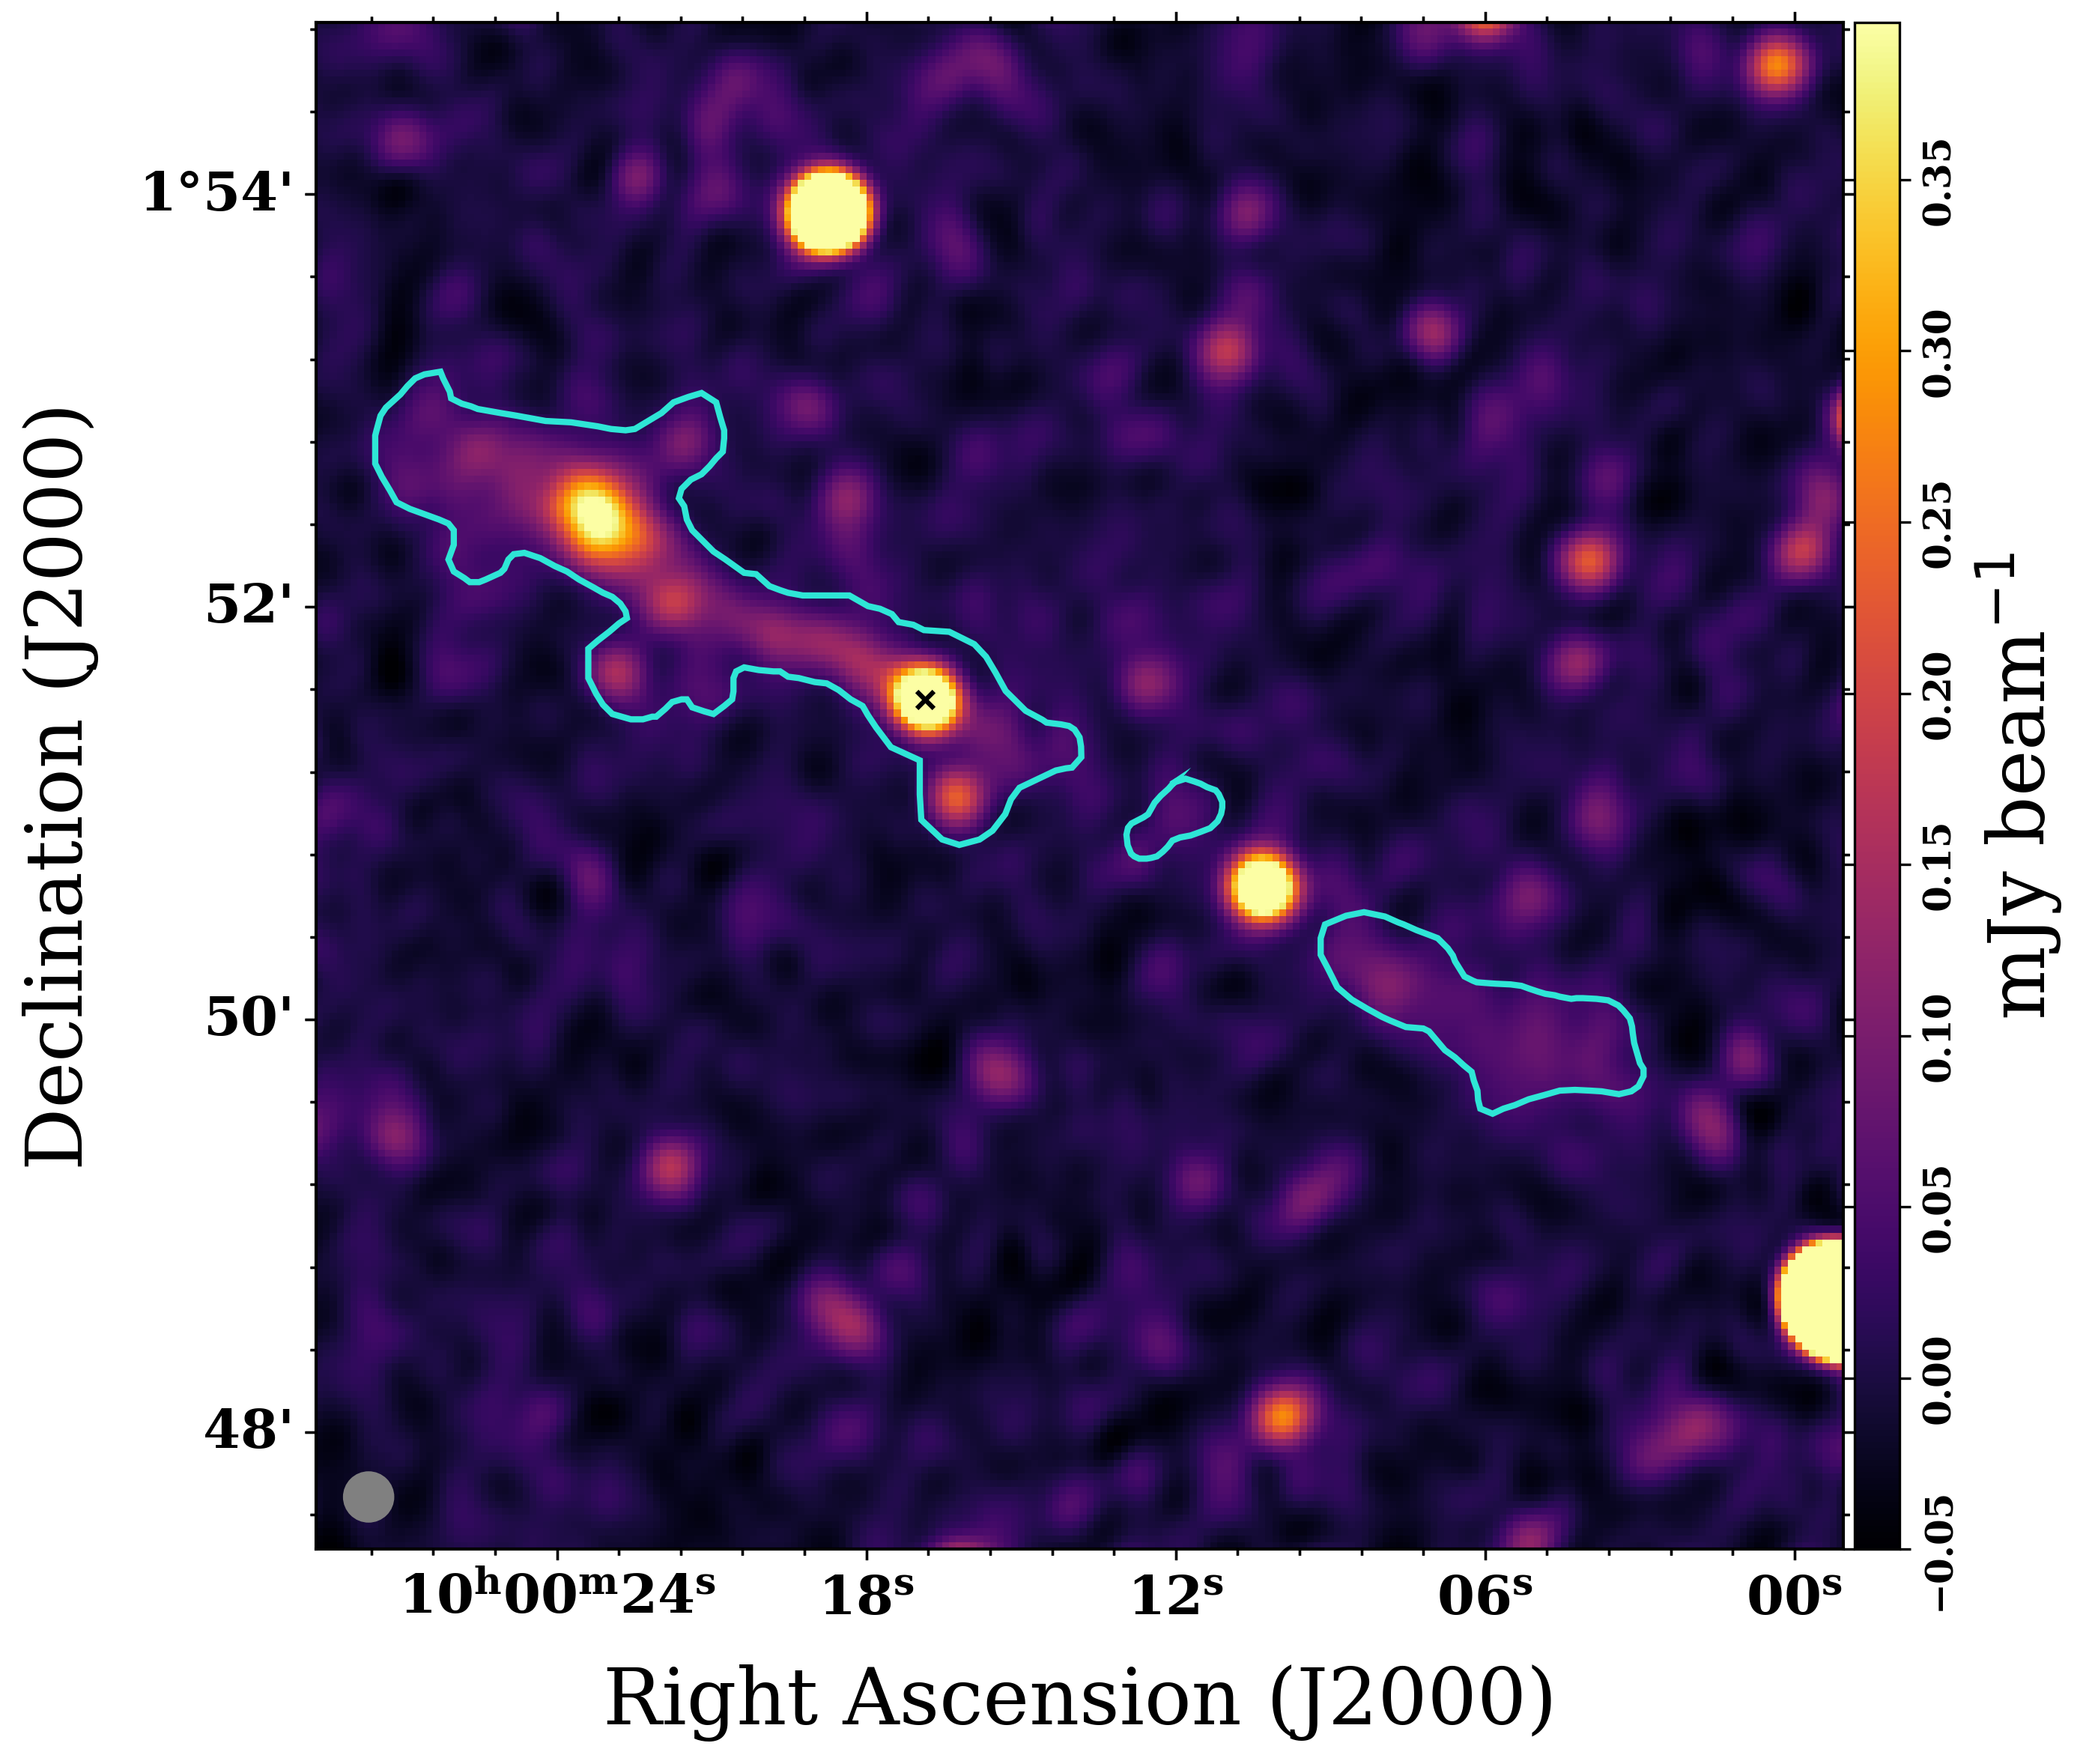
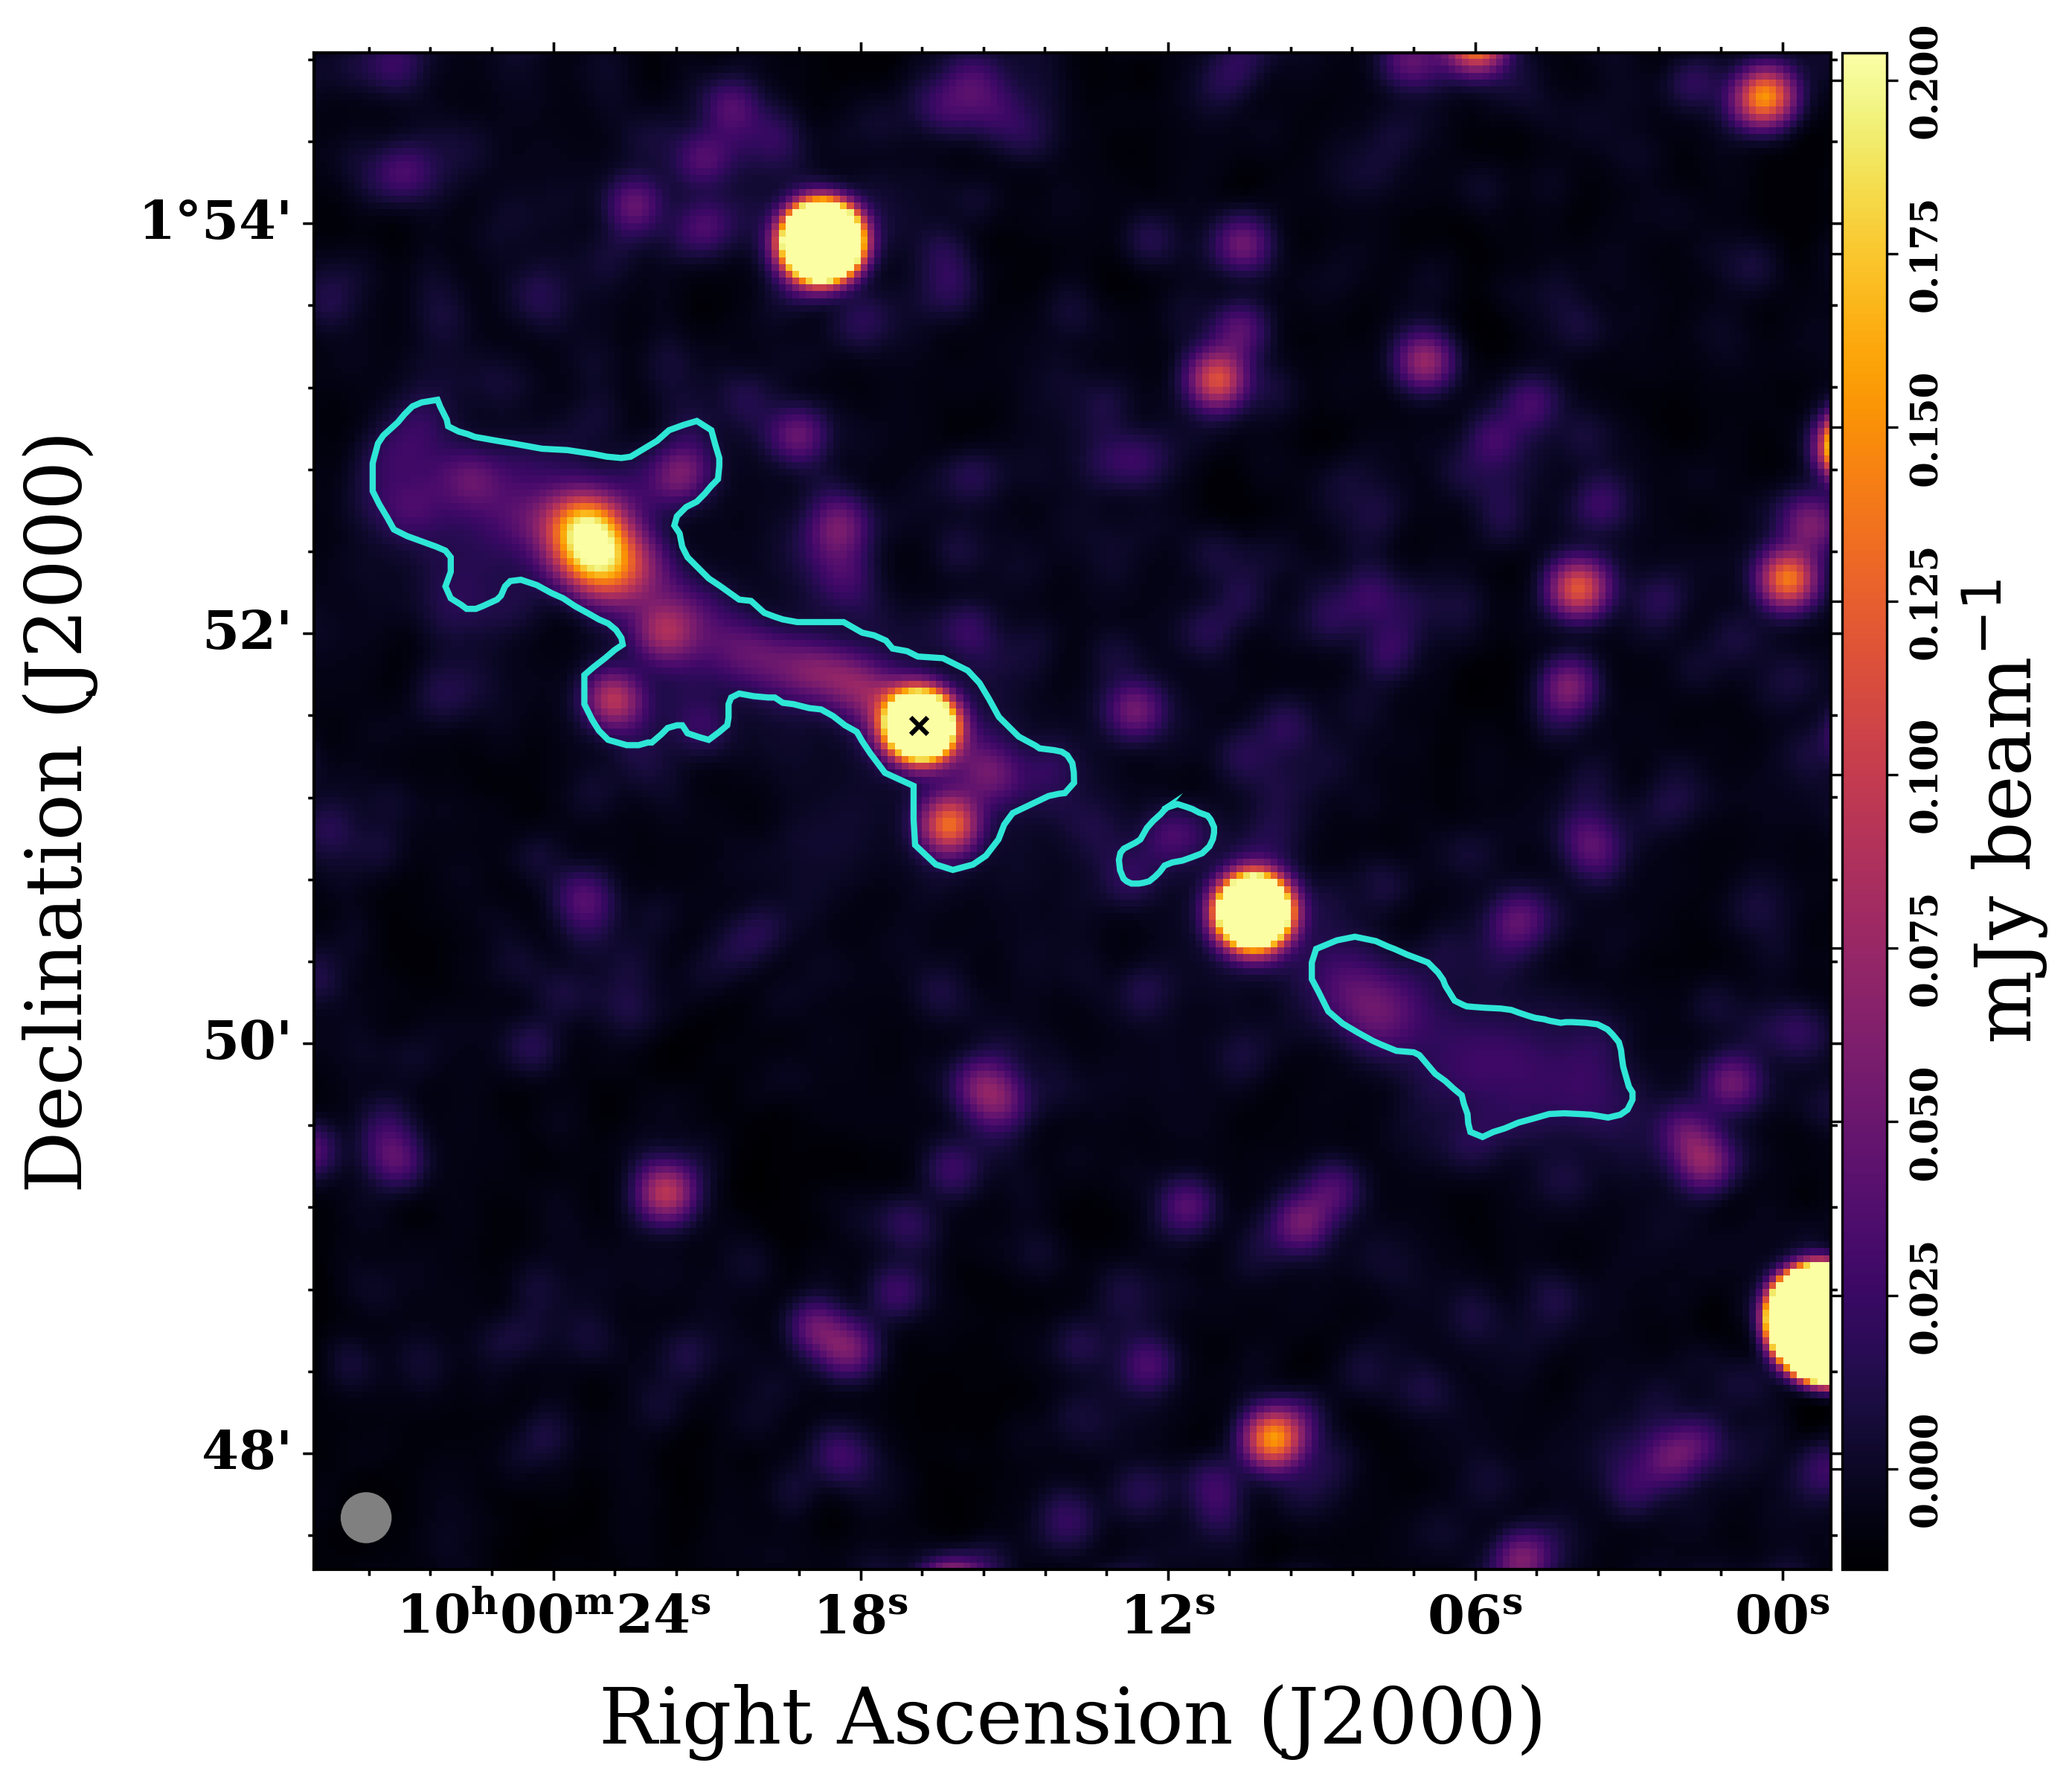
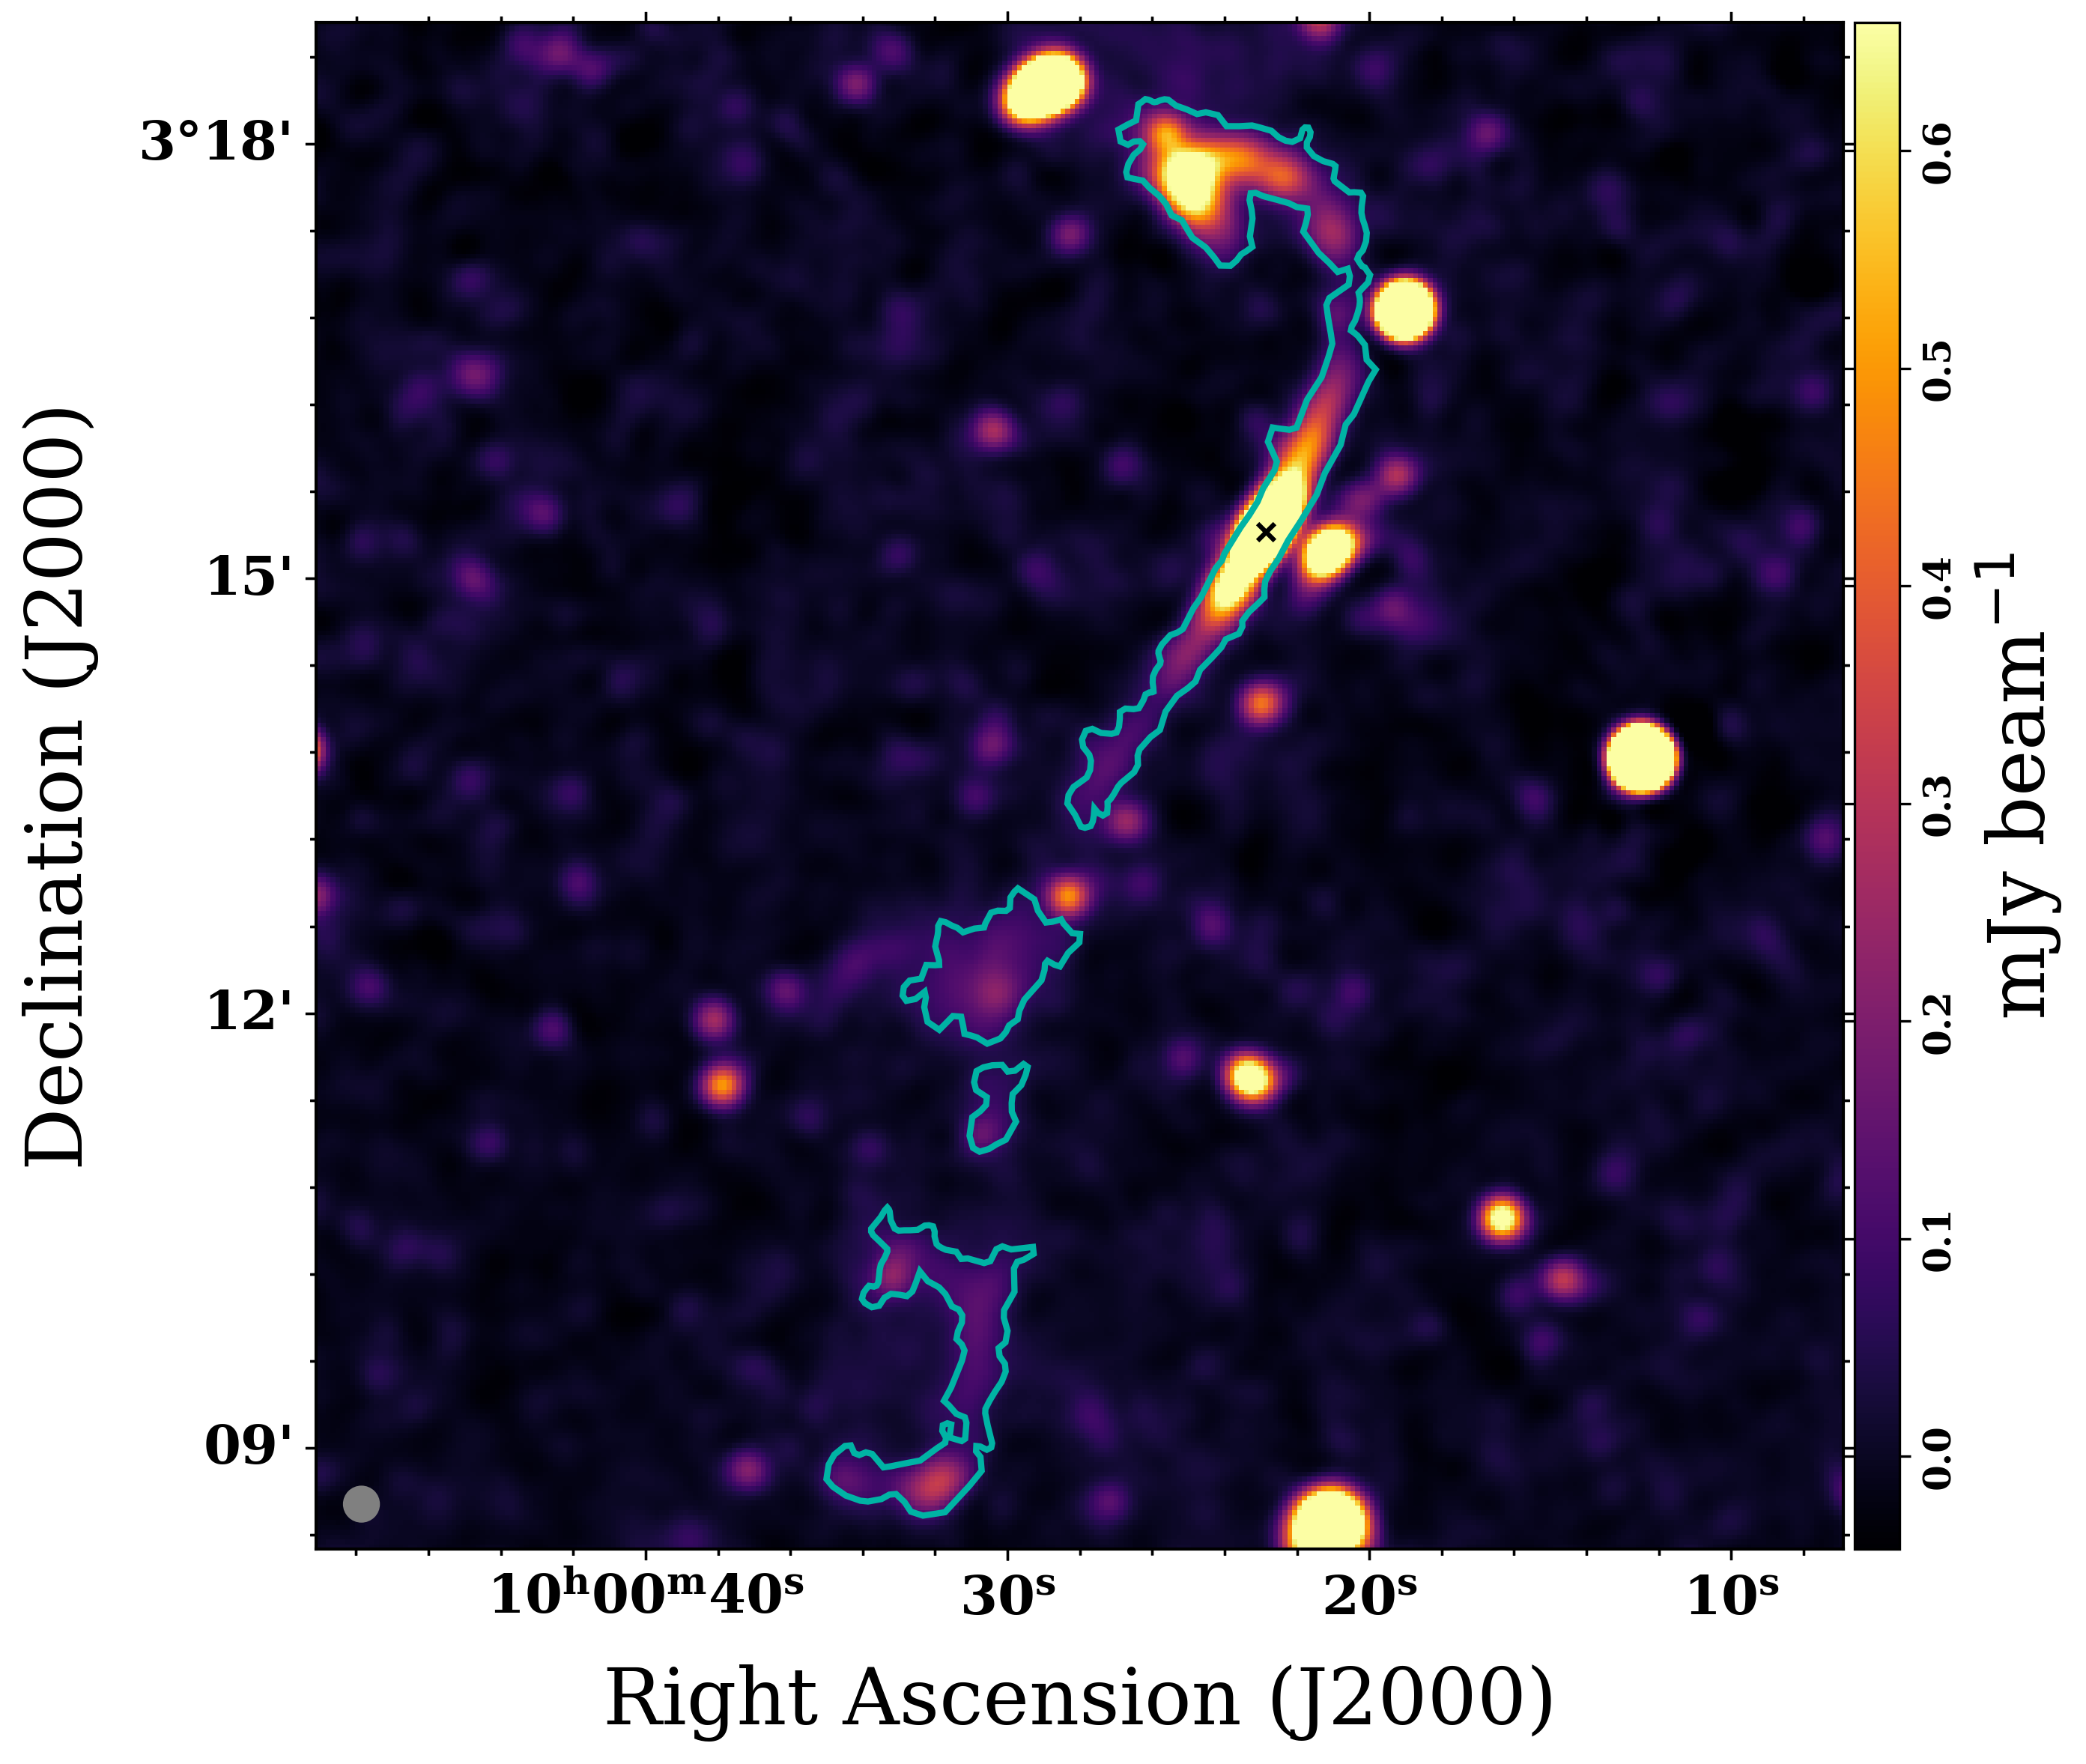
The basic properties of all three GRGs found within MIGHTEE COSMOS are given in Table 2. Their total intensity maps in the UHF-low, UHF-mid and -bands are shown in Figures 2, 3 and 4. The -band images and associated properties differ slightly to Delhaize et al. (2021), since the images have been smoothed to the same resolution as the UHF low images, and we also use the MIGHTEE DR1 rather than the ES release. The extent of each galaxy, determining its total length, is indicated by a 3 flux-density-contour in the -band, shown in cyan. The -band image is used in preference to the UHF images to determine the full extent due to its better sensitivity revealing more of the diffuse outer lobe emission.
Table 3 presents the integrated flux densities (), integrated spectral indices () and total radio power of each GRG from the intensity maps within the defined extent. The total integrated flux density is the sum of the northern lobe, southern lobe and core contributions to the flux density. The uncertainty of is dominated by the 10 percent uncertainty on the flux scale; however, we also combine it in quadrature with the thermal and confusion noise. A thermal noise map was created using Breizorro333https://github.com/ratt-ru/breizorro, with a threshold of 3. A confusion noise map was created with the Python Blob Detector and Source Finder (PyBDSF; Mohan & Rafferty 2015) using a pixel threshold of 5 and an island threshold of 2. For each map, the corresponding contribution to the total flux density uncertainty was taken to be the average value of all pixels encompassed by the GRG emission (i.e. cyan lines in Figures 2,3 and 4).
The frequency attributed to each flux measurement is taken as that of the central spectral channel covered by the data. The exception to this is the -band DR1 data where the average effective frequency of the map has been accurately determined to be 1.284 GHz (see Hale et al. (2024) for details). The effective frequencies at the positions of GRG1 ( GHz) and GRG2 ( GHz) are very similar to the average, and so we choose to use the average value of 1.284 GHz as the frequency of the -band data throughout this work. This is for consistency with the measurements in the UHF sub-bands and in the COSMOS8 -band (for GRG3), where more detailed effective frequency maps are not available. We have verified that using, for example, a frequency of 1.31 GHz for GRG2, does not change our results.
From Table 3, we see that GRG3 has a significantly lower radio power than GRG1 and GRG2 at all frequencies.
| (1) | (2) | (3) | (4) | (5) | (6) | (7) | (8) |
|---|---|---|---|---|---|---|---|
| Name | |||||||
| (mJy) | (mJy) | (mJy) | (1024 W Hz-1) | (1024 W Hz-1) | (1024 W Hz-1) | ||
| GRG1 | 33.20 2.00 | 29.10 1.70 | 19.10 1.10 | 0.78 0.12 | 2.590 0.270 | 2.230 0.230 | 1.490 0.160 |
| GRG2 | 7.47 0.53 | 5.98 0.45 | 3.88 0.25 | 0.92 0.13 | 3.000 0.350 | 2.090 0.240 | 1.380 0.160 |
| GRG3 | 32.30 2.00 | 28.70 1.80 | 21.20 1.30 | 0.59 0.12 | 0.890 0.092 | 0.802 0.082 | 0.597 0.061 |
3.2 Spectral indices and ages
We use Broadband Radio Astronomy Tools (brats) to estimate the spectral indices and spectral ages of the three GRGs on a pixel-by-pixel basis (Harwood et al., 2013, 2015). Brats takes flux density maps at different frequencies and calculates the spectral index of each pixel using a least squares regression in log space. brats can then convert spectral indices to spectral ages given various input parameters, such as the magnetic field strength ().
3.2.1 Spectral index maps
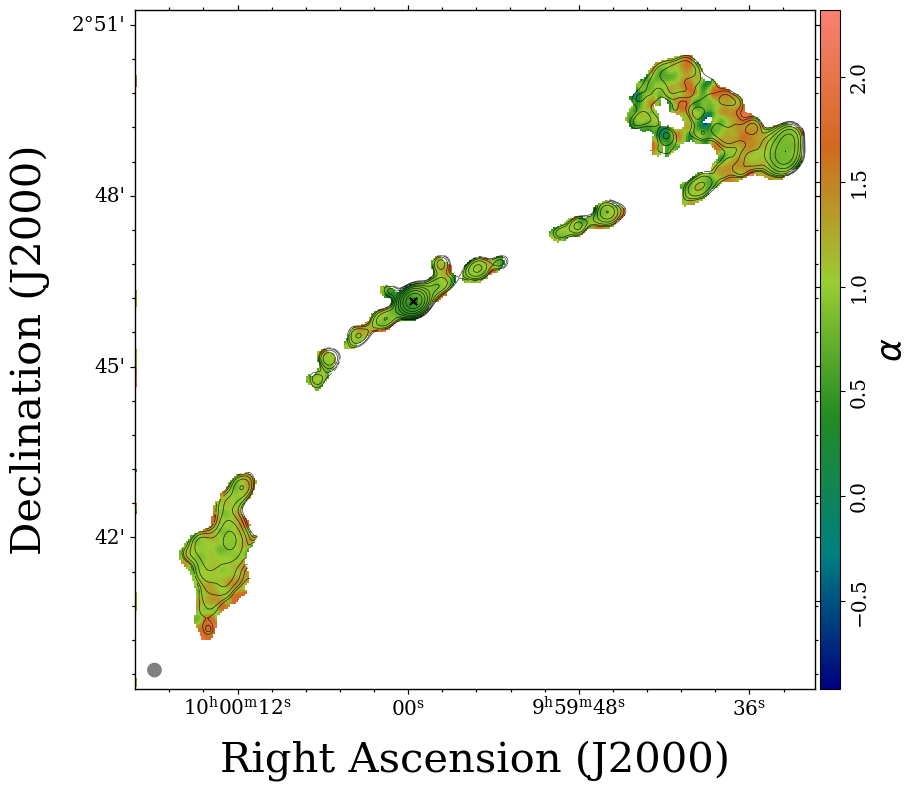
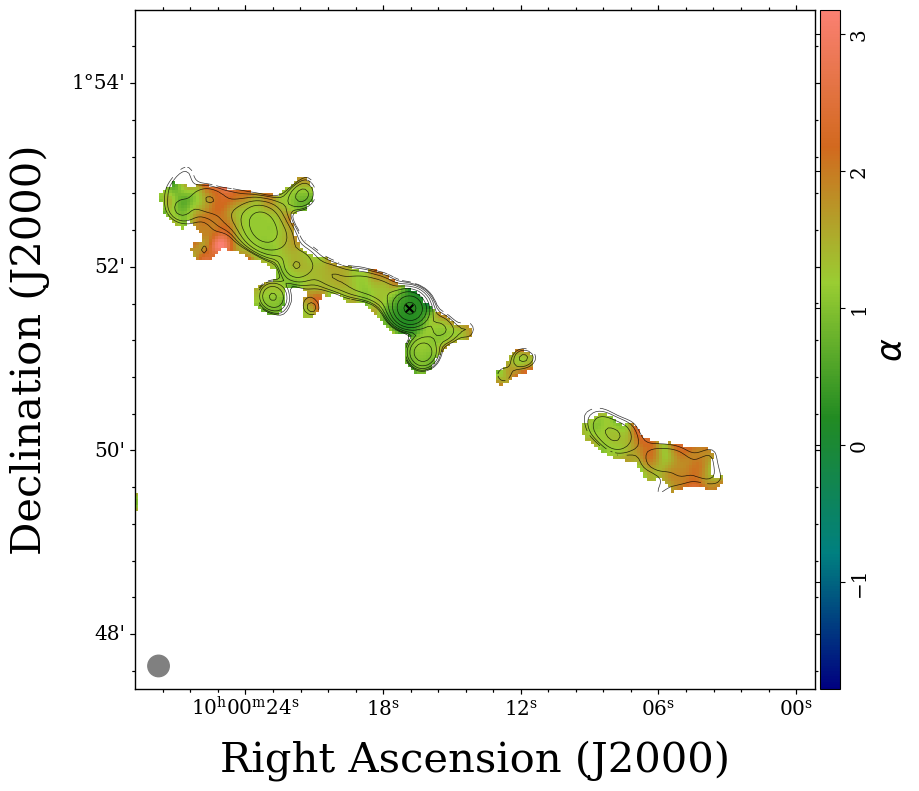
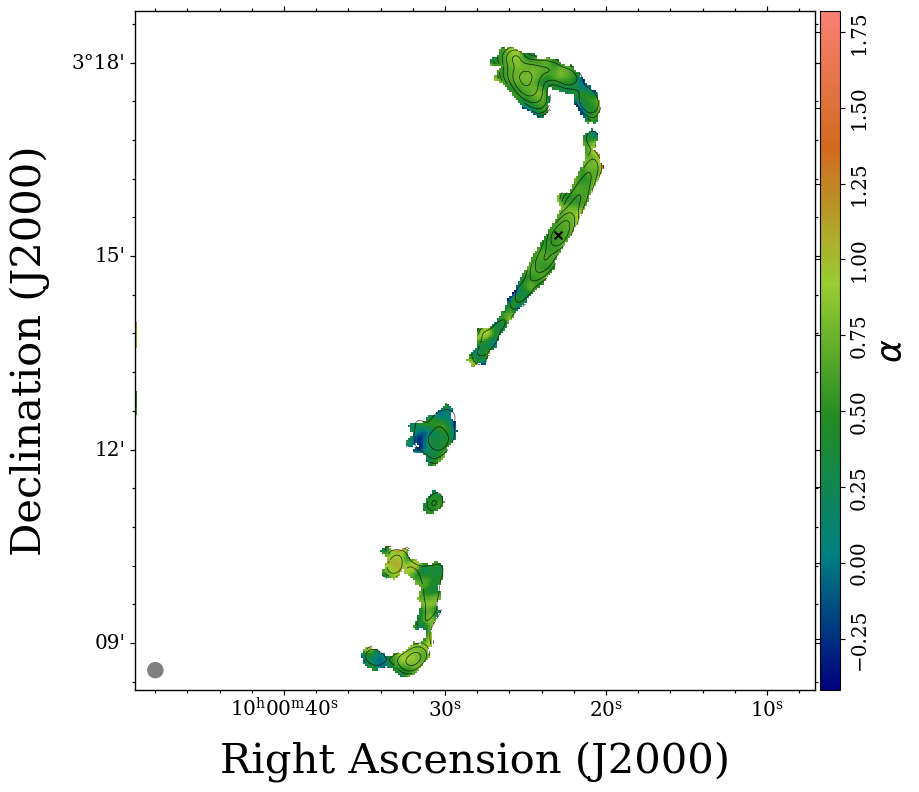
We produce spectral index maps with brats using maps at the three frequencies 632 MHz, 755 MHz and 1284 MHz. The resultant maps are shown in Figure 5. GRG2 displays a spectral index map typical of an FR II, with a flat core () and gradual steepening along the jets towards the outer end of the lobes (). GRG1 displays a steeper core () than what we expect, though it is still shallow relative to its lobes (). This indicates a possible restarted jet, which would be direct evidence of the duty cycle. GRG3 however, is relatively uniform in comparison. The majority of pixels have values in the range of . We do not see any resolved core, and the inner jets have an average of .
3.2.2 Magnetic Fields
To calculate spectral ages, brats requires information on the magnetic field strength in the GRG lobes. We estimate using pysynch444https://github.com/mhardcastle/pysynch (Hardcastle et al., 1998), which models the synchrotron radiation and inverse Compton emission of radio galaxies assuming equipartition, i.e., that the total energy densities of cosmic ray electrons are equal to that of the magnetic field (Beck & Krause, 2005). This assumption is made on the basis that cosmic ray particles and magnetic fields are strongly coupled and exchange energy until equilibrium is reached. Pysynch approximates the radio lobe morphologies as ellipses and the radio continuum spectrum as a power law. For each GRG lobe, we find the total flux density within an ellipse drawn from the core to the end of the lobe. We then take the average of the semi-major axes, semi-minor axes, and flux densities of the two lobes for each GRG, and provide this to pysynch. These input parameters are presented in Table 4.
The equipartition fields are 1.00 G, 0.95 G and 1.50 G for GRGs 1, 2 and 3 respectively, giving an average equipartition magnetic field
of = 1.15 ± 0.02 G. This is just in the range of 1-16 G of GRGs reported by Dabhade et al. (2023) in their review of GRG properties. However, recent observations have shown that the true magnetic field lies closer to 40 percent of the equipartition value (Croston et al., 2005; Ineson et al., 2017; Mahatma et al., 2019). We therefore assume the magnetic fields of the GRGs are 0.4, where is the equipartition magnetic field strength. The final magnetic fields = 0.4 are also shown in Table 4.
| (1) | (2) | (3) | (4) | (5) |
|---|---|---|---|---|
| Name | ||||
| (arcsec) | (arcsec) | (mJy) | (G) | |
| GRG1 | 90 | 64 | 9.79 | 4.18 |
| GRG2 | 63 | 45 | 2.56 | 3.80 |
| GRG3 | 60 | 45 | 8.65 | 5.87 |
3.2.3 Spectral ages
The spectral age maps for the three GRGs are determined with the maps at 632 MHz, 755 MHz and 1284 MHz using two of the single injection models within brats: the standard Jaffe-Perola model (JP; Jaffe & Perola 1973) and JP-Tribble (Tribble, 1993) model. Both models assume that the initial electron energy distribution is described as a power law , where is the power law index of the initial injected energy distribution, and assume the losses for the distribution as synchrotron self-absorption and inverse Compton losses. Both models need the redshift of the galaxy, the magnetic field and the injection index (). The models differ in that the standard JP model applies a constant magnetic field, while the Tribble method varies the magnetic field in space by applying a Gaussian random field to the source, so that the electrons diffuse over spatial regions of various magnetic field strengths. brats accounts for magnetic field losses due to the cosmic microwave background in both models. The Tribble method has been shown to be more physically plausible than the JP method (Harwood et al. 2013, 2015), however it is much more computationally expensive. While an analysis of both was feasible for the small sample of three GRGs, ensuring that the standard JP method is in agreement with the Tribble estimates would be beneficial for future studies. For a more in-depth explanation of the two methods, see Harwood et al. (2015, 2013).
For the spectral age fitting, a circular background region of 30 arcsec in diameter was used to calculate the flux density image rms noise. The spectral age of a given pixel is set to only be calculated if there is a flux density above 1 in every input frequency, due to the UHF sub-bands having lower S/N ratios than the -band image. The flux calibration uncertainty is set to be 10 percent, which is the standard for brats calculations. The age resolution is set as 10 Myr with a 5-level iteration, with a maximum age of 150 Myr and a minimum of 0 Myr as reasonable bounds.
Since the injection index of GRGs has yet to be observationally constrained, we adopt a constant injection index of = 0.5. This is chosen in accordance with Bell (1978) and Carilli et al. (1991) as the lowest value that can be theoretically observed and a common value used in the literature. Since recent studies (Harwood et al., 2013) have shown that injection indices can be as high as 0.8 \textcolorred, a preliminary estimate of the injection index was carried out with brats. The three GRGs in this study are found to have values between , ensuring that = 0.5 is an appropriate choice. We note that if the chosen injection index is artificially low, it will artificially increase the absolute values of the calculated spectral ages; however, it will not affect the relative distribution of ages throughout a source.
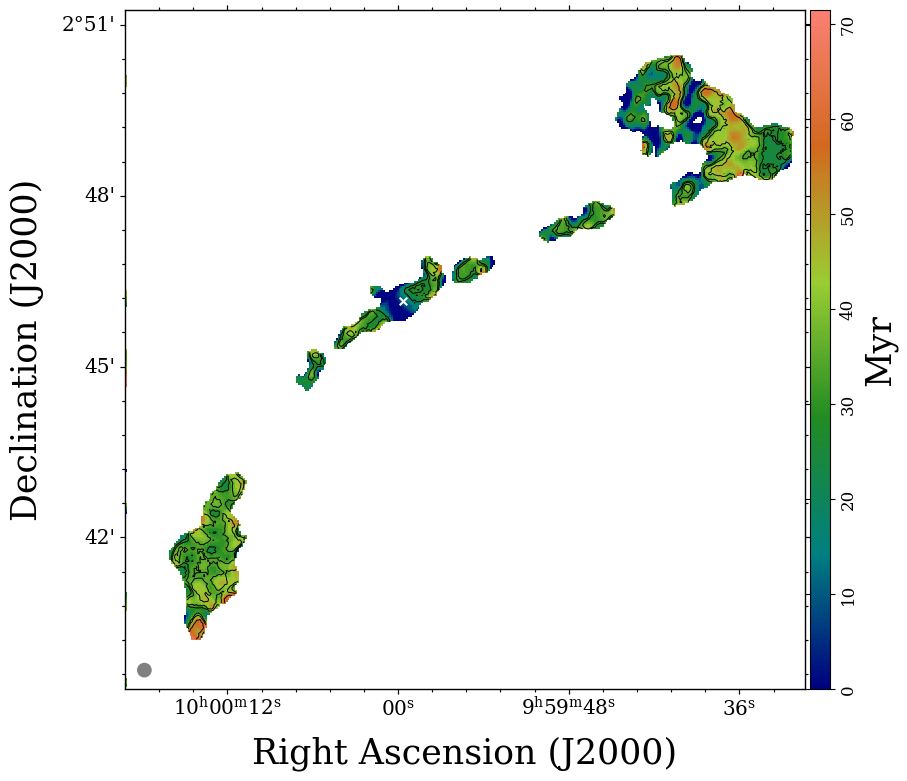
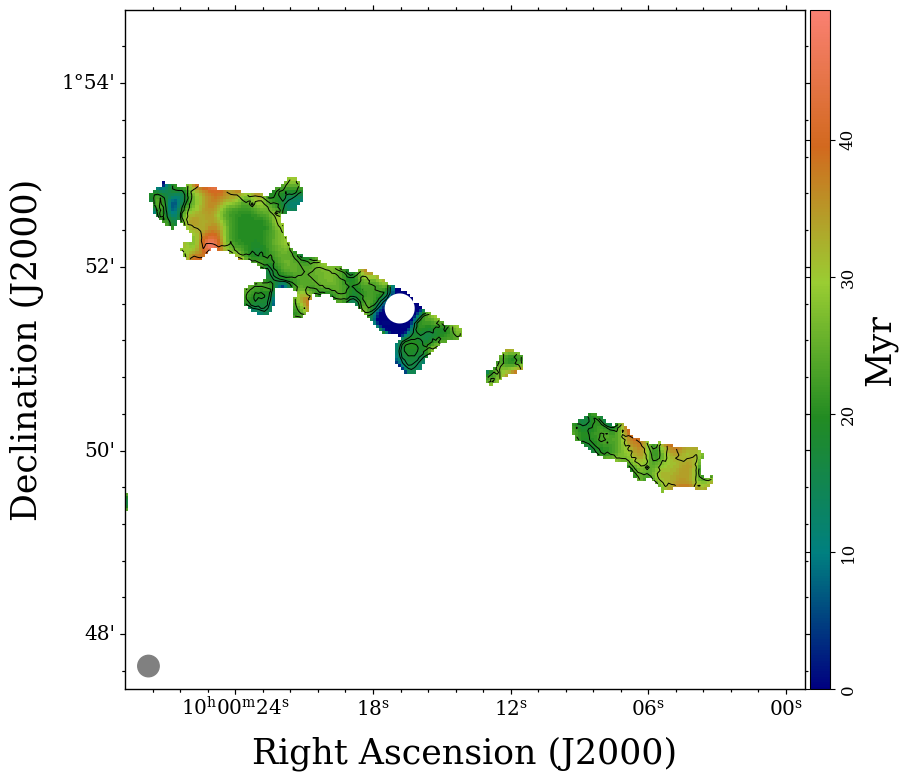
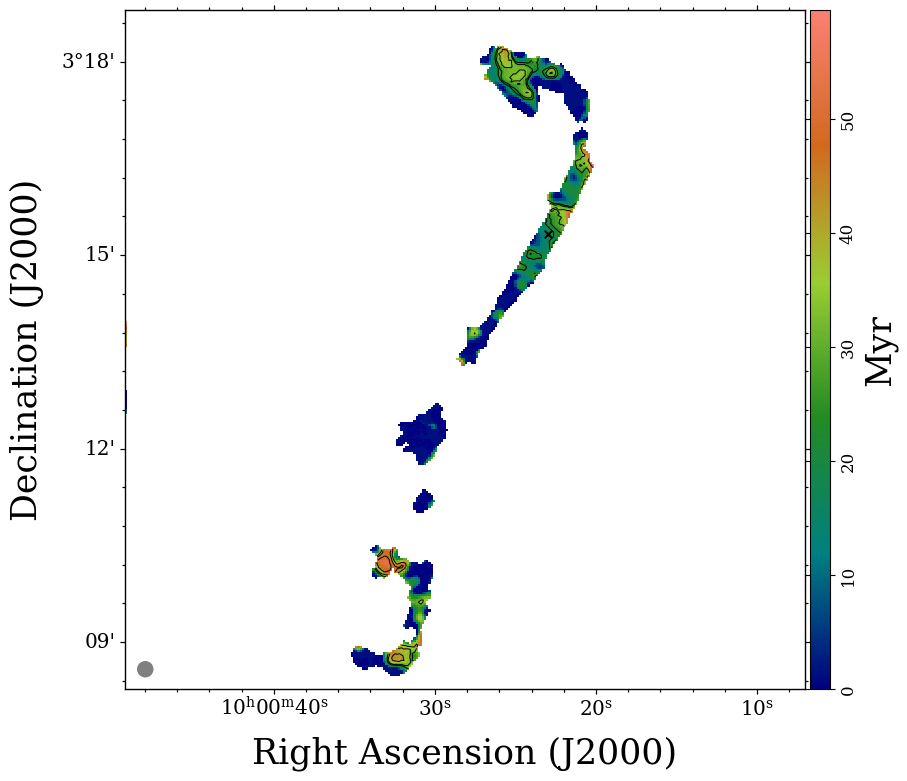
The resultant spectral age maps as calculated by both the Jaffe-Perola standard and Tribble models are shown in Figures 6, 7 and 8. The average ages of each component are given in Table 5. Uncertainties for the spectral ages are taken from uncertainty maps produced by brats for each model. brats also calculates spectral age uncertainties on a pixel-by-pixel basis. In Figures 6 and 7, we overlay contours connecting pixels with spectral age uncertainties of 20, 30 and 40 per cent for GRG1 and GRG2. The contours in Figure 8 represent the 40, 60 and 80 per cent uncertainties for GRG3. Possible reasons for these larger spectral age uncertainties are discussed in Section 4.1. Both models give a similar distribution of spectral ages to each other and to their respective spectral index maps which is expected, and suggests that in future studies, the JP method may be adequate for spectral age analyses. The Tribble method gives slightly higher age estimates (with the difference in values being more pronounced at higher ages). However, we can see from Table 5 that the values agree with one another within their uncertainty budgets. For all three GRGs, the youngest ages are seen in the centre and in the hotspots of the GRG, with older electrons in the lobes surrounding the hotspots as well as in the jets, as expected.


| (1) | (2) | (3) | (4) | (5) |
|---|---|---|---|---|
| Source | Model | Core/inner jets | Northern Lobe | Southern Lobe |
| (Myr) | (Myr) | (Myr) | ||
| JP | ||||
| GRG1 | ||||
| Tribble | ||||
| JP | - | |||
| GRG2 | ||||
| Tribble | - | |||
| JP | ||||
| GRG3 | ||||
| Tribble |
4 Discussion
4.1 Distribution of spatially resolved spectral ages
According to the JP model, GRG1 has a maximum age of 60 11 Myr. This is the maximum pixel value, found in the lobes, in the spectral age map shown in Figure 6. The core displays the youngest electrons (relating to GRG emission) with a value of 2.0 15 Myr, i.e. consistent with a zero age. The northern hotspot shows a mean age of 25.7 7.6 Myr, and the rest of the lobe is slightly older with a value of 40.0 8.1 Myr, giving the average value shown in the table of Myr, signalling an injection of energy at the hotspot due to a collision with the IGM. The values here are calculated only including regions where the spectral age uncertainties are less than 30 per cent as shown in Figure 6. This is to ensure the ages are not underestimated, as brats tends to assign low ages in regions where the spectral aging model is poorly constrained. The southern lobe displays similar ages to the northern lobe with an average JP age of 33 7.55 Myr, consistent with the assumption that both lobes are created at the same time and are in a similar environment.
Since the core of GRG2 displays a flat spectral index, it is likely dominated by synchrotron self-absorption and therefore cannot be well constrained by the power law models employed by brats. The spectral ages calculated in this region by brats are therefore unreliable, and thus have been masked out of the spectral age map in Figure 7. The northern lobe and hotspot together have an average JP age of 22.7 4.2 Myr and a Tribble age of 24.7 4.4 Myr, which agree with the southern lobe ages of 25.7 6.3 Myr using the JP model and 28.4 6.8 Myr using the Tribble model. The maximum Tribble age is 47.0 11 Myr. Both the JP and Tribble models are better constrained for GRG2 than for the other two GRGs, based on the uncertainties reported by brats. GRG2 also displays the most typical FRII morphology and expected spectral index distribution, implying that such properties are best modelled by brats.
GRG3, on the other hand, presents a much more interesting case. The uncertainties for GRG3 are twice as large as the other two GRGs, which is likely due to GRG3 being located towards the edge of the UHF field of view. Using the low sensitivity COSMOS8 -band map rather than the deeper mosaic of DR1 most likely also contributes to the uncertainties shown. Due to this, we extend our limits used for our calculations to include all pixels where the uncertainty is below 60 percent of the computed age. We do see slightly younger ages in the core (13 18 Myr with the JP model) compared to the centre of the lobes (27 22 Myr and 47 21 Myr for the northern and southern lobes, respectively). However, the youngest ages in GRG3 are seen in the diffuse outer plasma. This is contrary to expectations, since these regions are far from the expected particle acceleration sites in the inner jets. The minimum ages in these outer plasma regions are 0 Myr, however, we caution that the uncertainties are even larger in this region ( 50 Myr). We also see recently accelerated plasma surrounding UGC 05377 and conclude that these values are at least partially contaminated by the star-forming galaxy. The maximum JP age for GRG3 is 64 31 Myr and the maximum Tribble age is 67 36 Myr.
There is still, however, the matter of the aged core and only slight steepening in the lobes. While the distribution of spectral indices and ages of GRG3 do not resemble a typical GRG there are similarities in the distribution of ages within WATs (Giacintucci et al., 2008; Pandge et al., 2022). Potentially, the dense environment found within both WATs and GRG3 is contributing to the distribution seen (Enßlin & Gopal-Krishna, 2001; Kempner & Sarazin, 2001) and might even contribute to the large uncertainties. The slightly older core could mean that the central engine has recently switched off and the galaxy is entering a period of quiescence. However, more likely, it suggests that the injection index is instead higher than what we have assumed and so all ages have been increased. More sensitive observations at a range of frequencies are needed to constrain this degeneracy. This, however, does not affect the distribution of ages shown.
4.2 Comparison with dynamical estimates
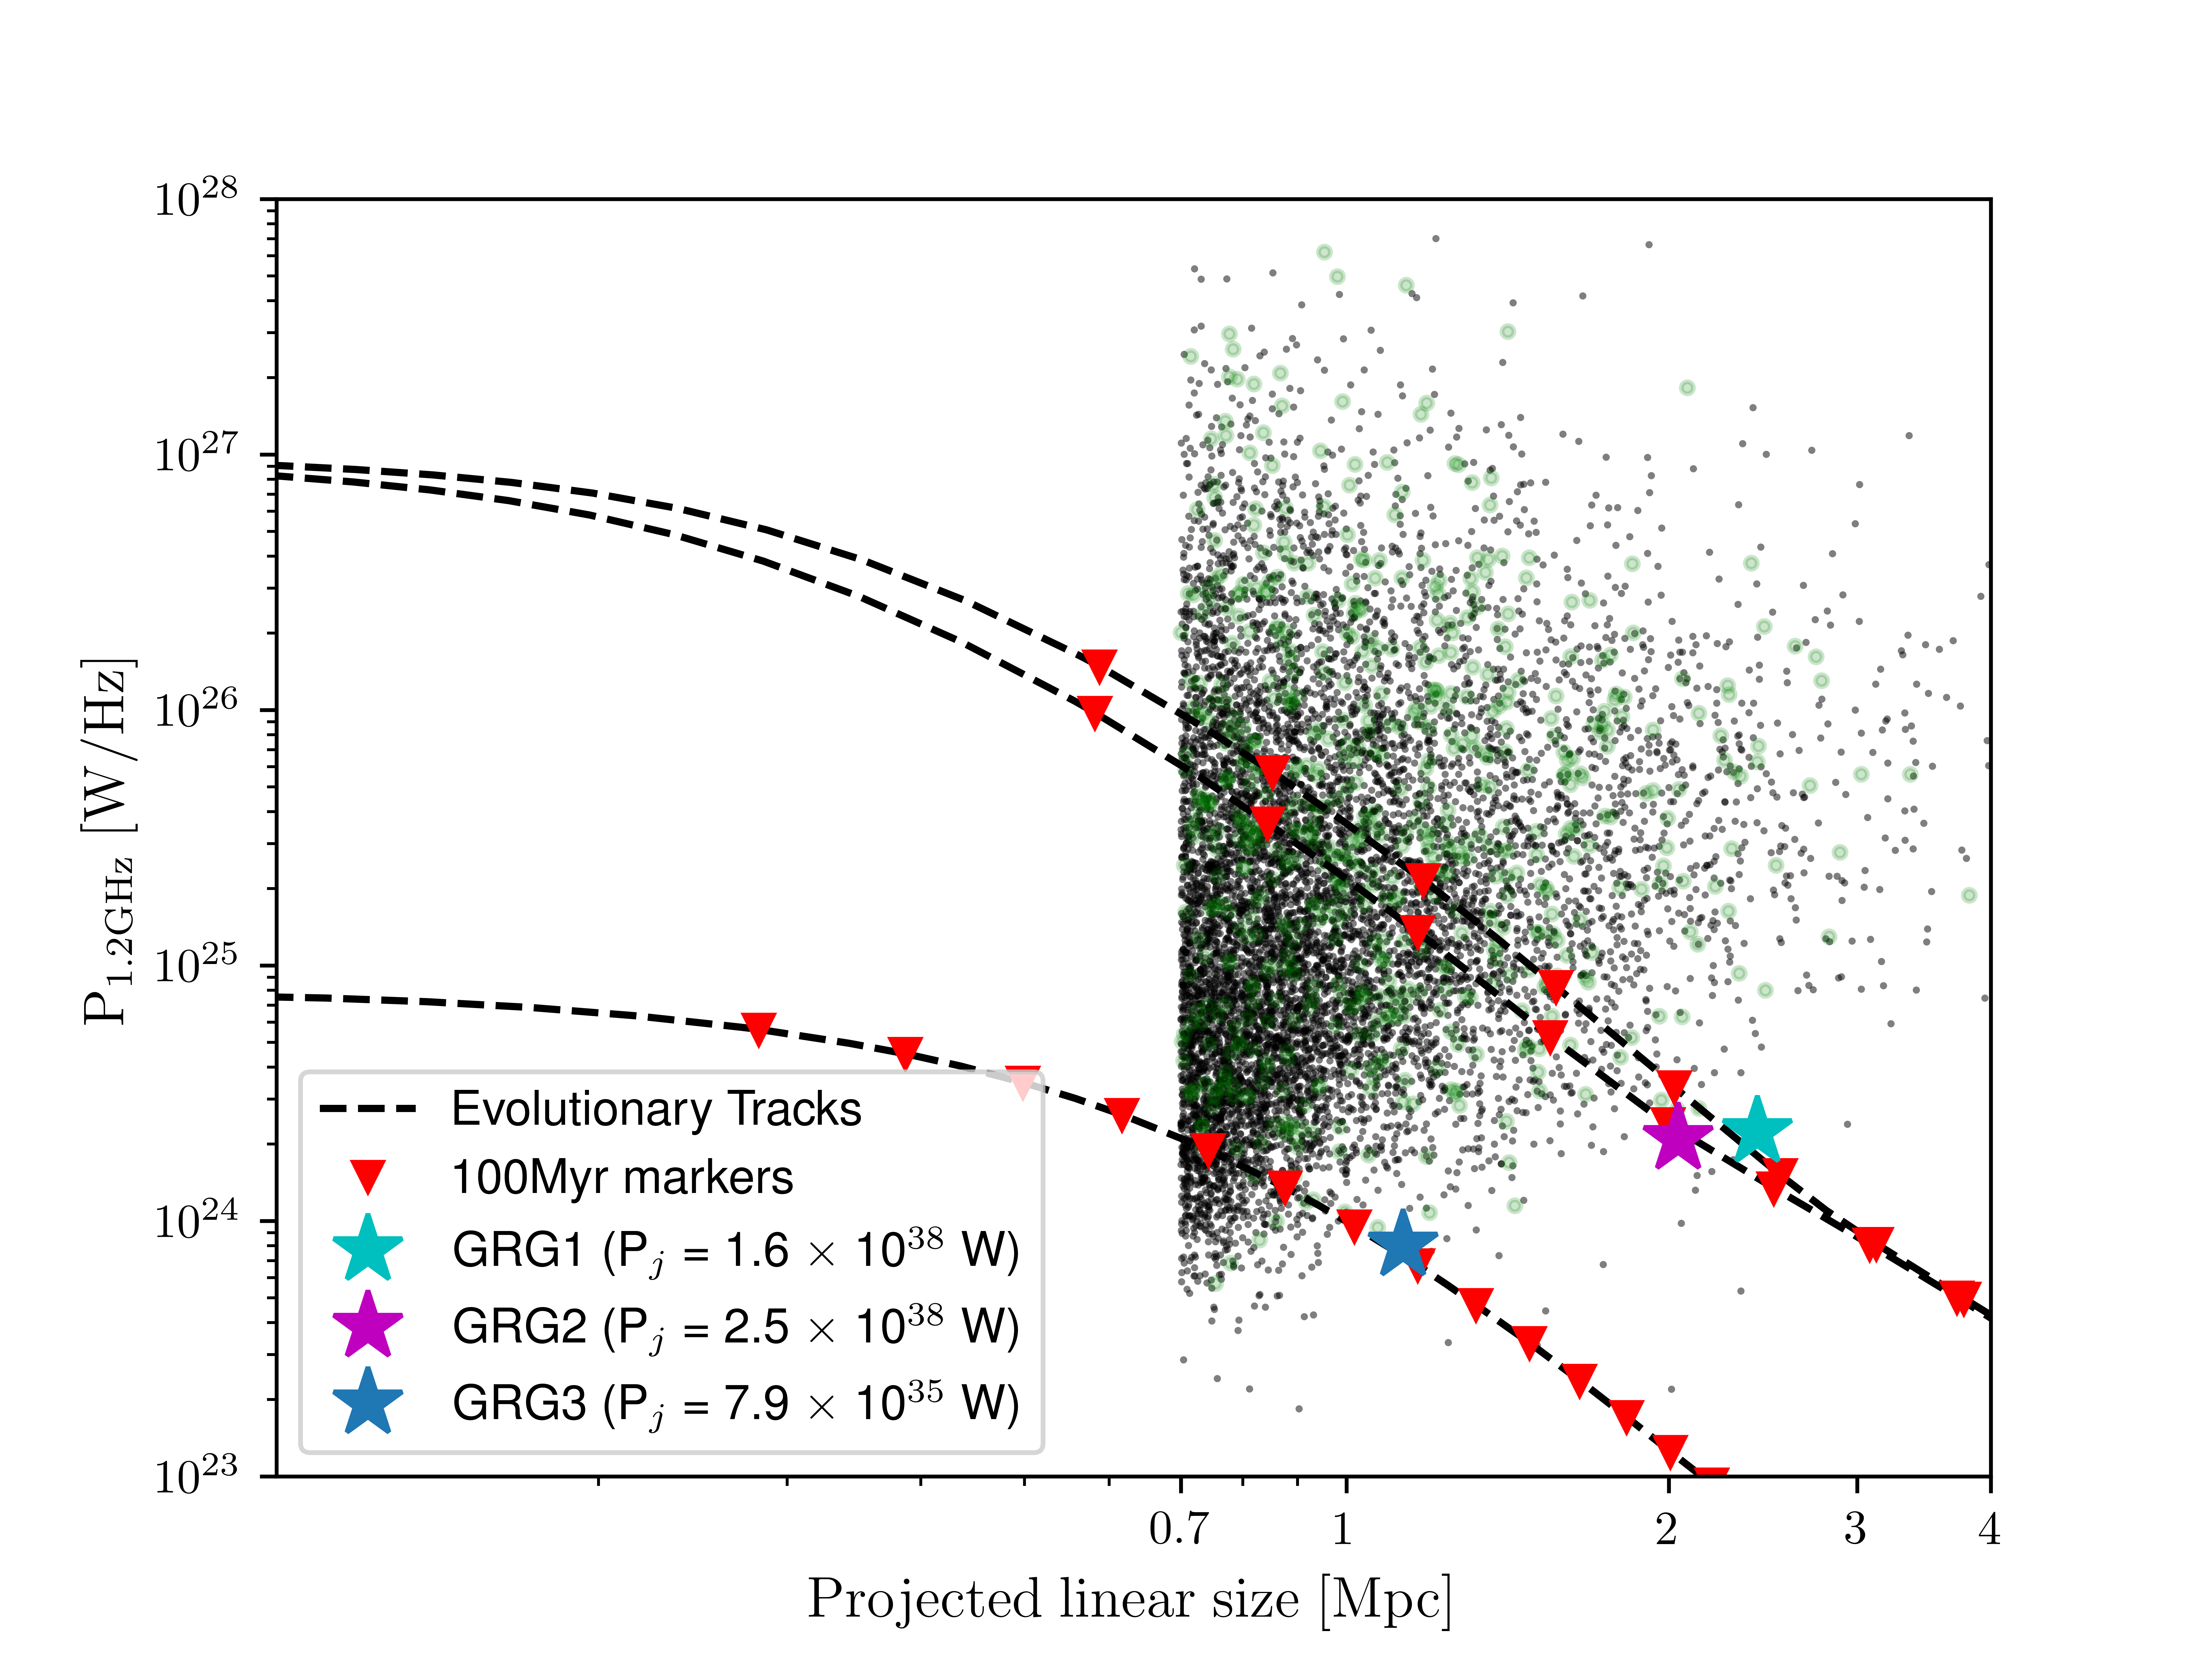
We compare the power and size of the COSMOS GRGs to the those of others in the literature. Specifically, we compare to the GRG compilation catalogue of Dabhade et al. (2023) and the LOTSS DR2 optically-matched source catalogue of Hardcastle et al. (2023). The latter contains accurate flux densities for many of the GRGs presented in Simonte et al. (2022); Oei et al. (2023); Simonte et al. (2024) and Mostert et al. (2024). The combined total is 9000 GRGs; see Figure 9. The COSMOS GRGs are shown as stars and occupy the lower right corner of the diagram, showing they are still below the sensitivity limit of LOFAR, and are some of the largest and lowest luminosity GRGs detected. We use the Power-Diameter (P-D) diagram to determine the dynamical age of the galaxies as an independent comparison to the spectral age. The dynamical age is estimated based on the size, power and environment of a galaxy.
For the GRGs, we estimate the dynamical age using the analytic555https://github.com/mhardcastle/analytic model from Hardcastle (2018), shown in Figure 9 as evolutionary tracks. The analytic model derives a number of properties of a radio galaxy, including its power and diameter as a function of time. It assumes a density profile for the environment, as well as the power of the jets. For the GRGs, the universal pressure profile from Arnaud et al. (2010) is used, with the functional form of
| (1) |
where and is a generalised Navarro-Frenk-White profile. This profile is chosen as it has been shown to represent the pressure profile of poor cluster/big group galaxies. It also has the added advantage of only having one free parameter: - the total mass in a radius that corresponds to 500 times the critical density of the universe.
The density of the environment for GRG1 and GRG2 is estimated using the number density of galaxies within a 1.5 Mpc radius. GRG1 and GRG2 reside in small groups containing 8 and 5 members, respectively, according to the zCOSMOS 20k group catalogue (Knobel et al., 2012). Neither of these groups have enough spectroscopic redshift members (5) for accurate velocity dispersion rates, and so a lower limit of M⊙ is assumed (Reiprich et al., 2013; Ineson et al., 2015). The value for GRG3 is taken directly from Wen et al. (2012) to be M500= . The dynamical estimates are shown in Figure 9 as evolutionary tracks. Using these mass estimates, the best-fit tracks are determined empirically. These tracks imply that GRG1 and GRG2 are consistent with the evolution of a galaxy with a jet power of
1038 W after 800 Myr and 700 Myr respectively. The suggested ages for GRG3 are consistent with the evolution of a W jet after 950 Myr.
The evolution of the GRGs in analytic is derived assuming the jets at no point switch off. For GRG3, if we instead assume the jets have turned off recently, as potentially implied by the spectral ages in the core, the estimated jet power would increase, and the dynamical age of GRG3 would decrease. This, however, adds an extra level of degeneracy to the model, since unless the true age before turn-off is known, there is no constraint on the jet power. Thus, GRG3 would be equally well represented by a young source with a jet power of W with a dynamical age of 300 Myr. Hence, we simply keep the calculated dynamical age of GRG3 as an upper limit.
Comparing the maximum Tribble ages to their dynamical counterparts, the dynamical ages are many times larger than their spectral counterparts, though these there are some known discrepancies between spectral and dynamical age that warrant consideration.
The spectral ages of galaxies are mainly dependent on two parameters: the break frequency and the magnetic field. The magnetic field strength of galaxies is not trivial to determine and the distribution and evolution of the magnetic field is much more complicated than what even the Tribble model assumes. The magnetic field will decrease over time and will most likely be higher at the core and the hotspots where the electrons originate before
they permeate into the surrounding environment. This may contribute to the discrepancies between spectral and dynamical ages.
Another source of uncertainty is that the spectral age models do
not consider other loss mechanisms in the lobes, such as adiabatic
cooling, nor the effects of electron mixing. Adiabatic losses within a galaxy would
result in an overestimation of the spectral ages within the plasma
(Blundell et al., 1999). Electron mixing describes the phenomenon that even
the faintest radio emission traces electron populations of different
energies (Turner et al., 2018; Mahatma et al., 2019). Electron mixing
biases age towards younger estimates and is considered to be the
cause of spectral ages at sub-equipartition magnetic fields still being
at most half of their dynamical counterparts (Mahatma et al., 2019).
Furthermore, the dynamical ages are limited without true knowledge of the jet power and the proper length, though they are fairly robust against changes to these parameters. The dynamical age is however very sensitive to changes in the density of the environment, with an order of magnitude increase in density increasing the dynamical age by a factor of 2.
Taking these limitations into account does not entirely reconcile the spectral ages with the dynamical ages, even with an estimate of the environment. Thus, we conclude similarly to Mahatma et al. (2020) and Pinjarkar et al. (2023) that there are extra processes that either or both spectral and dynamical models do not account for. The contamination from electron mixing has not been very well constrained in GRGs and could be playing an increased role here.
5 Summary and Conclusions
We have presented spatially-resolved spectral index and age maps of three GRGs within the COSMOS field using MIGHTEE -band data and new MeerKAT UHF band observations. MGTC J100022.85+031520.4, dubbed GRG3, is presented here for the first time. We summarise our main results here.
-
1.
MGTC J100022.85+031520.4, (GRG3), is a giant radio galaxy located in the northernmost part of the COSMOS primary beam in the UHF band of MeerKAT. It is hosted by an elliptical galaxy SDSS J100022.85+031520 with a redshift of = 0.1034 ± 0.00002. It has a projected linear size of 1.29 Mpc and total power at 1284 MHz of 5.97 0.02 W Hz-1. It shows similar features to a wide angle tail (WAT) galaxy.
-
2.
The spectral analysis was performed using two different models: the Jaffe-Perola standard model and the Tribble model. The two models agreed with each other within their uncertainties with the Tribble model consistently producing older estimates of the electron ages within the sources.
-
3.
GRG1 was found to have the oldest electrons, with a maximum Tribble age of 68 13 Myr and a mean Tribble lobe age of 34 Myr. GRG3 has a maximum (Tribble) lobe age of 67 Myr, and GRG2 has the youngest maximum Tribble age of 47 Myr in the lobes.
-
4.
Based on the spectral age distribution, GRGs 1 and 2 are likely to still be active. The steep spectral index in the core of GRG1 indicates a restarted jet.
-
5.
The distribution of ages within the GRGs showcases the history of their evolution. GRGs 1 and 2 have been able to grow in relatively isolated environments and thus have the expected distribution of ages with the youngest in the core and the oldest in the lobes. GRG3 however, shows more complexity, possibly due to its being in a denser cluster environment and having more interactions with its surroundings.
-
6.
Dynamically, GRG3 was found to be consistent with a galaxy of W jet power which is 950 Myr old, while GRGs 1 and 2 were consistent with 800 Myr and 700 Myr old galaxies with jet powers of W. These ages are many times larger than their spectral counterparts, indicating that there are processes unaccounted for in either the spectral or dynamical age estimates.
-
7.
This work demonstrates the various limitations of the spectral age calculations and the discrepancies between the spectral ages and dynamical ages. However, it also shows that the relative ages determined through spectral ageing are valuable in determining the dynamics and evolution of GRGs through the distribution of electron ages throughout the GRG.
Acknowledgements
We thank the anonymous referee for useful suggestions that improved this paper. KC’s research is supported by the South African Radio Astronomy Observatory (SARAO). JD, KC, MJ and IH acknowledge support from an Africa-Oxford Catalyst Collaboration Grant (AfOx-290), which has made this research possible. JD also acknowledges support from a UCT Research Development Grant. MJJ, IHW and CLH acknowledge generous support from the Hintze Family Charitable Foundation through the Oxford Hintze Centre for Astrophysical Surveys. MJJ and IH also acknowledge support from a UKRI Frontiers Research Grant [EP/X026639/1], which was selected by the ERC, and the UK Science and Technology Facilities Council [ST/S000488/1]. FXA acknowledges the support from the National Natural Science Foundation of China (12303016) and the Natural Science Foundation of Jiangsu Province (BK20242115). I.D. acknowledges funding by the European Union - NextGenerationEU, RRF M4C2 1.1, PRIN 2022JZJBHM: "AGN-sCAN: zooming-in on the AGN-galaxy connection since the cosmic noon" - CUP C53D23001120006. The MeerKAT telescope is operated by the South African Radio Astronomy Observatory, which is a facility of the National Research Foundation, an agency of the Department of Science and Innovation. We acknowledge the use of the ilifu cloud computing facility – www.ilifu.ac.za, a partnership between the University of Cape Town, the University of the Western Cape, Stellenbosch University, Sol Plaatje University and the Cape Peninsula University of Technology. The ilifu facility is supported by contributions from the Inter-University Institute for Data Intensive Astronomy (IDIA – a partnership between the University of Cape Town, the University of Pretoria and the University of the Western Cape), the Computational Biology division at UCT and the Data Intensive Research Initiative of South Africa (DIRISA). This work made use of the CARTA (Cube Analysis and Rendering Tool for Astronomy) software (DOI 10.5281/zenodo.3377984 – https://cartavis.github.io). Funding for SDSS-III has been provided by the Alfred P. Sloan Foundation, the Participating Institutions, the National Science Foundation, and the U.S. Department of Energy Office of Science. The SDSS-III web site is http://www.sdss3.org/.SDSS-III is managed by the Astrophysical Research Consortium for the Participating Institutions of the SDSS-III Collaboration including the University of Arizona, the Brazilian Participation Group, Brookhaven National Laboratory, Carnegie Mellon University, University of Florida, the French Participation Group, the German Participation Group, Harvard University, the Instituto de Astrofisica de Canarias, the Michigan State/Notre Dame/JINA Participation Group, Johns Hopkins University, Lawrence Berkeley National Laboratory, Max Planck Institute for Astrophysics, Max Planck Institute for Extraterrestrial Physics, New Mexico State University, New York University, Ohio State University, Pennsylvania State University, University of Portsmouth, Princeton University, the Spanish Participation Group, University of Tokyo, University of Utah, Vanderbilt University, University of Virginia, University of Washington, and Yale University. This work is based on the research supported in part by the National Research Foundation of South Africa (Grant Number 151060).The Hyper Suprime-Cam (HSC) collaboration includes the astronomical communities of Japan and Taiwan, and Princeton University. The HSC instrumentation and software were developed by the National Astronomical Observatory of Japan (NAOJ), the Kavli Institute for the Physics and Mathematics of the Universe (Kavli IPMU), the University of Tokyo, the High Energy Accelerator Research Organization (KEK), the Academia Sinica Institute for Astronomy and Astrophysics in Taiwan (ASIAA), and Princeton University. Funding was contributed by the FIRST program from Japanese Cabinet Office, the Ministry of Education, Culture, Sports, Science and Technology (MEXT), the Japan Society for the Promotion of Science (JSPS), Japan Science and Technology Agency (JST), the Toray Science Foundation, NAOJ, Kavli IPMU, KEK, ASIAA, and Princeton University.
Data Availability
The data underlying this article was accessed from the South African Radio Astronomy Observatory (SARAO; www.sarao.ac.za). Upon publication, the radio images from MIGHTEE DR1 will be accessible through: https://doi.org/10.48479/7msw-r692. The MeerKAT UHF-COSMOS fits image cutouts generated in this research will be shared upon reasonable request. Please contact the PI of the data (J. Delhaize; drjdelhaize@gmail.com). The raw MeerKAT visibilities for which any proprietary period has expired can be obtained from the SARAO archive at https://archive.sarao.ac.za .
References
- Adelman-McCarthy et al. (2008) Adelman-McCarthy J. K., et al., 2008, The Astrophysical Journal Supplement Series, 175, 297
- Aihara et al. (2018) Aihara H., et al., 2018, PASJ, 70, S8
- Albareti et al. (2017) Albareti F. D., et al., 2017, ApJS, 233, 25
- Arnaud et al. (2010) Arnaud M., Pratt G. W., Piffaretti R., Böhringer H., Croston J. H., Pointecouteau E., 2010, A&A, 517, A92
- Beck & Krause (2005) Beck R., Krause M., 2005, Astronomische Nachrichten, 326, 414
- Bell (1978) Bell A. R., 1978, MNRAS, 182, 147
- Blundell & Rawlings (2000) Blundell K. M., Rawlings S., 2000, AJ, 119, 1111
- Blundell et al. (1999) Blundell K. M., Rawlings S., Willott C. J., 1999, AJ, 117, 677
- Bower et al. (2006) Bower R. G., Benson A. J., Malbon R., Helly J. C., Frenk C. S., Baugh C. M., Cole S., Lacey C. G., 2006, MNRAS, 370, 645
- Burns (1990) Burns J. O., 1990, AJ, 99, 14
- Carilli et al. (1991) Carilli C., Perley R., Dreher J., Leahy J., 1991, Astrophysical Journal, Part 1 (ISSN 0004-637X), vol. 383, Dec. 20, 1991, p. 554-573., 383, 554
- Croston et al. (2005) Croston J. H., Hardcastle M. J., Harris D. E., Belsole E., Birkinshaw M., Worrall D. M., 2005, ApJ, 626, 733
- Croton et al. (2006) Croton D. J., et al., 2006, MNRAS, 365, 11
- Dabhade et al. (2020) Dabhade P., et al., 2020, A&A, 642, A153
- Dabhade et al. (2023) Dabhade P., Saikia D. J., Mahato M., 2023, Journal of Astrophysics and Astronomy, 44, 13
- Delhaize et al. (2021) Delhaize J., et al., 2021, MNRAS, 501, 3833
- Enßlin & Gopal-Krishna (2001) Enßlin T. A., Gopal-Krishna 2001, A&A, 366, 26
- Fabian (2012) Fabian A. C., 2012, ARA&A, 50, 455
- Fanaroff & Riley (1974) Fanaroff B. L., Riley J. M., 1974, MNRAS, 167, 31P
- Giacintucci et al. (2008) Giacintucci S., et al., 2008, ApJ, 682, 186
- Gopal-Krishna et al. (1989) Gopal-Krishna Wiita P., Saripalli L., 1989, Monthly Notices of the Royal Astronomical Society, 239, 173
- Hale et al. (2024) Hale C. L., et al., 2024, arXiv e-prints, p. arXiv:2411.04958
- Hardcastle (2018) Hardcastle M. J., 2018, MNRAS, 475, 2768
- Hardcastle et al. (1998) Hardcastle M. J., Birkinshaw M., Worrall D. M., 1998, MNRAS, 294, 615
- Hardcastle et al. (2019) Hardcastle M. J., et al., 2019, A&A, 622, A12
- Hardcastle et al. (2023) Hardcastle M. J., et al., 2023, A&A, 678, A151
- Harwood et al. (2013) Harwood J. J., Hardcastle M. J., Croston J. H., Goodger J. L., 2013, Monthly Notices of the Royal Astronomical Society, 435, 3353
- Harwood et al. (2015) Harwood J. J., Hardcastle M. J., Croston J. H., 2015, Monthly Notices of the Royal Astronomical Society, 454, 3403
- Heckman & Best (2014) Heckman T. M., Best P. N., 2014, ARA&A, 52, 589
- Heywood (2020) Heywood I., 2020, Astrophysics Source Code Library, pp ascl–2009
- Heywood et al. (2022) Heywood I., et al., 2022, MNRAS, 509, 2150
- Ineson et al. (2015) Ineson J., Croston J. H., Hardcastle M. J., Kraft R. P., Evans D. A., Jarvis M., 2015, MNRAS, 453, 2682
- Ineson et al. (2017) Ineson J., Croston J. H., Hardcastle M. J., Mingo B., 2017, MNRAS, 467, 1586
- Jaffe & Perola (1973) Jaffe W. J., Perola G. C., 1973, A&A, 26, 423
- Jarvis et al. (2016) Jarvis M., et al., 2016, in MeerKAT Science: On the Pathway to the SKA. p. 6 (arXiv:1709.01901), doi:10.22323/1.277.0006
- Jonas & MeerKAT Team (2016) Jonas J., MeerKAT Team 2016, in MeerKAT Science: On the Pathway to the SKA. p. 1, doi:10.22323/1.277.0001
- Kempner & Sarazin (2001) Kempner J. C., Sarazin C. L., 2001, ApJ, 548, 639
- Knobel et al. (2012) Knobel C., et al., 2012, ApJ, 753, 121
- Komberg & Pashchenko (2009) Komberg B. V., Pashchenko I. N., 2009, Astronomy Reports, 53, 1086
- Laing et al. (2008) Laing R. A., Bridle A. H., Parma P., Feretti L., Giovannini G., Murgia M., Perley R. A., 2008, MNRAS, 386, 657
- Mack et al. (1998) Mack K. H., Klein U., O’Dea C. P., Willis A. G., Saripalli L., 1998, A&A, 329, 431
- Mahatma et al. (2019) Mahatma V. H., Hardcastle M. J., Croston J. H., Harwood J., Ineson J., Moldon J., 2019, Monthly Notices of the Royal Astronomical Society, 491, 5015
- Mahatma et al. (2020) Mahatma V. H., Hardcastle M. J., Croston J. H., Harwood J., Ineson J., Moldon J., 2020, MNRAS, 491, 5015
- Malarecki et al. (2013) Malarecki J. M., Staveley-Smith L., Saripalli L., Subrahmanyan R., Jones D. H., Duffy A. R., Rioja M., 2013, MNRAS, 432, 200
- Malarecki et al. (2015) Malarecki J. M., Jones D. H., Saripalli L., Staveley-Smith L., Subrahmanyan R., 2015, MNRAS, 449, 955
- Mohan & Rafferty (2015) Mohan N., Rafferty D., 2015, PyBDSF: Python Blob Detection and Source Finder, Astrophysics Source Code Library, record ascl:1502.007 (ascl:1502.007)
- Mostert et al. (2024) Mostert R. I. J., et al., 2024, arXiv e-prints, p. arXiv:2405.00232
- Oei et al. (2023) Oei M. S., et al., 2023, Astronomy & Astrophysics, 672, A163
- Pandge et al. (2022) Pandge M. B., Kale R., Dabhade P., Mahato M., Raychaudhury S., 2022, MNRAS, 509, 1837
- Pinjarkar et al. (2023) Pinjarkar S., Hardcastle M. J., Harwood J. J., Lal D. V., Hatfield P. W., Jarvis M. J., Randriamanakoto Z., Whittam I. H., 2023, MNRAS, 523, 620
- Planck Collaboration et al. (2016) Planck Collaboration et al., 2016, A&A, 594, A13
- Prescott et al. (2018) Prescott M., et al., 2018, Monthly Notices of the Royal Astronomical Society, 480, 707
- Reiprich et al. (2013) Reiprich T. H., Basu K., Ettori S., Israel H., Lovisari L., Molendi S., Pointecouteau E., Roncarelli M., 2013, Space Sci. Rev., 177, 195
- Safouris et al. (2008) Safouris V., Subrahmanyan R., Bicknell G. V., Saripalli L., 2008, MNRAS, 385, 2117
- Safouris et al. (2009) Safouris V., Subrahmanyan R., Bicknell G., Saripalli L., 2009, Monthly Notices of the Royal Astronomical Society, 393, 2
- Schneider et al. (1990) Schneider S. E., Thuan T. X., Magri C., Wadiak J. E., 1990, ApJS, 72, 245
- Schoenmakers et al. (2000) Schoenmakers A., Mack K.-H., De Bruyn A., Röttgering H., Klein U., Van Der Laan H., 2000, Astronomy and Astrophysics Supplement Series, 146, 293
- Shimwell et al. (2022) Shimwell T., et al., 2022, Astronomy & astrophysics, 659, A1
- Simonte et al. (2022) Simonte M., Andernach H., Brüggen M., Schwarz D. J., Prandoni I., Willis A. G., 2022, MNRAS, 515, 2032
- Simonte et al. (2024) Simonte M., Andernach H., Brueggen M., Miley G. K., Barthel P., 2024, arXiv e-prints, p. arXiv:2403.08037
- Smolčić et al. (2017) Smolčić V., et al., 2017, A&A, 602, A1
- Subrahmanyan et al. (1996) Subrahmanyan R., Saripalli L., Hunstead R. W., 1996, Monthly Notices of the Royal Astronomical Society, 279, 257
- Tang et al. (2020) Tang H., Scaife A. M. M., Wong O. I., Kapińska A. D., Rudnick L., Shabala S. S., Seymour N., Norris R. P., 2020, MNRAS, 499, 68
- Tribble (1993) Tribble P. C., 1993, MNRAS, 261, 57
- Turner et al. (2018) Turner R. J., Rogers J. G., Shabala S. S., Krause M. G. H., 2018, MNRAS, 473, 4179
- Vardoulaki et al. (2015) Vardoulaki E., et al., 2015, A&A, 574, A4
- Vardoulaki et al. (2019) Vardoulaki E., et al., 2019, A&A, 627, A142
- Wen et al. (2012) Wen Z., Han J., Liu F., 2012, VizieR Online Data Catalog, pp J–ApJS
- Willis et al. (1974) Willis A. G., Strom R. G., Wilson A. S., 1974, Nature, 250, 625